Abstract
In response to the increasing consumer interest in the health benefits of plant-based foods, in this study, fuzzy logic modeling (FLM) was used to optimize the lactic fermentation process of several buckwheat (Fagopyrum esculentum)-based substrates (B-bSs), which were bio-prospected for the development of pseudocereal-based fermented foodstuffs. The experimental methodology involved obtaining B-bSs, either green or roasted, under various milling conditions and subjecting them to two different types of thermal treatment. This experimental design allowed us to obtain a set of experimental data, based on which a fuzzy system was developed and calibrated. The main physicochemical characteristics (pH, total titratable acidity, dynamic viscosity, and color) and sensory attributes (appearance, color, aroma, taste, texture or mouthfeel, and overall acceptability) of B-bSs were evaluated. The fuzzy logic approach proved useful for monitoring the evolution of lactic fermentation and for the rapid and accurate identification of situations that require technological interventions, acting as a reliable tool for the ongoing optimization of fermentation processes. Our study’s results showed that the optimal technological variants identified using FLM corresponded to green buckwheat milled with a 0.12 mm gap disk and a hammer mill and subjected to ultrasonic water bath treatment. The hedonic descriptive sensory evaluation also validated this conclusion.
1. Introduction
The increasing global demand for healthy, affordable, and sustainable food commodities, in line with the Sustainable Development Goals (SDGs), has generated significant interest in plant-based food products, which sometimes serve as substitutes for conventional animal-origin formulations. Following the same trend, pseudocereals may provide a valuable feedstock within a potential niche market, becoming novel and viable alternatives to traditional cereal-based foodstuffs or animal-origin analogs.
One example of a pseudocereal is buckwheat, which is considered an ancient crop. It is primarily grown and consumed in Asian regions, with Russia and China being the leading producers [1,2]. Buckwheat is recognized for its high nutritional value and health benefits due to its balanced chemical composition, which appears more favorable even than that of other cereals, such as wheat, maize, or rice, regarding unsaturated fatty acid content, protein content, and amino acid profile; it is also rich in essential amino acids and bioactive peptides [1,3,4,5,6,7,8]. Besides having an increased dietary fiber content [9], buckwheat grain contains bioactive compounds such as flavonoids (e.g., rutin), polyphenols, phenolic acids, and other bioactive compounds (e.g., phytosterols, phytohormones, and tannins), which contribute to its antioxidant, anti-inflammatory, antidiabetic, and anti-cancerous properties [4,6,10,11,12,13,14,15,16,17,18]. Buckwheat-based products are good sources of minerals and vitamins (thiamine, riboflavin, niacinamide, pantothenic acid, pyridoxine, folate, ascorbic acid, tocopherols, and carotenoids), making them a nutritious option for health-conscious consumers [2,16,19,20,21]. Although buckwheat proteins are considered gluten-free [2], some globulin fractions of buckwheat have been reported as potential sources of allergens, but these can be partially mitigated by food processing [22].
Thus, buckwheat is considered a plant-based ingredient for tailoring functional foods, mainly cereal-based products and dairy analogs. For instance, buckwheat has found applications in sourdough-based bread, gluten-free bread, and other biofortified bakery products, as well as in pasta, noodles, cakes, biscuits, and other farinaceous products and fermented beverages (including beer, wine, vinegar, and flavored-non-alcoholic drinks), as well as in plant-based analogs of milk or other dairy products [2,23,24,25,26,27,28,29,30,31].
As a non-conventional ingredient, buckwheat is used in food processing either to (i) replace other raw materials, such as wheat and rye flours in gluten-free bread and functional baked products, and as brewery adjuncts in specialty beers, or (ii) serve as a substrate for microbial fermentations (e.g., lactic acid fermentation) in sourdough-based bakery foodstuffs, fermented beverages, or other food products with predictable functional or health effects [3,5,31,32,33,34].
Still, as emphasized by Graziano et al. (2022), the use of buckwheat as a raw material in food processing is technologically limited by certain factors related to its chemical composition, resulting in noticeable consequences for the sensory properties of buckwheat-based foodstuffs, such as bread hardness or a bitter taste of food [35].
Buckwheat has been shown to be a suitable fermentable source of oligosaccharides and sugars under various fermentation conditions [36]. Various studies have primarily focused on the lactic acid fermentation of the substrate provided by buckwheat grain, concluding that this type of fermentation improves the nutritional profile and bioavailability of buckwheat-based products, enhances their overall digestibility, partially by decreasing the amount of antinutritional factors such as phytates and saponins, and additionally provides probiotics with health benefits [6,27,28,37,38,39]. So, besides their functional properties, it seems that the sensory characteristics of fermented pseudocereal-based products, especially bitterness in the case of fermented buckwheat-based foods, can be improved, to a certain extent, through lactic acid fermentation. Several studies [27,40] have shown that Lactobacillus plantarum, Lactobacillus brevis, or Lactobacillus delbrueckii are the dominant species in buckwheat lactic fermentation, while others have considered different species for fermented buckwheat-based products, likely depending on the food assortment and processing method applied. As mentioned, fermentation significantly enhances the essential nutritional properties of buckwheat-based products, offering potential functional and health benefits. However, some research gaps have been identified, as understanding of the fermentation process is still limited [38]. Consequently, controlling and optimizing the fermentation process is crucial for achieving the best results regarding food quality and safety in fermented buckwheat-based foods.
Integrating classical analysis methods with advanced fuzzy modeling techniques has allowed for a robust and reproducible approach to the fermentation process, used in the food industry, but also in other biotechnological fields [41]. The application of fuzzy logic allows for the successful management of the uncertainties inherent in biological processes, optimizing critical operating parameter values. Similar examples have been reported in the literature, such as the automatic control of substrate feeding in fed-batch processes [42,43] or the application of fuzzy systems to regulate dissolved oxygen in industrial fermentation [44].
In this study, we aimed to develop a buckwheat-based product for use as a plant-based fermented dairy alternative by utilizing a fuzzy logic-based tool to optimize the lactic fermentation of buckwheat as part of the laboratory-scale processing of pseudocereals. The results were confirmed by several physicochemical characteristics (pH, total titratable acidity, dynamic viscosity, and color) and the main sensory attributes (appearance, color, aroma, taste, texture or mouthfeel, and overall acceptability) of the final product.
2. Materials and Methods
2.1. Materials
2.1.1. Buckwheat (Fagopyrum esculentum)
For this experiment, we used buckwheat (Fagopyrum esculentum) grain (country of origin: Poland) bought from a store in Sibiu, Romania, from SanoVita Ltd., Vâlcea, Romania, in two variants: whole green (raw/crude/uncooked) grain, abbreviated as G-BW in the text, and whole roasted grain, abbreviated as R-BW.
The main grain specifications are as follows: for G-BW, moisture—13.2% (w/w); proteins—13.2% (w/w); lipids—3.4% (w/w); total carbohydrates—70.6% (w/w); total fibers—7% (w/w); for R-BW, moisture—11.8% (w/w); proteins—12.4% (w/w); lipids—2.6% (w/w); total carbohydrates—71.5% (w/w); total fibers—3.6% (w/w). The ASRO [45] and AACC [46] standard methods were used for quality assessment.
These two kinds of buckwheat present distinct sensory differences, particularly in terms of aroma, taste, texture, and appearance. G-BW has a mild, slightly grassy aroma with subtle nutty undertones and a delicate, sweet taste. In contrast, R-BW provides a distinct, nutty, and deeply toasted flavor, which is even slightly bitter, as the roasting process intensifies its nutty taste. Figure 1 illustrates the appearance of the two types of buckwheat employed in the experiment.
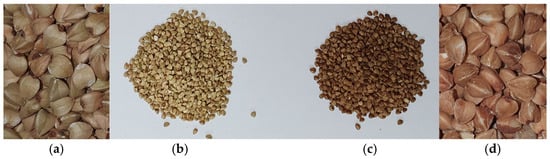
Figure 1.
Appearance of buckwheat (Fagopyrum esculentum) types used in this study: (a) close-up of G-BW grains; (b) small pile of G-BW grains; (c) small pile of R-BW grains; (d) close-up of R-BW grains.
2.1.2. Lactic Acid Bacteria (LAB) Starter Culture
Lactic acid fermentation of buckwheat-based substrate was performed using Lactoferm® Bifidus Ferment, a dry yogurt bifidus LAB starter culture (BY-LAB) from Brouwland, Belgium, which contained the Streptococcus thermophilus, Lactobaccilus acidophilus, and Bifidobacterium infantis strains.
2.1.3. Water
Single-distilled water, obtained using a standard laboratory water distillation unit manufactured by Boeco, Germany, was employed to mitigate any potential impact of water quality on the experimental outcomes. The water source was the municipal drinking water network of Sibiu, Romania, with a maximum total hardness of 5° dH.
2.2. Methods
2.2.1. Buckwheat-Based Substrate (B-bS): Obtaining and Characterizing
The process of obtaining the B-bS for fermentation involved two main steps: first, obtaining the grist through grinding and sieving, and second, mashing through hydrothermal treatment.
- -
- The G-BW and R-BW whole grains were milled using two types of equipment: a Perten Laboratory Hammer Mill, type 120, from Perten Instruments AB, Huddinge, Sweden, manufactured in Finland, and a Universal Laboratory Disc Mill, type DLFU, from Bühler AG, Switzerland; the latter was set to a disk gap of 0.12 mm and 0.2 mm.
As a result of milling, three types of ground products were obtained, as shown in Figure 2. It was noted that G-BW had a relatively tender structure that facilitated milling into flour, while R-BW presented a harder, crispier texture due to the roasting process, making the groats more brittle and less pliable than raw buckwheat.
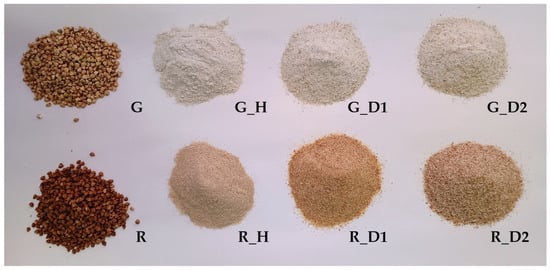
Figure 2.
Images of ground products obtained through three milling variants using the Perten Laboratory Mill (PLM), type 120, and the Universal Laboratory Disc Mill (ULDM), type DLFU. The codes in the figure represent the following: G/R—green/roasted buckwheat; G/R_H—whole-ground green/roasted buckwheat grist obtained with PLM; G/R_D1—whole-ground green/roasted buckwheat grist obtained with ULDM set to a 0.12 mm disk gap; G/R_D2—whole-ground green/roasted buckwheat grist obtained with ULDM set to a 0.20 mm disk gap.
The grist samples were granulometrically characterized using an MLUA Laboratory Plansifter, type BR, from Bühler AG, Uzwil, Switzerland, set to 300 rpm with a separation duration of 5 min.
- -
- Whole-ground green and roasted buckwheat grist was processed separately, mixed with single-distilled water in a weight ratio of 1:11, and subjected to different thermal treatment methods: in an ultrasonic water bath (Elmasonic S 60 H, from Elma Schmidbauer GmbH, Singen, Germany) at an ultrasonic frequency of 37 kHz, under periodic (at 5 min) moderate agitation, and in the 1-CUBE Mashing Bath (Type R4) from 1-Cube Company, based in Havlíčkův Brod, Czech Republic. For the mashing equipment, a homogenization speed of 100 rpm and the Thermostat program was selected. With each heating device, the samples were heated to 80 °C and maintained at this temperature for 10 min.
- -
- After heat treatment, the samples were adjusted to their original dilution, cooled to 37 °C, and inoculated with 1% (w/w) BY-LAB starter culture for lactic acid fermentation. Subsequently, after 19 h, the samples were stored at 6 °C for maturation, and monitored until a total of 168 h had been reached.
Based on the steps outlined above and in accordance with the proposed experimental design, the experimental samples are defined and coded in Table 1.

Table 1.
Significance of the code samples corresponding to the experimental design.
2.2.2. Physical–Chemical and Sensorial Analysis of B-bSs
The B-bSs were summary characterized by determining their main physicochemical and sensory characteristics; these included the following:
- -
- Moisture content of buckwheat (H, % (w/w)): Measured at 130 °C using a Moisture Analyzer, Type ML-50 (A&D Instruments, Ltd., Oxon, UK).
- -
- Water absorption index (WAI, ) of buckwheat grist: Determined through gravimetric analysis, to evaluate the hydration capacity of buckwheat grist at 80 °C, both with and without sonication. The analysis involved measuring the weight of water absorbed per unit of dry matter (d.m.) in the grist sample, expressed as g water/g grist sample (d.m.). The operating procedure for measuring the WAI consists of weighing 2.5 g of buckwheat grist sample (WS, g) into a pre-weighed 50 mL centrifuge tube (WCT, g), adding 30 mL of distilled water (gravimetrically measured) to the centrifuge tube, and mixing thoroughly. Next, the sample was heated to 80 °C and maintained at this temperature for 10 min, taking a total of 30 min, stirring periodically to facilitate water absorption. After that, the hydrated sample was centrifuged at 20 °C at 3000 rpm for 10 min; then, the supernatant was discarded without disturbing the settled sediment, which was then weighed (W, g) using an analytical balance. The WAI was calculated using the following formula:
- -
- pH was determined at 20 °C using an Orion 2 STAR (Thermo Electron Corporation, Ltd./Thermo Fisher Scientific Inc., Waltham, MA, USA) pH-meter with a calibration of 2 points.
- -
- Total titratable acidity (TTA, % (w/w) of lactic acid) was measured by titrating 10 g of homogenized sample with 25 mL of distilled water using a 0.1 N sodium hydroxide (NaOH) solution in the presence of 0.4% (w/v) bromothymol blue (neutral) as an indicator. The TTA is expressed as g of lactic acid per 100 g of sample (% w/w of lactic acid).
- -
- Dynamic viscosity (η, cP) was determined at 20 °C using a Yield Stress Rheometer YR-1 Brookfield (Brookfield Engineering Labs., Inc., Middleboro, MA, USA) with an S72 spindle at 100 rpm. Temperature was controlled using a recirculating water bath (Brookfield TC-502, Brookfield Engineering Labs., Inc., Middleboro, MA, USA).
- -
- Color (E*) was determined using a HunterLab colorimeter from Hunter Associates Laboratory, Reston, Virginia, USA (EasyMatch® QC version 4.99 software), with an Agera® sensor AGR00720 in the CIELab (L*, a*, b*) color scale with D65 diffuse illumination and a 10° colorimeter observer. It was quantitatively determined using its Total Chroma (E*) value and Browning Index (BI), which were calculated with the following equations:
L* is lightness, ranging from 0 (absolute black) to 100 (absolute white), measuring the amount of light reflected from a surface, independent of color; it specifically refers to the perceived brightness of a color.
a* is the position of a color on the red–green axis in the CIELab color space.
b* is the position of a color on the yellow–blue axis in the CIELab color space.
Sensory evaluation was carried out by seven expert assessors, formally trained in the methodology, and who regularly consume a variety of vegetable-based fermented foods, especially those produced from cereals. A 6-point hedonic scale was used for sensory evaluation through a descriptive test. The scale ratings were defined as follows: 1—Strongly dislike; 2—Dislike; 3—Slightly dislike; 4—Neutral (neither like nor dislike); 5—Slightly like; 6—Like; 7—Strongly like. The sensory evaluation was conducted by a trained panel consisting of four women and three men, aged 25 to 45 years. To prevent residual taste interference, panelists consumed unsalted white bread crumbs between sample assessments, followed by thorough mouth rinsing with drinking water maintained at room temperature.
The evaluated sensory attributes included appearance (e.g., uniformity of the product matrix; phase separation; surface characteristics), color (e.g., expected; stable; intensity; and uniformity), aroma (e.g., characteristic aromatic profile; off-odors), taste (e.g., balance of fundamental taste attributes; perception of fermentation-derived compounds; aftertaste), texture (mouthfeel) (e.g., viscosity and structural integrity; perceived smoothness or presence of particulate matter (e.g., grittiness, chalkiness)), and overall acceptability (e.g., consumer preference; willingness to consume; sensory balance in relation to expected standards for fermented pseudocereal-based products). An overall score of 4.5 or higher indicated product acceptance, whereas scores below 3.5 signified rejection, as a score of 4 points corresponds to a neutral rating on the hedonic scale.
2.2.3. Data Processing and Implementation
Statistical Analysis
Statistical analysis was performed using MATLAB® software (version R2025a, MathWorks Inc., Natick, MA, USA). To assess the significance of the differences between the experimental groups, unifactorial analysis of variance (ANOVA1) was applied, which is suitable for comparing the means of more than two independent groups. The data obtained were expressed as the arithmetic mean ± standard deviation (mean ± SD). ANOVA1 was applied for each substrate type used (green or roasted buckwheat), milling type (hammer mill or disk mill with a gap of 0.12 and 0.20 mm) as well as thermal treatment type (US or MB) of the buckwheat-based substrate. Statistically significant differences were considered at p < 0.01 and p < 0.05, and the analysis was performed in MATLAB using the anova1 function (performs one-way ANOVA for sample data y and returns the p-value) for unifactorial analysis and multcompare (multiple comparison test that returns a matrix c of the pairwise comparison results from a multiple comparison test using the information contained in the stats structure) for post hoc tests, applied to structured datasets in a table format. For visual interpretation, boxplots and bar charts with standard errors were generated.
Data Processing and Implementation of FLM in MATLAB
In this study, the fuzzy system was implemented in MATLAB 2025a to optimize the variables that characterize the fermentation process because, in the literature, fuzzy control demonstrated increased efficiency in managing the uncertainties and non-linearities of fermentation processes in the food and biotechnology industries [41,47,48]. Thus, an inference model based on fuzzy logic (FLM) was developed in MATLAB. The Mamdani method was selected due to its interpretability and ability to integrate the knowledge of experts, an aspect highlighted in the literature [47,48].
Initially, FLM was defined as a MamdFIS-type object, called “FermentationLacticSystem”. To combine the information from the input variables, fuzzy operation methods were established. In this case, the AND operation was implemented using the minimum function and the OR operation using the maximum function.
The FLM included four input variables, selected according to the experimental intervals, and these variables were added to the system using the addInput function. The output variable, named OptimizationScore, was defined in the range [0, 1], where a higher value indicated better optimization of the fermentation process. In order to model the continuous behavior of the variables, triangular (trimf) and trapezoidal (trapmf) membership functions were defined. The membership functions for the variables—acidity, viscosity, and fermentation time—were defined similarly, with extensive overlaps to fully cover the ranges of interest.
An extensive fuzzy rule base was developed to reflect the relationships between the input variables and the output variable. Each rule had the form “IF x1 is A AND x2 is B AND … THEN and this is C”. The rules were encoded in an array, where each column corresponded to an index of the belonging function. These rules allowed the FLM to correctly interpret the inputs to produce optimal output. After defining all the variables, belonging functions, and rules, the FLM was saved to a file for later use.
This step was important as it ensured the reproducibility and consistency of subsequent evaluations, allowing the exact configuration of the FLM to be reloaded for experimental data analysis, according to [48]. All experimental data were initially recorded in an Excel file, then saved in CSV format. This operation organized the data into a table, where each column corresponded to a variable (e.g., time, pH, acidity, viscosity) or a descriptive label (e.g., sample, code sample, buckwheat type). The FLM was loaded from the “fermentation_system.fis” file, which is a standard MATLAB file format that stores the complete fuzzy inference system structure, including input/output variables, membership functions, and rules necessary for the model’s operation.
FLM Upload and Data Verification
The names of the input and output variables were extracted from the fis object. To ensure compatibility, the names were converted to string arrays and compared with the variable names in the imported table. Each sample was evaluated by calculating an OptimizationScore as a weighted sum of the experimental values.
where xi is the values for pH, acidity, viscosity, and time, and wi is the weights (e.g., [1, 1, 1, 1]). In MATLAB, this is calculated as follows:
To standardize the results, the scores were normalized in the range [0, 1] using the following relationship:
For each sample, the input vector was extracted and the FLM evaluated by the evalfis function, thus generating the PredictedScore. These predicted scores were added to the results table to be compared with the previously calculated normalized scores. FLM performance was assessed by calculating the mean squares error (RMSE) [46]:
Sensitivity Analysis of Model Variables
To determine the influence of each variable on the OptimizationScore, a sensitivity analysis was performed. The average sample values for each size were used to generate a set of test values between the minimum and maximum using the linspace function. For each test value, the FLM was evaluated, and absolute differences between scores were calculated to determine the mean impact and standard deviation [42].
Visualization and Analysis
The MATLAB script generated a series of graphs for interpreting the results, including a visualization of belonging functions for input variables, distribution of scores through boxplots, clustering analysis through Principal Component Analysis (PCA), and heatmaps to explore complex relationships between combinations of three variables. The optimal and non-optimal samples were also compared based on a defined threshold, so that the samples with predicted scores above the set threshold were considered optimal, and sorted in descending order according to the normalized score. Then, the best sample was displayed on the console and saved in a CSV file for later reference [49].
Integration of Classical Methods with Advanced Fuzzy Control Techniques
The implementation in MATLAB was made so that, in addition to the basic functionality, it also included debug lines in the control scripts for real-time execution monitoring. These debug lines allowed for step-by-step tracking of input values (e.g., DO error and error variation) and control actions (feed command), thus ensuring the transparency and reproducibility of the process [50].
Reproducibility and Validation of Experiments
The entire system was designed to ensure a high reproducibility of the experimental procedure. After saving the fuzzy configuration in the “fermentation_system.fis” file, the system can be reloaded and applied in various simulation scenarios without major modifications, allowing for an independent validation of the results. The experimental data, initially imported from Excel files and organized into tables, were automatically processed and analyzed in MATLAB, using scripts that include debug lines to verify the correctness of each step of the evaluation and control [48].
3. Results and Discussion
3.1. Data Processing and Implementation
The experimental results obtained from the lactic fermentation of the buckwheat-based substrates considered in the present study and used in the FLM are presented in Table A1, Appendix A.1.
3.1.1. Distribution of Classified Samples into Optimal Categories
Using the FLM to evaluate the studied lactic fermentation process allowed us to classify the samples into three functional classes (Non-Optimal, Sub-Optimal, and Optimal) whose key characteristics are described in Table 2.
Table 2.
Classification of samples and their distribution into optimal classes.
Table 3 indicates the numerical distribution of the samples. Based on the data shown, it is possible to compare the distribution of the sample classes between the FLM-predicted and experimentally determined values, highlighting the fact that optimized samples are highly accurate.
Table 3.
Numerical distribution of samples across predicted and real values.
The classification results indicate that 10 samples are optimal, compared to 56 in the actual classification. This difference reflects the rigor of the criteria implemented in the FLM and suggests a performance-oriented system decision, in which only exceptional fermentation results are recognized as optimal.
The analysis of the comparative distribution between the predicted and real classes raised an essential question: what are the determining variables that influence this classification and what is the relative importance of each of them in the FLM’s decision-making process? To answer this question and to understand the mechanisms underlying the classification process, an analysis of the sensitivity of the model variables was necessary. The results are presented below.
3.1.2. Sensitivity Analysis of Model Variables
Each variable’s contribution to the management of the fermentation process was systematically evaluated via a sensitivity analysis, which quantified the influence of variations in pH, acidity, viscosity and fermentation time. This analysis highlighted a hierarchy of variables according to their degree of influence on the dynamics of the system, providing essential information for the interpretation of the previous classification and for the optimal control of the fermentation process.
The results of the sensitivity analysis, presented in Table 4, indicate that time is a determining factor, with the highest mean impact score (0.0947) and the highest variability (standard deviation of 0.0971). The distribution previously observed within the classification in Table 2 is also partially explained. Optimal performance can only be achieved in time windows established by the rules of fuzzy logic, with deviations from these time intervals leading to samples being classified into lower categories. As for pH, it occupies the second most important position (average impact of 0.0741), confirming its positive role in evaluating the fermentation process and in determining the final quality of the product.
Table 4.
Evaluation of the sensitivity of the variables used in the FLM.
Thus, Table 4 emphasizes the importance of strictly controlling the fermentation time and pH, critical variables that significantly influence the efficiency and quality of fermentation. Although acidity and viscosity have less impact, they still contribute to a more complex characterization of the process.
Having identified the significant importance of fermentation time and pH in determining the performance of the studied process, the next step was to explore the multidimensional relationships between these parameters’ values and examine how they interact, with the aim of defining the dynamics of the fermentation process more precisely. In order to better understand and visualize the complex patterns hidden in the structure of the experimental data, PCA was applied, focusing on the relationship between the variables identified as the most influential.
3.1.3. PCA
By applying the PCA method to the data obtained with the FLM (for the variables: pH (PC1) and fermentation time (PC2)), the diagram in Figure 3 is obtained, highlighting the following aspects:
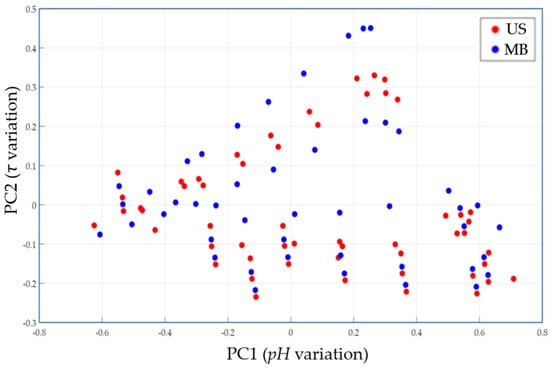
Figure 3.
PCA shows clustering depending on the type of heat treatment applied to buckwheat substrates.
- -
- PC1 (the horizontal axis) shows the pH of the substrate and reflects a wide range of variation in pH, which is mainly positively correlated with the level of acidification. Negative values on PC1 correspond to a low pH (advanced fermentation) and positive values indicate a higher pH (early stage of fermentation).
- -
- PC2 (the vertical axis) is related to the duration of the fermentation process. High values indicate a long fermentation time, while low values signal short fermentation times, corresponding to rapid fermentation.
In the graphic representation in Figure 3, each point reflects a pH value at a certain point in the fermentation process and for a specific type of heat treatment applied to the buckwheat substrates. More specifically, the red dots represent samples in which the US heat treatment method was used, and the blue dots correspond to the samples heated using MB.
Figure 3 shows that the frequency of red dots tends to be faster in the region with low pH (negative PC1), which denotes prompter acidification. Thus, the US heat treatment technique seems to accelerate the formation of lactic acid. The blue dots reach similar acidity values (low pH) but, on average, higher values of PC2, signaling longer fermentation times. This observation suggests a slower dynamic of the lactic fermentation process in the variant using the MB bath for heat treatment.
Therefore, the PCA allowed us to visualize the clusters formed according to the heat treatment method, highlighting that the US heat treatment accelerates the substrate acidification.
Although the PCA provided a clear picture of the dynamics of the fermentation process and the influence of the heat treatment method, it did not directly assess the accuracy of the FLM in predicting the relevant parameter values characterizing the lactic fermentation process. In this regard, in order to evaluate the performance and predictive capacity of the FLM, the next step consisted of the analysis of the distribution of errors, defined as the differences between the values predicted by the FLM and those determined experimentally. This analysis, correlated with examining the relationships between the monitored variables, provided an overview of the system’s performance, and identified potential pathways for optimization.
3.1.4. Error Distribution and Heatmap of Correlations of FLM Variables
Error Distribution
Figure 4 shows the distribution of the differences between the values predicted by the FLM and those measured experimentally. The figure provides essential information about the performance of the model applied to predict the parameter values that characterize the lactic fermentation process of buckwheat-based substrates. The graph suggests a relatively normal distribution of errors, with a slight positive skewness, which indicates a tendency of the system to overestimate some variables, such as pH and acidity, in certain cases.
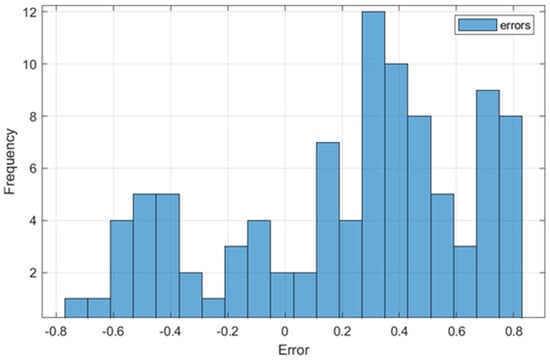
Figure 4.
Distribution of errors between FLM-predicted and real values.
Most errors are concentrated in the range of 0.2–0.6, with a maximum frequency of around 0.4. This behavior is consistent with the calculated RMSE value of 0.4923, indicating that the FLM is accurate enough for practical applications of monitoring and optimizing the lactic fermentation process performed in this study. However, the system may overestimate the predicted values in samples with high variability, such as those that were heat-treated using MB.
This distribution can be explained by the significant differences between the thermal processing methods used. Samples processed with US, characterized by smaller variations and compact clusters in PCA, contribute to lower errors in prediction, while samples processed with MB, associated with higher variability, negatively influence the accuracy of the system. The slight positive skewness suggests that adjustments to FLM variables or the use of an extensive dataset could reduce these errors and improve model performance.
Even in this context, the overall error distribution confirms the FLM’s robustness, making it suitable for monitoring and optimizing the analyzed lactic fermentation process and providing a solid basis for other practical applications, with the potential for improvement through further recalibration and optimization. Thus, through the analysis of the error distribution, it is found that the US heat treatment variant is preferable for optimizing the lactic fermentation process of buckwheat-based substrates.
FLM Variable Correlations
Figure 5 presents the Pearson correlation matrix for the four input variables of the fuzzy model: pH, fermentation time (τ), total titratable acidity (TTA), and dynamic viscosity (η). Thus, the fermentation time is moderately and positively correlated with TTA (r = 0.4625), confirming that acidic compounds accumulate progressively as the process advances. Also, the correlation between fermentation time and viscosity is weakly positive (r = 0.1020). So, the viscosity can reach high values relatively quickly if the colloidal structure is adequate, justifying the retention of both variables, and it is not strictly time-dependent.
Figure 5.
Pearson matrix of fuzzy membership degrees for fuzzy variables of buckwheat fermentation process (pH; τ—fermentation time; η—dynamic viscosity; TTA—total titratable acidity).
This indicates a normal evolution of the fermentation process, in which acidity increases proportionally with time, while structural changes influence the viscosity of the samples. Also, the correlation between acidity and viscosity (r = 0.6351) suggests that the accumulation of organic acids influences the array structure of the samples.
A strong negative correlation is observed between pH and TTA (r = −0.8704), confirming the typical dynamics of lactic fermentation, where a decrease in pH directly leads to an increase in acidity. Additionally, pH exhibits a moderate negative correlation with fermentation time (r = −0.5091), indicating a gradual acidification.
Having established the analytical framework of the fermentation process examined in this study, including the correlative relationships between variables with significant impact, we proceeded to examine how these variables manifest themselves differently depending on the type of substrate used, namely green or roasted buckwheat. Through this approach, we identified the optimal processing strategies tailored to each type of buckwheat, facilitating the precise adjustment of technological variables for effective fermentation.
The relationship between fuzzy variables or fuzzy sets (four input variables—pH, TTA, τ, and η—and the output—optimization score), visualizing the degree of membership or correlation between these sets in different dimensions (see also Table 2), could be represented in an LFM heatmap. In this case, the values are derived by converting the raw data variables into fuzzy membership functions, a necessary step for detecting redundancy before generating fuzzy rules. The coefficient distribution is consistent with the sensitivity analysis, where τ and pH have the highest weights, followed by TTA, and η has a low impact (see also Table 4). Consequently, the sets “short time + high pH + low TTA” receive low scores, while the combinations “31–67 h + pH < 4.0 + TTA > 0.18 % w/w + η > 400 cP” are favored by fuzzy rules. The heatmap highlights the interdependent dynamics of the monitored variables, with fermentation time being a key factor in determining biochemical and rheological changes during the fermentation process. In addition, the results indicate that the relationships between the trinomial variables pH, acidity, and viscosity can be used to optimize processing conditions and to monitor the lactic fermentation of the analyzed buckwheat mashes.
3.1.5. Comparative Fermentation Analysis of the Two Types of Buckwheat
A comparative analysis of the fermentation dynamics of green or roasted buckwheat-based substrates can be conducted based on the data presented in Appendix A.1, Table A1, correlated to the FLM results. It highlighted some essential differences:
- -
- The G_H_US, G_H_MB, G_D1_US, G_D1_MB, G_D2_US, and G_D2_MB samples demonstrated accelerated fermentation dynamics, with rapid decreases in pH and, respectively, significant increases in acidity. Among these, the G_D1_US samples (milled with a disk mill adjusted to 0.12 mm and processed with US) were highlighted, for which normalized scores of over 0.80 were obtained. Thus, it can be stated that relatively fine milling and heat treatment with US are more effective.
- -
- The R_H_US, R_H_MB, R_D1_US, R_D1_MB, R_D2_US, and R_D2_MB samples showed a weaker fermentation process illustrated by pH values above 4.0 and lower acidity. This finding can be explained by the fact that the heat treatment during the buckwheat roasting process negatively influences its enzymatic activity and fermentation potential, resulting in a reduced fermentable extract. However, sample R_H_MB demonstrated technologically acceptable stability.
The significant differences observed between the fermentation behavior of the green buckwheat substrate compared to the roasted buckwheat substrate revealed that the type of substrate is a determining factor in the performance of the fermentation process.
3.1.6. Influence of the Milling and Heat Treatment Method
Significant variations in optimization scores within the same type of buckwheat suggest that the milling method and the heat treatment applied also play an important role. Regarding milling, our results are in agreement with those of other authors, who found that milling methods influence the chemical composition and the physical–chemical, functional, and nutritional properties of buckwheat flour used in fermented buckwheat foods [51,52], proving that the substrate used for microbial fermentation is obviously influenced by the peculiarities of buckwheat grist.
The processing methods had a significant impact on fermentation performance, namely in the following ways:
- -
- Heat treatment with US generated higher optimization scores, due to a more efficient extraction and a more uniform distribution of the fermentation substrate, confirmed by the compact clustering in the PCA.
- -
- Heat treatment with MB resulted in a greater variability in predicted FLM scores, indicating less uniform heat processing and more dispersed results.
The impact of the processing variant is not only limited to the biochemistry of fermentation but it also extends to the physical and sensory properties of the final product. The milling method and heat treatment, through their effect on the accessibility of substrates and the degradation of structural components, profoundly influence the rheological behavior of the products obtained. In this sense, viscosity is a characteristic with direct implications on texture, stability, and sensory acceptability. To fully understand this aspect and identify the mechanisms that generate the differences observed between the green or roasted buckwheat samples, a detailed analysis of the viscosity patterns developed during the fermentation process was necessary. The results are discussed below.
3.1.7. Viscosity Pattern
As rheological analysis indicated obvious differences between green and roasted buckwheat samples, the analysis of viscosity patterns completed the characterization of the fermentation process and emphasized the complexity of the interactions among substrate, processing methods, and fermentation biochemistry. These differences influence the texture and stability of the final lactic fermented product.
Thus, the samples obtained from green buckwheat developed viscosities in the range of 1000–2100 cP, suggesting a complex rheological structure in the samples generated from the raw version of buckwheat and a more intense fermentation activity. In the case of roasted buckwheat, samples with much lower viscosities (10–200 cP) resulted, thus reflecting the physicochemical and structural changes induced by the baking heat treatment used to produce roasted buckwheat. In other words, the significant difference, about tenfold, between the viscosity of the samples obtained from green buckwheat (1000–2100 cP) and those from roasted buckwheat (10–200 cP) is due to structural and functional changes caused by heat treatment during roasting. These include partial gelatinization of starch, denaturation of proteins, and the formation of Maillard reaction products, which alter the hydration properties and gelling capacity of the flour matrix, thus directly affecting the rheological behavior.
3.1.8. FLM Performance Evaluation
In examining the different aspects of the lactic fermentation process pursued in the present research, each offering valuable insights into the fermentation dynamics of buckwheat-based substrates, an integrated evaluation of the presented FLM performance was justified. In this context, our FLM’s ability to model, classify, and predict the complex behavior of the investigated samples was analyzed and assessed using RMSE and score distribution. An RMSE value of 0.4923 indicates moderate accuracy in predicting the parameters’ values that characterize the fermentation process. The graphical representation in Figure 6 illustrates the relationship between normalized and predicted optimization scores, highlighting the formation of three clusters corresponding to the Nno-Optimal, Sub-Optimal, and Optimal classes (see also Table 2).
Figure 6.
Relationship between optimization score norm and predicted score, with highlighted evidence.
The clear and distinct identification of the three clusters in Figure 6 confirms the efficiency of FLM by differentiating the performance levels of the lactic fermentation process. This preliminary classification was followed by an in-depth analysis of the critical variables and technological conditions specific to the optimal samples. Thus, the essential technological variables and optimal conditions that ensure superior fermentation results were identified.
Optimal Sample Cluster. Optimal Threshold
Samples in the optimal class (see Figure 6, depicted as yellow triangles), especially those from green buckwheat processed with 0.12 mm disks, cluster in the upper right section of the graph, suggesting a strong correlation between predicted and normalized scores. These samples showed an efficient and stable conversion of substrates, suggesting an ideal fermentation performance.
Transition Zone
In Figure 6, the surface including normalized scores between 0.6 and 0.8 is considered to be the transition zone. This area is characterized by a high density of points in the predicted optimal score segment. The FLM allowed for the modeling of subtle transitions between states, a feature difficult to capture using classical optimization methods.
Cluster of Non-Optimal and Sub-Optimal Samples
An analysis of the distribution of samples in the non-optimal and sub-optimal classes (Figure 6) indicates a relatively uniform dispersion of samples, with obvious overlaps in the intermediate zones (transition zones). These overlaps reflect the fact that some of the samples present technological conditions that require further improvement to achieve optimal performance.
Based on a detailed analysis of the optimal and non-optimal samples as part of the FLM performance evaluation, the optimal samples identified in this study are characterized by the following features:
- -
- Low pH: pH = 3.752–4.007;
- -
- Moderate acidity: TTA = 0.184–0.283% (w/w) of lactic acid;
- -
- High viscosity: η = 408.2–1498.4 cP;
- -
- Optimal fermentation time: τ = 31–67 h.
Considering the above values, the optimal technological variants identified by the FLM are those corresponding to codes G_D1_US and G_H_US, in that order; the meaning of the code is presented in Table 1.
Notably, the identified optimal ranges effectively capture the dynamic and biologically complex character of the fermentation process, defining the critical zone in which the activity of lactic acid bacteria reaches its maximum, while obtaining the desired rheological properties. These results provide a solid basis for further refining optimal ranges through large-scale research.
3.2. Physical–Chemical, Technological, and Sensorial Analysis of B-bSs
From the perspective of buckwheat processing, the four primary operations considered were buckwheat roasting (pre-treatment), grinding, hydrothermal treatment, and lactic fermentation. Our results demonstrate the potential of applying fuzzy control in the lactic fermentation process of a buckwheat-based substrate. These results align with Honda and Kobayashi’s (2004) [41], who discussed Japanese sake fermentation. Additionally, even when the same type of buckwheat is used as the raw material, the fermentation process is influenced by the milling method and the heat treatment applied, which suggests that these operations also play an essential role in buckwheat processing (see also comments on optimization scores) due to how the buckwheat substrate is transformed (e.g., starch structure changes, protein modification, chemical surface interactions, and accessibility to microbial enzymes) during these processing stages. A series of justifications is presented below to support these statements. These data were correlated with physical–chemical and technological outcomes, confirming that the ultrasound treatment and, respectively, the G_D1_US samples exhibit the highest technological potential for developing fermented buckwheat-based products.
3.2.1. Granulometric Distribution of Milled Buckwheat Fractions
Regarding milling, three grinding variants using two types of equipment were considered. The granulometric distribution of wholemeal buckwheat grist is depicted in Table 5. The hammer mill (H) used for G-BW produced a remarkably high proportion of fine material, with the bottom (flour) fraction accounting for 75.83 ± 0.89%, significantly exceeding the yields obtained with D1 (36.95 ± 0.29%) and D2 (28.03 ± 0.14%). This demonstrates the superior milling performance of hammer milling for G-BW, likely due to the friable nature of the unroasted grain matrix.
Table 5.
Granulometric distribution for G-BW and R-BW grist using the MLUA Laboratory Plansifter, type BR, from Bühler AG; HG-BW = 13.2% w/w and HR-BW = 11.8% w/w.
From a technological standpoint, the use of the D1 mill is preferable in this case, as it results in a coarse grist II fraction that is nearly half the size of that obtained with the D2 mill. A similar trend is observed in the distribution of the fine grist I fractions for both disk milling configurations. Although the cumulative mass percentage of the fine grist I and II fractions are nearly similar, their individual distributions differ in a manner that may affect subsequent processing.
In contrast to G-BW, R-BW exhibited a markedly different fragmentation profile across all milling treatments. The flour fraction dropped drastically, with values ranging from 23.76 ± 0.12% (H) to 4.52 ± 0.11% (D2). These outcomes suggest that the transformations induced by the roasting process alter the mechanical behavior of the grain during grinding, rendering it more brittle yet less prone to generating ultra-fine particles under mechanical stress. This behavior may be attributed to caramelization and protein denaturation during roasting, which can induce rigid or glassy structures within the endosperm. As such, while R-BW is prone to particle disintegration under milling, the resulting fragments are resistant to further micronization.
The granulometric analysis of the G-BW and R-BW wholemeal grist reveals a pronounced dependency on the milling method employed, which is in agreement with the findings of Zhang et al. (2023), who observed that milling methods influence the particle size distribution, starch structure, and technical–functional properties of buckwheat flour used in wantuan, a traditional Chinese buckwheat food [51].
It should be emphasized that the granulometric profile of the milled substrate is a critical determinant in the sensory evaluation of the resulting product. Specifically, particle size distribution directly impacts the homogeneity of the matrix, phase stability, surface morphology, mechanical cohesion, and the perceptual attributes of texture, such as smoothness or the presence of residual particulates.
3.2.2. Water Absorption Index and Buckwheat Mash Behavior During the Hydrothermal Process
Given the results regarding the granulometric distribution presented in Table 5, corroborated by the mash behavior observed during the preparation of the fermented buck-wheat-based products, we decided not to present all of the results of R-BW-based samples in this article. For these samples, even after lactic fermentation, phase separation (liquid–solid) was evident; this was considered a critical exclusion criterion in the product development process. R-BW could potentially be used in combination with G-BW as a base in a new product recipe, leveraging the color and specific aroma advantages of R-BW.
Consequently, Table 6 presents only the results of WAI determination for whole G-BW grist obtained through the three milling variants and subjected to thermal treatments using either ultrasound or mashing bath techniques.
Table 6.
Water absorption index (WAI) of whole G-BW grist.
The WAI values suggest that the US treatment enhances the absorption capacity of whole G-BW grist, compared to thermal treatment using MB, regardless of the milling variant (an increase of +14.34% for H; +15.39% for D2; and +16.69% for D1). Moreover, it is observed that the D1 milling variant yields the highest WAI values for both types of thermal treatment, with the highest value recorded for US-treated samples, specifically those coded as G_D1_US. This finding contributes to explaining the superior performance of the G_D1_US samples in the evaluation of lactic fermentation and their sensory analysis. These technological outcomes related to the WAI values validate the optimal samples identified by the FLM analysis.
In the case of mashes prepared using ultrasound treatment, Figure 7 and Figure 8 show how buckwheat-based samples appeared before and after lactic fermentation. As observed in Figure 8, the fermented buckwheat food is a creamy product that could be considered a plant-based dairy alternative.
Figure 7.
Unfermented green buckwheat-based samples treated with ultrasound. The notations (sample coding) used in the figure are described in Table 1.
Figure 8.
Fermented green buckwheat-based samples subjected to ultrasound treatment. Table 1 provides a description of the sample coding. (a) External appearance (on the surface) of the samples after fermentation; (b) sequential frames of sample G_D1_US illustrating the dynamic motion during homogenization prior to consumption.
Figure 8a depicts the appearance of the external surface of the fermented samples obtained from the US-treated substrate, without syneresis. Also, the image reveals the uniform incorporation of milling particles within the sample matrix and the absence of perceptible syneresis. Complementing the visual analysis, Figure 8b highlights the creamy consistency of the G_D1_US sample and visually suggests its behavior during homogenization before consumption, characteristic of products in the category of lactic-fermented non-dairy yogurt analogs.
During the production process and subsequent storage under refrigeration conditions (4–6 °C) for 14 days, the syneresis was insignificant, measuring less than 1 mm. After 21 days, syneresis reached a maximum of 1.0 mm for the D1_US and H_US samples; it was slightly higher for the other samples, but it did not exceed 1.5 mm, which represents a technological advantage for the purposes of this study. Additionally, in relation to this observation, the examination of the external surface of all samples stored under refrigeration for up to 30 days revealed no development of microbial colonies (see Figure 9).
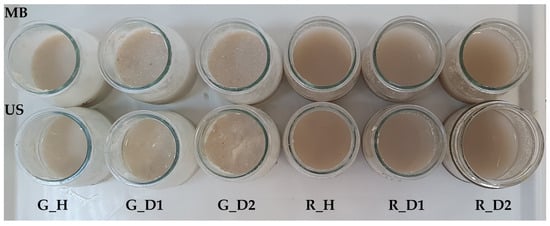
Figure 9.
Fermented samples after 30 days of storage. The notations are described in Table 1.
In this preliminary study, water activity was not measured; only sensory attributes potentially related to it were recorded. However, in future research aimed at advancing the development of this type of buckwheat-based product, water activity will be monitored, as it is essential for evaluating food safety, stability, and quality, and for determining further shelf life.
3.2.3. Color of the Buckwheat-Based Product
The color of the buckwheat-based products was evaluated based on Total Chroma and the Browning Index.
Total Chroma (E*)
Considering the E* values reported in Table 7, several important trends emerge regarding the effect of thermal treatment and fermentation on the visual characteristics of the plant-based samples.
Table 7.
E* values according to experimental design.
Across all experimental milling variants (H, D1, D2), fermentation consistently leads to an increase in E* values. This indicates an intensification of color in the samples after fermentation, confirming that fermentation likely promotes the release and/or transformation of chromogenic compounds, thereby enhancing overall color intensity.
Referring to the effect of thermal treatment methods (MB vs. US), it can be stated that US-assisted thermal treatment generally leads to higher chroma values compared to conventional MB treatment. This trend suggests that ultrasound may improve pigment retention or promote microstructural changes in the grist matrix, enhancing the release or preservation of color-active compounds; even after fermentation, the US-assisted samples exhibited higher values compared to the MB-assisted ones. The G_D1_US and G_H_US samples are the most stable, and so, in that order, they are technologically preferable.
For example, in sample H treated with MB, E* increases from 63.77 ± 0.59 (bF) to 73.33 ± 0.82 (aF), that is, by 14.99%, while in its US-treated counterpart, it increases from 68.82 ± 0.73 to 75.47 ± 0.86, an increase of 9.66%. Similar patterns are observed in samples D1 and D2, confirming that fermentation likely promotes pigment transformation and/or the release of chromogenic compounds, enhancing overall color intensity. These differences reflect the complex interplay between particle size distribution, hydration behavior, and pigment availability, all of which are influenced by both formulation and processing steps.
When R-BW grits were used in the product formulation, it was observed that the changes in E* were reduced, owing to the technological process involved in obtaining R-BW. Further commentary on the R-BW variant is unnecessary, as these samples were considered structurally and fermentatively non-acceptable, given that they were predicted to be non-optimal, primarily, by the FLM analysis.
Browning Index (BI)
The BI was determined to evaluate the extent of color changes associated with non-enzymatic browning reactions in buckwheat-based samples. The BI values presented in Table 8 provide several interpretive insights. An analysis of the samples based on these BI values indicates the following:
Table 8.
BI value according to experimental design.
- -
- The degree of milling had a noticeable impact on the BI values across both green G-BW and R-BW samples.
- -
- Thermal treatment using US yielded higher values for all three grinding variants of G-BW compared to the MB thermal treatment.
Effect of Milling Degree on BI
In G-BW samples, the finest grist (H) exhibited the highest BI value prior to thermal treatment, after 10 min of water hydration of whole grain flour at 20 °C, with a value of 24.19 ± 0.32, followed by D2 and D1. This trend is likely due to the increased surface area associated with fine milling, which promotes rapid solubilization and greater hydration as well as greater exposure to oxygen and facilitates oxidative and Maillard-type reactions during early processing stages.
In R-BW samples, however, the highest BI values were observed for the D1 variant before thermal treatment (e.g., 54.42), suggesting a more complex interaction between particle size and pigment development during roasting. The pre-existing thermal degradation products in roasted raw material are presumed to contribute substantially to the observed browning, with D1 presenting an optimal balance between pigment extraction and diffusion. These findings are evidently explained by the granulometric distribution of the R-BW milling fractions, as presented in Table 5 (e.g., the R_D1 sample exhibited the highest percentage of fine grist, namely, 49.96%).
Effect of Treatment Method (Mash Bath vs. Ultrasound)
For all G-BW samples, regardless of the grinding method, it was observed that the BI values before fermentation were higher for the US thermal treatment compared to the MB treatment. This suggests that the US treatment may enhance hydration and oxidative reactions, disrupt cell structures, and promote the darkening of the sample’s color. Conversely, after fermentation, the G-BW-based samples treated with US exhibited lower BI values. Specifically, the lowest BI after fermentation was recorded for the G_H_US sample (17.11), closely followed by the G_D1_US sample with a BI of 17.13, which can be considered an experimentally equivalent result.
In roasted buckwheat samples, mash bath treatment produced higher BI values overall, particularly in D1 (54.42 with MB vs. 50.54 with US). While ultrasound still facilitated browning in some cases (e.g., D2), the extent was less pronounced compared to the mash bath, possibly due to more efficient pigment diffusion and reduced localized thermal stress.
Influence of Fermentation on Browning Index
Fermentation resulted in a general reduction in BI values across all grist types and treatments, with a more pronounced effect in green buckwheat samples. For instance, in green H samples subjected to mash bath treatment, the BI decreased from 24.19 before fermentation to 17.80 after fermentation. A similar decrease was observed in D2 samples (from 19.77 to 16.71). These results suggest that lactic fermentation may lead to the degradation or transformation of browning-related compounds, such as polyphenols or Maillard intermediates, possibly through microbial metabolism or changes in pH and redox potential that inhibit further pigment formation. This effect may contribute to improved visual stability and product acceptability in fermented plant-based formulations.
Technological Implications
From a technological perspective, the combination of milling degree, fermentation, and pre-treatment method plays a critical role in defining the color properties of buckwheat-based fermented products. The D1 variant, especially in roasted samples, consistently exhibited the highest BI values, indicating its potential in applications where a stronger color profile is desirable.
Furthermore, fermentation acts as a stabilizing factor, reducing excess browning, while ultrasound treatment can attain moderate pigment development in sensitive formulations. These findings support the strategic use of process parameters to control browning and enhance the sensory appeal and stability of fermented plant-based products.
3.2.4. Sensory Evaluation
Considering the experimental results already presented in this work, as well as the observations made during the experiment, only the sensory analysis results corresponding to the G-BW-based samples are presented in graphical form in Figure 10. Since the R-BW-based samples did not receive sufficiently high scores (values above 4.5) for the sensory attributes of appearance, overall acceptability, and texture (mouthfeel) to be considered acceptable, they were rejected, despite the other attributes, such as color and taste, being rated as satisfactory.
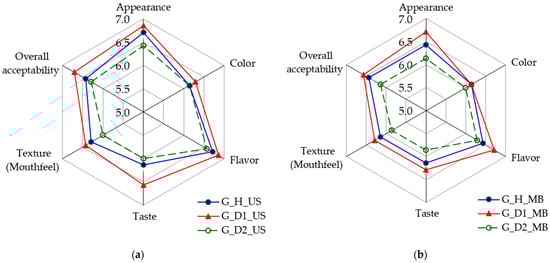
Figure 10.
Sensory evaluation of buckwheat-based fermented samples represented using Spider Web diagrams: (a) ultrasonic treatment; (b) mashing bath treatment. Table 1 provides a description of the sample coding.
Figure 10 shows that the scores for all sensory attributes considered are higher when the US treatment is applied. Furthermore, samples G_D1_US and G_H_US received the highest scores. The above finding confirms that these samples were also identified as the optimal technological variants, in that order, by the FLM.
4. Conclusions
This study shows that a Mamdani-type fuzzy logic model (FLM) can effectively support continuous monitoring and decision-making during the lactic fermentation of buckwheat substrates. Therefore, the fuzzy approach proves to be helpful for the rapid and accurate identification of situations that require technological interventions, constituting a solid basis for the ongoing optimization of the fermentation process studied.
This study demonstrated the importance of separating the stages of B-bS preparation from the fermentation stage itself. The results confirm that the initial processing significantly influences the subsequent evolution of fermentation and the final characteristics of the product. The outcomes generated by the fuzzy logic-based optimization approach are supported by practical results, confirming that the ultrasound treatment and, correspondingly, the G_D1_US samples possess the highest technological potential for the development of fermented buckwheat-based products.
Although, the current FLM adopts a conservative stance—favoring the reduction in false-positive “optimal” classifications—it succeeds in singling out promising technological variants. Among them, ultrasound treatment applied to fine-milled green buckwheat (G_D1_US) emerges as the most suitable candidate for further product development.
The comparative analysis of the samples emphasizes the importance of optimizing the process parameter values (time, pH, acidity, viscosity, milling method and heat treatment) to ensure an efficient lactic fermentation of buckwheat-based substrates and identical as optimal US heat treatment to the processing of G-BW grist with a partially fine particle size distribution, which provides the physicochemical and sensory characteristics necessary for these plant-based products.
Future work will expand the experimental dataset, apply systematic cross-validation, and adjust membership functions to enhance the model’s ability to identify truly optimal cases. Integrating the FLM into an online control loop and periodically retraining it with fresh process data is expected to improve both accuracy and industrial relevance. Beyond process optimization, forthcoming research will investigate the functional and nutritional attributes of fermented buckwheat matrices to confirm their suitability as plant-based dairy alternatives.
Author Contributions
Conceptualization, M.-L.P., A.Ș., O.K. and A.S.; methodology, M.-L.P., A.Ș., O.K. and A.S.; software, A.Ș. and O.K.; validation, M.-L.P., A.S. and A.Ș.; formal analysis, M.-L.P., A.S. and A.Ș.; investigation, M.-L.P.; resources, A.Ș. and M.-L.P.; data curation, M.-L.P. and A.S.; writing—original draft preparation, M.-L.P., A.Ș., O.K. and A.S.; writing—review and editing, M.-L.P. and A.S.; visualization, M.-L.P. and A.Ș.; supervision, M.-L.P., A.Ș. and A.S.; project administration, M.-L.P.; funding acquisition, A.Ș. All authors have read and agreed to the published version of the manuscript.
Funding
This research was funded by Lucian Blaga University of Sibiu through research grant LBUS-IRG-2022-08.
Institutional Review Board Statement
Ethical review and approval were waived for this study due to the following reasons: 1. alignment with regulatory guidelines on sensory studies; 2. no human health risks from ingredients; 3. non-interventional study nature; 4. controlled lab; 5. compliance with food safety standards.
Informed Consent Statement
Informed consent was obtained from all subjects involved in this study.
Data Availability Statement
The original contributions presented in the study are included in the article; further inquiries can be directed to the corresponding authors.
Acknowledgments
The last author (A.S.) is grateful for the technical support received under the project “Future of plant-based food: Bridging the gap of new proteins and FLAVOURsome” (CA22161: FLAVOURsome), supported by COST (European Cooperation in Science and Technology; http://www.cost.eu/).
Conflicts of Interest
The authors declare no conflicts of interest. The funders had no role in the design of the study; in the collection, analyses, or interpretation of data; in the writing of the manuscript; or in the decision to publish the results.
Appendix A
Appendix A.1
Table A1.
The values of the variables used to characterize the lactic fermentation process of B-bS samples by applying FLM.
Table A1.
The values of the variables used to characterize the lactic fermentation process of B-bS samples by applying FLM.
| Code Samples * | Variables | Time, (τ, Hours) | |||||||
|---|---|---|---|---|---|---|---|---|---|
| 0 | 19 | 31 | 43 | 67 | 103 | 121 | 168 | ||
| G_H_US | pH | 6.665 ± 0.07 | 3.862 ± 0.05 | 3.795 ± 0.07 | 3.763 ± 0.09 | 3.752 ± 0.06 | 3.745 ± 0.05 | 3.745 ± 0.06 | 3.748 ± 0.05 |
| G_H_MB | 6.571 ± 0.08 | 3.867 ± 0.07 | 3.770 ± 0.08 | 3.756 ± 0.06 | 3.804 ± 0.07 | 3.828 ± 0.06 | 3.824 ± 0.04 | 3.824 ± 0.05 | |
| G_D1_US | 6.676 ± 0.06 | 3.996 ± 0.09 | 3.916 ± 0.07 | 3.882 ± 0.08 | 3.882 ± 0.06 | 3.882 ± 0.04 | 3.889 ± 0.04 | 3.869 ± 0.07 | |
| G_D1_MB | 6.590 ± 0.08 | 3.945 ± 0.10 | 3.800 ± 0.09 | 3.809 ± 0.09 | 3.826 ± 0.05 | 3.879 ± 0.04 | 3.859 ± 0.05 | 3.836 ± 0.06 | |
| G_D2_US | 6.688 ± 0.09 | 4.082 ± 0.10 | 3.954 ± 0.11 | 3.912 ± 0.10 | 3.895 ± 0.08 | 3.889 ± 0.07 | 3.891 ± 0.07 | 3.891 ± 0.03 | |
| G_D2_MB | 6.676 ± 0.07 | 4.018 ± 0.12 | 3.931 ± 0.08 | 3.920 ± 0.07 | 3.924 ± 0.09 | 3.922 ± 0.06 | 3.920 ± 0.07 | 3.880 ± 0.04 | |
| G_H_US | TTA ** | 0.019 ± 5.8 × 10⁻⁴ | 0.209 ± 0.003 | 0.264 ± 0.004 | 0.283 ± 0.007 | 0.283 ± 0.005 | 0.281 ± 0.006 | 0.282 ± 0.005 | 0.283 ± 0.006 |
| G_H_MB | 0.012 ± 1.0 × 10⁻³ | 0.214 ± 0.004 | 0.258 ± 0.005 | 0.272 ± 0.005 | 0.268 ± 0.006 | 0.265 ± 0.005 | 0.264 ± 0.004 | 0.258 ± 0.003 | |
| G_D1_US | 0.011 ± 1.0 × 10⁻³ | 0.199 ± 0.002 | 0.228 ± 0.004 | 0.236 ± 0.005 | 0.236 ± 0.005 | 0.234 ± 0.004 | 0.236 ± 0.004 | 0.235 ± 0.004 | |
| G_D1_MB | 0.011 ± 5.8 × 10⁻⁴ | 0.201 ± 0.005 | 0.248 ± 0.006 | 0.263 ± 0.008 | 0.259 ± 0.004 | 0.260 ± 0.005 | 0.258 ± 0.005 | 0.252 ± 0.004 | |
| G_D2_US | 0.007 ± 5.8 × 10⁻⁴ | 0.174 ± 0.002 | 0.212 ± 0.003 | 0.226 ± 0.004 | 0.224 ± 0.004 | 0.224 ± 0.004 | 0.225 ± 0.004 | 0.224 ± 0.004 | |
| G_D2_MB | 0.006 ± 5.8 × 10⁻⁴ | 0.159 ± 0.004 | 0.222 ± 0.003 | 0.248 ± 0.004 | 0.246 ± 0.005 | 0.247 ± 0.003 | 0.245 ± 0.004 | 0.240 ± 0.005 | |
| G_H_US | H *** | 636.6 ± 7.24 | 952.3 ± 10.11 | 1295.9 ± 11.42 | 1498.4 ± 12.64 | 1466.4 ± 16.10 | 1390.2 ± 15.44 | 1352.7 ± 18.10 | 1311.8 ± 17.48 |
| G_H_MB | 1113.0 ± 14.46 | 1685.0 ± 13.32 | 1924.0 ± 18.24 | 2100.0 ± 13.30 | 2090.0 ± 21.20 | 2056.0 ± 14.10 | 2064.0 ± 15.74 | 2041.0 ± 12.48 | |
| G_D1_US | 385.2 ± 4.21 | 448.7 ± 5.61 | 617.7 ± 5.82 | 716.9 ± 6.90 | 700.2 ± 9.36 | 610.4 ± 7.42 | 593.9 ± 8.26 | 485.9 ± 6.44 | |
| G_D1_MB | 749.0 ± 9.12 | 1273.0 ± 10.6 | 1620.0 ± 17.10 | 1851.0 ± 22.42 | 1916.0 ± 20.88 | 1894 ± 20.22 | 1900.0 ± 23.24 | 1852.0 ± 22.42 | |
| G_D2_US | 315.2 ± 3.34 | 342.4 ± 4.13 | 398.6 ± 5.09 | 436.6 ± 5.44 | 408.2 ± 5.62 | 366.8 ± 7.20 | 347.7 ± 5.34 | 296.1 ± 4.22 | |
| G_D2_MB | 609.9 ± 8.22 | 1070.0 ± 14.22 | 1508.0 ± 17.32 | 1760.0 ± 18.66 | 1894.0 ± 16.86 | 1875.0 ± 24.36 | 1849.0 ± 20.46 | 1840.0 ± 24.10 | |
| R_H_US | pH | 6.643 ± 0.09 | 4.182 ± 0.04 | 4.110 ± 0.04 | 4.057 ± 0.03 | 4.047 ± 0.04 | 4.040 ± 0.05 | 4.038 ± 0.06 | 4.036 ± 0.03 |
| R_H_MB | 6.484 ± 0.06 | 4.115 ± 0.06 | 4.008 ± 0.08 | 4.024 ± 0.06 | 4.007 ± 0.06 | 3.992 ± 0.07 | 3.979 ± 0.08 | 3.972 ± 0.06 | |
| R_D1_US | 6.590 ± 0.07 | 4.325 ± 0.05 | 4.224 ± 0.05 | 4.147 ± 0.05 | 4.140 ± 0.08 | 4.134 ± 0.06 | 4.126 ± 0.05 | 4.113 ± 0.08 | |
| R_D1_MB | 6.643 ± 0.12 | 4.214 ± 0.06 | 4.136 ± 0.09 | 4.117 ± 0.07 | 4.115 ± 0.07 | 4.115 ± 0.04 | 4.114 ± 0.05 | 4.090 ± 0.07 | |
| R_D2_US | 6.775 ± 0.08 | 4.405 ± 0.08 | 4.274 ± 0.06 | 4.192 ± 0.09 | 4.182 ± 0.06 | 4.158 ± 0.03 | 4.146 ± 0.03 | 4.124 ± 0.05 | |
| R_D2_MB | 6.491 ± 0.09 | 4.276 ± 0.08 | 4.132 ± 0.05 | 4.116 ± 0.08 | 4.116 ± 0.05 | 4.111 ± 0.04 | 4.11 ± 0.07 | 4.076 ± 0.06 | |
| R_H_US | TTA | 0.018 ± 1.0 × 10⁻³ | 0.120 ± 0.002 | 0.156 ± 0.004 | 0.166 ± 0.002 | 0.163 ± 0.001 | 0.161 ± 0.001 | 0.160 ± 0.002 | 0.164 ± 0.002 |
| R_H_MB | 0.013 ± 5.8 × 10⁻⁴ | 0.141 ± 0.003 | 0.174 ± 0.003 | 0.187 ± 0.002 | 0.184 ± 0.002 | 0.178 ± 0.002 | 0.175 ± 0.002 | 0.174 ± 0.002 | |
| R_D1_US | 0.012 ± 5.8 × 10⁻⁴ | 0.113 ± 0.002 | 0.137 ± 0.003 | 0.146 ± 0.001 | 0.145 ± 0.002 | 0.143 ± 0.001 | 0.142 ± 0.001 | 0.144 ± 0.001 | |
| R_D1_MB | 0.008 ± 1.0 × 10⁻³ | 0.132 ± 0.003 | 0.154 ± 0.003 | 0.162 ± 0.002 | 0.159 ± 0.001 | 0.154 ± 0.001 | 0.153 ± 0.002 | 0.151 ± 0.002 | |
| R_D2_US | 0.009 ± 1.0 × 10⁻³ | 0.107 ± 0.003 | 0.133 ± 0.002 | 0.142 ± 0.001 | 0.141 ± 0.001 | 0.141 ± 0.001 | 0.140 ± 0.001 | 0.140 ± 0.001 | |
| R_D2_MB | 0.011 ± 5.8 × 10⁻⁴ | 0.123 ± 0.002 | 0.149 ± 0.002 | 0.157 ± 0.001 | 0.153 ± 0.001 | 0.148 ± 0.001 | 0.146 ± 0.001 | 0.144 ± 0.001 | |
| R_H_US | η | 42.8 ± 0.52 | 53.5 ± 0.52 | 65.4 ± 0.98 | 73.5 ± 1.34 | 88.2 ± 1.16 | 102.6 ± 1.42 | 118.40 ± 2.04 | 125.20 ± 1.58 |
| R_H_MB | 153.5 ± 1.84 | 219.3 ± 2.44 | 197.4 ± 1.38 | 148.6 ± 1.64 | 124.8 ± 1.74 | 108.8 ± 1.14 | 96.3 ± 1.38 | 53.5 ± 0.82 | |
| R_D1_US | 37.1 ± 0.54 | 46.5 ± 1.42 | 49.3 ± 1.82 | 54.1 ± 0.72 | 50.7 ± 0.52 | 46.4 ± 0.92 | 37.5 ± 0.64 | 26.7 ± 0.64 | |
| R_D1_MB | 117.7 ± 1.64 | 192.6 ± 2.26 | 162.6 ± 2.04 | 106.3 ± 1.54 | 94.5 ± 1.86 | 93.4 ± 1.18 | 91 ± 1.34 | 42.8 ± 0.78 | |
| R_D2_US | 16.1 ± 0.28 | 21.4 ± 0.44 | 23.2 ± 0.68 | 26.7 ± 0.68 | 22.4 ± 0.36 | 21.1 ± 0.46 | 18.2 ± 0.32 | 10.7 ± 0.36 | |
| R_D2_MB | 32.1 ± 0.62 | 62.8 ± 0.92 | 47.8 ± 1.05 | 32.1 ± 0.58 | 23.3 ± 0.54 | 24.4 ± 0.62 | 26.7 ± 0.52 | 21.4 ± 0.62 | |
* Sample codes are presented in Table 1; ** TTA—total titratable acidity [% w/w of lactic acid]; *** η—dynamic viscosity, [cP]. Values represent the mean ± standard deviation (n = 3).
References
- Wang, Y.; Jian, C. Sustainable plant-based ingredients as wheat flour substitutes in bread making. NPJ Sci. Food 2022, 6, 49. [Google Scholar] [CrossRef]
- Khairuddin, M.A.N.; Lasekan, O. Gluten-Free Cereal Products and Beverages: A Review of Their Health Benefits in the Last Five Years. Foods 2021, 10, 2523. [Google Scholar] [CrossRef]
- Sîrbu, A. Use of non-conventional ingredients to develop and improve functional and bio-fortified sourdough-based and other bakery products. In Handbook of Sourdough Microbiota and Fermentation; Ozogul, F., Rocha, J.M., Bartkiene, E., Eds.; Academic Press: Cambridge, MA, USA, 2025; pp. 297–319. [Google Scholar] [CrossRef]
- Jha, R.; Zhang, K.; He, Y.; Mendler-Drienyovszki, N.; Magyar-Tábori, K.; Quinet, M.; Germ, M.; Kreft, I.; Meglič, V.; Ikeda, K.; et al. Global nutritional challenges and opportunities: Buckwheat, a potential bridge between nutrient deficiency and food security. Trends Food Sci. Technol. 2024, 145, 104365. [Google Scholar] [CrossRef]
- Ciocan, M.E.; Salamon, R.V.; Ambrus, Á.; Codină, G.G.; Chetrariu, A.; Dabija, A. Brewing with buckwheat and sorghum: Impact on beer quality. Sci. Study Res. Chem. Chem. Eng. Biotechnol. Food Ind. 2023, 24, 219–232. [Google Scholar]
- Sofi, S.A.; Ahmed, N.; Farooq, A.; Rafiq, S.; Zargar, S.M.; Kamran, F.; Dar, T.A.; Mir, S.A.; Dar, B.N.; Mousavi Khaneghah, A. Nutritional and bioactive characteristics of buckwheat, and its potential for developing gluten-free products: An updated overview. Food Sci. Nutr. 2023, 11, 2256–2276. [Google Scholar] [CrossRef] [PubMed]
- Krishnaswamy, G.G.; Parameshwari, S. A concise review on buckwheat materials based ready to serve and ready to eat food products. Mater. Today Proc. 2022, 66, 783–788. [Google Scholar] [CrossRef]
- Zhang, Z.L.; Zhou, M.L.; Tang, Y.; Li, F.L.; Tang, Y.X.; Shao, J.R.; Xue, W.T.; Wu, Y.M. Bioactive compounds in functional buckwheat food. Int. Food Res. 2012, 49, 389–395. [Google Scholar] [CrossRef]
- Zhang, Z.; Fan, S.; Duncan, G.J.; Morris, A.; Henderson, D.; Morrice, P.; Russell, W.R.; Duncan, S.H.; Neacsu, M. Buckwheat (Fagopyrum esculentum) Hulls Are a Rich Source of Fermentable Dietary Fibre and Bioactive Phytochemicals. Int. J. Mol. Sci. 2023, 24, 16310. [Google Scholar] [CrossRef]
- Bani, C.; Peñas, E.; Baron, G.; Martínez-Villaluenga, C.; Mercogliano, F.; Aldini, G.; Piazza, S.; Di Lorenzo, C.; Restani, P. Characterization of the phenolic profile and in vitro antioxidant potential of different varieties of common buckwheat (Fagopyrum esculentum Moench) and tartary buckwheat (Fagopyrum tataricum (L.) Gaertn.). LWT 2025, 215, 117261. [Google Scholar] [CrossRef]
- Basharat, Z.; Tufail, T.; Shao, F.; Virk, M.S.; Duan, Y.; Cai, M.; Hu, K.; Basharat, N.; Zhang, H. Sustainable and contemporary approaches to explore the nutritional and processing perspectives of buckwheat: Current evidence and prospects. Food Biosci. 2025, 67, 106312. [Google Scholar] [CrossRef]
- Sharma, N.; Mall, S.; Kumar, V. Buckwheat: Nutritional Profile, Processing, and Food Products. In Pseudocereals: Production, Processing, and Nutrition, 1st ed.; Dhull, S.B., Bains, A., Chawla, P., Kaur, S., Eds.; CRC Press: Boca Raton, FL, USA, 2024; p. 16. [Google Scholar] [CrossRef]
- Patra, M.; Bashir, O.; Amin, T.; Shams, R.; Chaudhary, K.S.; Mirza, A.A.; Manzoor, S. A comprehensive review on functional beverages from cereal grains-characterization of nutraceutical potential, processing technologies and product types. Heliyon 2023, 9, 16804. [Google Scholar] [CrossRef] [PubMed]
- Zhu, F. Dietary fiber polysaccharides of amaranth, buckwheat and quinoa grains: A review of chemical structure, biological functions and food uses. Carbohydr. Polym. 2020, 248, 116819. [Google Scholar] [CrossRef] [PubMed]
- Kreft, M. Buckwheat phenolic metabolites in health and disease. Nutr. Res. Rev. 2016, 29, 30–39. [Google Scholar] [CrossRef] [PubMed]
- Giménez-Bastida, J.A.; Piskuła, M.K.; Zieliński, H. Recent Advances in Processing and Development of Buckwheat Derived Bakery and Non-Bakery Products—A Review. Pol. J. Food Nutr. Sci. 2015, 65, 9–20. [Google Scholar] [CrossRef]
- Giménez-Bastida, J.A.; Zieliński, H. Buckwheat as a Functional Food and Its Effects on Health. J. Agric. Food Chem. 2015, 63, 7896–7913. [Google Scholar] [CrossRef]
- Li, F.-H.; Yuan, Y.; Yang, X.-L.; Tao, S.-Y.; Ming, J. Phenolic profiles and antioxidant activity of buckwheat (Fagopyrum esculentum Möench and Fagopyrum tartaricum L. Gaerth) Hulls, Brans and Flours. J. Integr. Agric. 2013, 12, 1684–1693. [Google Scholar] [CrossRef]
- Kumar, H.; Guleria, S.; Kimta, N.; Dhalaria, R.; Nepovimova, E.; Dhanjal, D.S.; Alomar, S.Y.; Kuca, K. Amaranth and buckwheat grains: Nutritional profile, development of functional foods, their pre-clinical cum clinical aspects and enrichment in feed. Curr. Res. Food Sci. 2024, 9, 100836. [Google Scholar] [CrossRef]
- Kumari, R.; Singh, V.; Padwad, Y.S.; Gupta, M. Elucidating the physical, morphometric, nutritional, and bioactive properties of selected highland crops viz. hull-less barley, buckwheat, and black rice for novel food formulation. Sustain. Food Technol. 2023, 1, 567–581. [Google Scholar] [CrossRef]
- Zenkova, M.L.; Melnikova, L.A.; Timofeeva, V.N. Non-Alcoholic Beverages from Sprouted Buckwheat: Technology and Nutritional Value. Food Process. Tech. Technol. 2023, 53, 316–325. [Google Scholar] [CrossRef]
- Zhu, F. Buckwheat proteins and peptides: Biological functions and food applications. Trends Food Sci. Technol. 2021, 110, 155–167. [Google Scholar] [CrossRef]
- Pexová Kalinová, J.; Vrchotová, N.; Tříska, J. Flavonoids profile in pasta and cookies fortified with common buckwheat sprouts or microgreens flour. J. Cer. Sci. 2025, 121, 104092. [Google Scholar] [CrossRef]
- Janiak, M.A.; Karamać, M.; Sulewska, K.; Amarowicz, R.; Denev, P.; Slavova-Kazakova, A. Phenolic Profile and Antioxidant Potential of Beverages from Buckwheat and Side Streams after Beverages Production. Processes 2023, 11, 3205. [Google Scholar] [CrossRef]
- Cheng, Z.; Li, X.; Hu, J.; Fan, X.; Hu, X.; Wu, G.; Xing, Y. Effect of Gaseous Chlorine Dioxide Treatment on the Quality Characteristics of Buckwheat-Based Composite Flour and Storage Stability of Fresh Noodles. Processes 2021, 9, 1522. [Google Scholar] [CrossRef]
- Cardinali, F.; Osimani, A.; Milanović, V.; Garofalo, C.; Aquilanti, L. Innovative Fermented Beverages Made with Red Rice, Barley, and Buckwheat. Foods 2021, 10, 613. [Google Scholar] [CrossRef] [PubMed]
- Kowalska, E.; Ziarno, M. Characterization of Buckwheat Beverages Fermented with Lactic Acid Bacterial Cultures and Bifidobacteria. Foods 2020, 9, 1771. [Google Scholar] [CrossRef] [PubMed]
- Petrova, P.; Petrov, K. Lactic Acid Fermentation of Cereals and Pseudocereals: Ancient Nutritional Biotechnologies with Modern Applications. Nutrients 2020, 12, 1118. [Google Scholar] [CrossRef]
- Liptáková, D.; Matejčeková, Z.; Valík, L. Lactic Acid Bacteria and Fermentation of Cereals and Pseudocereals. In Fermentation Processes; Jozala, A.F., Ed.; InTech: Houston, TX, USA, 2017; ISBN 978-953-51-2928-8. [Google Scholar] [CrossRef]
- Tolaini, V.; Del Fiore, A.; Nobili, C.; Presenti, O.; De Rossi, P.; Procacci, S.; Vitali, F.; Brunori, A. Exploitation of Tartary Buckwheat as Sustainable Ingredient for Healthy Foods Production. Agric. Agric. Sci. Procedia. 2016, 8, 455–460. [Google Scholar] [CrossRef][Green Version]
- Suzuki, T.; Morishita, T.; Takigawa, S.; Noda, T.; Ishiguro, K. Characterization of Rutin-rich Bread Made with ‘Manten-Kirari’,a Trace-rutinosidase Variety of Tartary Buckwheat (Fagopyrum tataricum Gaertn.). Food Sci. Technol. Res. 2015, 21, 733–738. [Google Scholar] [CrossRef][Green Version]
- Dabija, A.; Ciocan, M.E.; Chetrariu, A.; Codină, G.G. Buckwheat and Amaranth as Raw Materials for Brewing, a Review. Plants 2022, 11, 756. [Google Scholar] [CrossRef]
- Moroni, A.V.; Arendt, E.K.; Morrissey, J.P.; Dal Bello, F. Development of buckwheat and teff sourdoughs with the use of commercial starters. Int. J. Food Microbiol. 2010, 142, 142–148. [Google Scholar] [CrossRef]
- Vogelmann, S.A.; Seitter, M.; Singer, U.; Brandt, M.J.; Hertel, C. Adaptability of lactic acid bacteria and yeasts to sourdoughs prepared from cereals, pseudocereals and cassava and use of competitive strains as starters. Int. J. Food Microbiol. 2009, 130, 205–212. [Google Scholar] [CrossRef]
- Graziano, S.; Agrimonti, C.; Marmiroli, N.; Gullì, M. Utilisation and limitations of pseudocereals (quinoa, amaranth, and buckwheat) in food production: A review. Trends Food Sci. Technol. 2022, 125, 154–165. [Google Scholar] [CrossRef]
- Streimikyte, P.; Balciunaitiene, A.; Liapman, T.D.; Streimikyte-Mockeliune, Z.; Puzeryte, V.; Borkertas, S.; Viskelis, P.; Viskelis, J. Enzymatically Hydrolysed Common Buckwheat (Fagopyrum esculentum M.) as a Fermentable Source of Oligosaccharides and Sugars. Appl. Sci. 2022, 12, 8210. [Google Scholar] [CrossRef]
- Li, H.; Zhu, F.; Li, G. Beverages developed from pseudocereals (quinoa, buckwheat, and amaranth): Nutritional and functional properties. Compr. Rev. Food Sci. Food Saf. 2025, 24, e70081. [Google Scholar] [CrossRef] [PubMed]
- Guo, H.; Li, H.; Xiao, Y.; Wu, D.T.; Gan, R.Y.; Kang, Z.; Huang, Y.; Gao, H. Revisiting fermented buckwheat: A comprehensive examination of strains, bioactivities, and applications. Crit. Rev. Food Sci. Nutr. 2025, 1–22. [Google Scholar] [CrossRef] [PubMed]
- Zieliński, H.; Honke, J.; Topolska, J.; Bączek, N.; Piskuła, M.K.; Wiczkowski, W.; Wronkowska, M. ACE Inhibitory Properties and Phenolics Profile of Fermented Flours and of Baked and Digested Biscuits from Buckwheat. Foods 2020, 9, 847. [Google Scholar] [CrossRef] [PubMed]
- Deora, N.S.; Deswal, A.; Mishra, H.N. Alternative Approaches Towards Gluten-Free Dough Development: Recent Trends. Food Eng. Rev. 2014, 6, 89–104. [Google Scholar] [CrossRef]
- Honda, H.; Kobayashi, T. Industrial Application of Fuzzy Control in Bioprocesses. In Biomanufacturing; Zhong, J.J., Ed.; Advances in Biochemical Engineering; Springer: Berlin, Heidelberg, 2004; Volume 87, pp. 151–171. ISBN 978-3-540-39998-8. [Google Scholar] [CrossRef]
- Wang, P.; Zhang, D.; Zong, X. Fermentation Tank Dissolve Oxygen Control System Based on MATLAB. In Proceedings of the 2015 2nd International Workshop on Materials Engineering and Computer Sciences, Jinan, China, 10–11 October 2015; Advances in Computer Science Research Series; Atlantis Press: Dodrecht, The Netherlands, 2015; Online ISSN 2352-538X. [Google Scholar] [CrossRef][Green Version]
- Sousa Jr, R.; Almeida, P.I.F. Design of a fuzzy system for the control of a biochemical reactor in fed-batch culture. Process Biochem. 2001, 37, 461–469. [Google Scholar] [CrossRef]
- Akisue, R.A.; Harth, M.L.; Horta, A.C.L.; de Sousa Junior, R. Optimized Dissolved Oxygen Fuzzy Control for Recombinant Escherichia coli Cultivations. Algorithms 2021, 14, 326. Available online: https://www.mdpi.com/1999-4893/14/11/326 (accessed on 1 November 2024). [CrossRef]
- ASRO. Romanian Standards Catalog for Cereal and Milling Products Analysis; Romanian Standards Association: Bucharest, Romania, 2008. (In Romanian) [Google Scholar]
- AACC. Approved Methods of the American Association of Cereal Chemists, 10th ed.; AACC: St. Paul, MN, USA, 2000. [Google Scholar]
- Akgül, H.; Yıldız-Akgül, F.; Tuna, D. Modeling of kefir production with fuzzy logic. Turk. J. Agric.-Food Sci. Technol. 2014, 2, 251–255. [Google Scholar] [CrossRef][Green Version]
- Butkus, M.; Repšytė, J.; Galvanauskas, V. Fuzzy Logic-Based Adaptive Control of Specific Growth Rate in Fed-Batch Biotechnological Processes. A Simulation Study. Appl. Sci. 2020, 10, 6818. [Google Scholar] [CrossRef]
- Borges, A.S.; Montano, I.D.C.; Sousa Junior, R.; Suarez, C.A.G. Automatic solids feeder using fuzzy control: A tool for fed batch bioprocesses. J. Process Control. 2020, 93, 28–42. [Google Scholar] [CrossRef]
- O’Connor, B.; Riverol, C.; Kelleher, P.; Plant, N.; Bevan, R.; Hinchy, E.; D’Arcy, J. Integration of fuzzy logic based control procedures in brewing. Food Control. 2002, 13, 23–31. [Google Scholar] [CrossRef]
- Zhang, L.; Meng, O.; Zhao, G.; Ye, F. Comparison of milling methods on the properties of common buckwheat flour and the quality of wantuan, a traditional Chinese buckwheat food. Food Chem. X 2023, 19, 100845. [Google Scholar] [CrossRef]
- Wojciechowicz-Budzisz, A.; Skřivan, P.; Sluková, M.; Švec, I.; Pejcz, E.; Stupák, M.; Czubaszek, A.; Harasym, J. Comprehensive Characterization of Micronized Wholemeal Flours: Investigating Technological Properties across Various Grains. Foods 2024, 13, 39. [Google Scholar] [CrossRef]


Disclaimer/Publisher’s Note: The statements, opinions and data contained in all publications are solely those of the individual author(s) and contributor(s) and not of MDPI and/or the editor(s). MDPI and/or the editor(s) disclaim responsibility for any injury to people or property resulting from any ideas, methods, instructions or products referred to in the content. |
© 2025 by the authors. Licensee MDPI, Basel, Switzerland. This article is an open access article distributed under the terms and conditions of the Creative Commons Attribution (CC BY) license (https://creativecommons.org/licenses/by/4.0/).