In this section the main outcomes obtained from the ReforCELL project are presented. The research activities addressed the whole product chain: i.e., development of materials/components (membranes, supports, seals, catalyst, etc.) through integration/validation at lab-scale, until development/validation of pilot scale ATR-CMR and the proof of concept/validation of the new PEM fuel cell m-CHP system. Due to this fact, this section is divided into different sub-sections containing the main results.
3.1. Catalyst
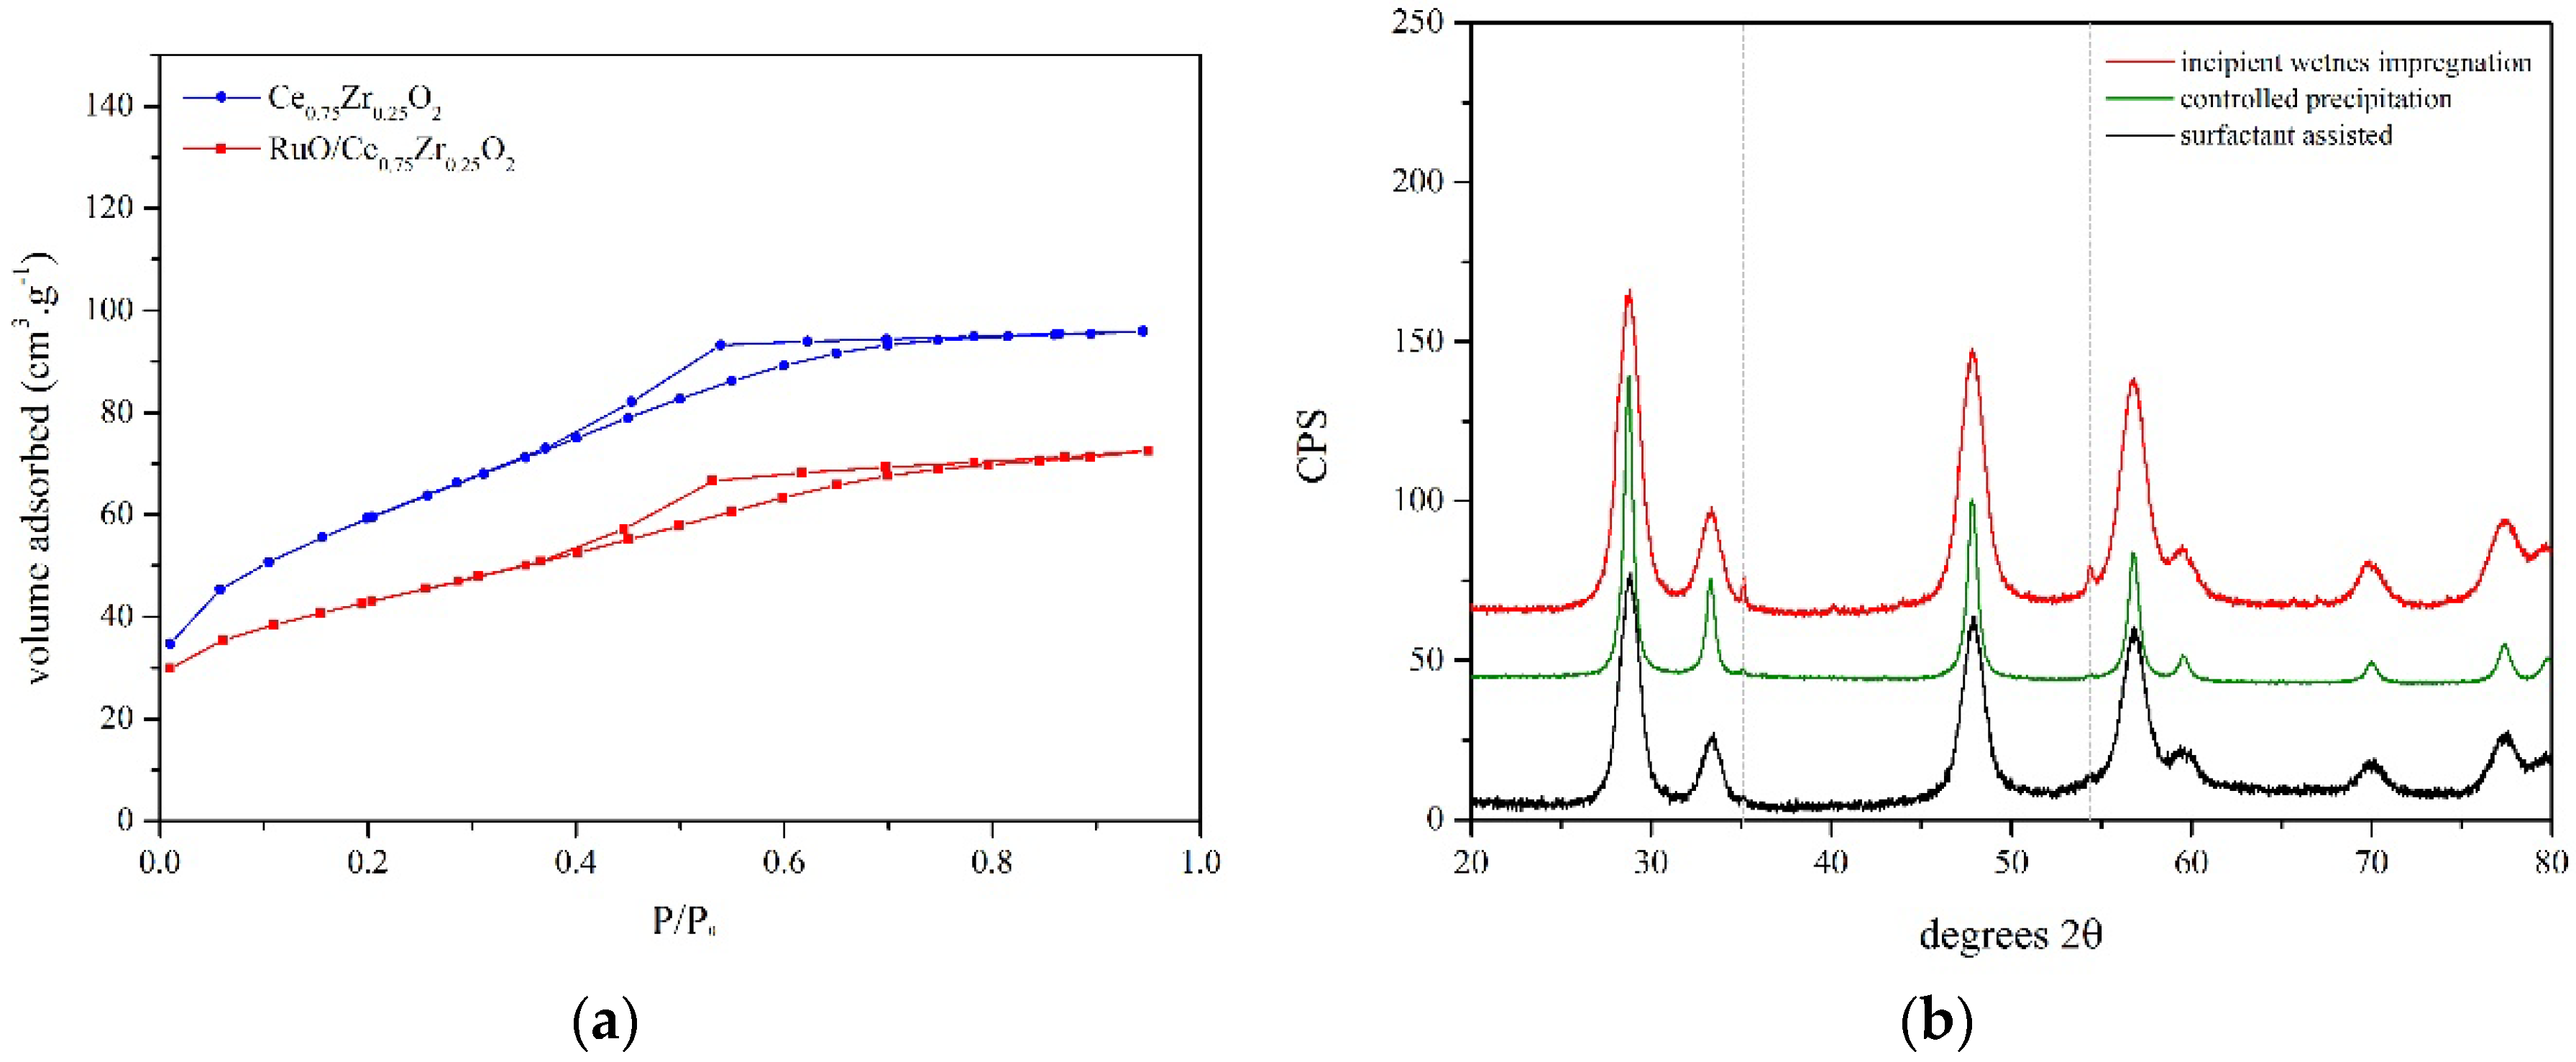
A novel ruthenium based ATR catalyst consisting of 2% ruthenium on a ceria zirconia support was developed fulfilling the requirements of ReforCELL (active and stable catalyst at low temperature ~600 °C). The synthesis of the catalyst is based on a sequential procedure where first the ceria-zirconia support, having the overall formula Ce0.75Zr0.25O2, is prepared. This support is then fractionized to the desired particle size and subsequently loaded with the active ruthenium metal. Initial tests showed that controlled precipitation gives the best result for the support in terms of surface area and particle size.
A set of different support particle sizes was sent to TU/e for testing of the fluidization behaviour in a fluidized bed reactor. The tests showed stable fluidization behaviour for the different particle sizes. In addition to the support an inert material having the same bulk density and particle size as the support was sent to TU/e. Fluidization tests showed that there was no separation of the support and inert filler under fluidization conditions. From the tests the fraction having a particle size of 125–250 µm was chosen as the most interesting candidate for the pilot scale reactor.
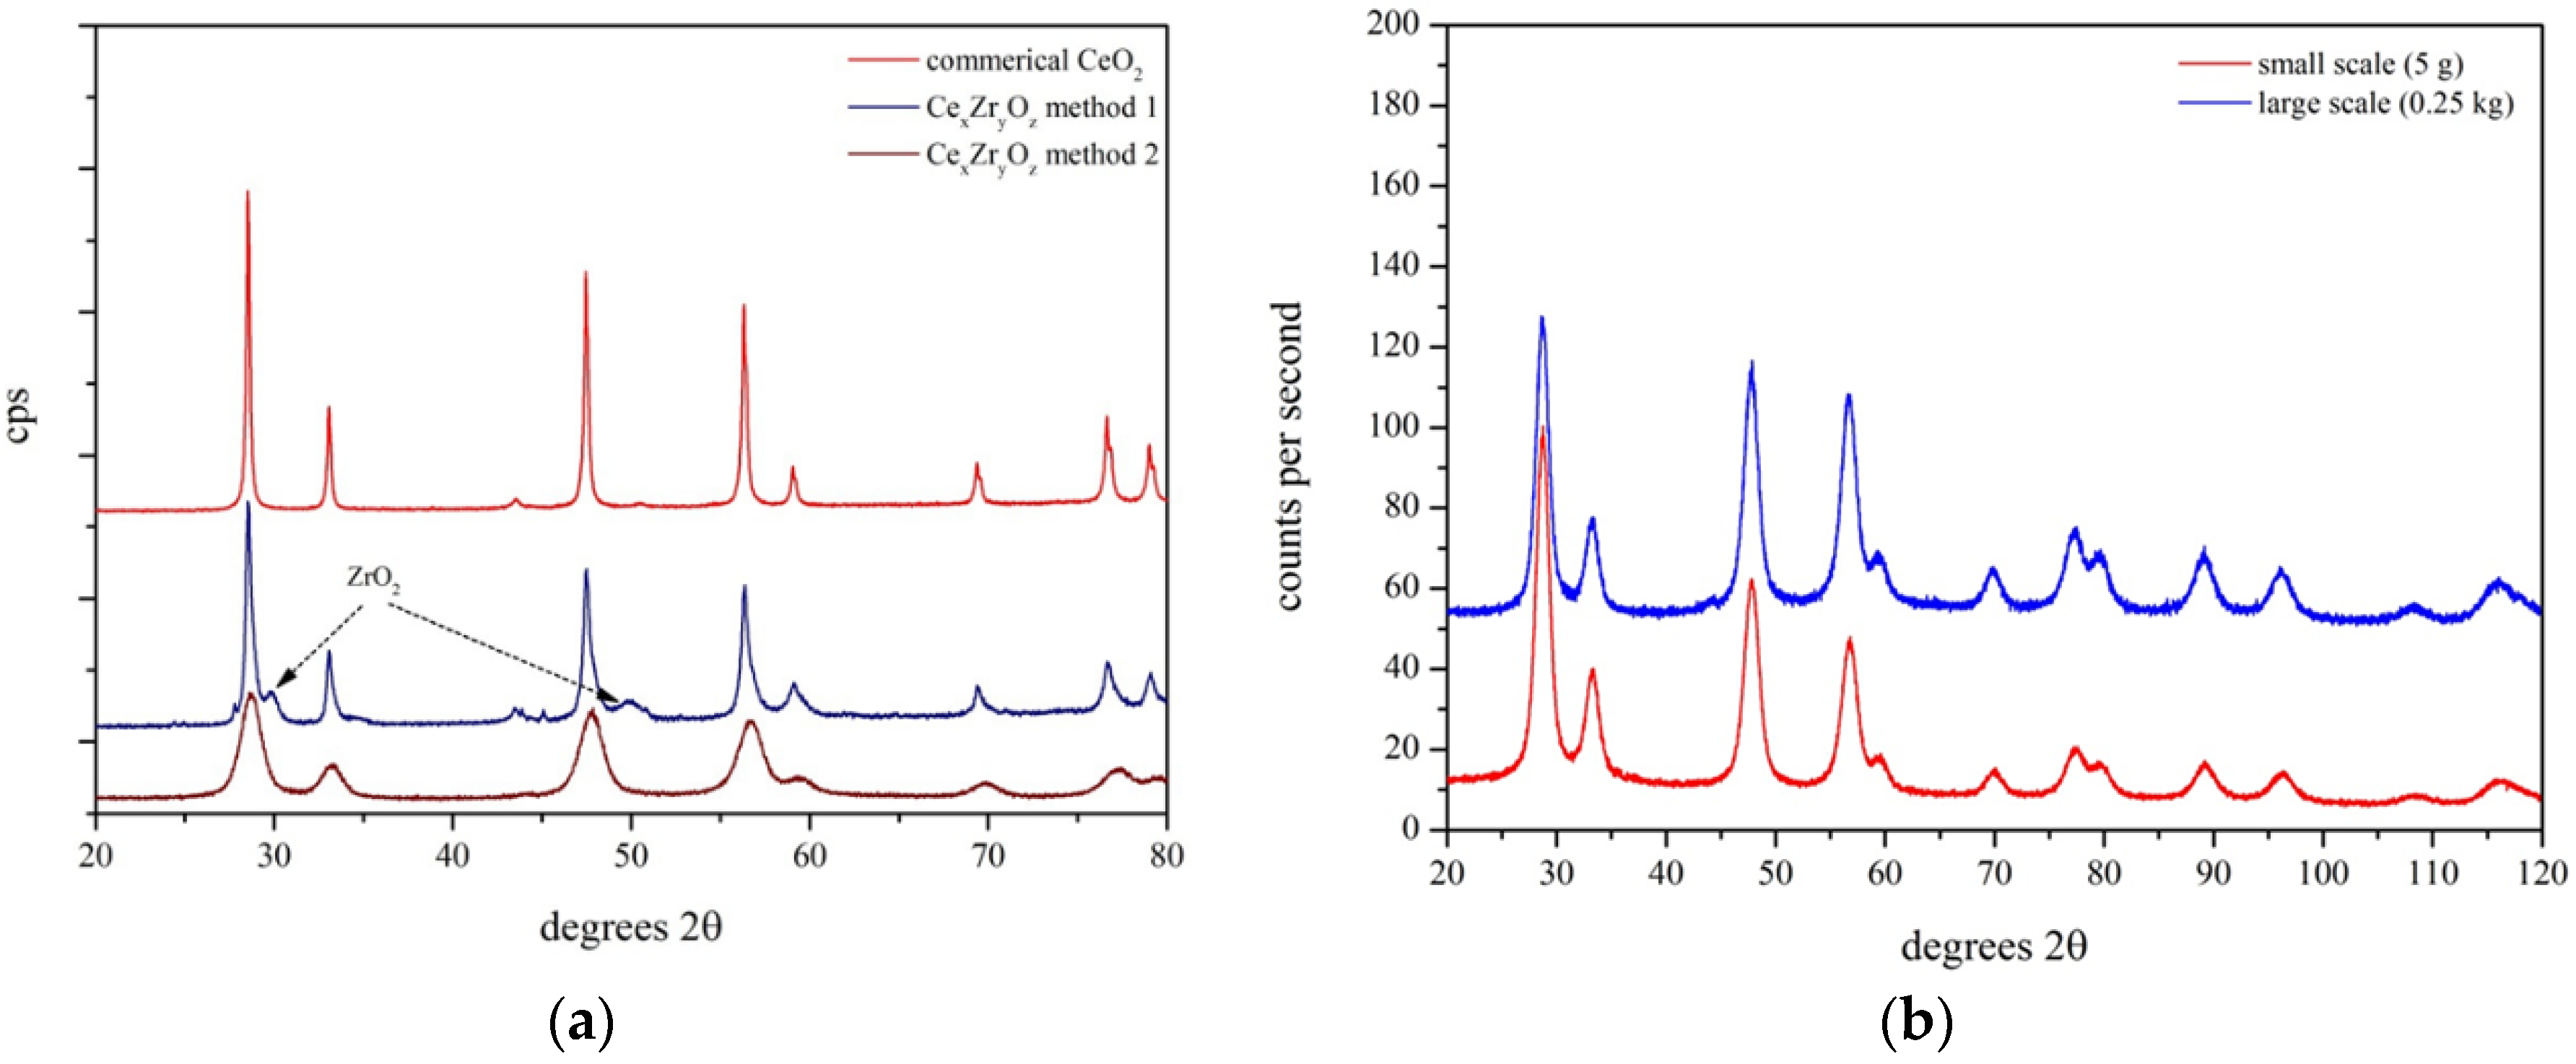
XRD analysis of the Ce
0.75Zr
0.25O
2 support shows that the material exhibits the cubic structure of the ceria. The absence of monoclinic and tetragonal zirconia phases, when using the co-precipitation methods, indicates that the zirconium is incorporated into the ceria structure (
Figure 14). The average crystallite size of 30 nm as derived from the line broadening is in accordance with the high resolution TEM images of the material. From the XRD and physisorption there is no difference between the materials made on laboratory or kilogram scale. This shows that the support was successfully prepared at kilogram scale. The high BET surface area of ~90 m
2/g is a direct result of the small crystallite size as seen in the XRD and TEM measurements.
The ruthenium was loaded onto the support via controlled precipitation. This technique combines a good dispersion with the possibility of upscaling whereas incipient wetness has a poor dispersion and surfactant assisted routes are more difficult to scale up. The ruthenium load of 2% was confirmed by XPS analysis of the catalyst. Both XRD and N
2 physisorption did not show large changes in the material after the ruthenium loading (
Figure 15), which shows that the original structure of the support was preserved during the loading.
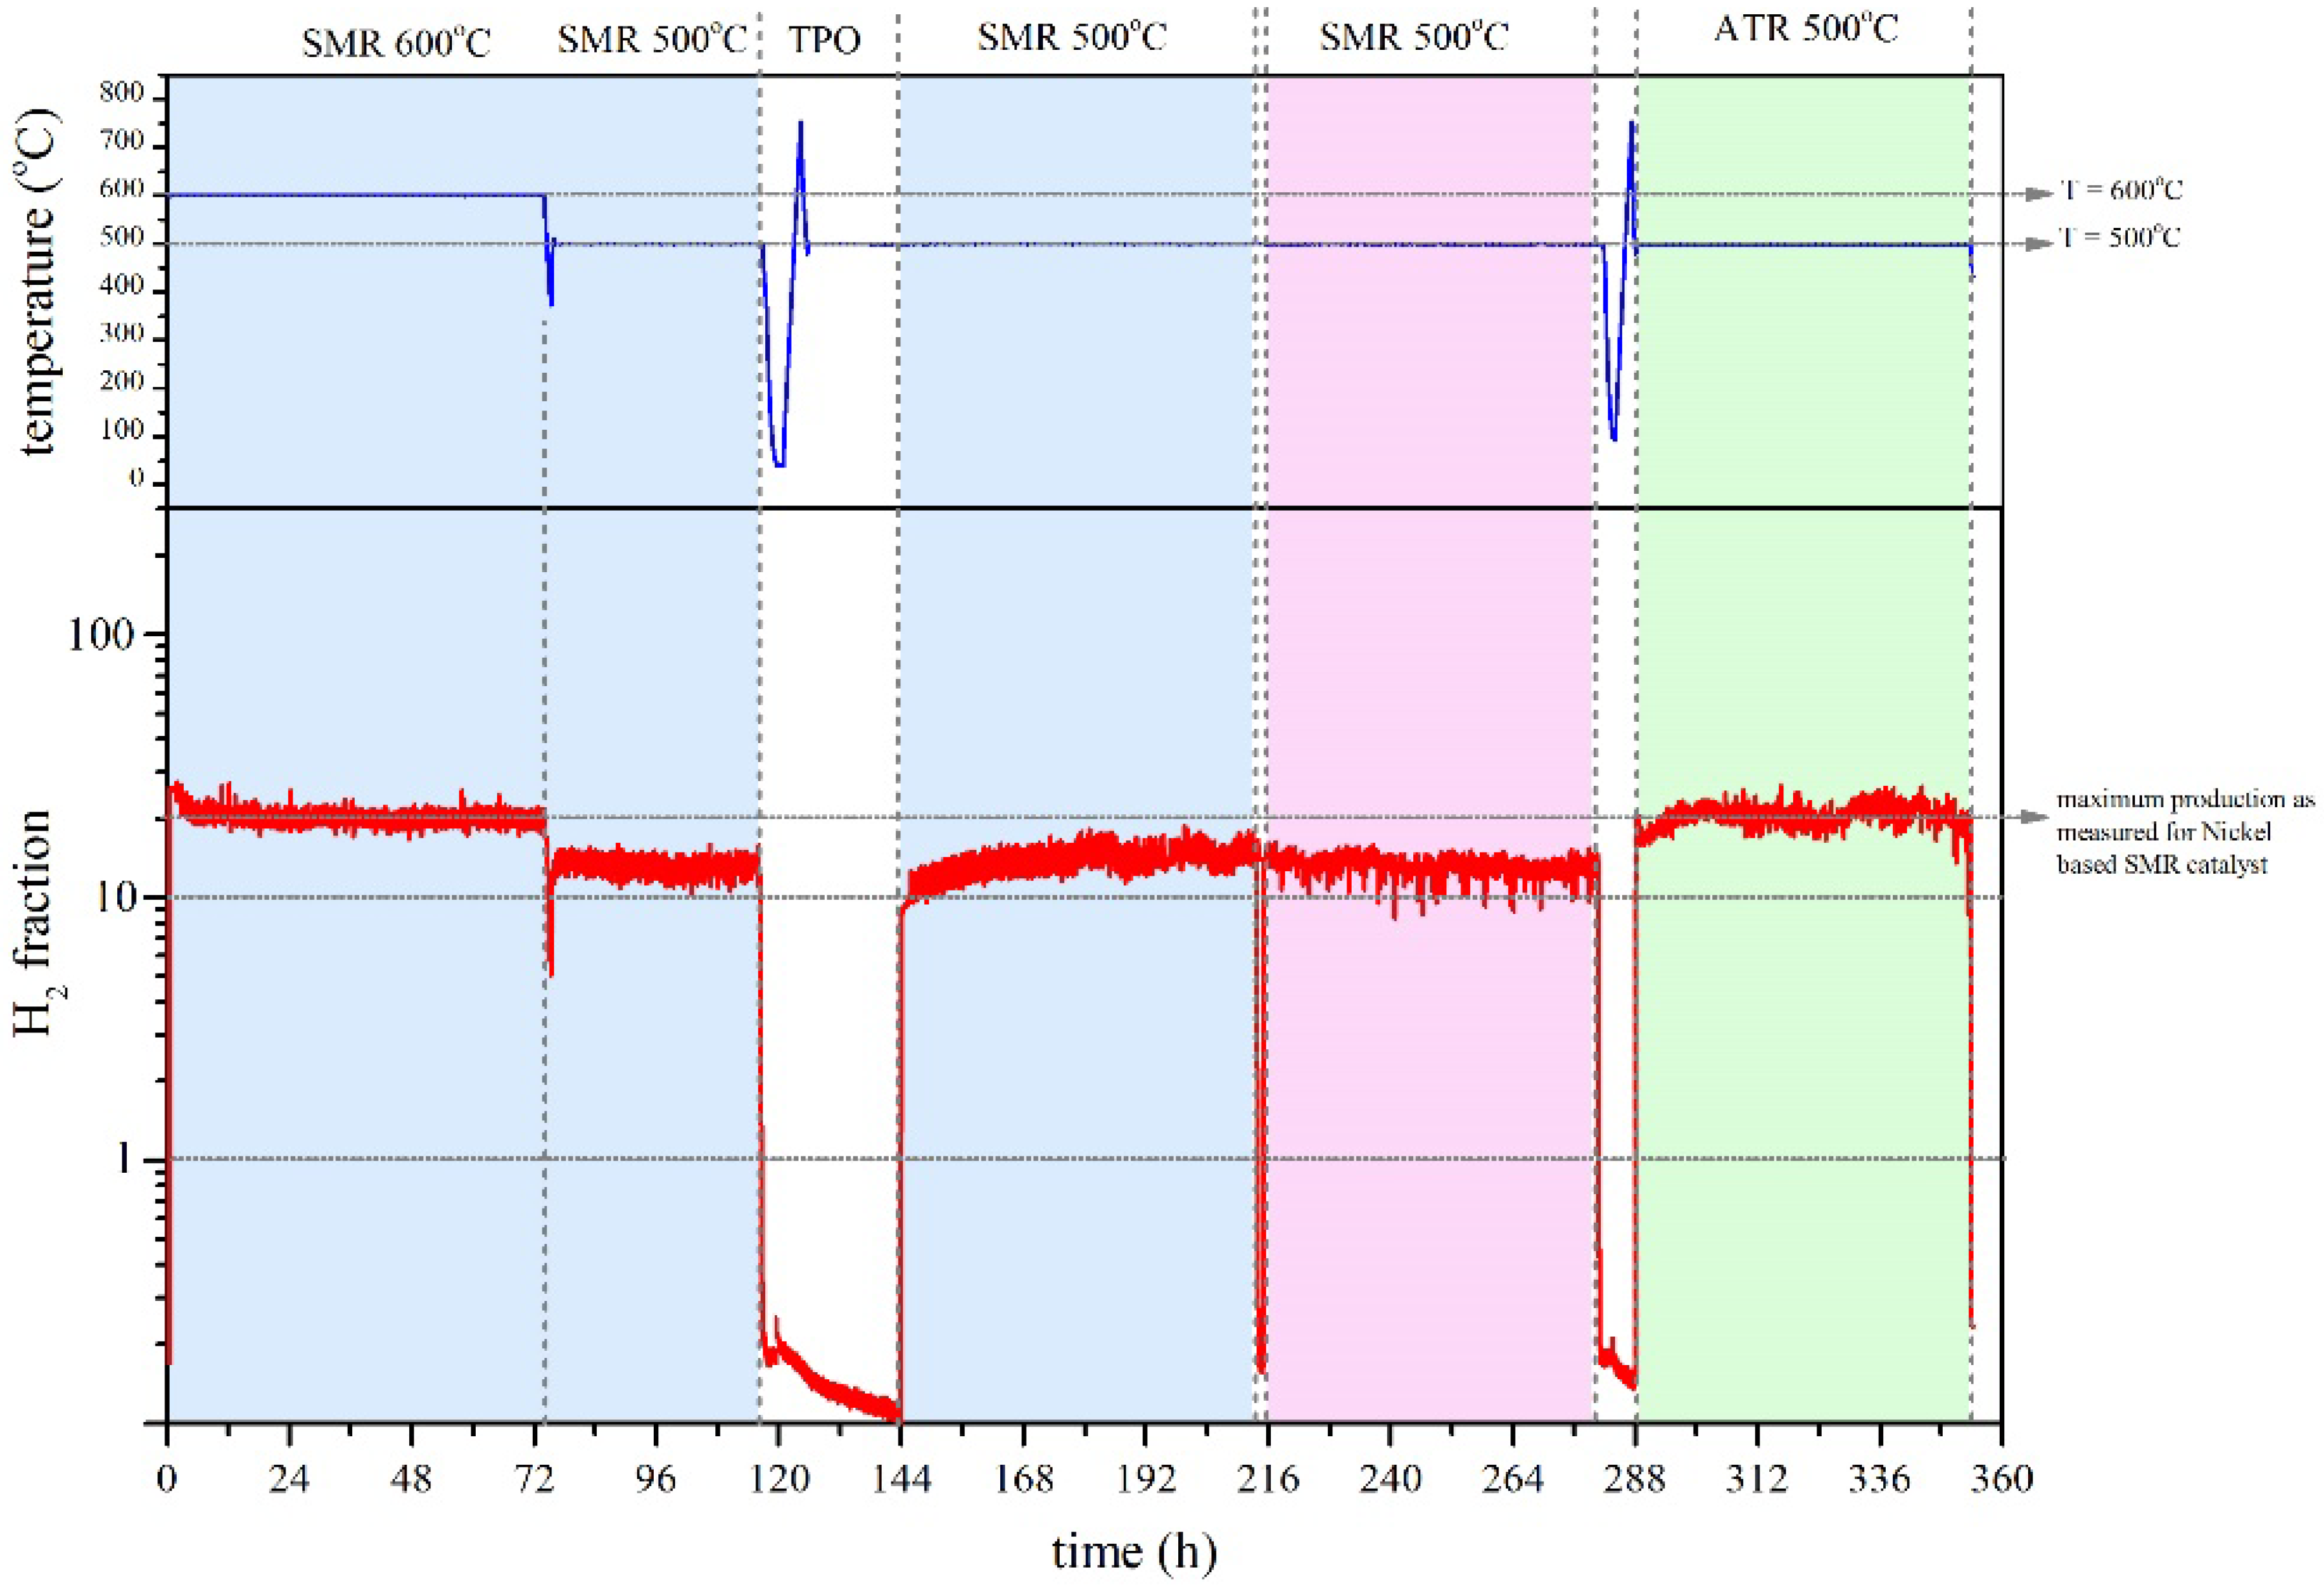
The new catalyst was tested for its performance in a custom built lab scale reactor. During the test, the conditions were varied to test the performance of the catalyst under the various conditions that can be expected in the pilot plant reactor.
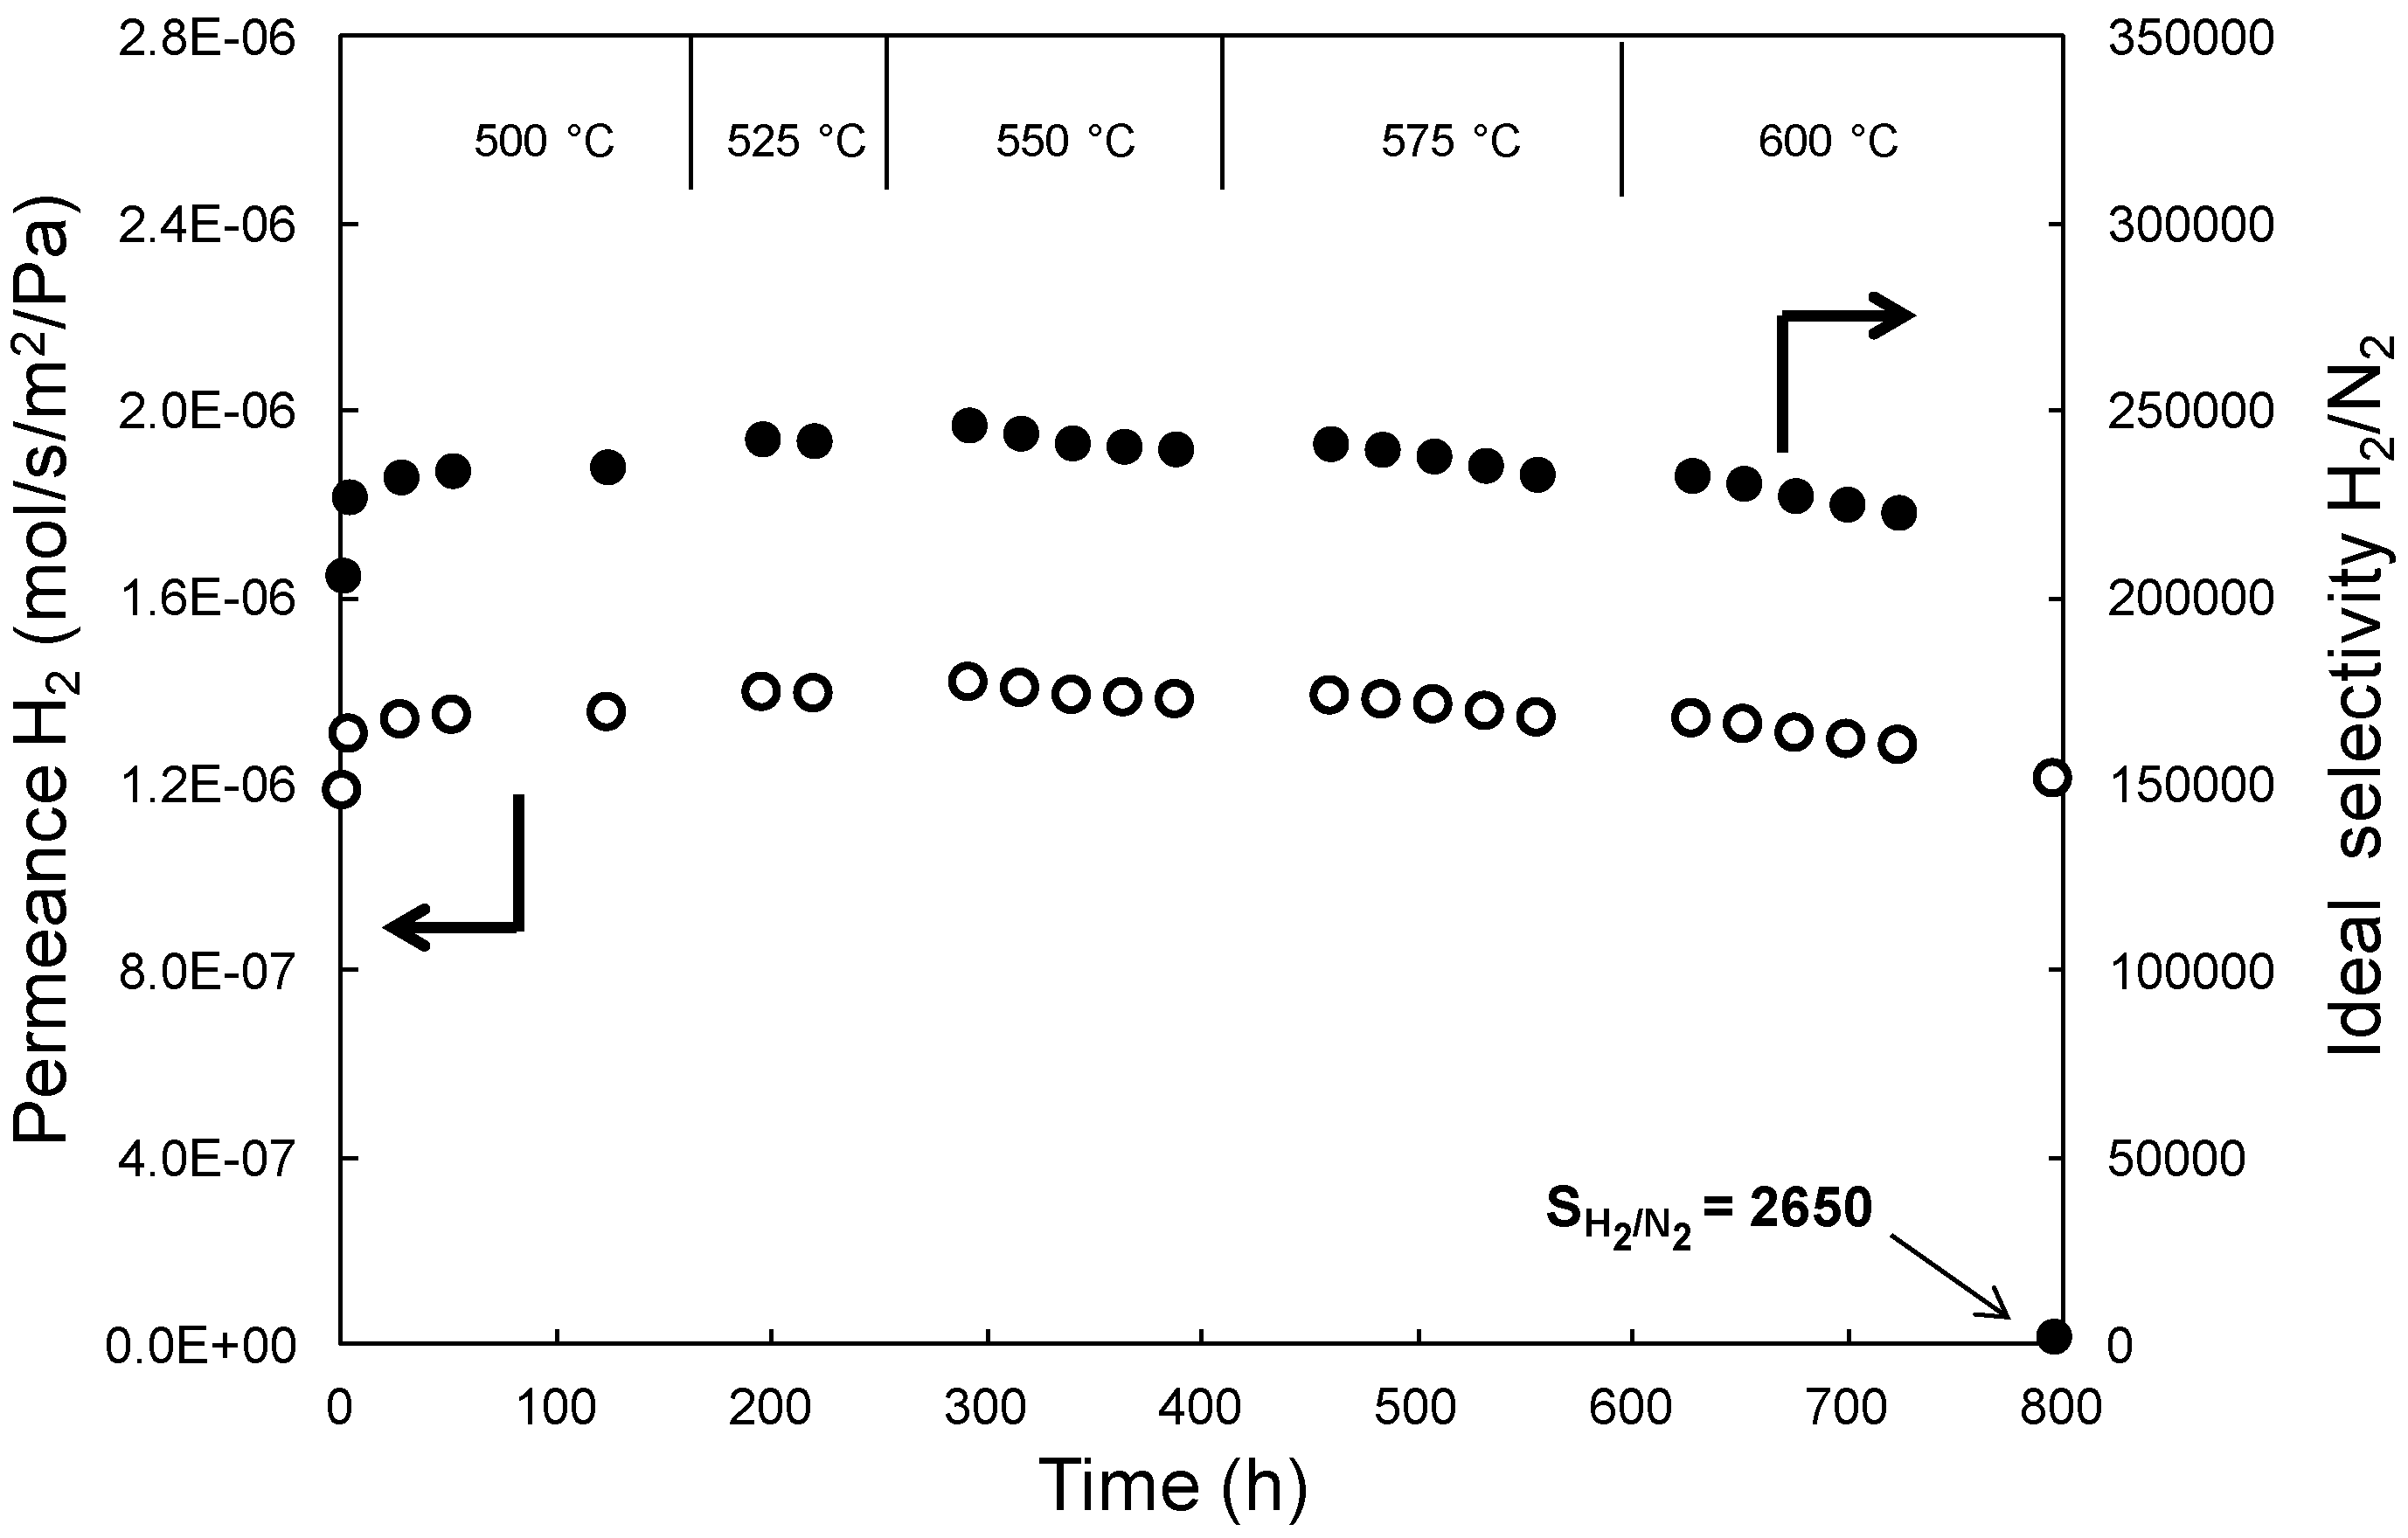
Figure 16 gives an overview of the performance of the ruthenium based ATR catalyst both under SMR and ATR conditions. The graph shows that the hydrogen production over the catalyst is stable under the various SMR and ATR conditions, and that the catalyst operates at the desired low temperature window of 500–600 °C.
There are no commercially available Ni catalysts that meet the requirement of low temperature methane reforming targeted in the project. To meet with the demand of an active and stable catalyst at low temperature, catalysts based on Noble metals as Pt, Rh or Ru were developed. Based on scientific literature, such catalysts are particularly suitable when supports based on ceria or zirconia are employed, and especially mixed zirconia/ceria supports. Given noble metal pricing, Ru based catalysts would be most economical. The developed Ru based ATR catalyst achieved the required targets proposed in the project related to activity, selectivity, and stability. An important finding was that the catalyst is also active at significant lower temperature than originally anticipated (500 °C).
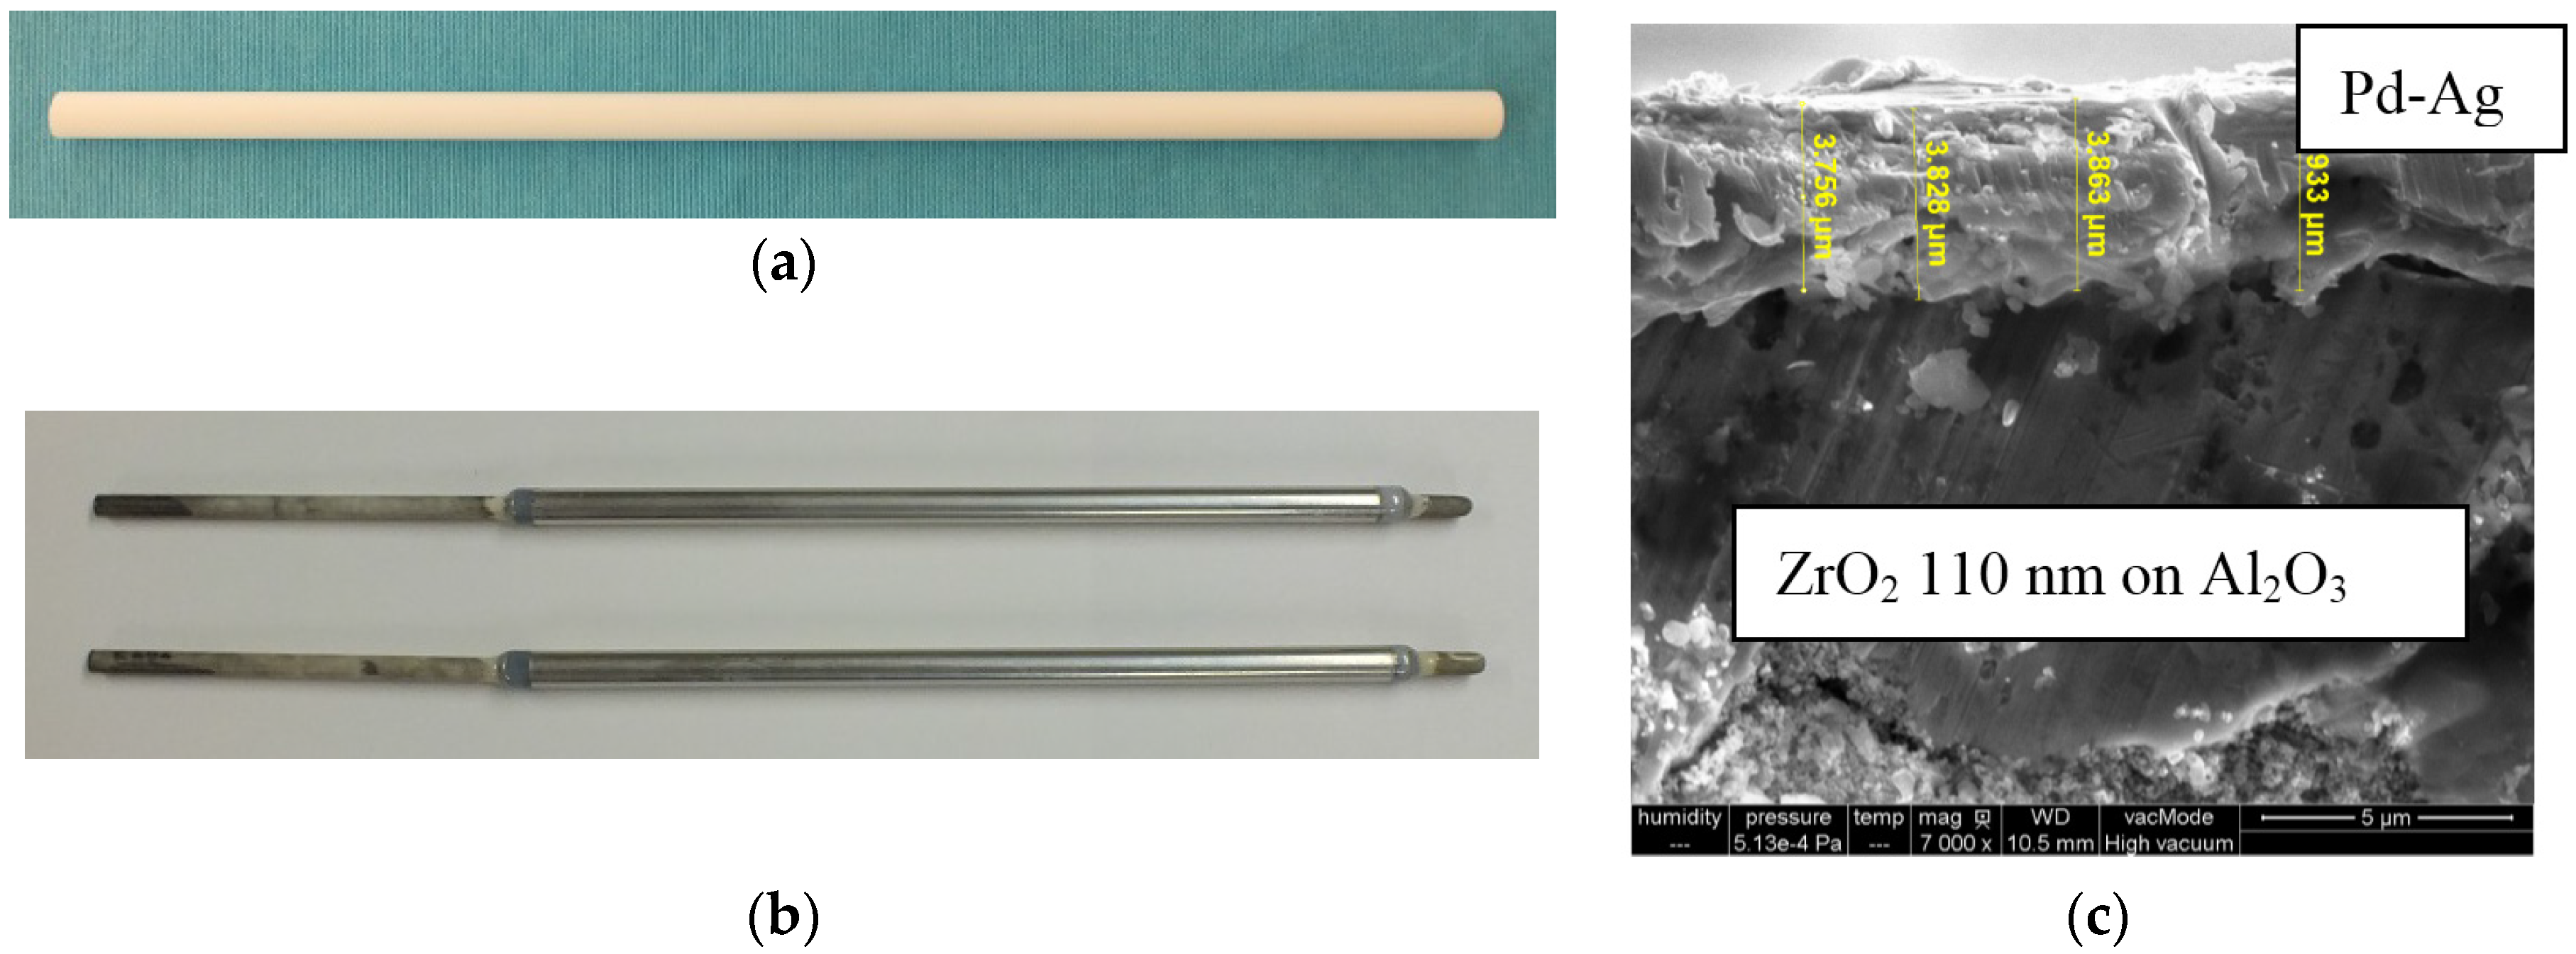
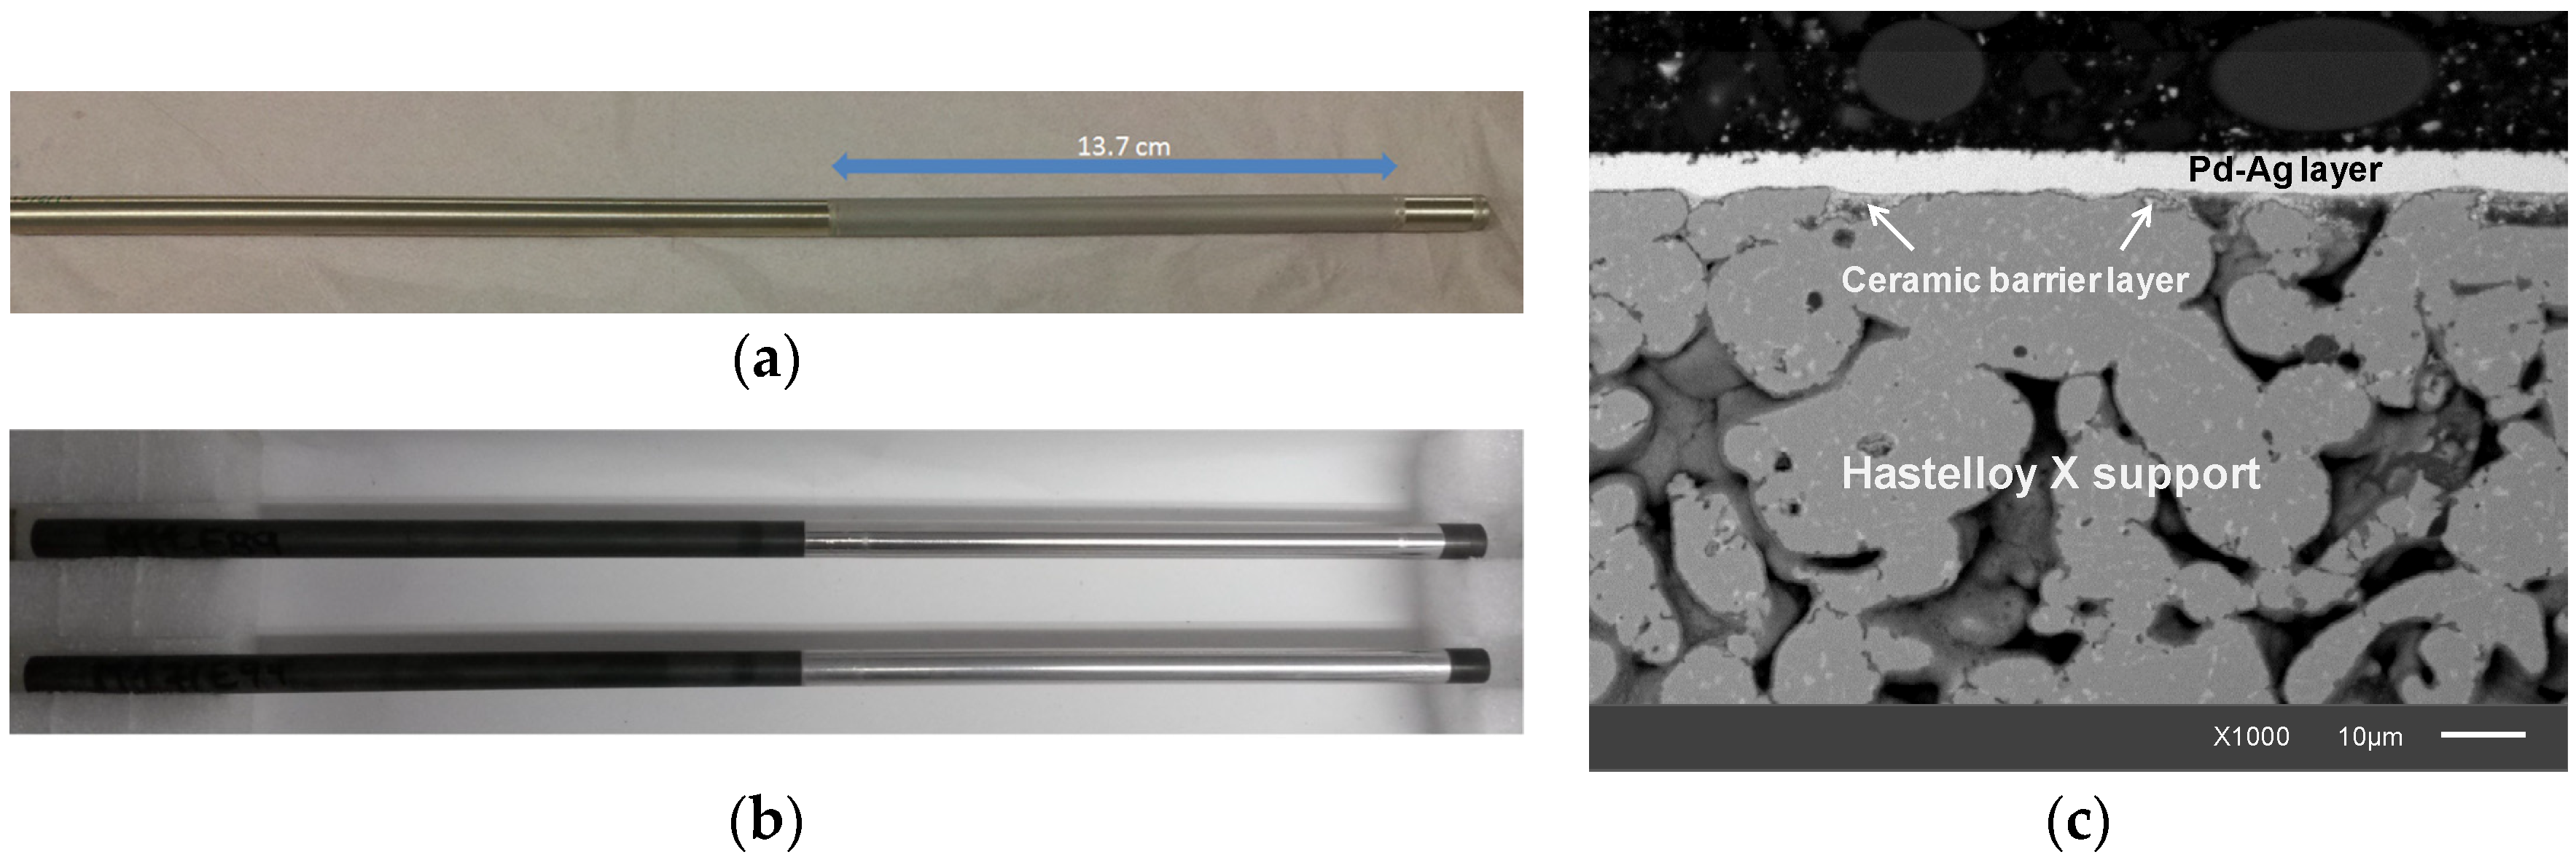
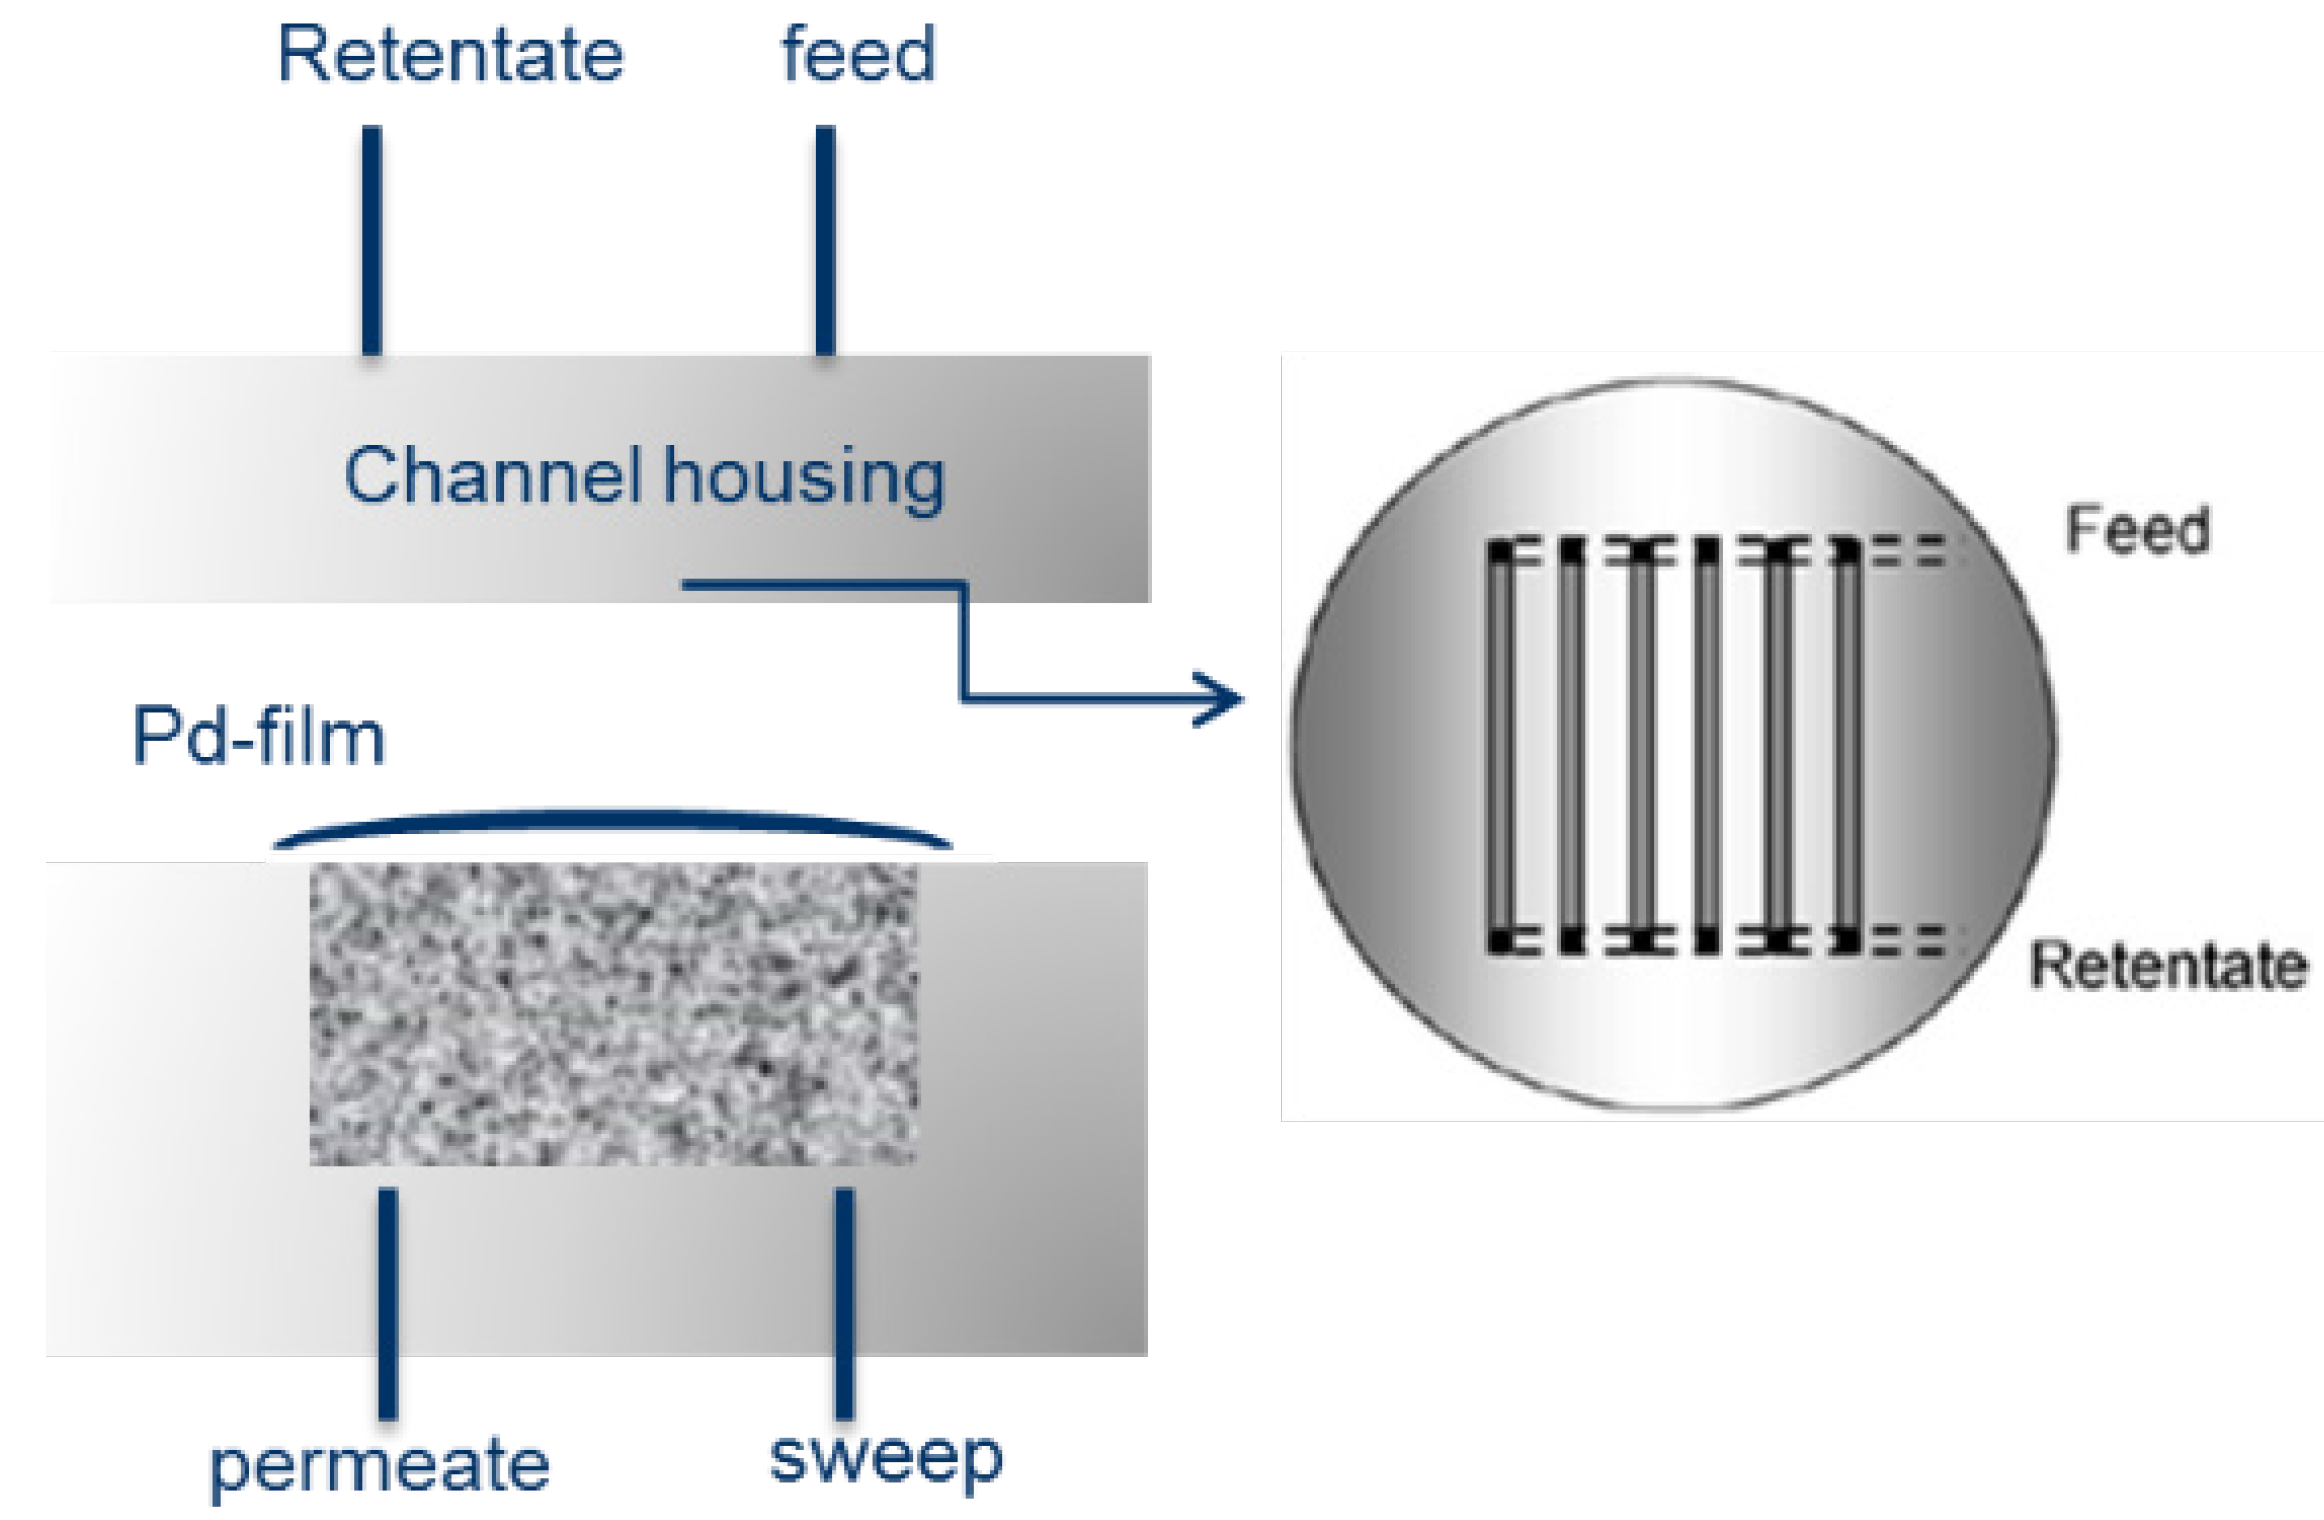
3.3. ATR Prototype
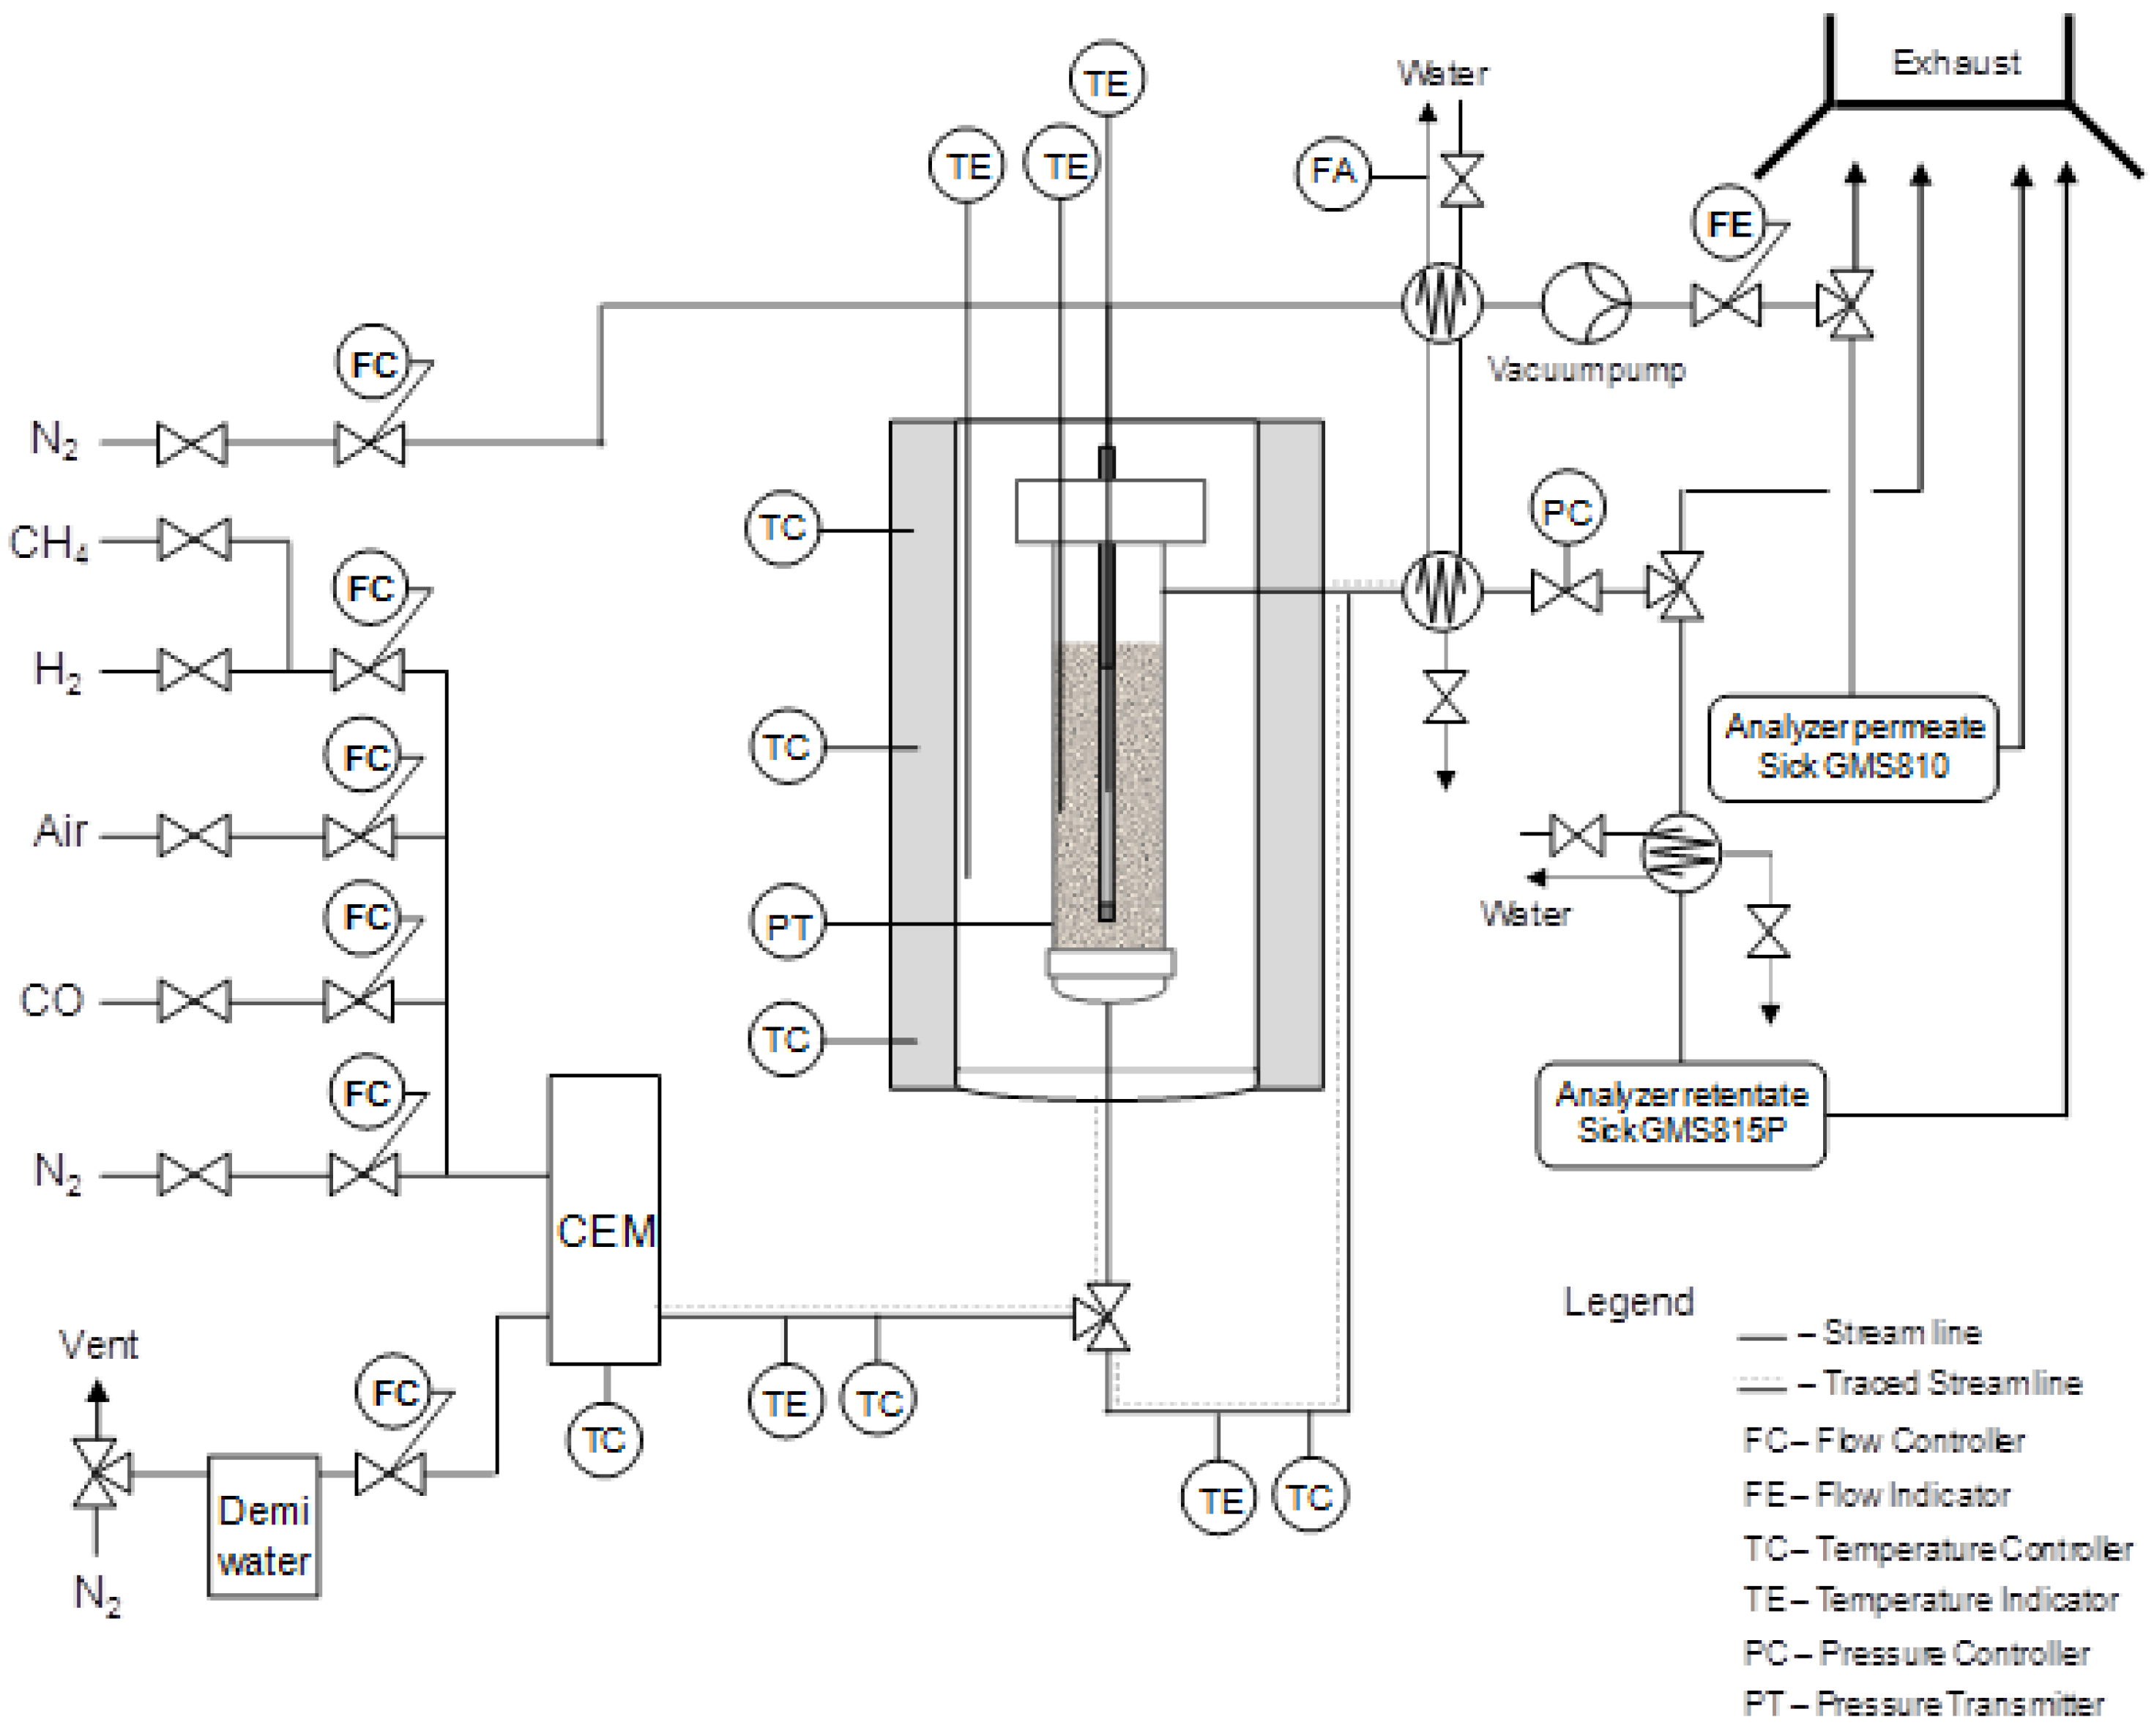
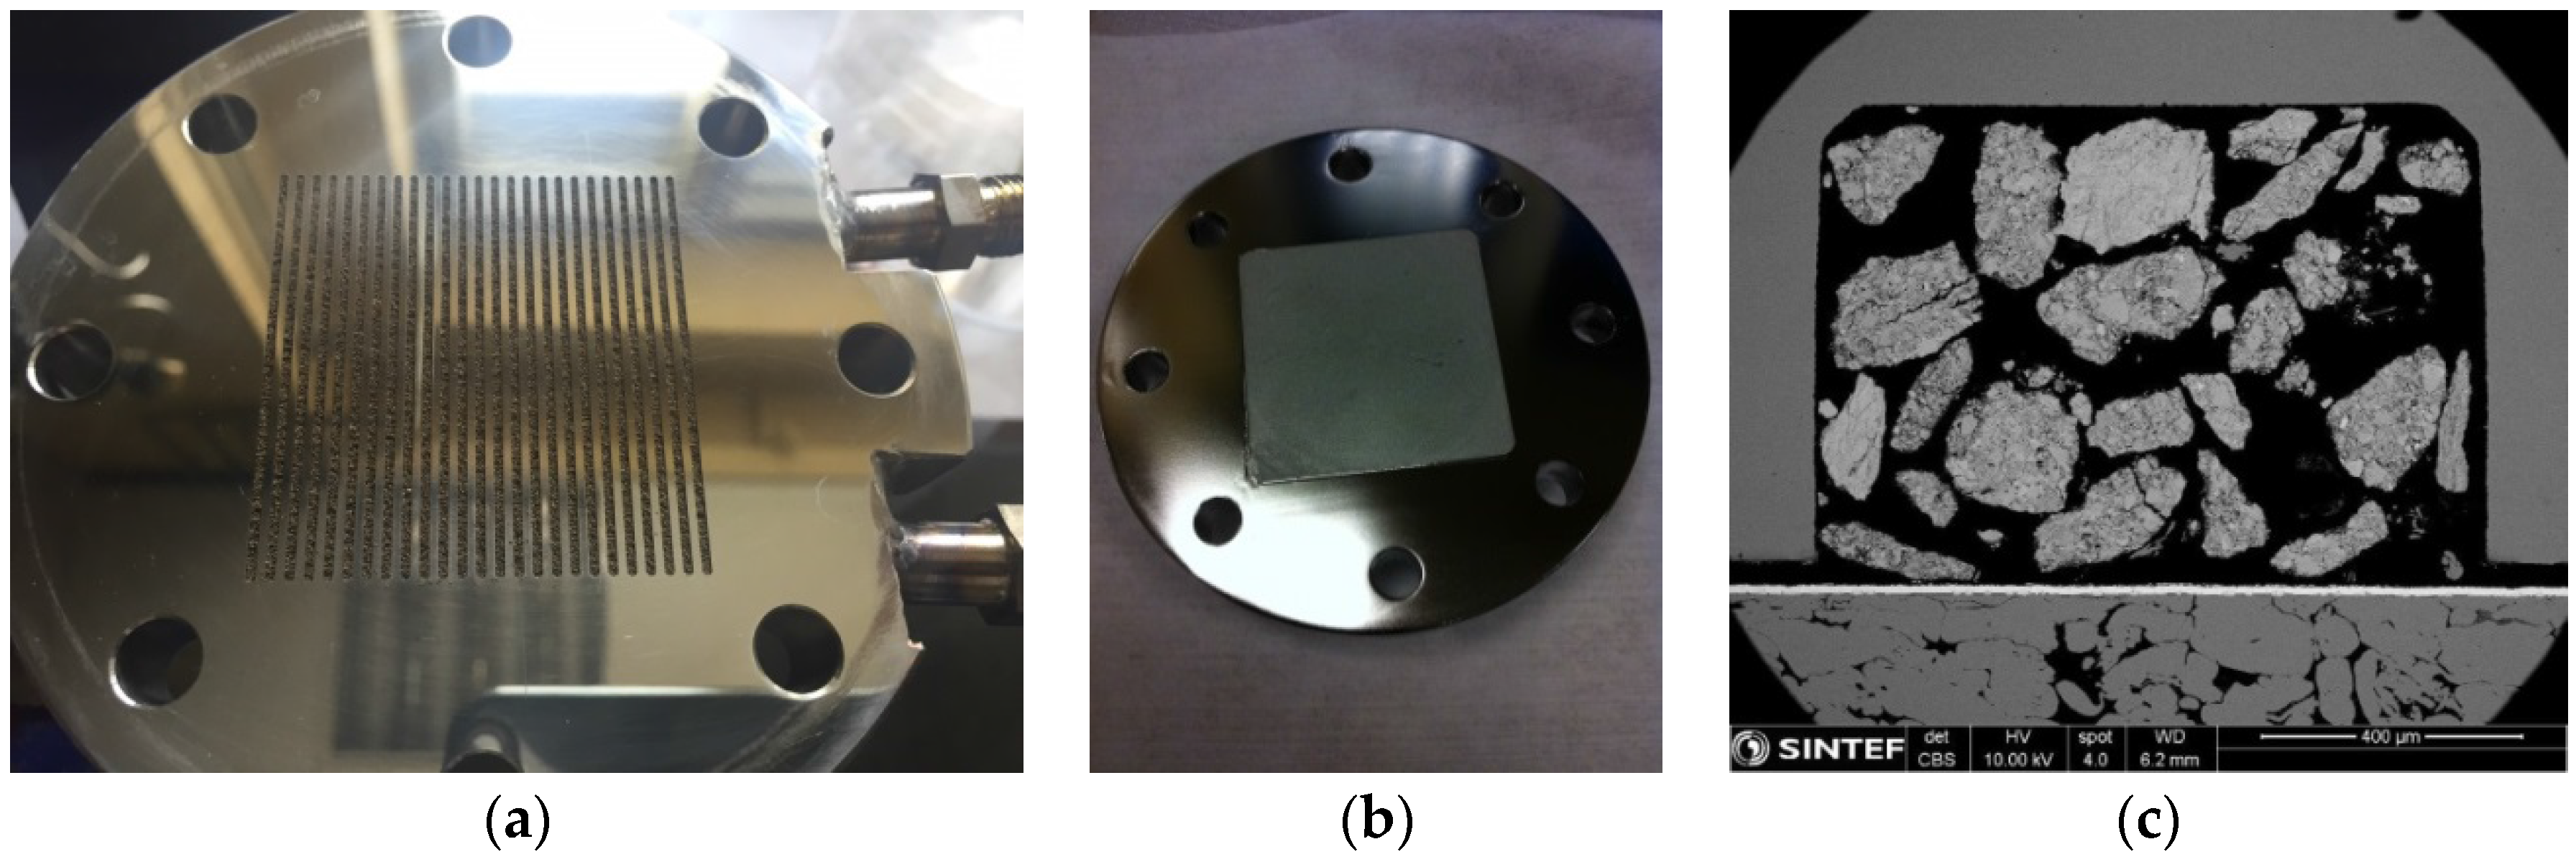
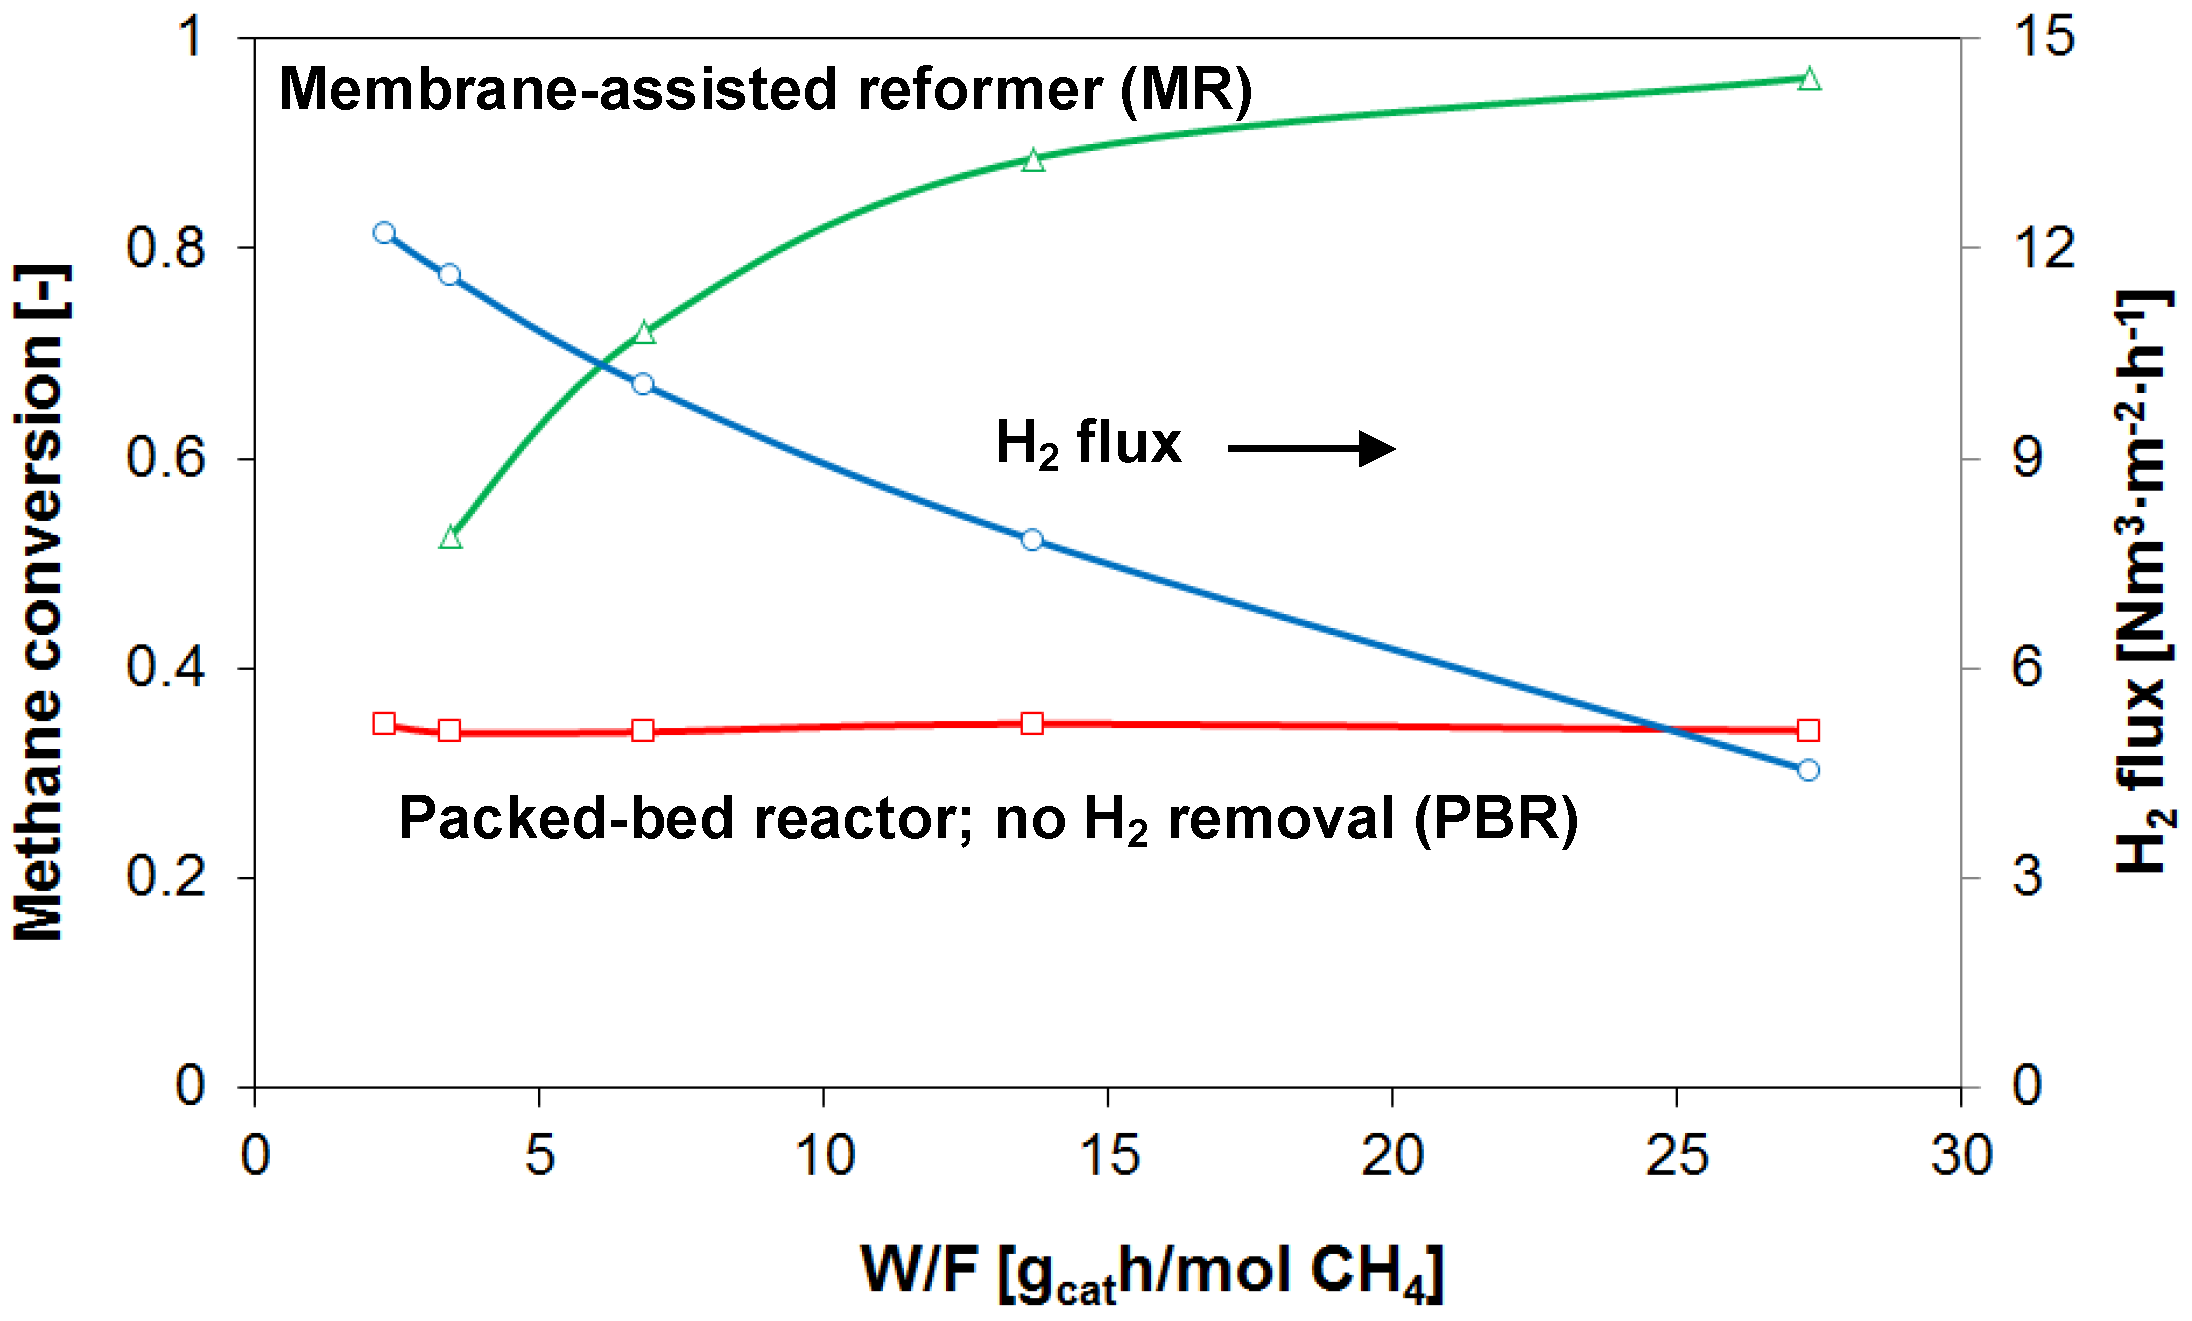
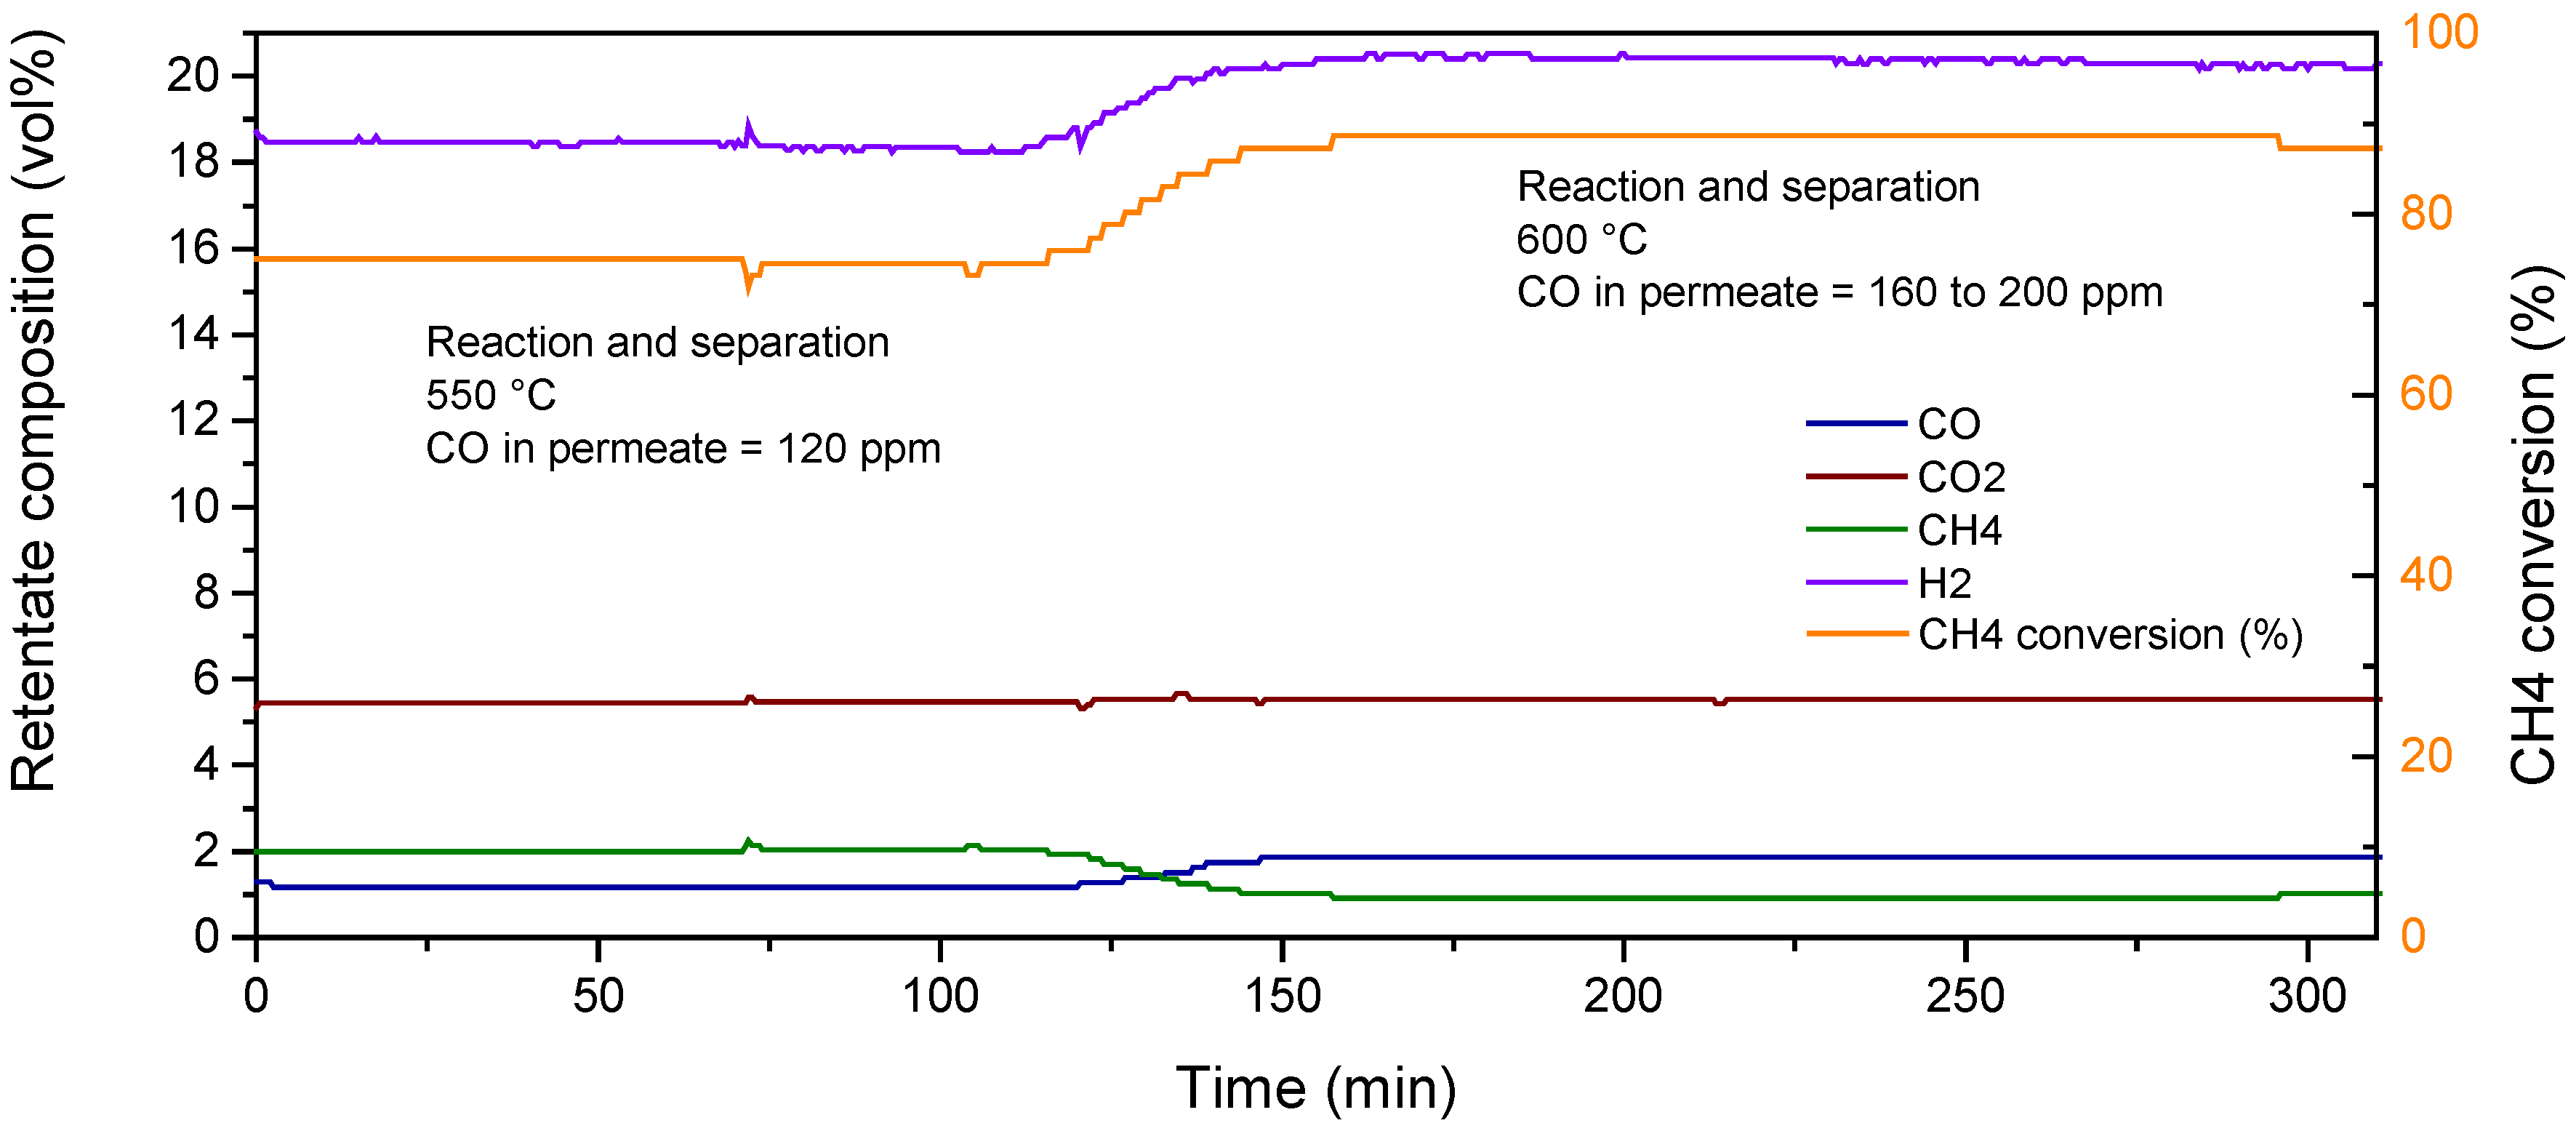
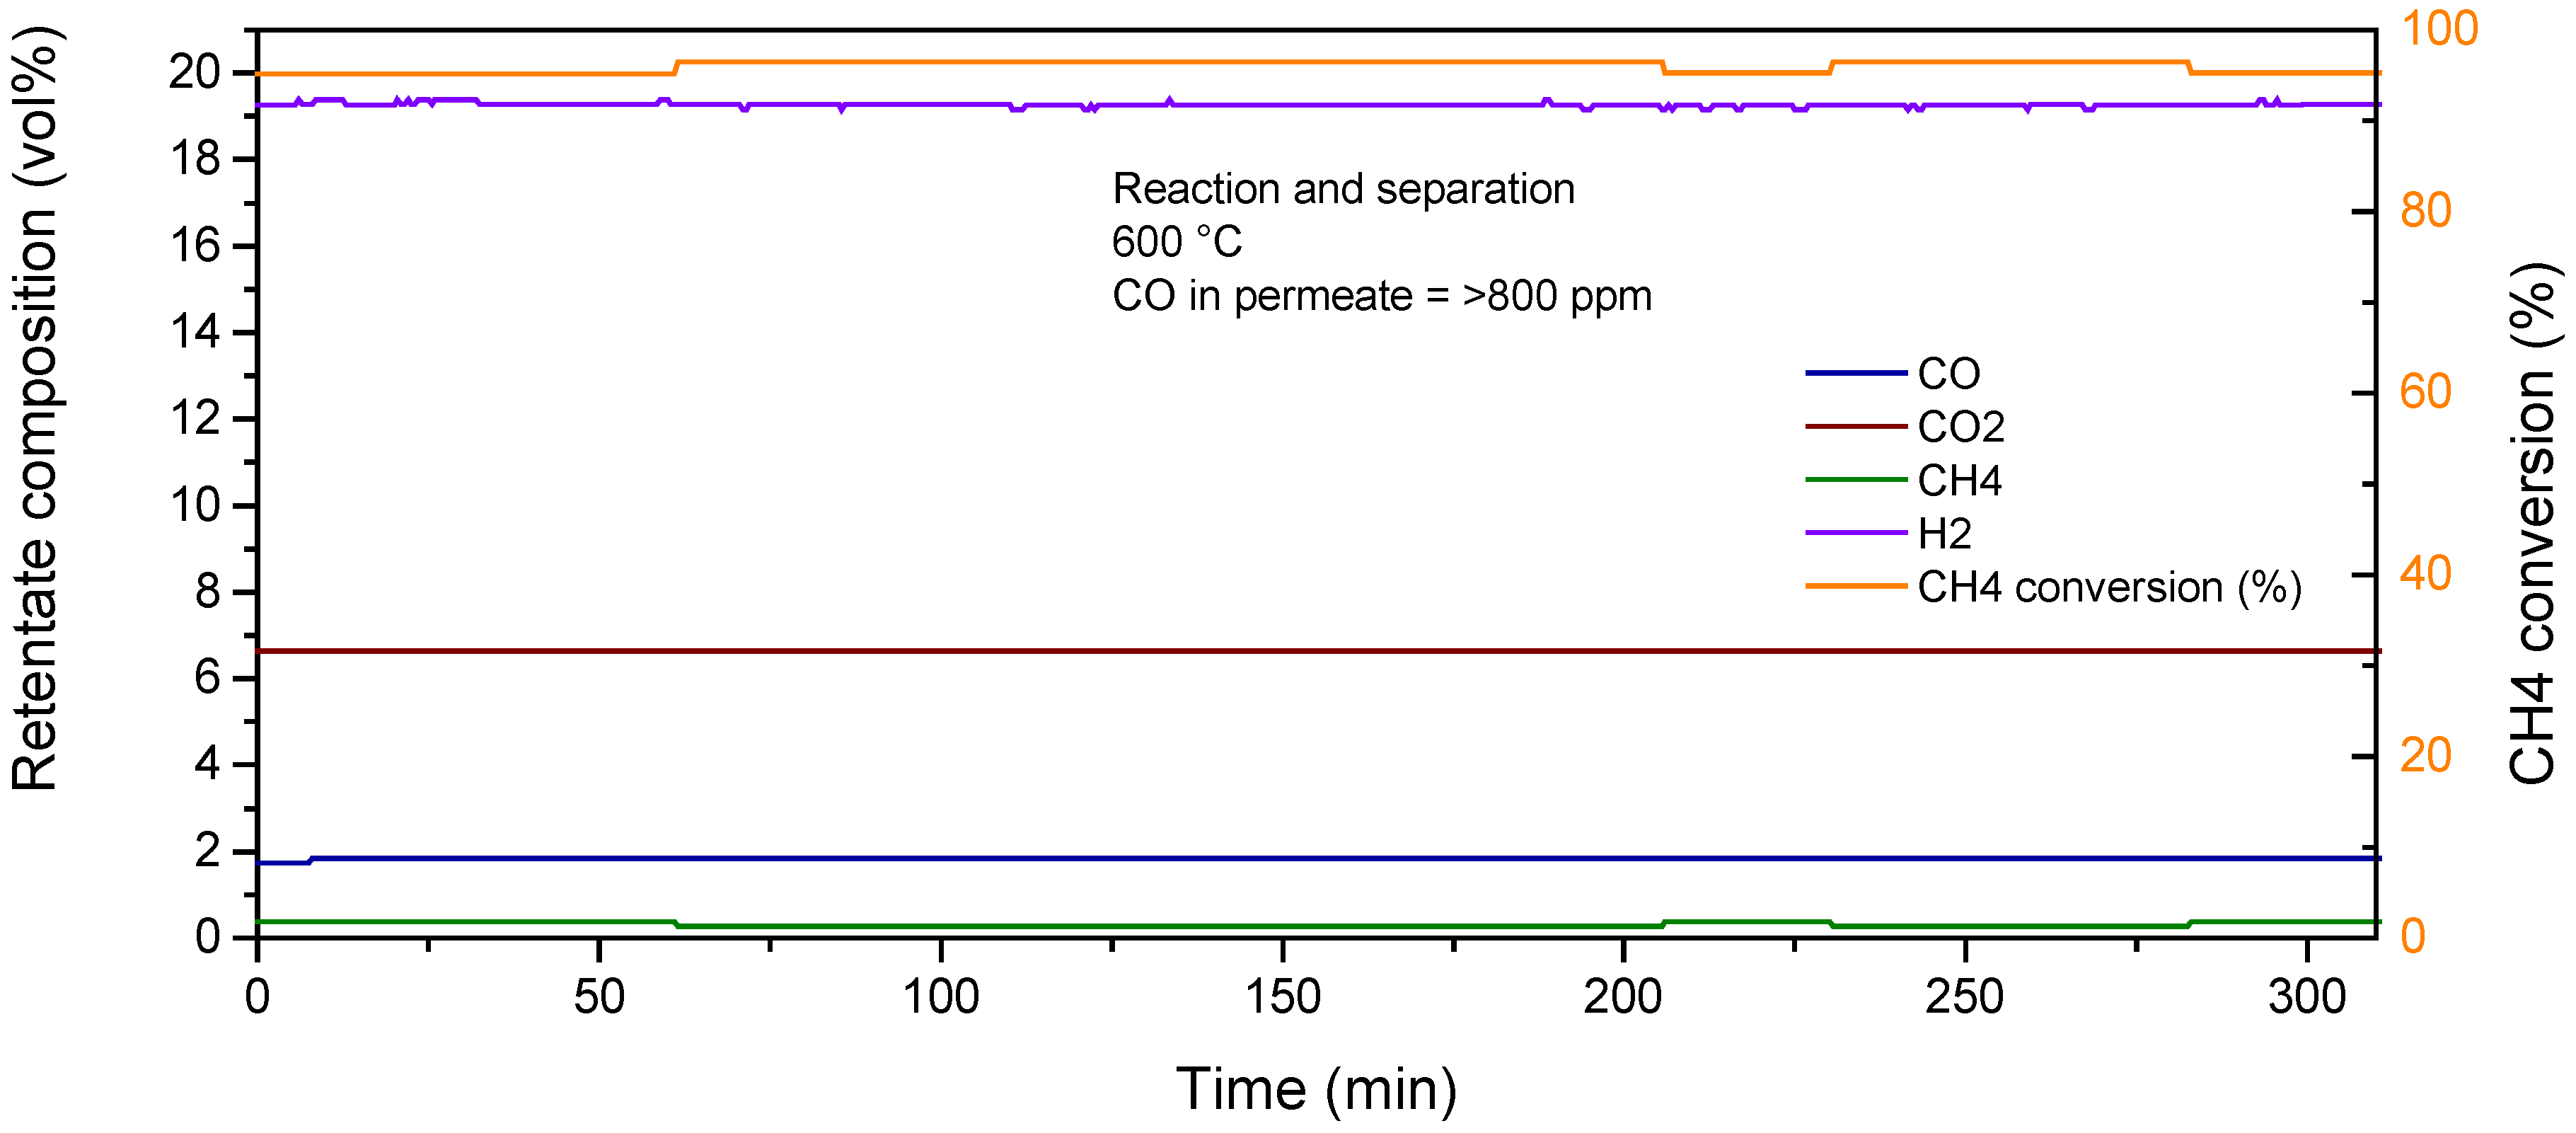
The membrane reactor was tested for different operating conditions with ranging pressure, temperature and S/C ratio. Difficulties were found in fragility of the ceramic supports of the membranes which failed early in the testing phase. An improved protocol for handling, assembling and testing the membranes was defined for further developments to reduce this risk. The remaining tests were performed at lower flows and without extraction of hydrogen. During the testing, the ATR reactor reached a stable production of 1.7 Nm3 of H2 per Nm3 of CH4 feed. Flow patterns, heat transfer limits, and integration possibilities of the reactor were identified. During testing, the performance was checked in the SCADA panel view. Several parameters (e.g., pressures, temperatures, flow rate, valve position, etc.), were also monitored by the graphical control panel.
A model was developed based on the results to simulate the fluidized bed membrane reactor. The model was used for calculation of membrane area and to analyse the influence of some variables such as reactor temperature, heat loss and operating load. The model also evaluates the required NG, air and steam flow rates to achieve the H2 production target, operating at autothermal condition.
Another model of the complete fuel processor including peripheral components of the balance of plant was also developed to describe the ATR-MR system performance. The system includes the ATR membrane reactor and the auxiliary units to recover the heat source from permeate and retentate streams. The model analyses the influence of some variables such as reactor temperature, heat loss and operating load, allowing an optimization procedure (CAPEX minimization) of the heat exchanging network. The results of the ATR-MR system model provide a sort of map of the required operating condition as a function of the H2 production target. By decreasing the hydrogen output, the O/C ratio increases, and the requirements for feed of steam relative to the Natural Gas feed (S/C) decreases.
3.4. Integration and Validation in m-CHP System
The technical objective of this activity was the definition of the optimal lay-out for the micro-CHP system when integrating the membrane reactor and the assessment of its performance. Firstly, the indexes adopted for comparing the different configurations were defined. They are the net electric efficiency, net thermal efficiency, and overall efficiency which are defined in the EU directive for cogeneration (2004/8/EC)).
where
| Thermal input power |
| Net power output |
| Net thermal power output |
In addition to these, the second law analysis of the micro-CHP system is carried out to assess the overall energy losses in the conversion process. In the second law analysis, the net thermal power output is weighed by means of the efficiency of an ideal process converting the heat into work as expressed below.
The ideal efficiency is evaluated with reference to the Lorentz cycle, because the heat produced by the micro-CHP system is available at variable temperature rather than at constant temperature.
The second law efficiency is calculated as follows:
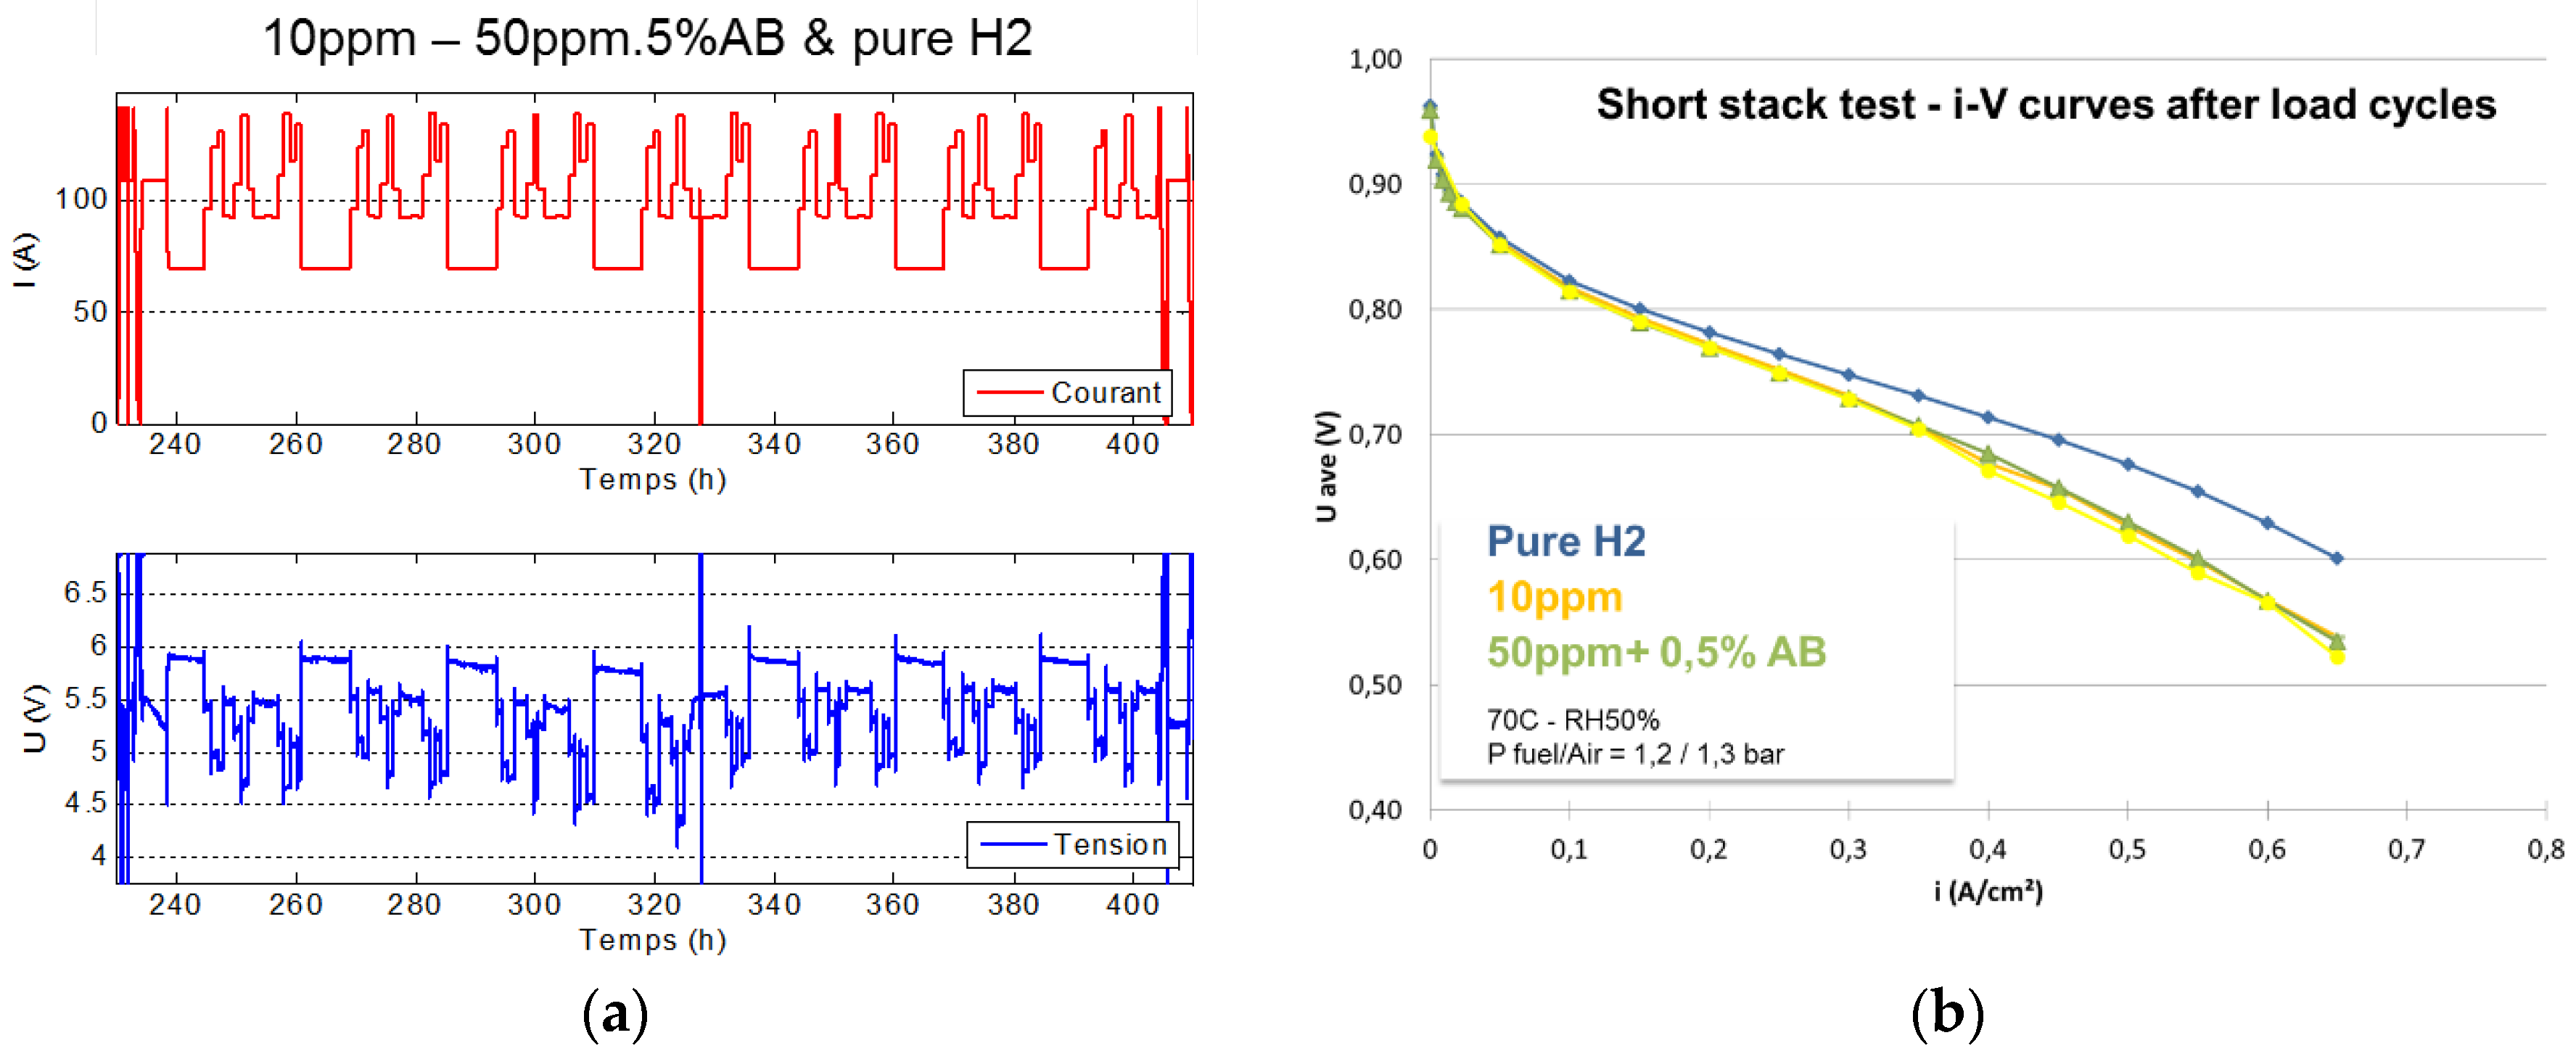
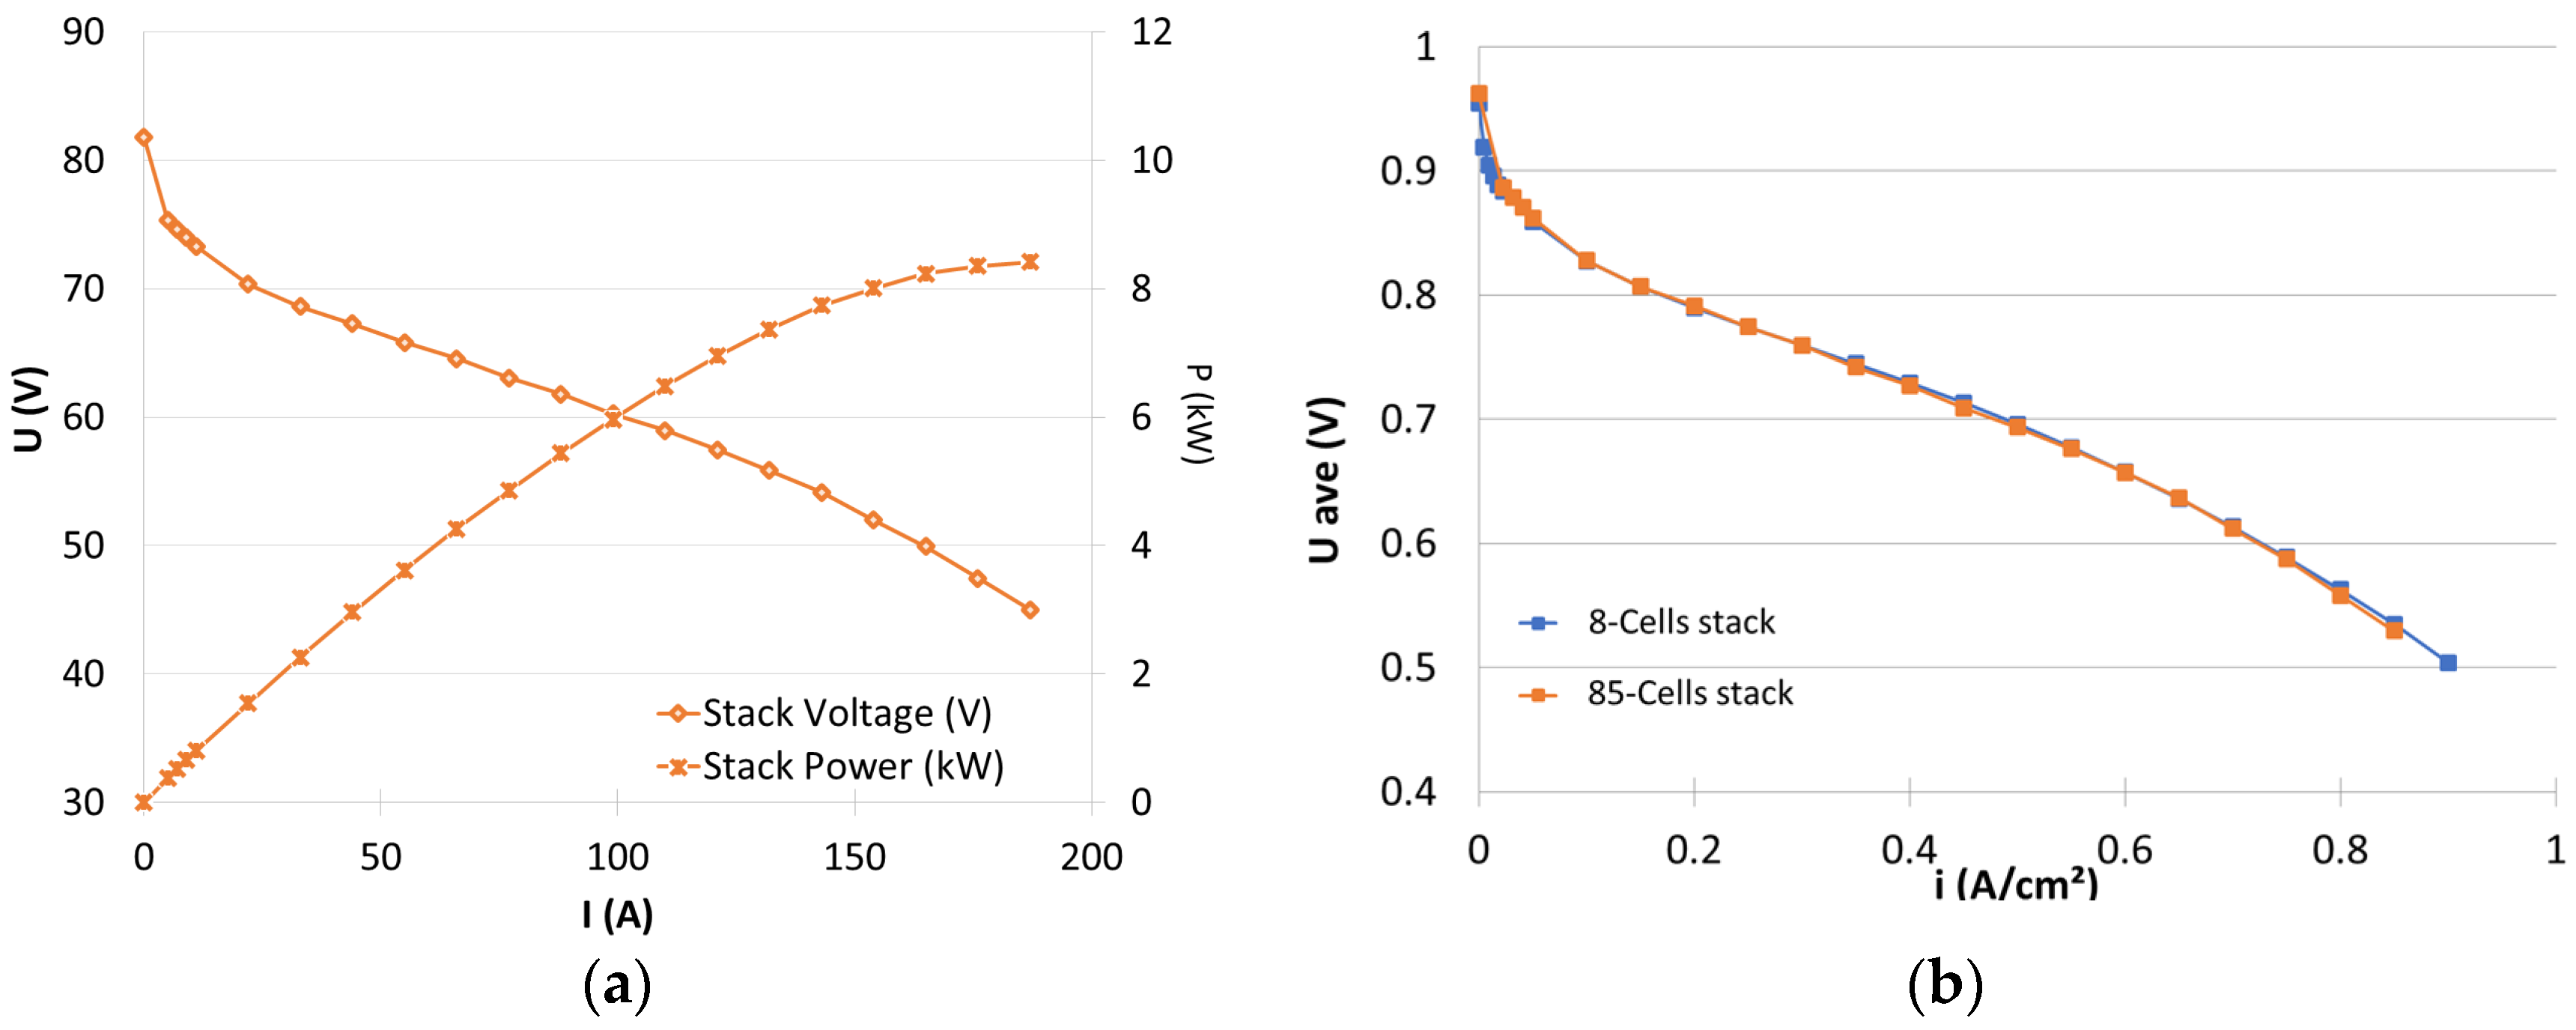
Starting from the measured performance of the fuel stack prototype (see
Section 2.5) and the membrane reactor characteristics (see
Section 3.3) measured in the project, the m-CHP system layout was optimised for integrating the membrane reactor and the PEM FC stack. The optimization took into account both efficiency and cost aspects: in particular, the membrane surface area was monitored in the optimization being the component with the largest variation.
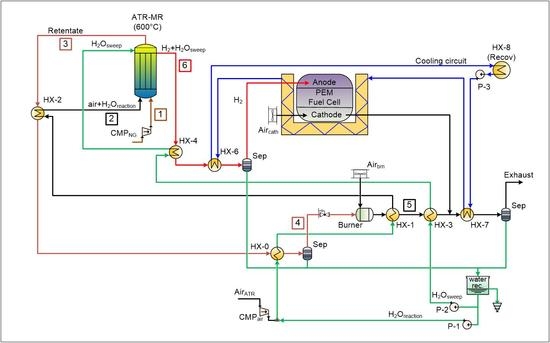
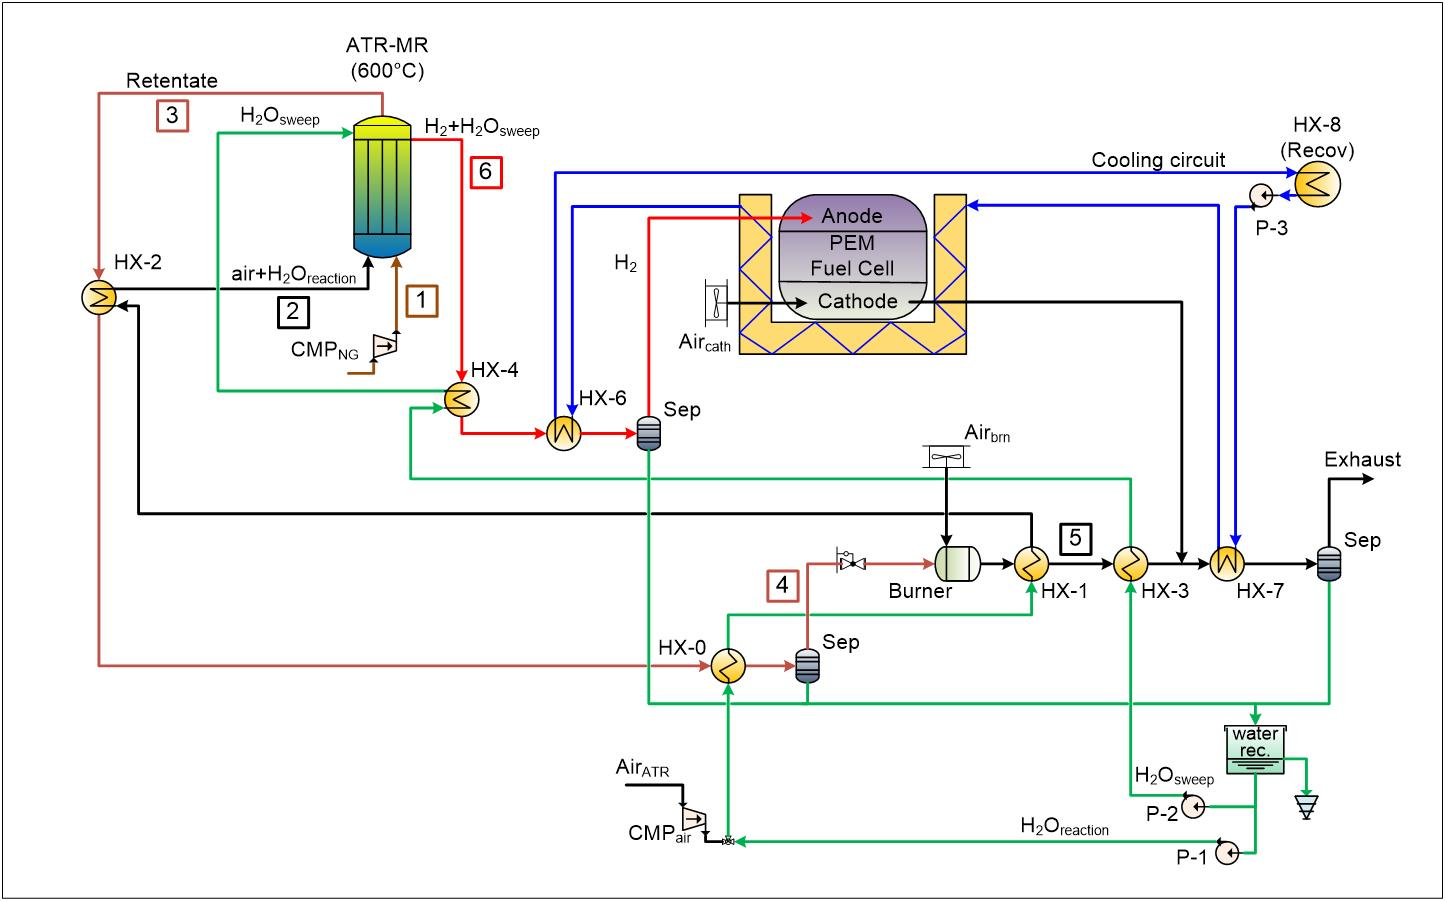
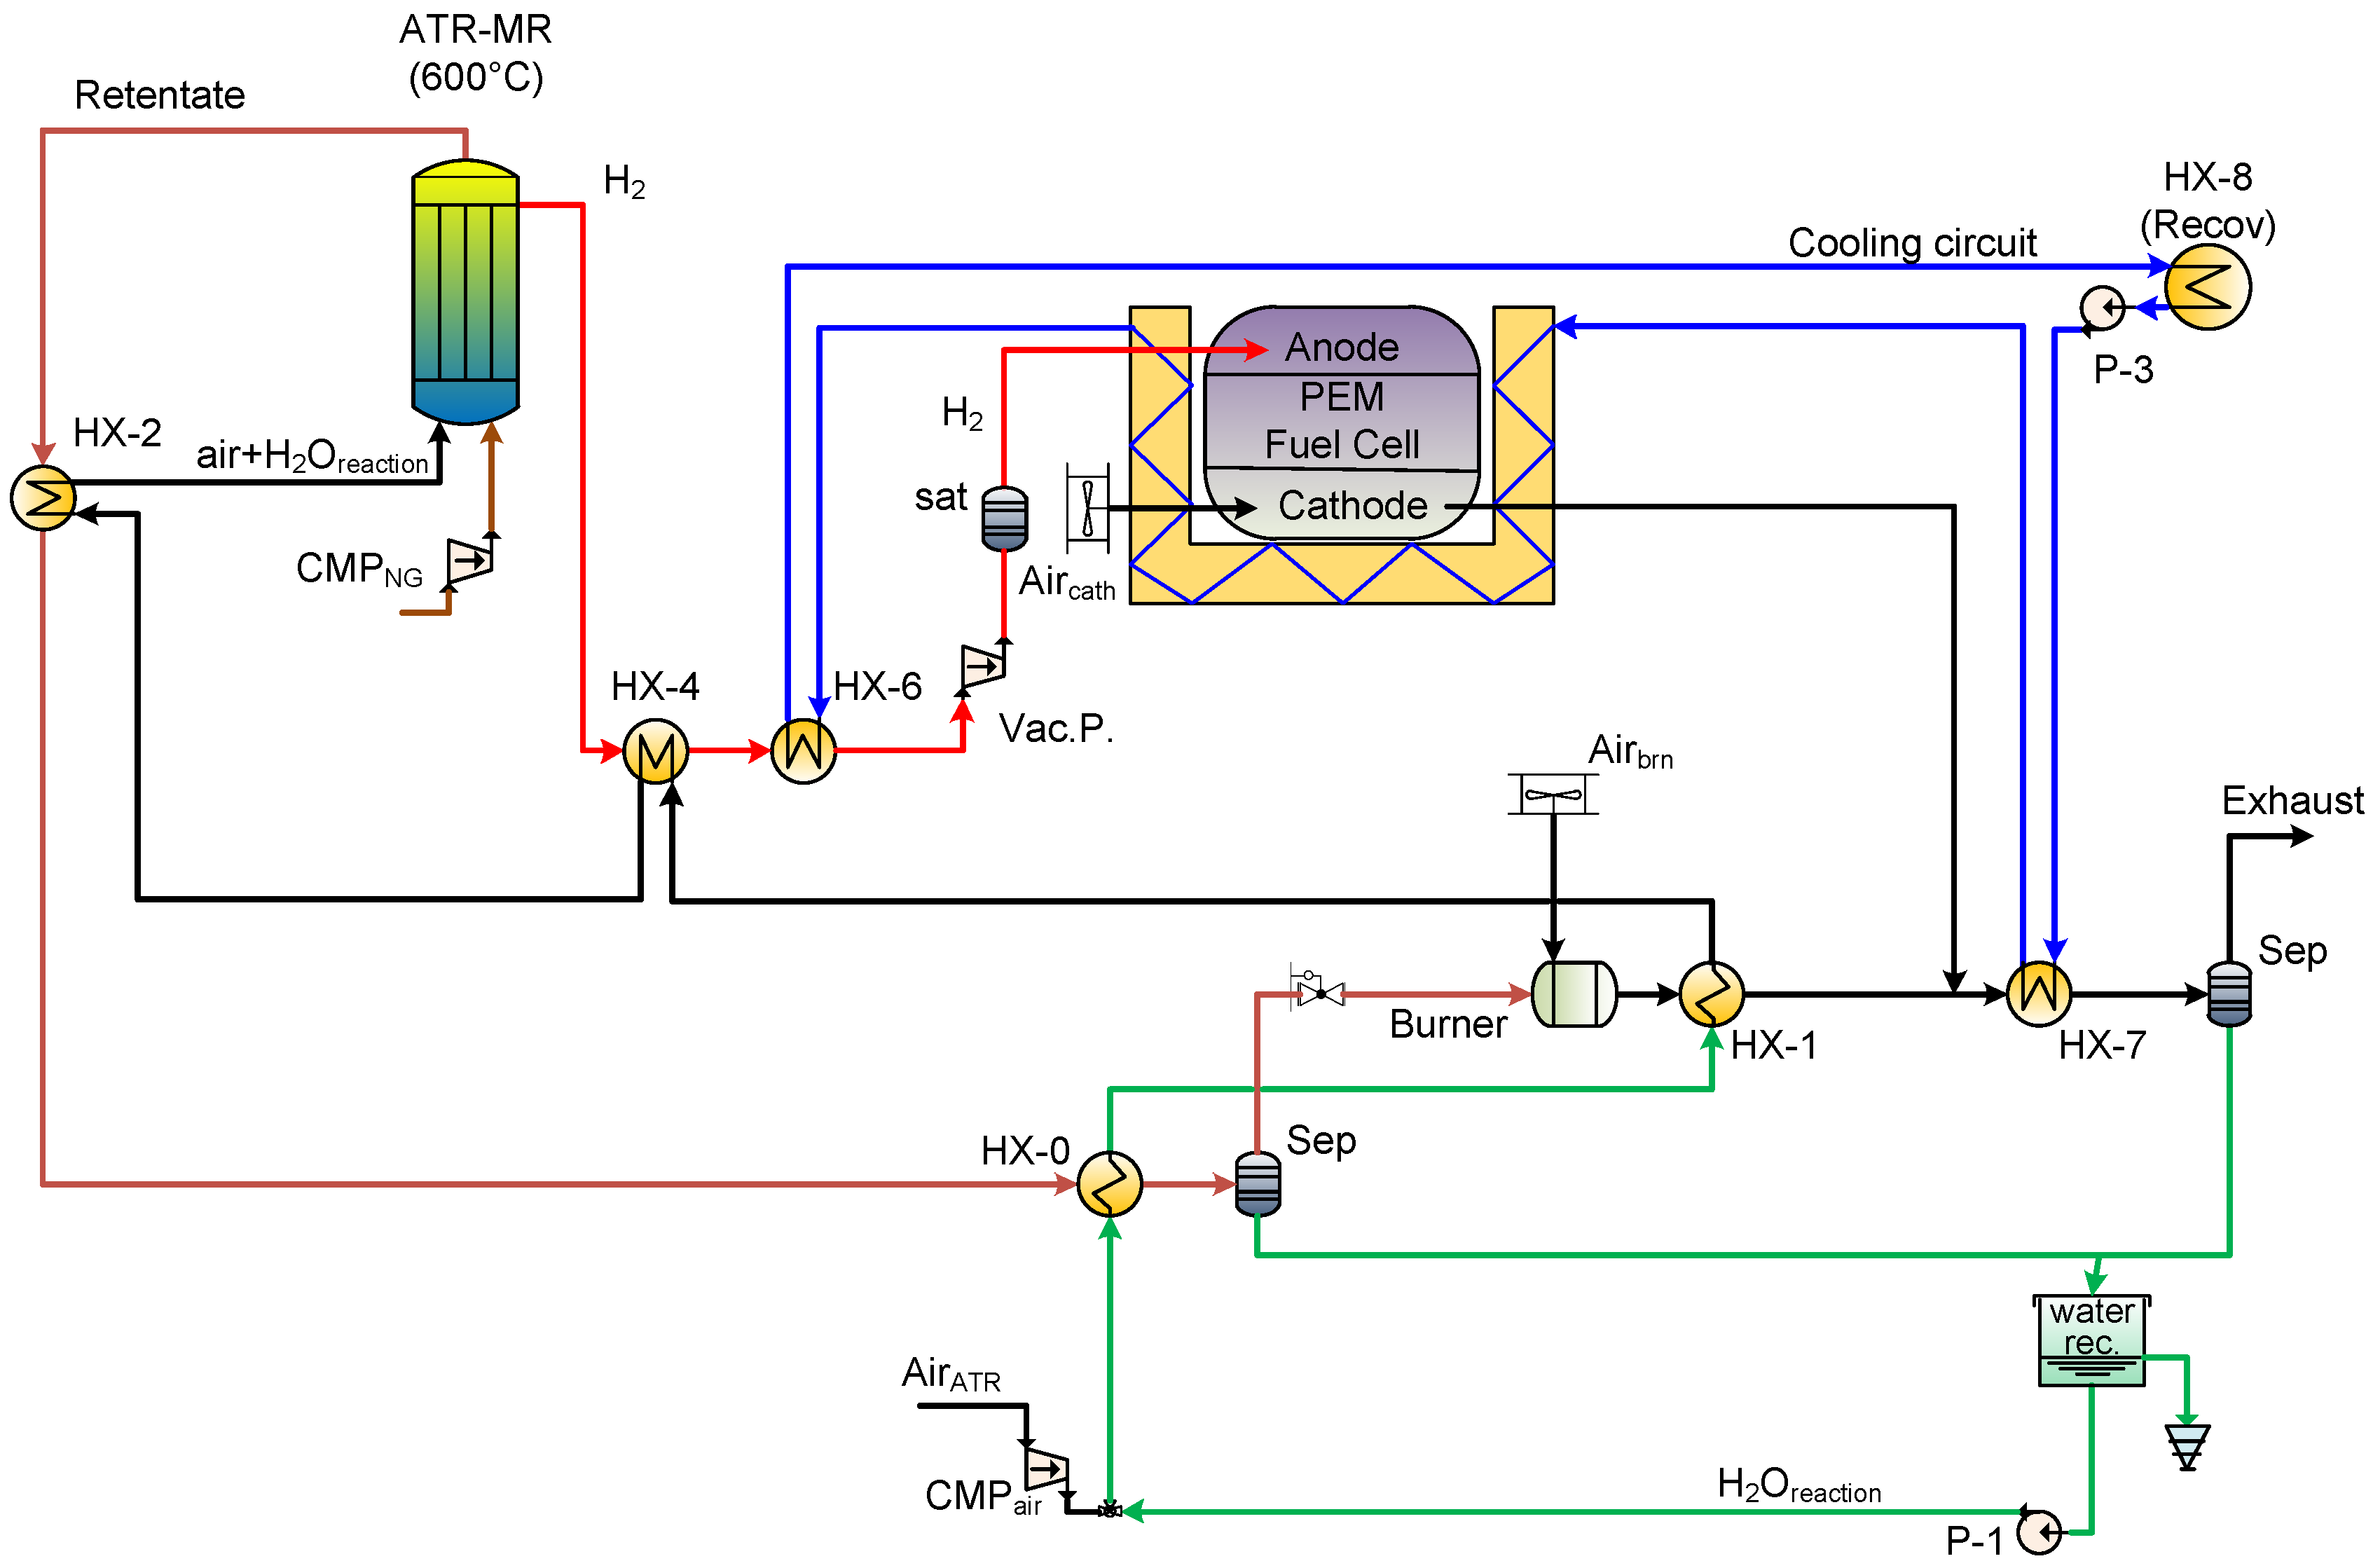
Two different membrane reactors lay-outs were investigated: the main difference being the adoption of a sweep flow at the permeate side to reduce the membrane surface area instead of a vacuum pump. For both cases, several design parameters of the membrane reactor (i.e., temperature, S/C ratio, feed, and permeate pressures) as well as other components (i.e., fuel cell current density, burner temperature, etc.) were considered.
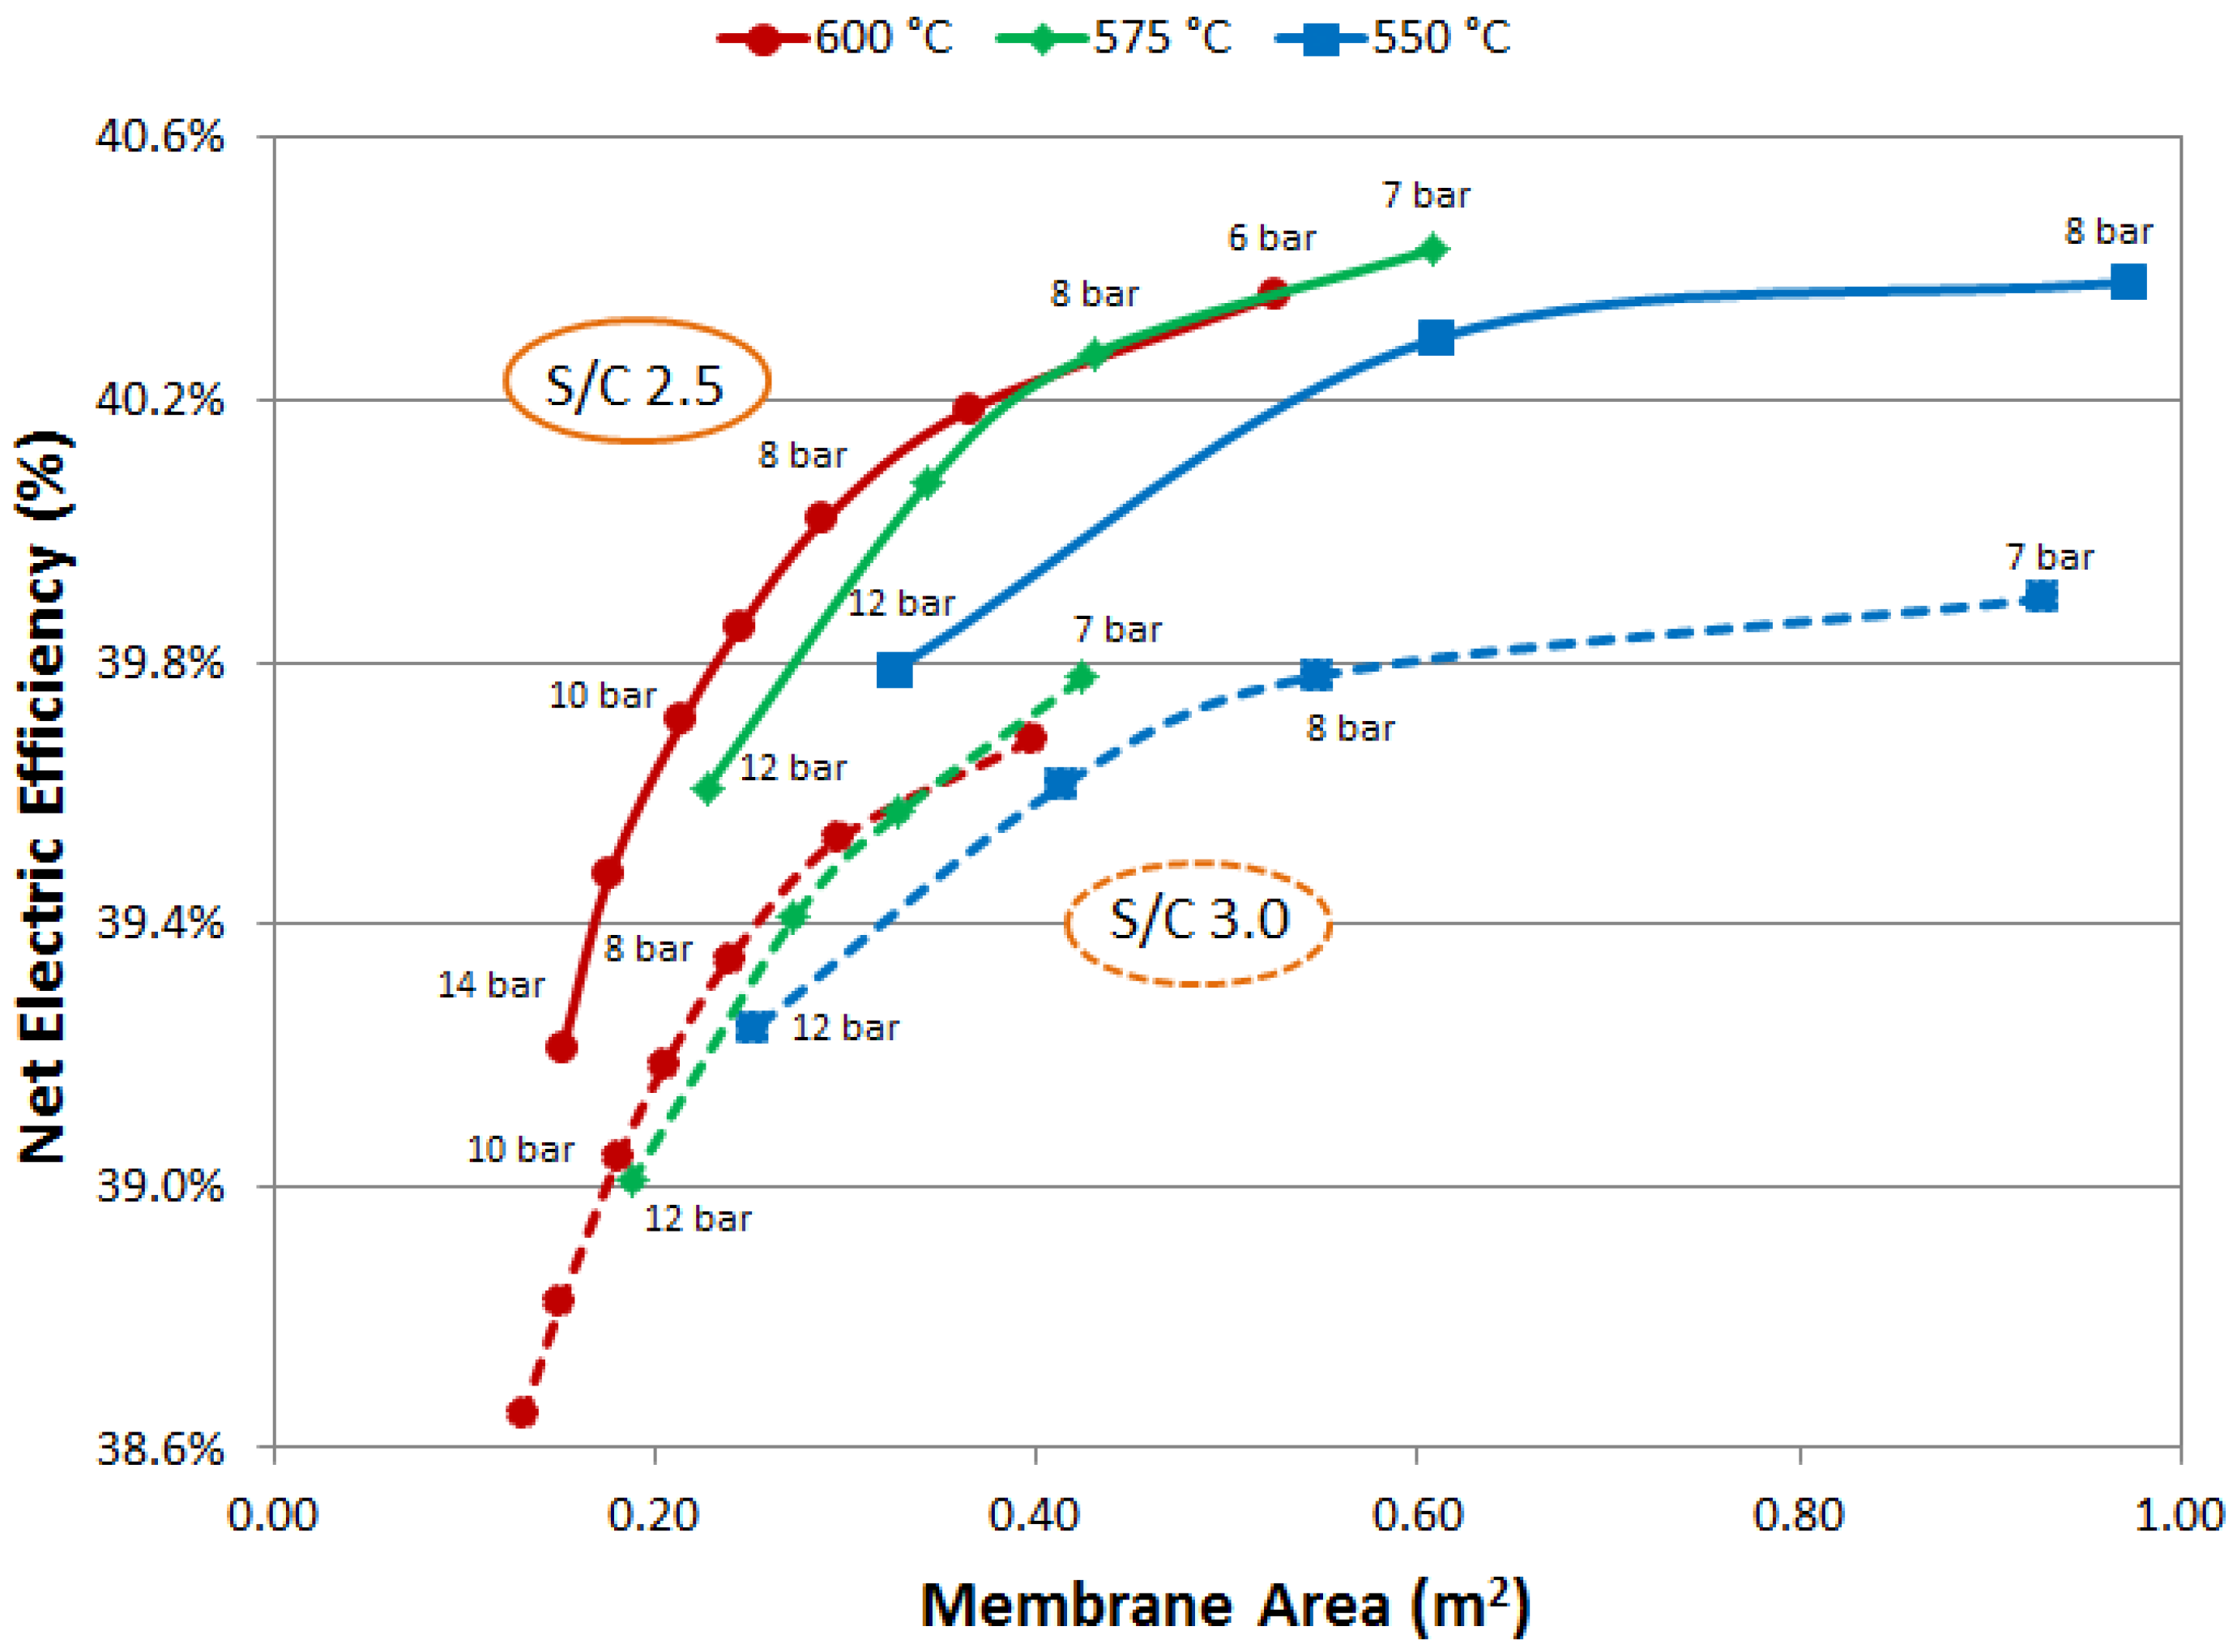
The net electric efficiency as a function of the membrane surface area and diverse reactor configuration and operating conditions is plotted in
Figure 26. In general, the higher the membrane area, the higher is the electrical efficiency. A high S/C ratio penalizes the system from the electrical efficiency perspective, while reducing the membrane surface area thanks to the higher hydrogen partial pressure.
The reactor temperature has the most significant impact on the membrane surface area for both higher hydrogen partial pressure and membrane permeance. Finally, the vacuum pump configuration shows even lower electric efficiency because of the pump consumption. Further details on this analysis can be found in [
26]. It can be noted that the maximum electric efficiency is about 40.5%. Even higher efficiency can be achieved by increasing the fuel cell conversion efficiency (i.e., reducing the current density), but this option is not worth it economically wise, because the additional cost of the fuel cell would not be balanced.
The main results of the simulation for the most representative cases are summarized in
Table 5, two cases for the layout with sweep cases and for the layout with vacuum pump. Results can be compared with the traditional cases (SR and ATR) where net electrical and thermal efficiencies are in the range of 33% and 50% respectively. In terms of energy efficiency, all the proposed cases are above 41%, with maximum at 43.77% which is 6% points higher than the reference case with steam reforming.
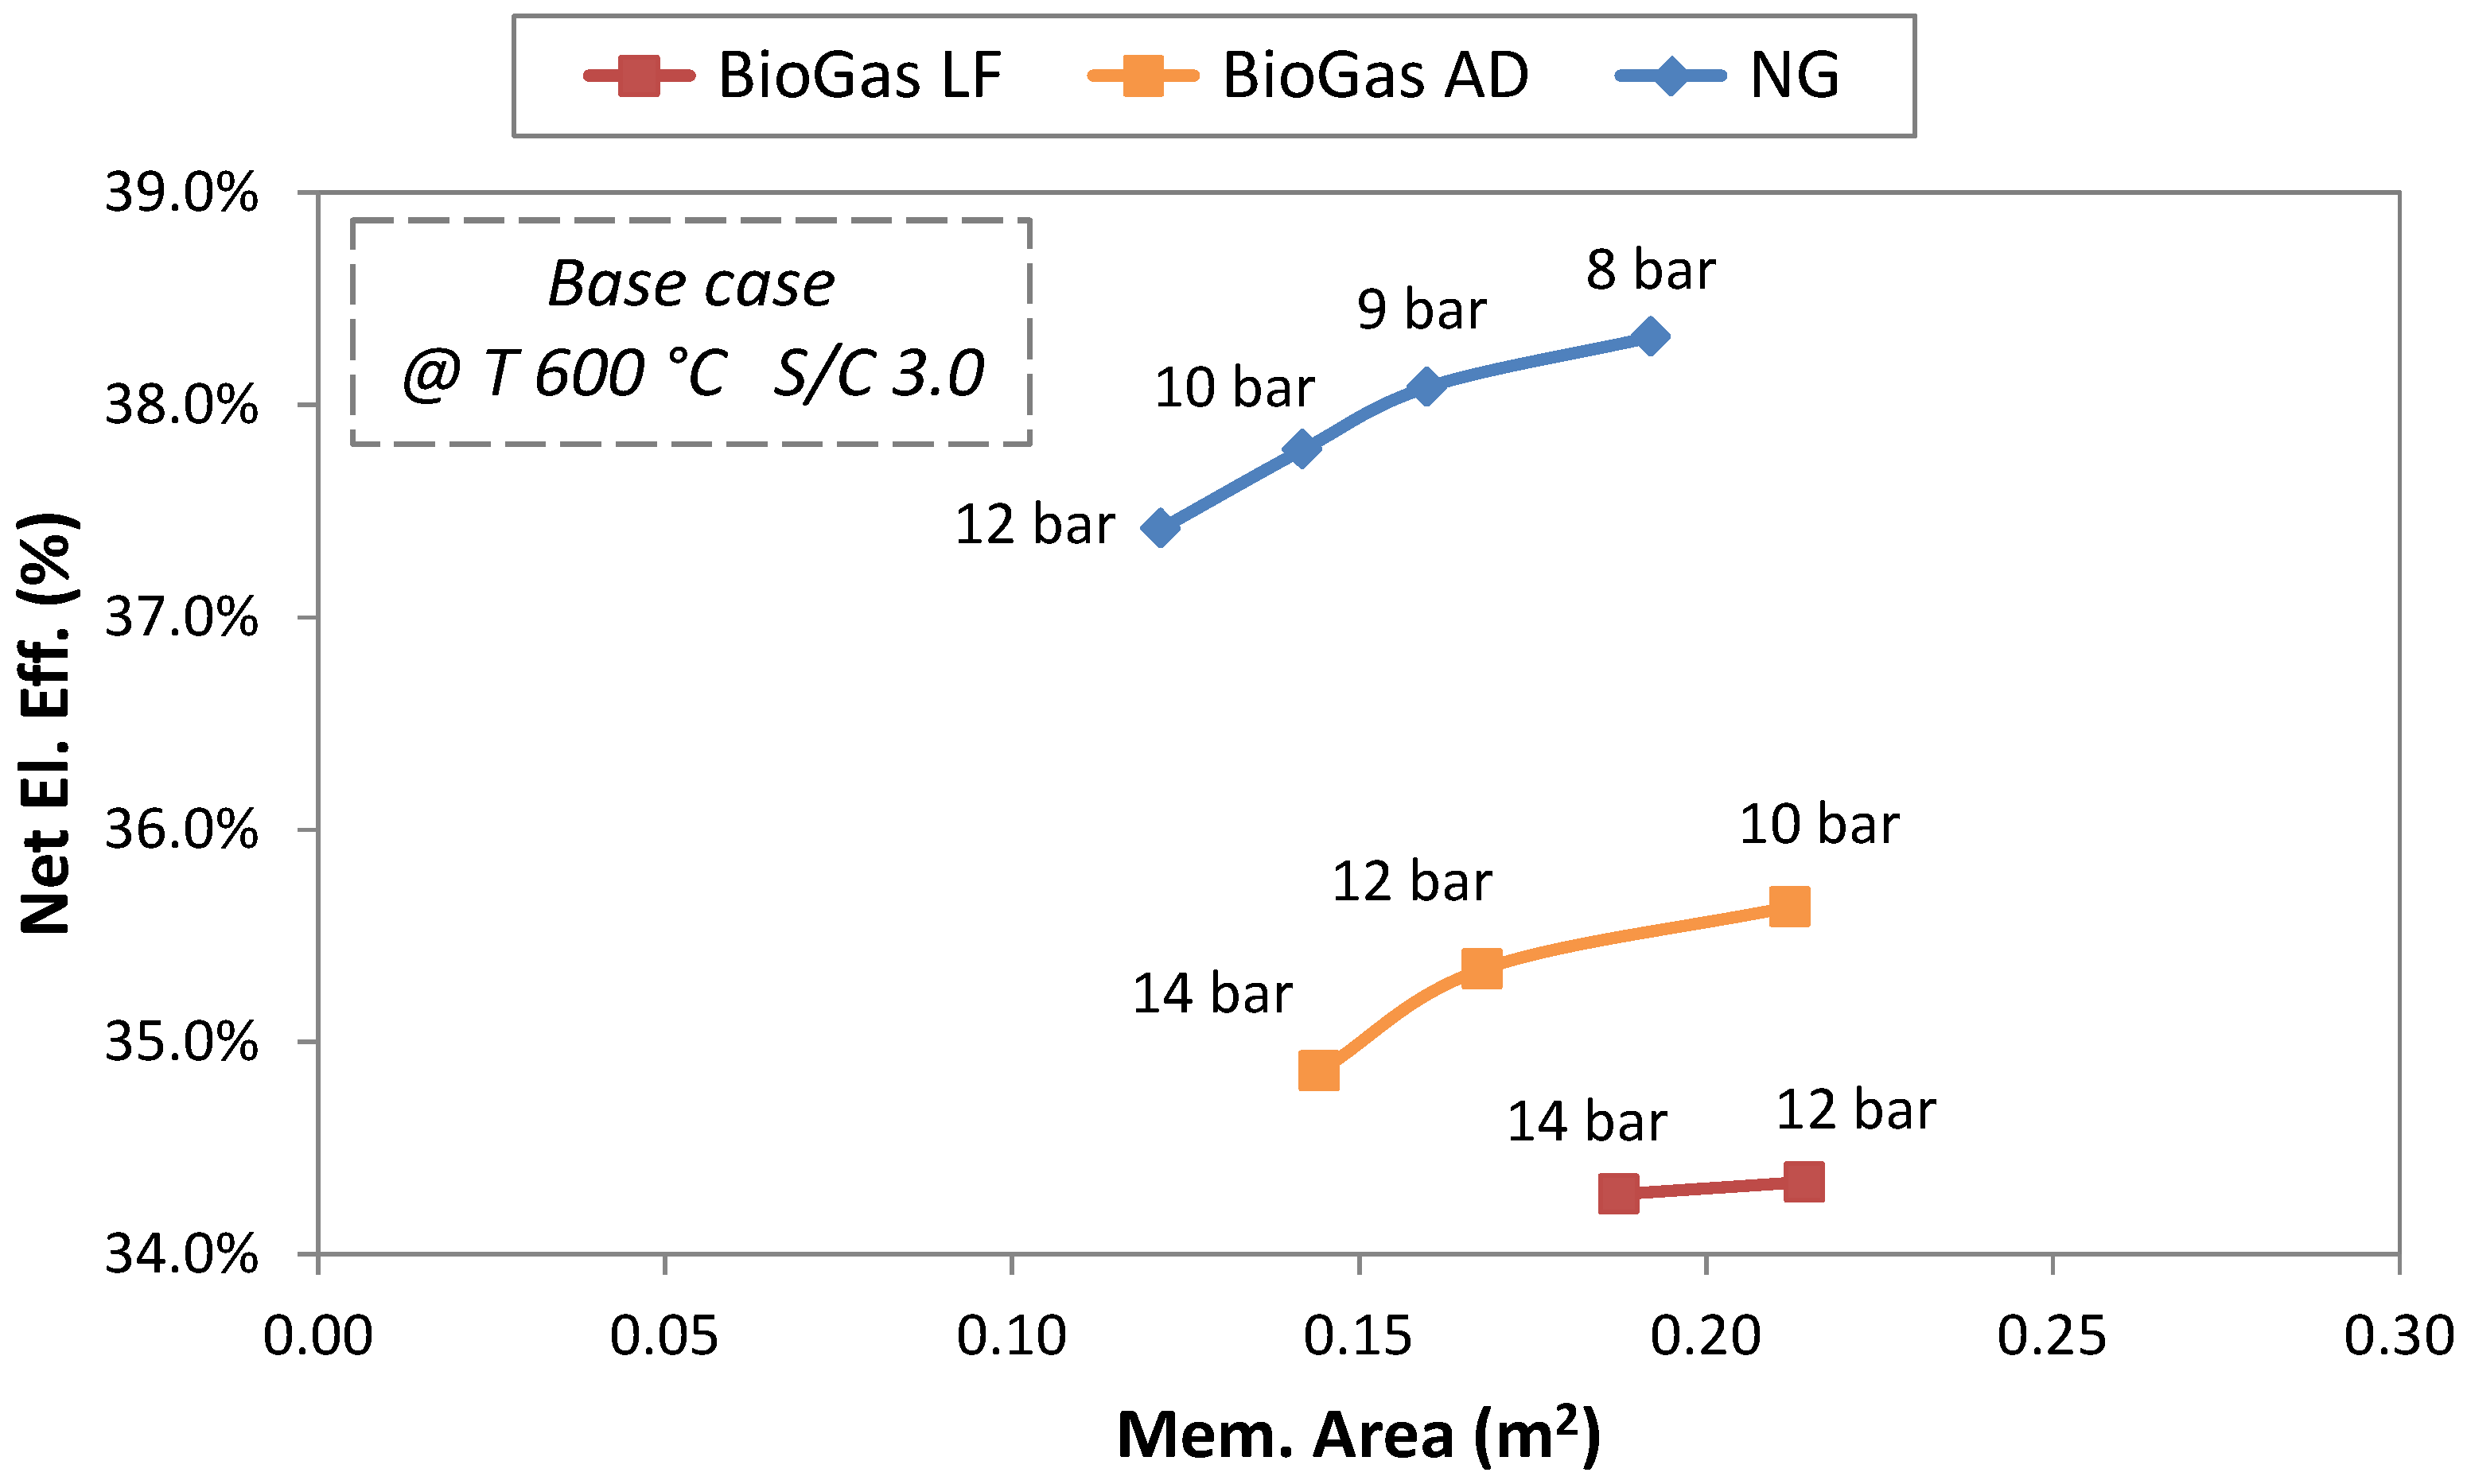
The application of the ReforCELL concept to biogas as fuel feeding was also investigated. The main difference between natural gas and biogas is in the concentration of the methane: in biogas it is about half of an average European natural gas composition. Two different biogas compositions were considered and evaluated: a typical landfill (CH4 44.2%, CO2 34%, and LHV 12.7 MJ/kg) and an anaerobic digester (CH4 58.0%, CO2 34.0%, and LHV 17.8 MJ/kg) compositions.
The efficiency variation for the three different considered fuel compositions and assuming vacuum pump lay-out as a function of membrane area is shown in
Figure 27.
An important result concerns the flexibility of the system with respect to the fuel composition. The membrane reactor can handle and separate pure hydrogen even from diluted methane as in biogas. Biogas requires higher membrane reactor pressures and membrane surface areas because of the methane dilution, which reduces the hydrogen partial pressure and consequently the permeation driving force. In the case of the vacuum pump the efficiency penalty is between 3% and 4%, while it reduces to 1% for the sweep case. The net electrical efficiency with the same reactor design of NG case ranges from 34% to 39%. Energy penalties in the flexible conversion system dealing with different natural gas also occur in commercial systems (i.e., the internal combustion reciprocating engine).
Based on the optimized system layout fed with NG, BoP components were investigated. The selection and design of components and of the full system were carried out taking into account the compatibility of the main magnitudes (pressure, temperature etc.) and materials in the system, as well as costs. To manage the CHP system, a PLC is used. It is composed of two identical controllers (IOBLOCK): one communicates with the fuel processor PLC, and the other is used to measure each single cell voltage. Interface components (mechanical and electrical interface) and the system control strategy were also defined. However, the final integration and test of the system was not finalized due to liquidation of the company in charge of testing near the end of the project.
On the other side, system size scale up was also assessed, investigating the three main components of the CHP system (ATR, fuel cell stack, balance of plant); technical feasibility and economical aspects were taken into account. The maximum size considered is 50 kWe according to European Directive 2012/27/EU on energy efficiency.
Once technical feasibility for sizes up to 50 kWe was verified, the final specific cost (€/kW) of the whole system was evaluated. The best size should be a system suited to supply 50 kWe. The specific cost decrease (€/kW) of the whole system liken to size increase is around 78%.
Furthermore the flexibility of the CHP system scaled-up was evaluated, confirming the feasibility of partial load operations (as the system developed within the project) ensuring load decrease until 40%.
Finally, the aspect of which size is more marketable across Europe was assessed: it is preferable to have small size systems (10–20 kWe) for the smallest buildings with a few dwellings, ensuring bigger sizes (30–50 kWe) with a modular approach.
3.5. Life Cycle Assessment and Safety Analysis
The polymer electrolyte membrane fuel cell (PEMFC) micro combined heat and power (m-CHP) system investigated in the ReforCELL project was assessed by means of a life cycle assessment (LCA), a method standardized by the International Organisation for Standardization (ISO) 14040-44 standards [
78,
79]. The general objective was to perform a LCA which evaluates the environmental burdens of conventional PEMFC m-CHP systems (both steam methane reforming (SMR) and autothermal reforming (ATR)) over their whole life cycle (“cradle to grave”) and to compare them with the developed ReforCELL technology system. The type of use considered is the production of heat and electricity for several dwellings. To have also an idea of the position of the PEMFC m-CHP systems in comparison with other technologies, their impact was also compared with the impact of a natural gas conventional CHP, an alternative where electricity and heat come from the average mix (European electricity mix and country average heat mix) and a last one where electricity and heat come from a green available technology (called “GAT”, wind power and solar thermal). Finally, there were six systems compared in the detailed LCA:
Fuel cell micro-CHP conventional system with steam methane reforming (SMR)
Fuel cell micro-CHP conventional system with autothermal reforming (ATR)
Fuel cell micro-CHP ReforCELL developed technology: autothermal reforming with membrane reformer (ATR MR)
Natural gas fuelled CHP system (50 kWe)
System without CHP conventional (using electricity from the grid and an average heat mix)
System without CHP green available technology (using wind power and solar thermal)
The LCA was performed using the ecoinvent v2.2 life cycle inventory database [
80] and the life cycle impact assessment method IMPACT 2002+ [
81,
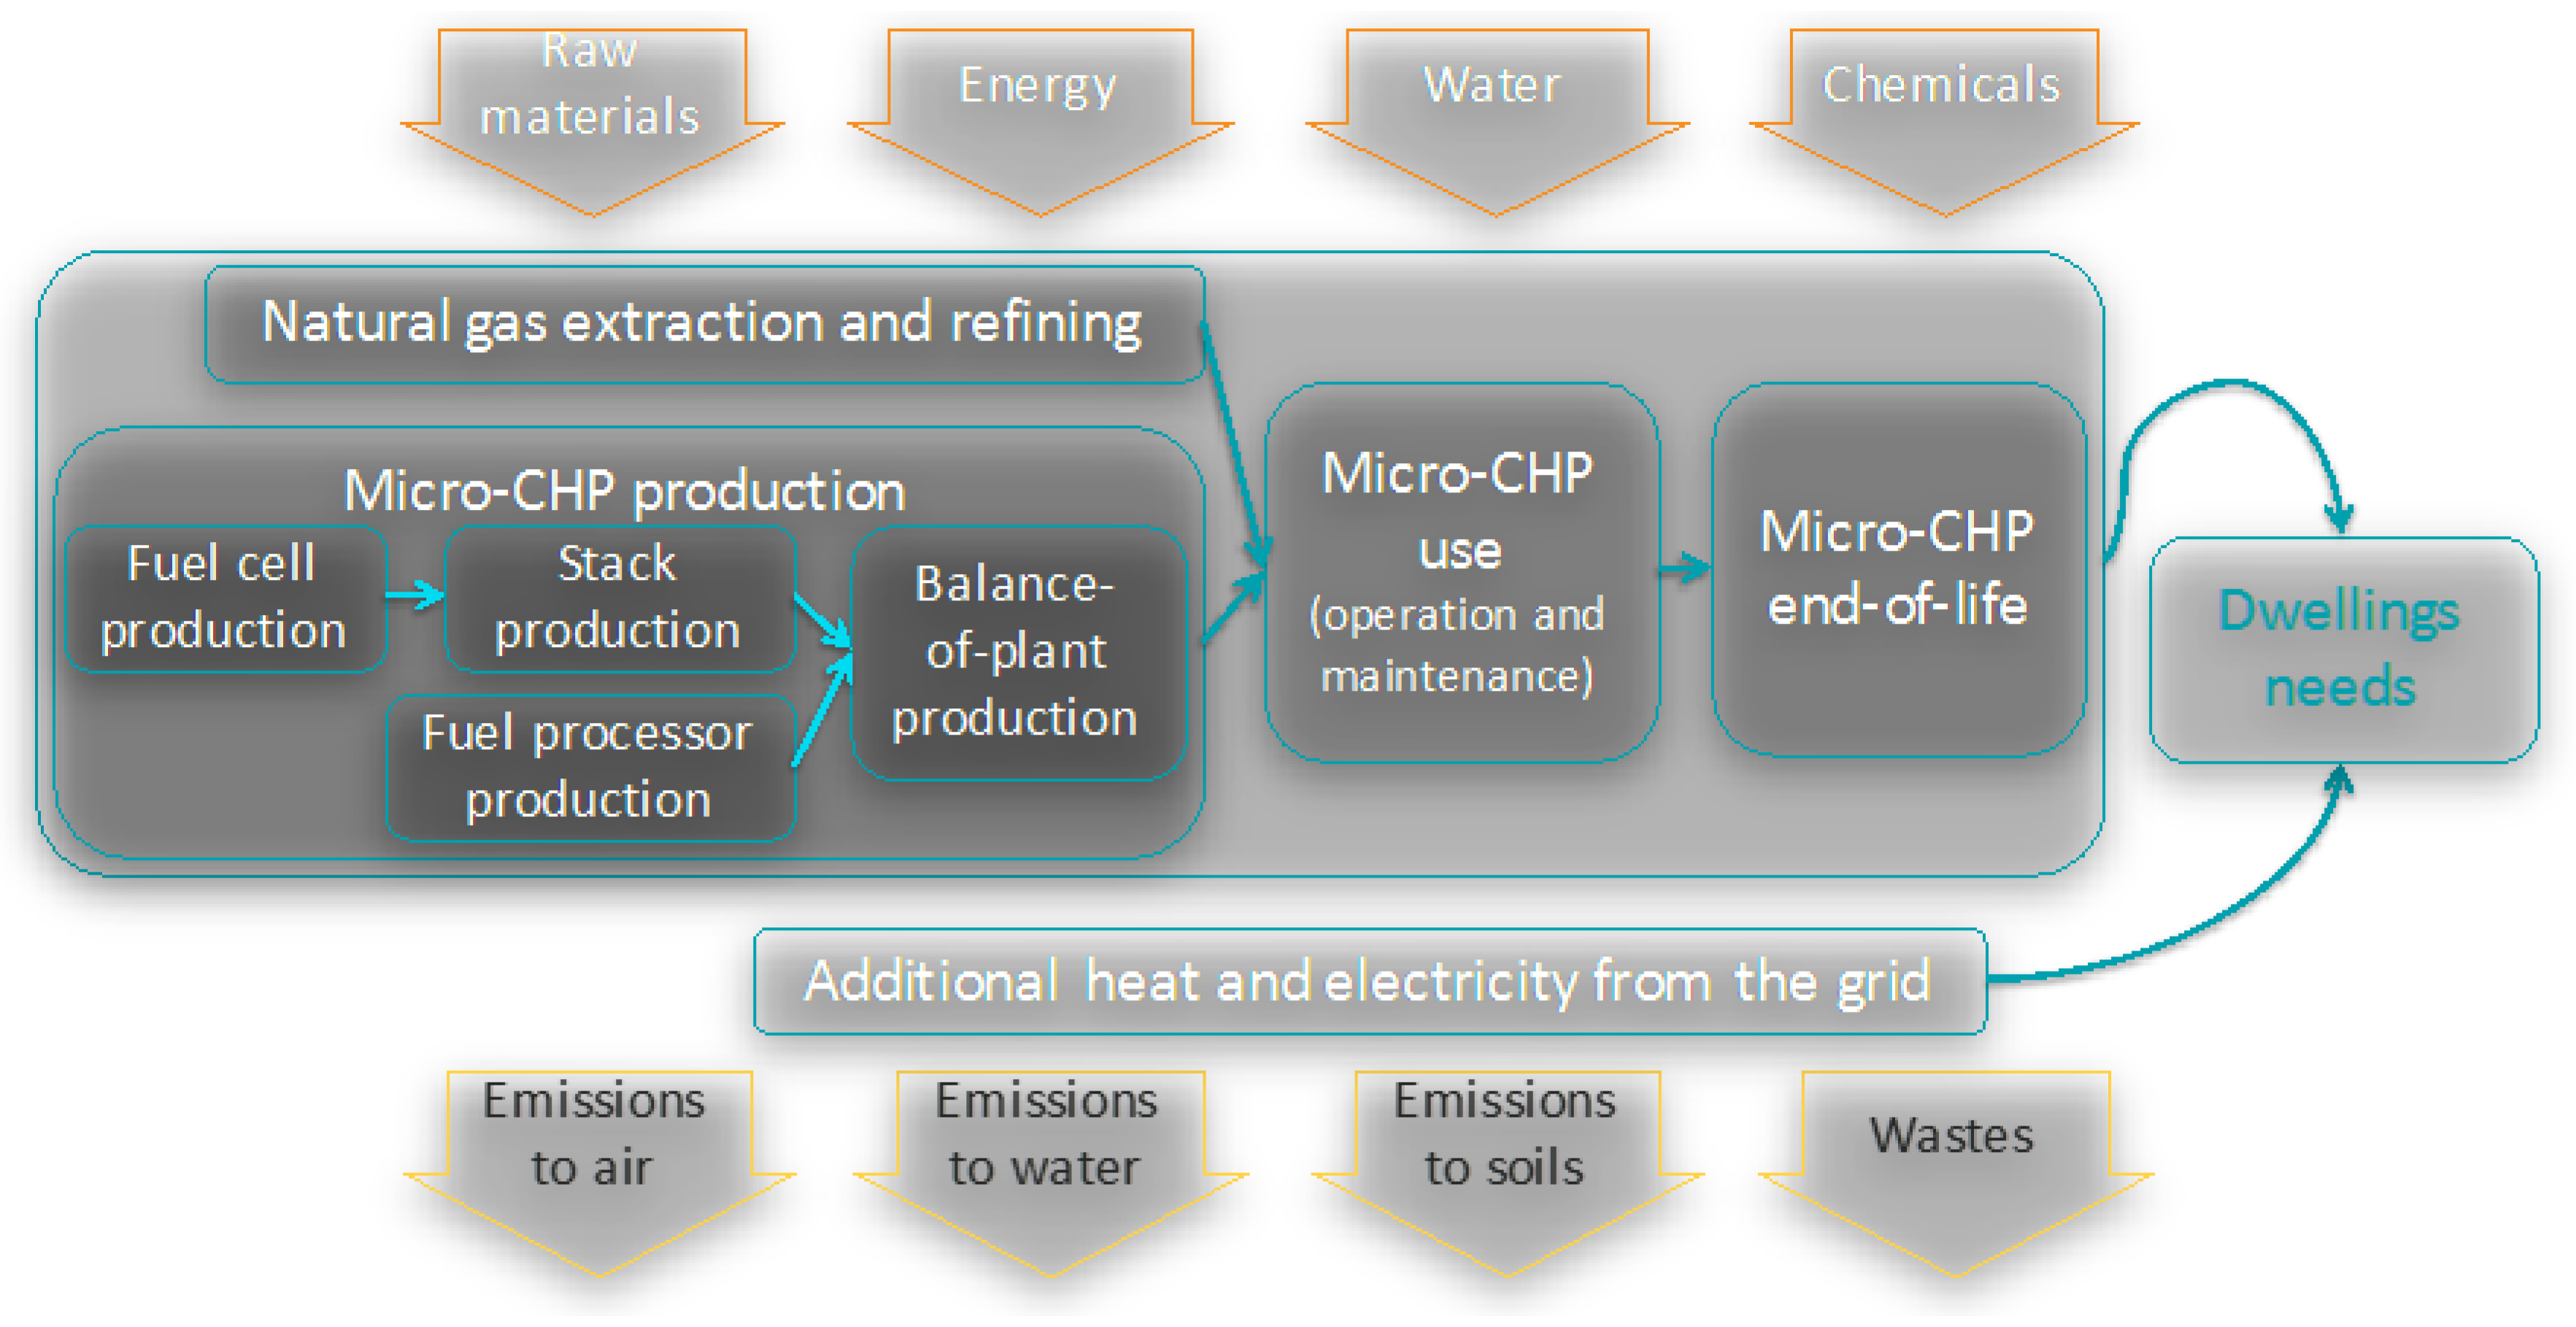
82]. The indicators assessed are climate change, resources consumption, impact on human health and on ecosystem quality and water withdrawal. The systems studied include the CHP production, its maintenance and its end-of-life treatment, the natural gas input, the direct emissions during use, the auxiliary boiler (including its production, end-of-life and use, i.e., natural gas production and combustion), the purchased heat (for the systems without CHP) and purchased electricity as described in
Figure 28.
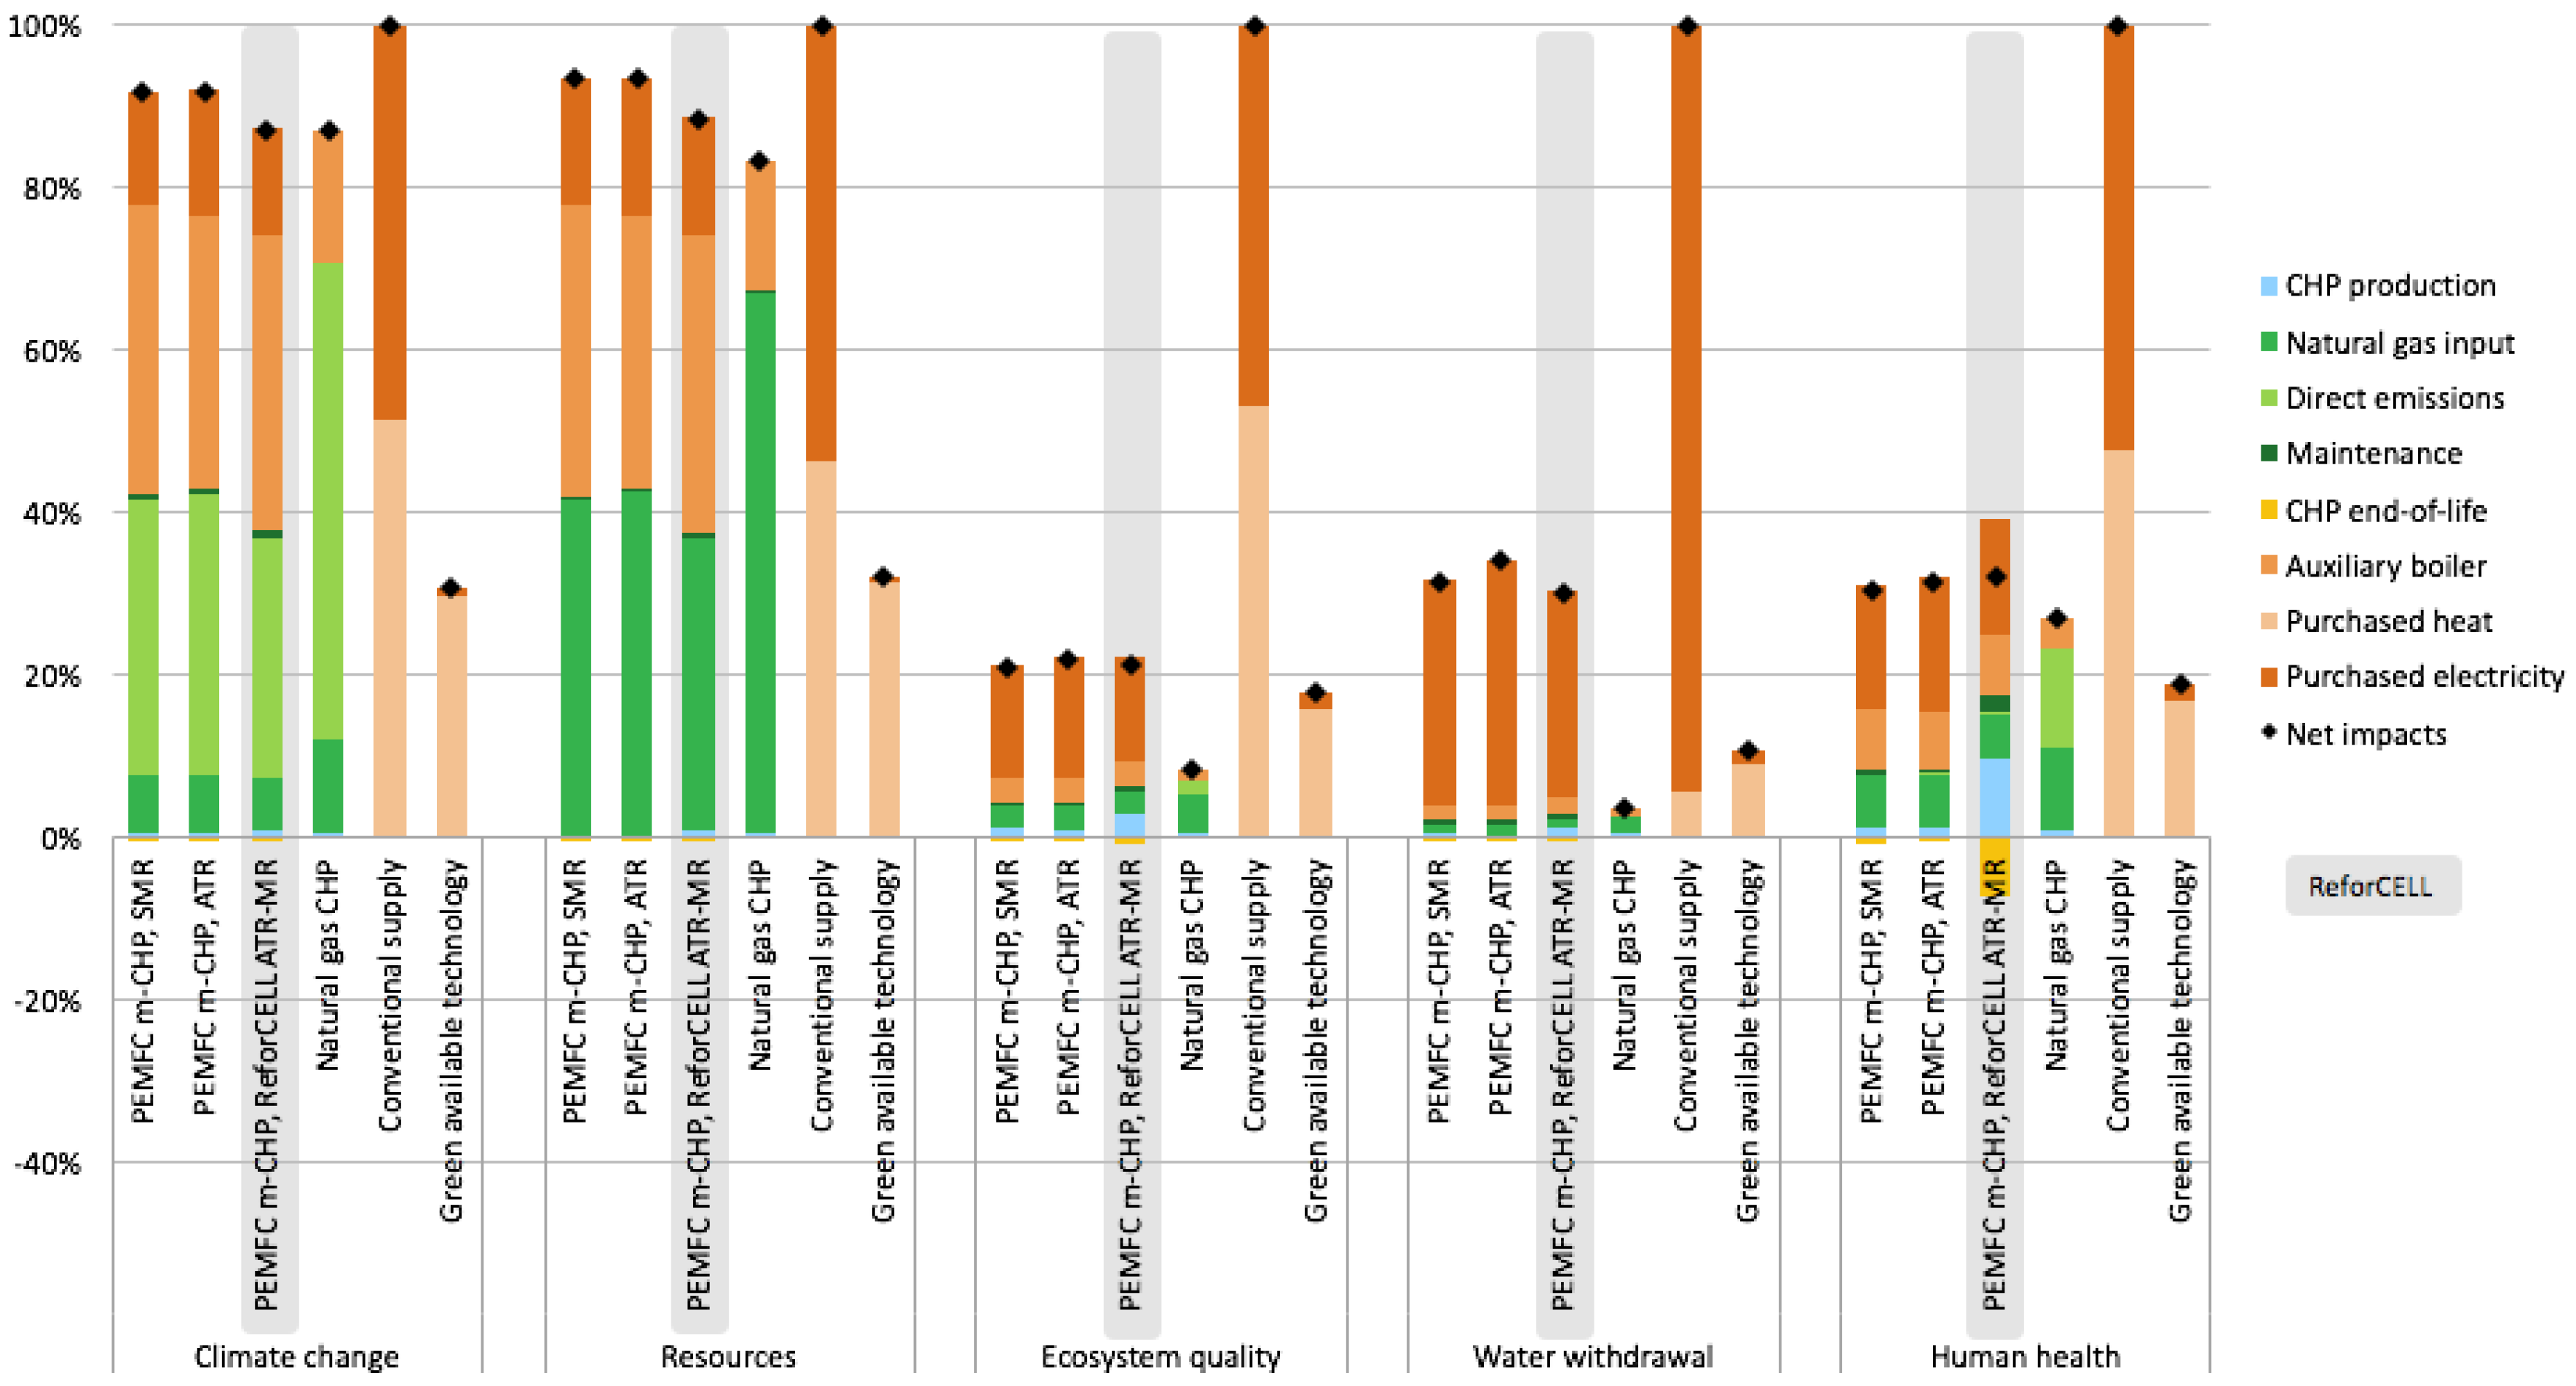
Figure 29 shows that the main contributors to the impacts of the ReforCELL system are extraction and distribution of the natural gas (especially for resources consumption), the direct emissions from reforming (regarding climate change), the auxiliary boiler and the purchased electricity. The m-CHP production, maintenance and end-of-life are very low contributors to the impacts, except for human health. The ReforCELL developed technology has lower impacts than the conventional production of electricity and heat, but higher impacts than a theoretical optimistic case where wind power and solar thermal are used.
Among PEMFC m-CHP systems, the ReforCELL developed technology has slightly lower impacts than the others for climate change and resources consumption while they all have similar impacts for the other indicators considered (slight differences are visible but due to the uncertainty on these indicators, they cannot be considered as different). The large natural gas CHP has a lower impact than the m-CHPs systems assessed but it is not destined to provide a small-scale local supply as the PEMFC m-CHP systems are. These results were obtained for the Italian market, for scenarios where excess electricity can be injected on the grid but not sold and with a dimensioning for 14 dwellings. The exercise has been done for the German market, leading to similar conclusions. Scenarios where the electricity could be sold at a good price (up to 70% of the purchasing price) were also assessed and they lead to a slight reduction of the impacts compared to the score presented above. A sensitivity analysis on the dimensioning would give different conclusions: if the CHP system is dimensioned to fulfil a higher fraction of the needs in heat and the surplus electricity is injected to the grid, the results become better. Indeed, injecting electricity to the grid enables conventional electricity production to be avoided and represents a benefit. Other sensitivity analyses were performed on the electricity mix choice, the electric efficiency of the ReforCELL system, the energy use for manufacturing, the treatment of the ReforCELL m-CHP at the end-of-life or the type of heat considered for the conventional supply but they do not show a big influence on the conclusions, or at least not for all indicators. Normalized and weighted results show the importance of climate change and resources indicators for systems such as those studied.
Regarding safety analysis, HyGear identified and evaluated specific safety reactor/membrane parameters for the membrane reactor using tools such as HAZOP and heat and mass transfer transport reaction models, whereas ICI identified and evaluated the safety parameters on the complete system.


 ,
, 


