Article

Polymerization Kinetics of Poly(2-Hydroxyethyl Methacrylate) Hydrogels and Nanocomposite Materials

by
Dimitris S. Achilias
* and
Panoraia I. Siafaka
Department of Chemistry, Aristotle University of Thessaloniki, Thessaloniki 54124, Greece
*
Author to whom correspondence should be addressed.
Processes 2017, 5(2), 21; https://doi.org/10.3390/pr5020021
Submission received: 15 March 2017 / Revised: 17 April 2017 / Accepted: 19 April 2017 / Published: 24 April 2017
(This article belongs to the Special Issue Water Soluble Polymers)

Abstract

:
Hydrogels based on poly(2-hydroxyethyl methacrylate) (PHEMA) are a very important class of biomaterials with several applications mainly in tissue engineering and contacts lenses. Although the polymerization kinetics of HEMA have been investigated in the literature, the development of a model, accounting for both the chemical reaction mechanism and diffusion-controlled phenomena and valid over the whole conversion range, has not appeared so far. Moreover, research on the synthesis of nanocomposite materials based on a polymer matrix has grown rapidly recently because of the improved mechanical, thermal and physical properties provided by the polymer. In this framework, the objective of this research is two-fold: to provide a kinetic model for the polymerization of HEMA with accurate estimations of the kinetic and diffusional parameters employed and to investigate the effect of adding various types and amounts of nano-additives to the polymerization rate. In the first part, experimental data are provided from Differential Scanning Calorimetry (DSC) measurements on the variation of the reaction rate with time at several polymerization temperatures. These data are used to accurately evaluate the kinetic rate constants and diffusion-controlled parameters. In the second part, nanocomposites of PHEMA are formed, and the in situ bulk radical polymerization kinetics is investigated with DSC. It was found that the inclusion of nano-montmorillonite results in a slight enhancement of the polymerization rate, while the inverse holds when adding nano-silica. These results are interpreted in terms of noncovalent interactions, such as hydrogen bonding between the monomer and polymer or the nano-additive. X-Ray Diffraction (XRD) and Fourier Transform Infra-Red (FTIR) measurements were carried out to verify the results.

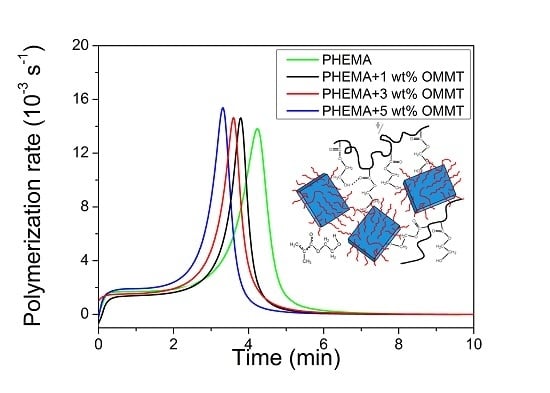
Graphical Abstract

1. Introduction

Hydrogels are biomaterials with properties such as hydrophilicity, biocompatibility and high water absorption by swelling without dissolving, which have attracted great interest from several researchers worldwide [1]. They can be of natural origin (e.g., hyaluronic acid, chitosan, etc.) or synthetic (e.g., poly(ethylene glycol) (PEG), poly(lactic acid) (PLA), etc.). 2-hydroxyethyl methacrylate (HEMA) is a hydrophilic monomer used to prepare such synthetic polymeric (i.e., PHEMA) hydrogels. The polymer, PHEMA, due to its excellent biocompatibility and physicochemical properties, similar to those of living tissues, is widely used in many biomedical applications, such as drug-delivery systems, cell carriers, tissue engineering, contacts lenses, regenerative medicine, etc. [2,3,4]. Other applications of PHEMA include those presented by Kharismadewi et al. [5], as an adsorbent for the removal of the methylene blue cationic dye from an aqueous solution and Moradi et al. [6] for the adsorption of Cu2+ and Pb2+ ions from aqueous single solutions [6].
The great interest in the polymerization of HEMA is based on the combination of methacrylate groups in its structure, resulting in relatively easy radical reactions, with the hydroxyl groups, that provide hydrophilicity. Thus, PHEMA allows obtaining tissue in-growth due to high permeability to small molecules and the soft consistency, which minimizes mechanical frictional irritation to surrounding tissues. The polymer (PHEMA) is a glassy amorphous material with low water absorption, high adhesion to glass and glass transition temperature ranging between 50 and 90 °C depending on the conditions of the polymerization process [7].
During the last decade, research on the synthesis of nanocomposite materials based on a polymer matrix has grown rapidly because of the improved mechanical, thermal and physical properties that are provided by the polymer. Several types of nano-fillers have been used, such as nano-clays, nano-silica, carbon nanotubes, fullerenes, graphene, etc. In this research, we investigated the formation of PHEMA-based nanocomposites with either a nano-organomodified montmorillonite (OMMT) or nano-silica. Incorporation of MMT is well known to improve the mechanical properties of the polymer matrix [8,9], whereas adding silica to PHEMA results in bioactive materials that keep the swelling properties of neat polymer; thus, they assure both morphological and bioactive characteristics [7]. Nanocomposites can be prepared by various methods, such as in situ polymerization, melt intercalation/exfoliation and solution casting. The in situ polymerization method was used here in order to obtain nanocomposites with a uniform dispersion of the filler in the polymer matrix.
The kinetics of radical polymerization has been extensively studied for a long time. Differential scanning calorimetry (DSC) has long been used for monitoring polymerization reactions for several systems. It offers the advantage of continuous recording of the variation of the reaction rate with time through the measurements of the amount of heat released, since additional reactions are exothermic. This technique has been also used for recording the polymerization kinetics of HEMA and its copolymers with some dimethacrylate monomers (such as ethylene glycol dimethacrylate (EGDMA) or diethylene glycol dimethacrylate (DEGDMA)) [10,11,12,13,14]. Modeling of polymerization kinetics has been carried out using semi-empirical models, such as those developed for resins-curing [11] or based on the isoconversional principle [10]. A pioneering work on the polymerization kinetics of PHEMA crosslinked with EGDMA was presented thirty years ago by Mikos and Peppas [15]. Later on, the group of Bowman was the only one to develop kinetic models for the polymerization kinetics of HEMA based on the reaction mechanism [16,17]. A method for determining the kinetic parameters was also proposed [16]. In our previous investigation, we also used DSC measurements and compared the results obtained by a simple mechanistic model with those from isoconversional analysis [18]. Only the low degrees of conversion were investigated to avoid the diffusion-controlled phenomena.
This research consists of two parts: In the first part, a detailed kinetic model is proposed for the polymerization kinetics of HEMA in bulk based on DSC measurements of the polymerization rate and the reaction mechanism, including also the effect of diffusion-controlled phenomena on the termination and propagation reactions. Polymerizations at different temperatures are carried out, and all kinetic parameters used are either based on accurate independent experimental measurements or estimated in this work. The aim of this part was to provide accurate kinetic data concerning the radical polymerization of HEMA over the whole conversion range. In the second part, the effect of adding different types and amounts of nano-particles on the polymerization kinetics is investigated. The in situ bulk radical polymerization is examined with two different types of nano-additives: an organo-modified montmorillonite, which is a 2D nanoclay, and a nano-silica, which can be considered a 3D nanoparticle. The polymerization kinetics is studied with DSC operating isothermally at different temperatures. Depending on specific interactions, a different effect on the polymerization kinetics was observed from those two nano-additives.

2. Materials and Methods

2.1. Materials

The monomers used were composed of 2-hydroxyethyl methacrylate (HEMA), purchased from Aldrich with purity ≥99%. Before any use, it was passed at least twice through a disposable inhibitor-remover packed column, supplied from Aldrich, in order to remove the inhibitor included. The free radical initiator used, i.e., benzoyl peroxide (BPO) with a purity >97%, was provided by Fluka AG and purified by fractional recrystallization twice from methanol (purchased from Merck). For the preparation of the nanocomposites, two nanofillers were used: the first was a commercially-available organically-modified, with a quaternary ammonium salt (i.e., dimethyl hydrogenated tallow), montmorillonite clay, under the trade name Cloisite 15A, (provided by Southern Clay Products Inc., Gonzales, TX, USA). The chemical structure of the ammonium salt was, N+R2(CH3)2 where R is the hydrogenated tallow (∼65% C18, ∼30% C16, ∼5% C14), and its cationic exchange capacity (CEC) was 125 meq/100 g clay. Typical physical properties, according to the manufacturer, include: size, as measured by a transmission electron microscope for a PA6 nanocomposite, 75–150 nm × 1 nm; surface area 750 m2/g when exfoliated.
The second nanoparticle used was hydrophilic fumed silica under the trade name Aerosil 200. The average primary particle size was 12 nm, the specific surface area 200 m2/g and the SiO2 content greater than 99.8% (from Evonik Resource Efficiency GmbH). All other chemicals used were of reagent grade.

2.2. Polymerization Kinetics

Polymerization experiments were performed using the DSC Diamond (Perkin-Elmer, Waltham, MA, USA). For the temperature and enthalpy calibration of the instrument, indium was used. Polymerizations were run isothermally at temperatures of 52, 60, 72 and 82 °C. Although a significant amount of heat is produced during the reaction, especially in the autoacceleration region, the equipment set up is so to maintain the reaction temperature constant (within ± 0.01 °C) during the whole conversion range. The liquid mixture of the monomer with the initiator at an initial concentration of 0.03 mol/L was placed into aluminum Perkin-Elmer pans, accurately weighted (approximately 10 mg), sealed and positioned into the appropriate holder of the instrument. In order to have an estimation of the overall reaction rate (dx/dt), the amount of heat released (dΗ)/dt), the reaction exotherm in normalized values (W/g) was continuously recorded as a function of time. Then, the reaction rate is estimated from:
d x d t = 1 Δ H T d ( Δ H ) d t
where x denotes fractional conversion and ΔHT total reaction enthalpy.
By integrating the area between the DSC thermogram and the baseline established after extrapolation from the trace produced when polymerization has been completed (no change in the heat produced), the degree of conversion can be calculated. In order to determine the total reaction enthalpy, a dynamic experiment followed, where samples were heated from the polymerization temperature to 180 °C at a rate of 10 K min−1. The sum of enthalpies of the isothermal (ΔHi) plus the dynamic (ΔHd) experiment was the total reaction enthalpy. The values thus estimated were always near 422 J/g, similar to the theoretical one obtained by dividing the standard heat of polymerization of a methacrylate double bond (i.e., 54.9 kJ/mol) over the monomer molecular weight (i.e., 130). The ultimate monomer conversion was estimated by the quotient ΔHiHT. In order to check for possible monomer evaporation during the reaction, the pans were weighed again after the end of the polymerization. A negligible monomer loss (less than 0.2 mg) was observed only in a few experiments.
It should be noticed that at low polymerization temperatures (i.e., 50 or 60 °C), a small inhibition time was observed. This is due to the non-adequate removal of oxygen, dissolved in the monomer during the initial mixing, which was performed in air.
All of the experiments were performed at least twice, and the best results are included in the Results section.

2.3. Synthesis of Nanocomposites

For the synthesis of the nanocomposite materials, initially, the appropriate amount (1, 3 or 5 wt %) of the nano-particles (i.e., OMMT or silica) was dispersed in the monomer, using magnetic and ultrasound agitation. In the final homogeneous suspension, the initiator, BPO at a concentration 0.03 mol/L, was added, and the mixture was degassed by passing nitrogen and immediately used. The procedure followed for the measurement of the reaction rate with time was exactly the same as that reported previously.

2.4. Measurements

X-ray diffraction (XRD) patterns of the materials were obtained using an X-ray diffractometer (3003 TT, Rich. Seifert, Ahrenburg, Germany) equipped with a CuKa generator (λ = 0.1540 nm). Scans were taken in the diffraction angle range 2θ = 1°–10°.
Details of the chemical structure of neat PHEMA and its nanocomposites were identified by recording their IR spectra. The particular FTIR instrument used was the Spectrum 1 spectrophotometer from Perkin-Elmer. The spectra were recorded over the range 4000–500 cm−1 at a resolution of 1 cm−1, and 32 scans were averaged to reduce noise.

3. Results

3.1. Polymerization Kinetics of HEMA

Bulk free-radical polymerization kinetics of PHEMA has been investigated previously by our group at reaction temperatures ranging from 50–80 °C [18,19]. Similar, though slightly different reaction temperatures were also used here in order to check previous results and have appropriate reaction rate data. The variation of heat released with time at temperatures of 52, 60, 72 and 82 °C is illustrated in Figure 1a. From these data, the reaction rate was estimated according to Equation (1). By integrating this equation, the monomer double bond conversion was calculated and is plotted in Figure 1b at all reaction temperatures studied.
The curves shown in Figure 1 exhibit the typical characteristics of a radical polymerization reaction with diffusion-controlled phenomena affecting the reaction rate. The feature points are briefly analyzed below. As is well known, the radical polymerization mechanism includes mainly three steps (i.e., decomposition of an initiator to primary radicals, reaction of these radicals with monomer molecules to form macro-radicals, propagation of the macro-radicals by reacting with several monomer molecules and, as the final point, termination of these macroradicals for the formation of the final polymer). At the early stages of polymerization (low conversions), ‘classical’ free-radical kinetics apply, with a purely chemical control of the reaction [20]. This is denoted by an almost constant polymerization rate and an almost linear dependence of monomer conversion with time. After a certain point in the region of 7%–12% conversion, an increase in the reaction rate takes place accompanied by an increase in the conversion values. This is the well-known gel-effect or autoacceleration phenomenon, which is attributed to the effect of diffusion-controlled phenomena mainly on the termination reaction. Accordingly, in reactions carried out without any solvent, in bulk, as the concentration of the macromolecules increases, the diffusion of the macro-radicals in space in order to find one another and react is significantly reduced. This results in a local increase in concentration, leading to increased reaction with monomer molecules and, hence, to an increased polymerization rate [20]. At higher degrees of conversion, the macro-radical chains are even more restricted in their movement, and their center-of-mass diffusion becomes very slow. However, termination of these macro-radicals is continued at a smaller rate, by means of their implicit movement caused by the addition of monomer molecules at the chain end. This diffusion mechanism is the so-called ‘residual termination’ or ‘reaction diffusion’. The higher the propagation reaction rate, the more likely is the reaction-diffusion to be rate determining. Afterwards, the polymerization rate falls significantly and tends asymptotically to zero. This stage corresponds to the well-known glass-effect. This is attributed to the effect of diffusion-controlled phenomena on the propagation reaction since at such high monomer conversions, even the small monomer molecules are hindered in their movement to find a macro-radical and react [20]. All of these phenomena are quantified next.
As was reported previously, the free-radical polymerization mechanism constitutes mainly three steps: initiation (with an initiator decomposition kinetic rate constant, kd, and initiator efficiency, f), propagation (with propagation rate constant kp) and termination (with rate constant kt). After a number of assumptions, including the steady-state approximation (rate of change of radical concentration with time equal to zero), the long chain hypothesis (consumption of monomer only in the propagation reactions) and negligible chain transfer to the monomer rate constant compared to propagation, the polymerization rate, Rp, is expressed as a function of conversion, X, by:
R p = d X d t = k p ( f k d k t ) 1 / 2 [ I ] 1 / 2 ( 1 X ) k e f f ( 1 X )   with   k e f f = k p ( f k d k t ) 1 / 2 [ I ] 1 / 2
In order to estimate the overall kinetic rate constant, keff, Equation (2) can be integrated assuming that the initiator concentration, [I], the initiator efficiency, f, and all kinetic rate constants are constant.
ln ( 1 X ) = k e f f t
It should be noted that the assumptions used to result in Equation (3) are valid only at low degrees of monomer conversion. Then, from a plot of −ln(1 − X) vs. t, the slope of the initial linear part is directly equal to keff. Such plots at conversion values in the range of 1%–7% have been created and illustrated in Figure 2a. The data followed very good straight lines at high temperatures (i.e., 72 and 82 °C), whereas a slight curvature appeared at the lower temperature of 52 °C (the correlation coefficient, R2, ranged from 0.992–0.999). Then, from the keff values measured at different temperatures, the overall activation energy of the polymerization rate, Eeff, can be estimated from the slope of ln(keff) versus 1/T assuming an Arrhenius-type expression. The individual activation energies of the elementary reactions, i.e., propagation (Ep), initiation (Ei) and termination (Et), are correlated to Eeff according to the following equation, extracted from Equation (2):
Eeff = Ep + 1/2(EiEt)
The Arrhenius-type plot is illustrated in Figure 2b. As can be seen, all data follow a very good straight line, and the slope estimated provides an activation energy equal to 90.6 ± 1.1 kJ/mol (R2 = 0.999). This value is close to the literature value of PHEMA found in our previous publication, i.e., 89 ± 3.1 kJ/mol (R2 = 0.997) [18], and also near to that of PMMA, i.e., 84 kJ/mol [21]. It should be noted that lower values have been reported in the literature (i.e., 56.7 [10]; 63.6 [12]; 73.2 kJ/mol [11]), though they have been estimated by integral data on non-isothermal polymerization that have been proven to be not strictly correct. In addition, the commercially-available monomer, HEMA, used by different groups of authors is not pure and includes inhibitors or other products, which affect the polymerization kinetics.
For PHEMA, the propagation activation energy has been estimated by Buback et al. using the pulsed laser polymerization (PLP)/size-exclusion chromatography (SEC) technique and found equal to 21.9 ± 1.5 kJ/mol [22]. Moreover, for the BPO initiator, the decomposition activation energy is equal to 143 kJ/mol [23]. Then, using the value estimated for the overall (effective) activation energy (i.e., 90.6 kJ/mol) and Equation (4), the activation energy of the termination reaction can be estimated. This was found to be 5.6 kJ/mol, very close to the value proposed for MMA polymerization (i.e., 5.89 kJ/mol [24]).
Furthermore, in order to provide values for the individual kinetic rate constants of the HEMA polymerization, we used for the initiator BPO the values reported in [23], i.e., kd = 5 × 10¹⁶ exp(−143,000/RT) s−1 and f = 0.5. Then, from Equation (2) and assuming that [I] ≅ [I]0, the values of (kp0/√kt0) can be estimated and included in Table 1. The assumption of a nearly constant initiator concentration is valid since in the time horizon where the values of keff were estimated, the ratio of [I]/[I]0 was never lower than 0.998. For the propagation rate constant, that reported by Buback [22], i.e., ln (kp (L/mol/s)) = 16.0 − 2634/T (K), can be used. In such a way, the termination rate constant can be estimated, and values at the temperatures investigated are included in Table 1.
In order to simulate the experimental data over the whole conversion range, using Equation (2), the next step is to use appropriate equations accounting for the variation of the termination and propagation rate constants during polymerization. Though a number of sophisticated models have been developed [20], we followed here the one proposed by Bowman et al. [16], for the following reasons: it is rather simple and allows estimation of all parameters directly from the simulation of experimental data without integrating the reaction rate; it was originally developed for methacrylate polymerization, such as HEMA; and it is based on DSC data on the reaction rate, as those reported here. In brief, the effect of diffusion-controlled phenomena on the termination and propagation rate constants is taken into consideration using the following equations [16]:
1 k p = 1 k p 0 + 1 k p 0 exp [ A p ( 1 / V f 1 / V f , c p ) ]
1 k t = 1 k t 0 + 1 k t , r e s + k t 0 exp [ A t ( 1 / V f 1 / V f , c t ) ]
where kt,res denotes the contribution of the reaction-diffusion term on the termination rate constant, estimated from:
k t , r e s = R k p [ M ]
Vf is the fractional free volume of the system, related to the fractional free volumes of monomer (Vf,m) and polymer (Vf,p) from:
V f = V f , m φ m + V f , p ( 1 φ m )
with:
φ m = 1 X 1 X + X ( ρ m / ρ p )
V f , m = 0.025 + α m ( T T g , m )
V f , p = 0.025 + α p ( T T g , p )
φm is the volume fraction of the monomer; α denotes the coefficient of expansion; Tg the glass transition temperature; and ρ density. Subscripts m and p are associated with the monomer and polymer, respectively.
In the above set of equations, the thermal expansion coefficients, glass transition temperatures and densities of monomer and polymer were taken from Goodner et al. [16], as αm = 0.0005 °C−1, αp = 0.000075 °C−1, Tg,m = −60 °C, Tg,p = 55 °C, ρm = 1.073 g/cm3, ρp = 1.15 g/cm3. The value of the polymer glass transition temperature has been also experimentally measured by Bolbukh et al. [7], and the monomer density has been calculated by Buback and Kurz [22]. The initial concentration of the monomer can then be estimated as [M]0 = ρm/MWm = 1.073 × 1000/130 = 8.25 mol/L. The parameters of the diffusion-controlled model that have to be evaluated are Ap, Vf,cp, At, Vf,ct and R. To determine these parameters, we followed a slightly modified procedure from that described by Goodner et al. [16]. Accordingly, every set of these parameters can be estimated from linear plots, if we focus only on the particular region of the diffusion-controlled phenomena on the termination and propagation rate constants. As was mentioned above, during polymerization, four regions can be identified. At the early stages (less than 10%), no diffusional limitations on either termination or propagation reactions occur. The second region is that of the gel-effect region, where strong diffusional limitations are present on the termination rate constant, which decreases by several orders of magnitude, while kp remains constant. The latter also holds in the third region, where the decrease in kt slows down due to the so-called reaction diffusion controlled termination. This means that although macroradicals cannot easily move in space, they can implicitly move by the addition of monomer molecules. In the fourth region, propagation becomes also diffusion controlled, and kp significantly reduces with conversion.
Initially, in order to estimate the parameter, R, introduced to account for the reaction-diffusion controlled termination, it is assumed that the particular term dominates kt in this region (near 40–50% conversion), and thus, kt can be set equal to kt,res, i.e., kt = kt,res = R kp [M]. Under this condition, the polymerization rate, Equation (2), is expressed as:
R p = d X d t = k p ( f k d [ I ] R k p [ M ] ) 1 / 2 ( 1 X ) = ( k p f k d [ I ] ( 1 X ) R [ M ] 0 ) 1 / 2
The initiator concentration was assumed approximately equal to its initial value, [I]~[I]0, since during the whole polymerization time and for all temperatures investigated, the initiator consumption never exceeds 1% (calculated according to its decomposition rate constant). In the reaction-diffusion region, propagation is not diffusion-controlled and kp is approximated by kp0. Then, by rearranging Equation (12), the term, R, can be estimated from:
R = ( k p 0 f k d [ I ] ( 1 X ) R p 2 [ M ] 0 )
By plotting the right-hand side of Equation (13) as a function of the conversion, a straight horizontal line should be obtained. This has been done for all temperatures investigated, and at the particular region where this holds, the parameter R was evaluated and reported in Table 1.
Following, the diffusion-controlled parameters for the propagation reaction (i.e., Ap and Vf,cp) can be estimated from the results obtained in the fourth region, where the termination reaction is still reaction-diffusion controlled, but the propagation rate constant is also diffusion-controlled. Then, squaring Equation (12), rearranging and taking the natural logarithm leads to:
ln [ k p 0 f k d [ I ] ( 1 X ) R p 2 R [ M ] 0 1 ] = A p 1 V f A p V f , c p
Thus, plotting the left-hand side of Equation (14) vs. 1/Vf will provide Ap from the slope and Vf,cp from the intercept.
Finally, the gel-effect region can be analyzed similarly. In this region, kp can again be approximated by kp0. During autoacceleration, termination is governed by center-of-mass diffusional limitations, while the reaction-diffusion is still negligible. Under these conditions, the expression for kt is reduced to:
k t = k t 0 1 + exp [ A t ( 1 / V f 1 / V f , c t ) ]
Again, squaring Equation (2), rearranging and taking the natural logarithm leads to:
ln [ k t 0 R p 2 k p 0 2 f k d [ I ] ( 1 X ) 2 1 ] = A t 1 V f A t V f , c t
By plotting the left-hand side of Equation (16) vs. 1/Vf, the last two parameters, At and Vf,ct, can be determined.
Using the above procedure, all of the parameters were estimated, and results at different polymerization temperatures are included in Table 1.
It is seen that, as the polymerization temperature increases, the reaction-diffusion parameter, R, decreases, whereas Ap increases. In contrast, parameters, Vf,cp, Vf,ct and At are slightly affected by temperature. Thus, it seems that increased reaction temperatures lead to a higher mobility of the monomer molecules, and diffusion controlled phenomena affect the propagation reaction at higher conversions. In contrast, higher reaction temperature results in lower termination rate constants in the reaction-diffusion region. This means that the increased temperatures provide greater mobility to the macroradicals to move in space before freezing and terminate only by the implicit addition of monomer molecules. It should be noted here that the estimated values of R lie in between the values of 0.703 and 9.353 calculated for rigid or totally flexible chains [25]. Moreover, Goodner et al. [16] provided a value for R equal to four, which follows our estimations quite well if we extrapolate our vales to a temperature near 35 °C, where these authors carried out their experiments.
Using the parameters reported in Table 1, the termination and propagation rate constants can be estimated at different temperatures, and results appear in Figure 3. It can be observed that kp maintains a constant value up to 55–75% depending on the temperature. Afterwards, it drops approximately 1.5 orders of magnitude due to the effect of diffusion-controlled phenomena. The kt curve shows a more complex evolution. It drops quickly from its initial value, as growing macro-radicals experience diffusion limitations and autoacceleration occurs. After a reduction by two orders of magnitude and a conversion approximately equal to 50%, reaction-diffusion termination starts to dominate, and the decrease in kt is much more gradual. This slow decrease over the conversion range from 45–65% is due to the fact that the reaction-diffusion termination rate constant, kt,res, is proportional to the monomer concentration, [M], denoted by the unreacted double-bonds’ concentration. Since polymerization proceeds, the latter is still decreasing. When the glass-effect appears and kp starts to drop, kt again decreases through the reaction-diffusion proportionality. Moreover, from Figure 3, it can be observed that at lower temperatures, where both the small molecule and the macro-radical mobility is lower, the effect of diffusion-controlled phenomena is more pronounced in both kt and kp.
Finally, as can be seen in Figure 4, using this simplified model, an extremely good simulation of the experimental data at all different temperatures was obtained. Both the initial rate and the location and value of the maximum rate of polymerization are reproduced to within a few percent in all cases. Furthermore, the simulation captures the decrease in the rate almost exactly. What is important to note from the results shown in Figure 4 is that all parameters used were determined from the previous polymerization study, and the fitting of the reaction rate did not employ any additional adjustable parameter.

3.2. Polymerization Kinetics during the Formation of PΗΕΜΑ/OMMT Nanocomposites

Subsequently, the effect of adding a commercially-available nano-OMMT, namely Cloisite 15A, on the polymerization kinetics of HEMA at several temperatures was investigated. Nanocomposites of HEMA with different amounts of nano-montmorillonite were prepared.
The morphology of the nanocomposites was examined using X-ray analysis. The XRD diffractograms of the nanocomposites with 1, 3 and 5 wt % OMMT (i.e., Cloisite 15A), as well as of the pristine nano-clay appear in Figure 5. For the commercial OMMT, a large peak was measured at 2.99° denoting a d-spacing of 2.97 nm, close to the value reported by the manufacturer, i.e., 3.15 nm. All nanocomposites presented clear, but lower in intention peaks at 2θ angles equal to 2.07, 2.21 and 2.34° for the materials with 1, 3 and 5 wt % OMMT, respectively. These correspond to d001-spacing of 4.29, 4.02 and 3.79 nm, respectively (Figure 5). All of these values were higher compared to the pristine nano-clay. This shift suggests an increase in the basal spacing of the silicate platelets, which is attributed to the penetration of the macromolecular chains into the clay platelets. From these observations and considering that the measured peaks are rather weak and broad, it can be said that the morphology of the nanocomposites produced was mainly intercalated and partially exfoliated.
The effect of the amount of nanofiller on the variation of the polymerization rate and double bond conversion with time at two constant temperatures appears in Figure 6 and Figure 7, respectively. The presence of the nano-clay was found to enhance polymerization kinetics leading to higher conversion values at a specific reaction time.
The effective rate constants were estimated at both 60 and 82 °C according to the procedure described in the previous section. The relative amounts of keff compared to that of neat PHEMA, appear in Figure 8. It was observed that, at relatively low temperatures (i.e., 60 °C), the relative effective rate constant significantly increases with the amount of the nano-OMMT, whereas at higher temperatures, a much lower increase is clear.
Furthermore, the overall activation energy of the polymerization was calculated according to the procedure described in Section 3.1, and a value equal to 76.5 kJ mol−1 for the nanocomposite with 5 wt % nano-clay was obtained. This is lower compared to the corresponding neat PHEMA (i.e., 90.6 kJ mol−1). In general, one would assume higher activation energy of the nanocomposites due to the extra barriers that the nano-filler adds into the polymerizing mixture. The reason for the enhanced polymerization rate can be found if one examines polymerization at a microscopic level, presented in the Discussion section.

3.3. Polymerization Kinetics during the Formation of PΗΕΜΑ/Silica Nanocomposites

In this section, the effect of adding different amounts of nano-silica in the polymerization of HEMA is investigated. The results of the variation of the polymerization rate and conversion with time at 82 °C are included in Figure 9. In contrast to the nano-OMMT, adding nano-silica seems to retard the polymerization rate and shift the conversion vs. time curves to higher reaction times. In order to have safe results, the experiments were repeated also at lower reaction temperatures. Results are illustrated in Figure 10. It is seen that at all different reaction temperatures, the effect of nano-silica on the polymerization rate is the same. The reaction is retarded, and the conversion curves are shifted to higher times with increasing amounts of the nano-silica added.
Furthermore, the effective rate constants were estimated at all four temperatures, according to the procedure described in the previous section. The relative amounts of keff compared to that of neat PHEMA appear in Figure 11. It can be noticed that, at all reaction temperatures, the relative effective rate constant significantly decreases with the amount of the nano-silica, reaching almost 70% of the initial value when adding 5% of the nano-additive.
Finally, in order to estimate the effect of the nano-silica on the overall activation energy of the polymerization, Arrhenius-type plots were constructed at all amounts of the nano-additive and illustrated in Figure 12. Initially, it can be seen that the effective kinetic rate constant of the nanocomposites is always slightly lower compared to neat PHEMA at all temperatures and decreased with the amount of the nano-silica. Moreover, the activation energies estimated were 90.6 ± 2.4, 90.8 ± 3.9 and 91.2 ± 3.2 kJ/mol for the nanocomposites with 1, 3 and 5 wt % nano-silica, respectively. These values are similar to neat PHEMA (i.e., 90.6 kJ/mol) showing a slightly increasing trend with the amount of the nano-silica added.

4. Discussion

Although the polymerization kinetics of HEMA have been investigated in the literature [12,13,14,15,16,17], the development of a model, including both kinetic and diffusion-controlled parameters that have been estimated from experimental measurements, valid over the whole conversion range, has not appeared so far. In this framework, in the first part of this research, an accurate, rather simple, kinetic model for the polymerization of HEMA was provided, based on experimental DSC measurements. The variation of the polymerization rate with time at several isothermal reaction temperatures was presented, and kinetic rate constants and diffusion-controlled parameters were evaluated. It was found that using these parameters the evolution of the experimental polymerization rate with time can be simulated very well. All parameters estimated at different reaction temperatures are included in Table 1. These could be used in the development of more complex models for the simulation of the polymerization kinetics of HEMA and its copolymers.
In the second part, nanocomposites of PHEMA with several relative amounts of nano-clay and nano-silica were prepared in order to investigate the effect of the nano-additive on the polymerization kinetics of HEMA. The in situ bulk radical polymerization technique was investigated. Isothermal experimental data were obtained from DSC measurements. It was found that the inclusion of the nano-montmorillonite results in a slight enhancement of the polymerization rate, while the inverse holds when adding nano-silica.
The interpretation of these results can be carried out in terms of specific interactions and particularly the formation of intra- and inter-chain hydrogen bonds between the monomer and the polymer molecules. The monomer, 2-hydroxyethyl methacrylate, contains one hydroxyl (–OH) and one carbonyl (C=O) group on its molecule. The C=O group acts only as the proton acceptor, while the OH group acts as both the proton donor and acceptor [26]. Hydrogen bonding between the monomer hydroxyl group and carbonyl oxygen atom strengthens the positive partial charges at the carbonyl C atom and at the double bond, as shown schematically in Scheme 1, leading to a significant charge transfer in the transition state of propagation [27]. In the polymer, PHEMA, both OH OH and C = O HO types of hydrogen-bonds can occur (Scheme 1). Not only the dimer structure ( OH OH ), but also the aggregate structure ( OH OH OH ) have been found in many systems, including liquid alcohols and solid polymers [26]. It has been found that 53.7% of the OH group on the PHEMA side chain terminal contributes to the OH OH type of hydrogen-bond, while the remaining 47.3% are engaged in the OH O = C type of hydrogen bond, at ambient temperature [26].
When the nano-clay, OMMT, is added to the system, the clay platelets are partially exfoliated due to the ultrasound agitation and polymerization, by the insertion of the macromolecular chains in between the clay galleries, as was observed from XRD measurements. Then, the HEMA-HEMA interactions with the hydrogen bonding are disrupted, by the existence of the clay platelets inserted in between the monomer molecules and macromolecular chains, as shown schematically in Scheme 2. This could result in more reactive monomer molecules during polymerization that could facilitate the reaction rate, resulting in higher kinetic rate constants and less overall activation energy. The disruption of hydrogen bonding between HEMA molecules is thus consistent with the increased rate of monomer addition to the macroradicals compared to that in neat polymerization. Moreover, at high temperatures, monomer molecules and macroradicals have enough mobility, and their movement is not affected much by the presence of the side hydrogen bonds. However, at lower temperatures, hydrogen bonding significantly decreases the reactivity of radicals and monomer molecules, and as a result, the presence of nano-clays, which disrupt those bonds, contributes much to a higher polymerization rate (Figure 7).
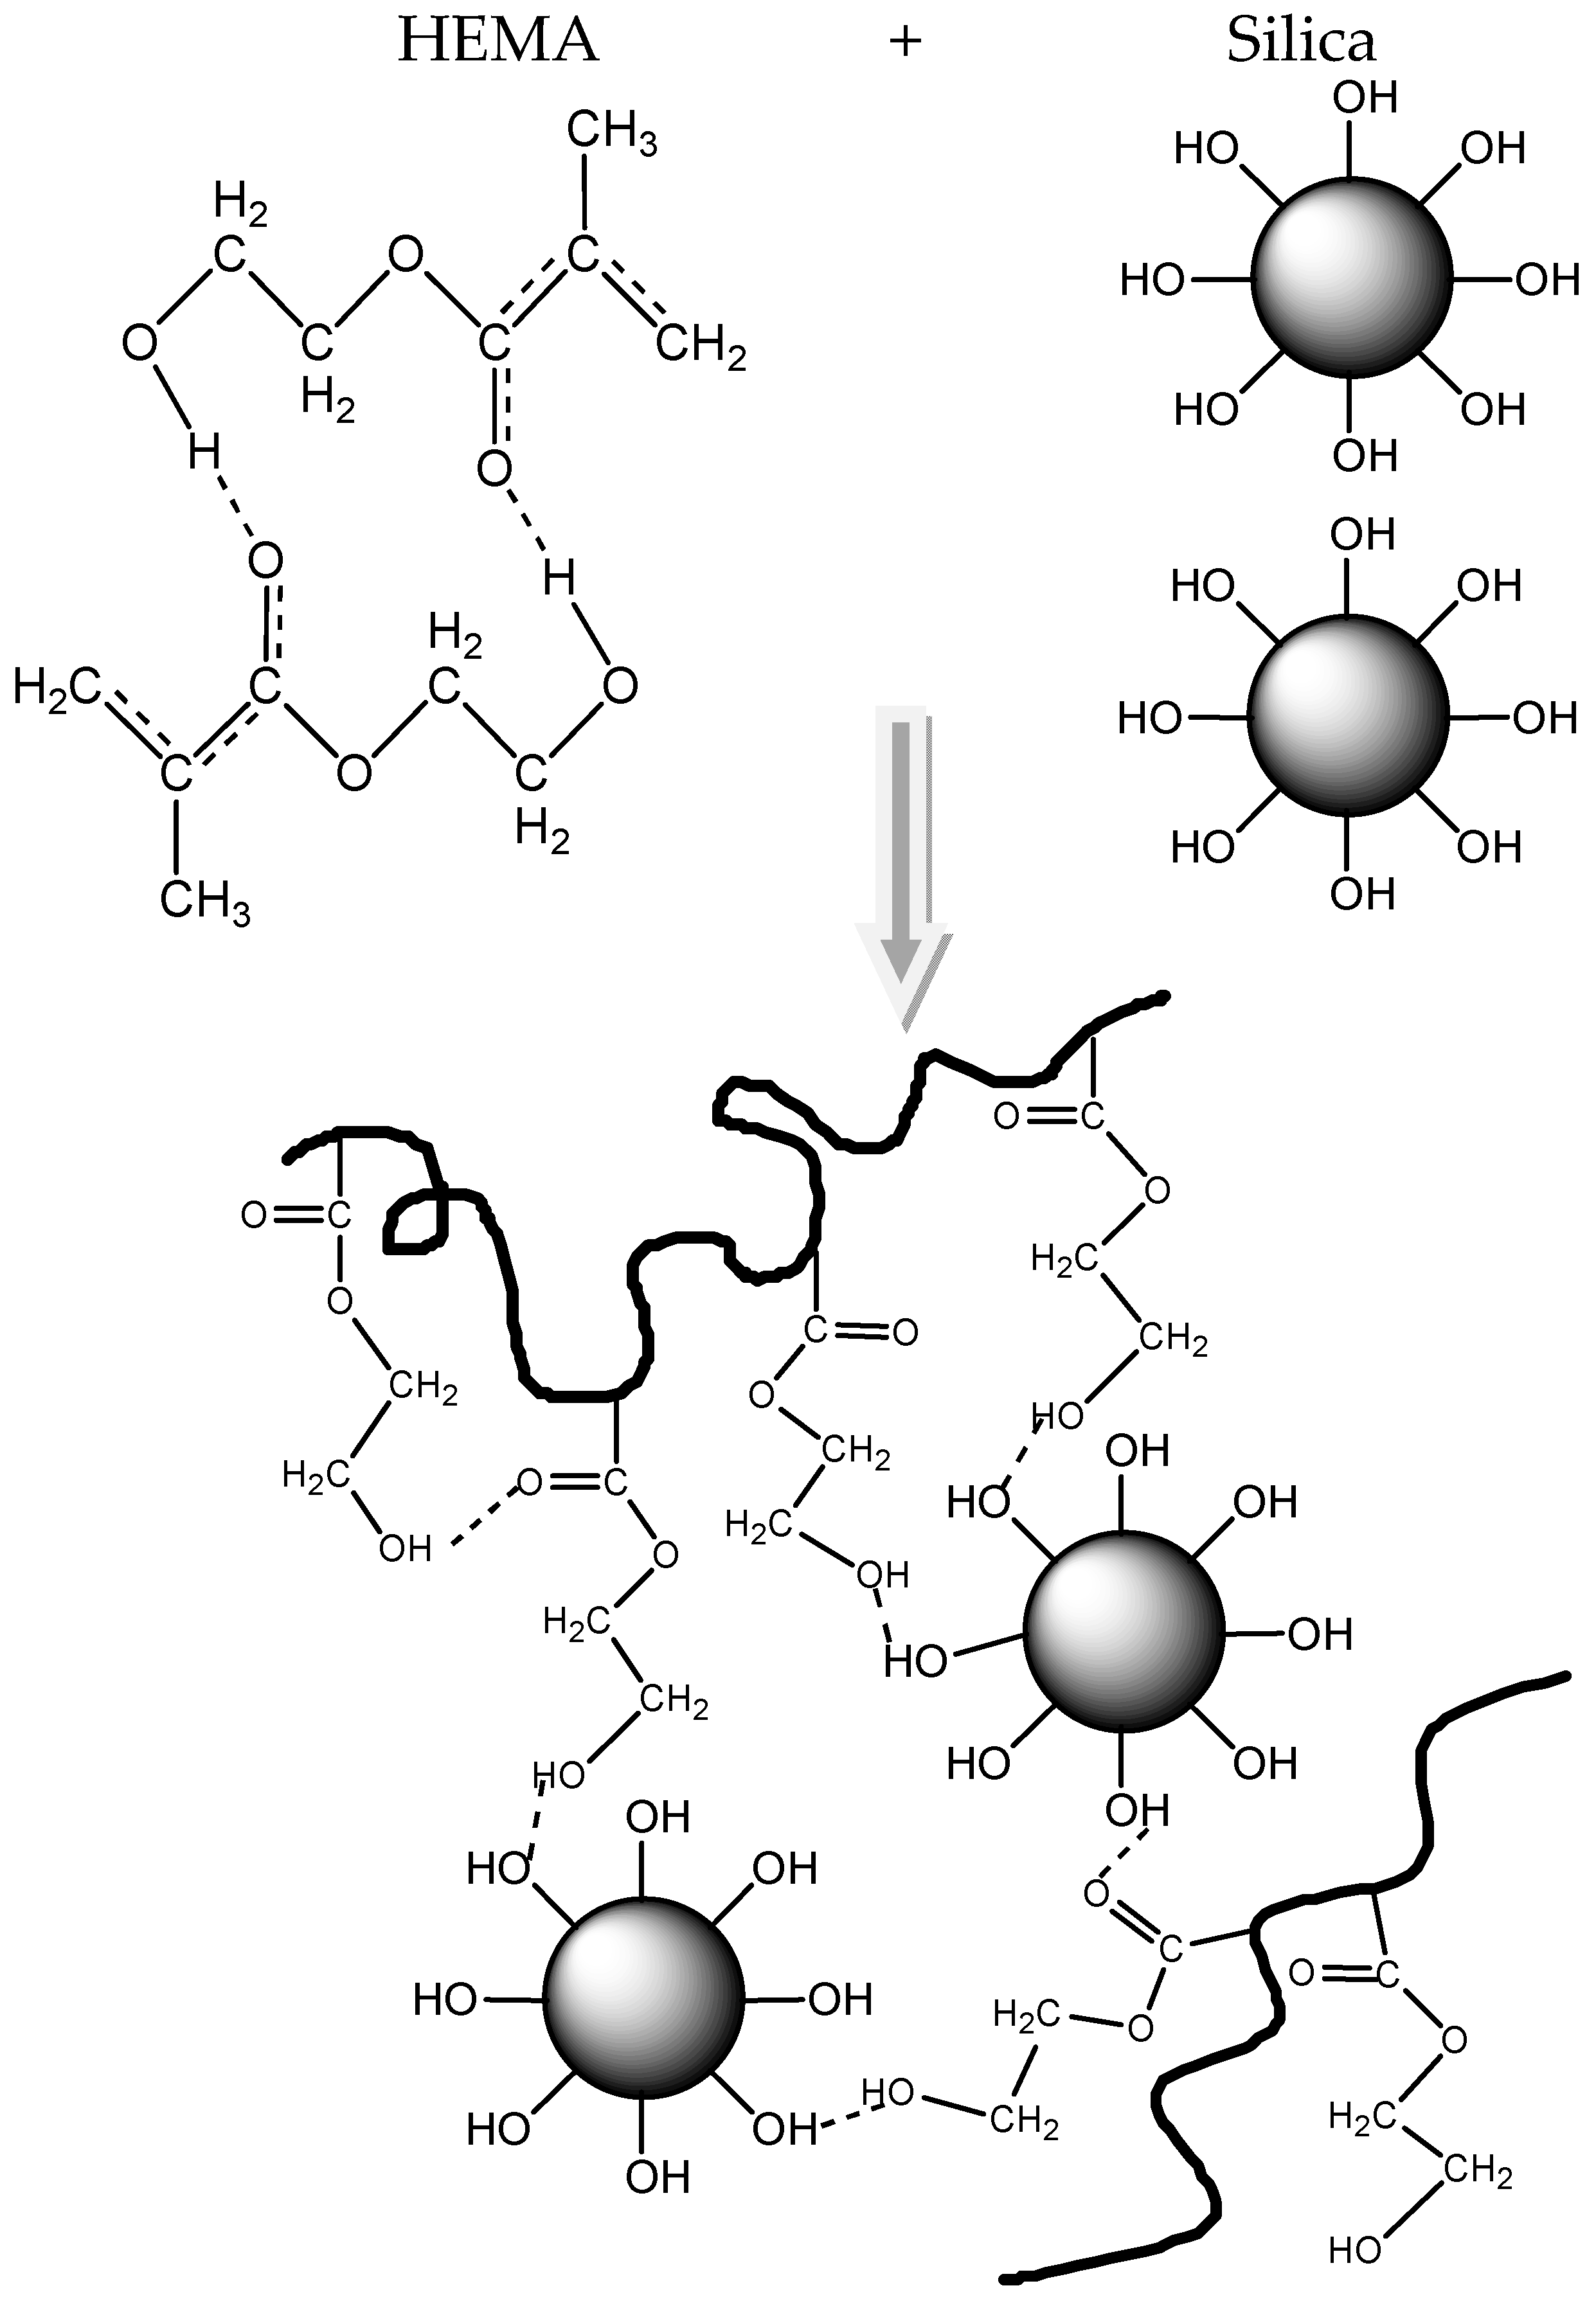
In contrast, polymerization of HEMA in the presence of nano-silica resulted in retarded polymerization rates and lower effective kinetic rate constants compared to neat PHEMA. It seems that the presence of hydroxyl groups in the surface of the nano-silica results in the formation of hydrogen bonds between the polymer and the nano-additive, resulting in lower reactivity of the monomer. Intra-molecular HEMA-HEMA hydrogen bonding interactions are disturbed and replaced by inter-molecular hydrogen bonds between the hydroxyls in the surface of silica with carbonyls and/or hydroxyls present in the PHEMA macromolecular chain, as shown schematically in Scheme 3. This gives rise to a reduction in the polymerization rate compared to neat HEMA, more pronounced as the amount of nano-silica is increased. It should be noted here that similar results have been observed during polymerization of HEMA in polar solvents, such as DMF [28].
The above assumptions, concerning hydrogen bonding of PHEMA during polymerization, were partially verified by FTIR measurements. The FTIR spectra of neat PHEMA and the nanocomposites were recorded, and details in the regions of interest are shown in Figure 13. Particularly, Figure 13a shows the IR spectra in the O–H stretching region, whereas Figure 13b shows the corresponding IR spectra in the C=O stretching region.
Several contributions from 3100–3700 cm−1 are identified in the O–H stretching region. According to Morita et al. [26], the band at 3536 cm−1 is attributed to hydrogen-bonded hydroxyl groups, whereas at 3624–3660 cm−1 to free OH. According to Figure 13a, signals at the latter region were not identified in any material investigated. Therefore, it seems that there are not many free hydroxyls, i.e., the OH groups are not donating hydrogen bonds. Moreover, a dominant peak at 3536 cm−1 was recorded for neat PHEMA, meaning the existence of hydrogen-bonded hydroxyls. In the PHEMA/SiO2 nanocomposites, this peak was shifted to lower wavenumber at 3430 cm−1, providing evidence of the gradual association of the OH OH type of hydrogen bonds with the addition of the nanosilica.
In the C=O stretching region, two contributions around 1730 and 1637 cm−1 were identified. Again, these bands are assigned to free C=O groups and hydrogen-bonded carbonyl groups, respectively [26]. The peak position and width of the band around 1730 cm−1 slightly changed with the addition of the nanofiller, whereas for the band around 1637 cm−1, the position again slightly changed, although its width varied significantly. Particularly, the peak at 1637 cm−1 almost disappeared at the PHEMA/OMMT nanocomposite, whereas it became very broad and intensive in the PHEMA/silica materials. Therefore, it seems that only a small number of hydrogen bonded C=O appears in neat PHEMA, which is negligible in PHEMA/OMMT nanocomposites. In contrast, in the C=O stretching region, it was found that the association of the C = O HO -type of hydrogen bond occurs to a large extent when silica is used.

5. Conclusions

In this study, the polymerization kinetics of PHEMA was studied both experimentally using DSC measurements and theoretically. A simplified kinetic model was developed taking into account both the chemical reactions and diffusion-controlled phenomena and valid over the whole conversion range. Kinetic and diffusion-controlled parameters were evaluated, and the model was able to simulate successfully the variation of the polymerization rate with time. The main conclusion drawn from the study on the formation of nanocomposite materials based on PHEMA is that the polymerization rate can be either enhanced or decreased depending on the type and the amount of the nanofiller used. Thus, the effective overall kinetic rate constant was found to increase with the amount of the nano-filler when a nano-clay was used, whereas the inverse was observed when nano-silica was used. It seems that nano-compounds having surface functional groups, such as hydroxyls in the case of silica, may form hydrogen bonds with the carbonyls or hydroxyl groups of the polymer, resulting somehow in the retardation of the reaction. In contrast, the addition of clay platelets may result in the dissociation of hydrogen bonds existing in the polymer molecules, resulting thus in slightly higher reaction rates.

Author Contributions

D.S.A. and P.I.S. conceived of and designed the experiments. P.I.S. performed the experiments. D.S.A. wrote the paper and performed the simulation analysis.

Conflicts of Interest

The authors declare no conflict of interest.

References

  1. Nogueira, N.; Conde, O.; Minones, M.; Trillo, J.M.; Minones, J.R. Characterization of poly(2-hydroxyethyl methacrylate) contact lens using the Langmuir monolayer technique. J. Colloid Interface Sci. 2012, 385, 202–210. [Google Scholar] [CrossRef] [PubMed]
  2. Montheard, J.P.; Chatzopoulos, M.; Chappard, D. 2-Hydroxyethyl methacrylate (HEMA): Chemical properties and applications in biomedical fields. J. Macromol. Sci. C Polym. Rev. 1992, 32, 1–34. [Google Scholar] [CrossRef]
  3. Gupta, M.K.; Bajpai, J.; Bajpai, A.K. Optimizing the release process and modelling of in vitro release data of cis-dichlorodiamminoplatinum (II) encapsulated into poly(2-hydroxyethyl methacrylate) nanocarriers. Mater. Sci. Eng. C 2016, 58, 852–862. [Google Scholar] [CrossRef] [PubMed]
  4. Costantini, A.; Luciani, G.; Annunziata, G.; Silvestri, B.; Branda, F. Swelling properties and bioactivity of silica gel/pHEMA Nanocomposites. J. Mater. Sci. Mater. Med. 2006, 17, 319–325. [Google Scholar] [CrossRef] [PubMed]
  5. Kharismadewi, D.; Haldorai, Y.; Nguyen, V.H.; Tuma, D.; Shim, J.-J. Synthesis of graphene oxide-poly(2-hydroxyethyl methacrylate) composite by dispersion polymerization in supercritical CO2: Adsorption behavior for the removal of organic dye. Compos. Interfaces 2016, 23, 7. [Google Scholar] [CrossRef]
  6. Moradi, O.; Aghaie, M.; Zare, K.; Monajjemi, M.; Aghaie, H. The study of adsorption characteristics Cu2+ and Pb2+ ions onto PHEMA and P(MMA-HEMA) surfaces from aqueous single solution. J. Hazard. Mater. 2009, 170, 673–679. [Google Scholar] [CrossRef] [PubMed]
  7. Bolbukh, Y.; Klonos, P.; Roumpos, K.; Chatzidogiannaki, V.; Tertykh, V.; Pissis, P. Glass transition and hydration properties of polyhydroxyethylmethacrylate filled with modified silica nanoparticles. J. Therm. Anal. Calorim. 2016, 125, 1387–1398. [Google Scholar] [CrossRef]
  8. Nikolaidis, A.K.; Achilias, D.S.; Karayannidis, G.P. Synthesis and characterization of PMMA/organomodified montmorillonite nanocomposites prepared by in situ bulk polymerization. Ind. Eng. Chem. Res. 2011, 50, 571–579. [Google Scholar] [CrossRef]
  9. Achilias, D.S.; Siafaka, P.I.; Nikolaidis, A.K. Polymerization kinetics and thermal properties of poly(alkyl methacrylate)/organomodifiend montmorillonite nanocomposites. Polym. Int. 2012, 61, 1510–1518. [Google Scholar] [CrossRef]
  10. Passos, M.F.; Dias, D.R.C.; Bastos, G.N.T.; Jardini, A.L.; Benatti, A.C.B.; Dias, C.G.B.T.; Maciel Filho, R. PHEMA Hydrogels. J. Therm. Anal. Calorim. 2016, 125, 361–368. [Google Scholar] [CrossRef]
  11. Ning, L.; Xu, N.; Xiao, C.; Wang, R.; Liu, Y. Analysis for the reaction of hydroxyethyl methacrylate/benzoyl peroxide/polyethacrylate through DSC and viscosity changing and their resultants as oil absorbent. J. Macromol. Sci. Part A Pure Appl. Chem. 2015, 52, 1017–1027. [Google Scholar] [CrossRef]
  12. Huang, C.-W.; Sun, Y.-M.; Huang, W.-F. Curing kinetics of the synthesis of poly(2-hydroxyethyl methacrylate) (PHEMA) with ethylene glycol dimethacrylate (EGDMA) as a crosslinking agent. J. Polym. Sci. A Polym. Chem. 1997, 35, 1873–1889. [Google Scholar] [CrossRef]
  13. Kaddami, H.; Gerard, J.F.; Hajji, P.; Pascault, J.P. Silica-filled poly(hema) from hema/grafted SiO2 nanoparticles: Polymerization kinetics and rheological changes. J. Appl. Polym. Sci. 1999, 73, 2701–2713. [Google Scholar] [CrossRef]
  14. Li, L.; Lee, L.J. Photopolymerization of HEMA/DEGDMA hydrogels in solution. Polymer 2005, 46, 11540–11547. [Google Scholar] [CrossRef]
  15. Mikos, A.G.; Peppas, N.A. A model for prediction of the structural characteristics of EGDMA crosslinked PHEMA microparticles produced by suspension copolymerization/crosslinking. J. Controll. Release 1987, 5, 53–62. [Google Scholar] [CrossRef]
  16. Goodner, M.D.; Lee, H.R.; Bowman, C.N. Method for determining the inetic parameters in diffusion-controlled free-radical homopolymerizations. Ind. Eng. Chem. Res. 1997, 36, 1247–1252. [Google Scholar] [CrossRef]
  17. Hacioglu, B.; Berchtold, K.A.; Lovell, L.G.; Nie, J.; Bowman, C.N. Polymerization kinetics of HEMA/DEGDMA: using changes in initiation and chain transfer rates to explore the effects of chain-length-dependent termination. Biomaterials 2002, 23, 4057–4064. [Google Scholar] [CrossRef]
  18. Achilias, D.S. Investigation of the radical polymerization kinetics using DSC and mechanistic or isoconversional methods. J. Therm. Anal. Calorim. 2014, 116, 1379–1386. [Google Scholar] [CrossRef]
  19. Siafaka, P.; Achilias, D.S. Polymerization kinetics and thermal degradation of poly(2-hydroxyethyl methacylate)/organomodified montmorillonite nanocomposites prepared by in situ bulk polymerization. Macromol. Symp. 2013, 331–332, 166–172. [Google Scholar] [CrossRef]
  20. Achilias, D.S. A review of modeling of diffusion controlled polymerization reactions. Macromol. Theory Simul. 2007, 16, 319–347. [Google Scholar] [CrossRef]
  21. Achilias, D.S.; Verros, G.D. Modeling of Diffusion-Controlled Reactions in Free Radical Solution and Bulk Polymerization: Model Validation by DSC Experiments. J. Appl. Polym. Sci. 2010, 116, 1842–1856. [Google Scholar] [CrossRef]
  22. Buback, M.; Kurz, C.H. Free-radical propagation coefficients for cyclohexyl methacrylate, glycidyl methacrylate and 2-hydroxyethyl methacrylate homopolymerizations. Macromol. Chem. Phys. 1998, 199, 2301–2310. [Google Scholar] [CrossRef]
  23. Siddiqui, M.N.; Redhwi, H.H.; Vakalopoulou, E.; Tsagkalias, I.; Ioannidou, M.D.; Achilias, D.S. Synthesis, characterization and reaction kinetics of PMMA/silver nanocomposites prepared via in situ radical polymerization. Eur. Polym. J. 2015, 72, 256–269. [Google Scholar] [CrossRef]
  24. Zoller, A.; Gigmes, D.; Guillaneuf, Y. Simulation of radical polymerization of methyl methacrylate at room temperature using a tertiary amine/BPO initiating system. Polym. Chem. 2015, 6, 5719–5727. [Google Scholar] [CrossRef]
  25. Achilias, D.S.; Kiparissides, C. Development of a general mathematical framework for modeling of diffusion-controlled free-radical polymerization reactions. Macromolecules 1992, 25, 3739–3750. [Google Scholar] [CrossRef]
  26. Morita, S. Hydrogen-bonds structure in poly(2-hydroxyethyl methacrylate) studied by temperature- dependent infrared spectroscopy. Front. Chem. 2014, 2, 1–5. [Google Scholar] [CrossRef] [PubMed]
  27. Liang, K.; Hutchinson, R.A. Solvent Effects on Free-Radical Copolymerization Propagation Kinetics of Styrene and Methacrylates. Macromolecules 2010, 43, 6311–6320. [Google Scholar] [CrossRef]
  28. Furuncuoglu Ozaltin, T.; Dereli, B.; Karahan, O.; Salman, S.; Aviyente, V. Solvent effects on free-radical copolymerization of styrene and 2-hydroxyethyl methacrylate: A DFT study. New J. Chem. 2014, 38, 170–178. [Google Scholar] [CrossRef]
Figure 1. Variation of the amount of heat released (a) and conversion (b) with time during the bulk radical polymerization of HEMA at several constant temperatures.
Processes 05 00021 g001
Figure 2. Estimation of the effective kinetic rate constant, keff, using experimental data in the conversion region 1–7% at several temperatures (a) and the Arrhenius-type plot to calculate the overall (effective) activation energy of HEMA polymerization (b).
Processes 05 00021 g002
Figure 3. Variation of the termination and propagation rate constants estimated from Equations (5) and (6) with conversion at several reaction temperatures, using the parameters reported in Table 1.
Processes 05 00021 g003
Figure 4. Comparison of the experimental and simulated rate curves for HEMA polymerization at different temperatures.
Processes 05 00021 g004
Figure 5. XRD diffraction patterns of the organomodified montmorillonite (OMMT) (Cloisite 15A) used and the PHEMA/OMMT nanocomposites.
Processes 05 00021 g005
Figure 6. Effect of the amount of nano-OMMT on the variation of polymerization rate (a) and conversion (b) with time during polymerization of HEMA at 60 °C.
Processes 05 00021 g006
Figure 7. Effect of the amount of nano-OMMT on the variation of polymerization rate (a) and conversion (b) with time during polymerization of HEMA at 82 °C.
Processes 05 00021 g007
Figure 8. Relative effective kinetic rate constants obtained during polymerization of PHEMA/n-OMMT nanocomposites at two temperatures as a function of the amount of n-OMMT.
Processes 05 00021 g008
Figure 9. Effect of the amount of nano-silica on the variation of polymerization rate (a) and conversion (b) with time during polymerization of HEMA at 82 °C.
Processes 05 00021 g009
Figure 10. Effect of the amount of nano-silica on the variation of conversion with time during polymerization of HEMA at 60 (a) and 52 °C (b).
Processes 05 00021 g010
Figure 11. Relative effective kinetic rate constants obtained during polymerization of PHEMA/nano-silica nanocomposites at temperatures of 52, 60, 72 and 82 °C as a function of the amount of the additive.
Processes 05 00021 g011
Figure 12. Arrhenius-type plots to calculate the overall (effective) activation energies of PHEMA/nano-silica nanocomposites.
Processes 05 00021 g012
Scheme 1. Schematic illustration of the polymerization of HEMA to PHEMA and the intra- and inter-chain hydrogen bonds formed.
Processes 05 00021 sch001
Scheme 2. Schematic illustration of the polymerization of HEMA to PHEMA in the presence of nano-OMMT.
Processes 05 00021 sch002
Scheme 3. Schematic illustration of the polymerization of HEMA to PHEMA in the presence of nano-silica.
Processes 05 00021 sch003
Figure 13. Details of the FTIR spectra of neat PHEMA and PHEMA nanocomposites with 3 wt % OMMT or 3 wt % silica in the region 3750–2700 cm−1 (a) and 2100–1500 cm−1 (b).
Processes 05 00021 g013
Table 1. Values of kinetic and diffusion-controlled parameters obtained in this study during bulk polymerization of HEMA with the benzoyl peroxide (BPO) initiator.
T (°C)keff (min−1)kp0/√kt0 (L/mol/s)1/2kp0 [22] (L/mol/s)kt0 (L/mol/s)R (L/mol)ApfcpAtfct
520.005971.127826855.667E63.200.5950.05001.400.083
600.014001.401432625.78E62.010.640.04851.350.084
720.042351.725742956.195E61.340.850.04811.280.0876
820.102222.064153266.657E60.911.140.04451.390.0858