As mentioned in the introduction, linear parameter estimation techniques were originally used for reactivity ratio estimation (RRE) due to lack of computational power. However, since the required technology is now readily available, linear parameter estimation techniques should no longer be used for RRE. Linearizing or transforming the model distorts the error structure and may result in faulty parameter estimates. The statement may seem obvious but it is still worth emphasizing: linear parameter estimation techniques should not be used for the estimation of parameters in non-linear models!
Although most polymer researchers know that linear techniques are inaccurate, they are still taught in both introductory and graduate level polymer chemistry/science courses. Additionally, in perhaps the most commonly perused non-technical “reference,” Wikipedia, only the outdated linear techniques are mentioned. It is no wonder, then, that researchers continue to use incorrect parameter estimation techniques.
Exhibit A presents an overview of recent literature [
10,
11,
12,
13] regarding the copolymerization of 2-methylene-1,3-dioxepane (MDO; monomer 1) and vinyl acetate (VAc; monomer 2) (see also
Table 1; RR stands for reactivity ratio). This copolymer has gained considerable attention in the past decade, largely due to its degradable properties. Researchers are especially interested in the reactivity ratios for the system, as reactivity ratios provide information about the copolymer microstructure. However, the reactivity ratio estimation (RRE) techniques used in this field are often incorrect. This case study will focus primarily on the issue of linear parameter estimation techniques, but invalid low conversion assumptions (that is, inappropriate use of the instantaneous copolymerization model) and error-prone data cannot be overlooked. Therefore, to demonstrate the advantages of EVM, select data from the literature will be re-evaluated (properly) and comparisons will be conducted.
Evaluation of MDO/VAc Copolymerization Data: Fineman-Ross vs. EVM
In a recent study by Undin et al. [
11], experimental data from six distinct feed compositions were used to estimate reactivity ratios for the MDO/VAc copolymerization. These six (batch) runs were allowed to continue until conversion did not change and the final conversion and composition measurements were reported. Finally, the reactivity ratios for the system were calculated using the Fineman-Ross (F-R) method. However, as mentioned briefly in
Table 1, the data on the x and y axes were unintentionally flipped in the analysis; thus, the reactivity ratio estimates originally reported are not representative of the experimental data collected.
Besides this unintended error, there are several other problems with the analysis, including (1) the use of undesigned data (that is, no design of experiments used for the selection of feed compositions); (2) the lack of composition drift considerations (RRE experiments should be performed at low conversion, or a cumulative model should be used); (3) the use of an outdated (and linear!) RRE technique. For the purposes of this discussion, we will focus on the use of the F-R method for RRE but the other important points should also be noted and kept in mind.
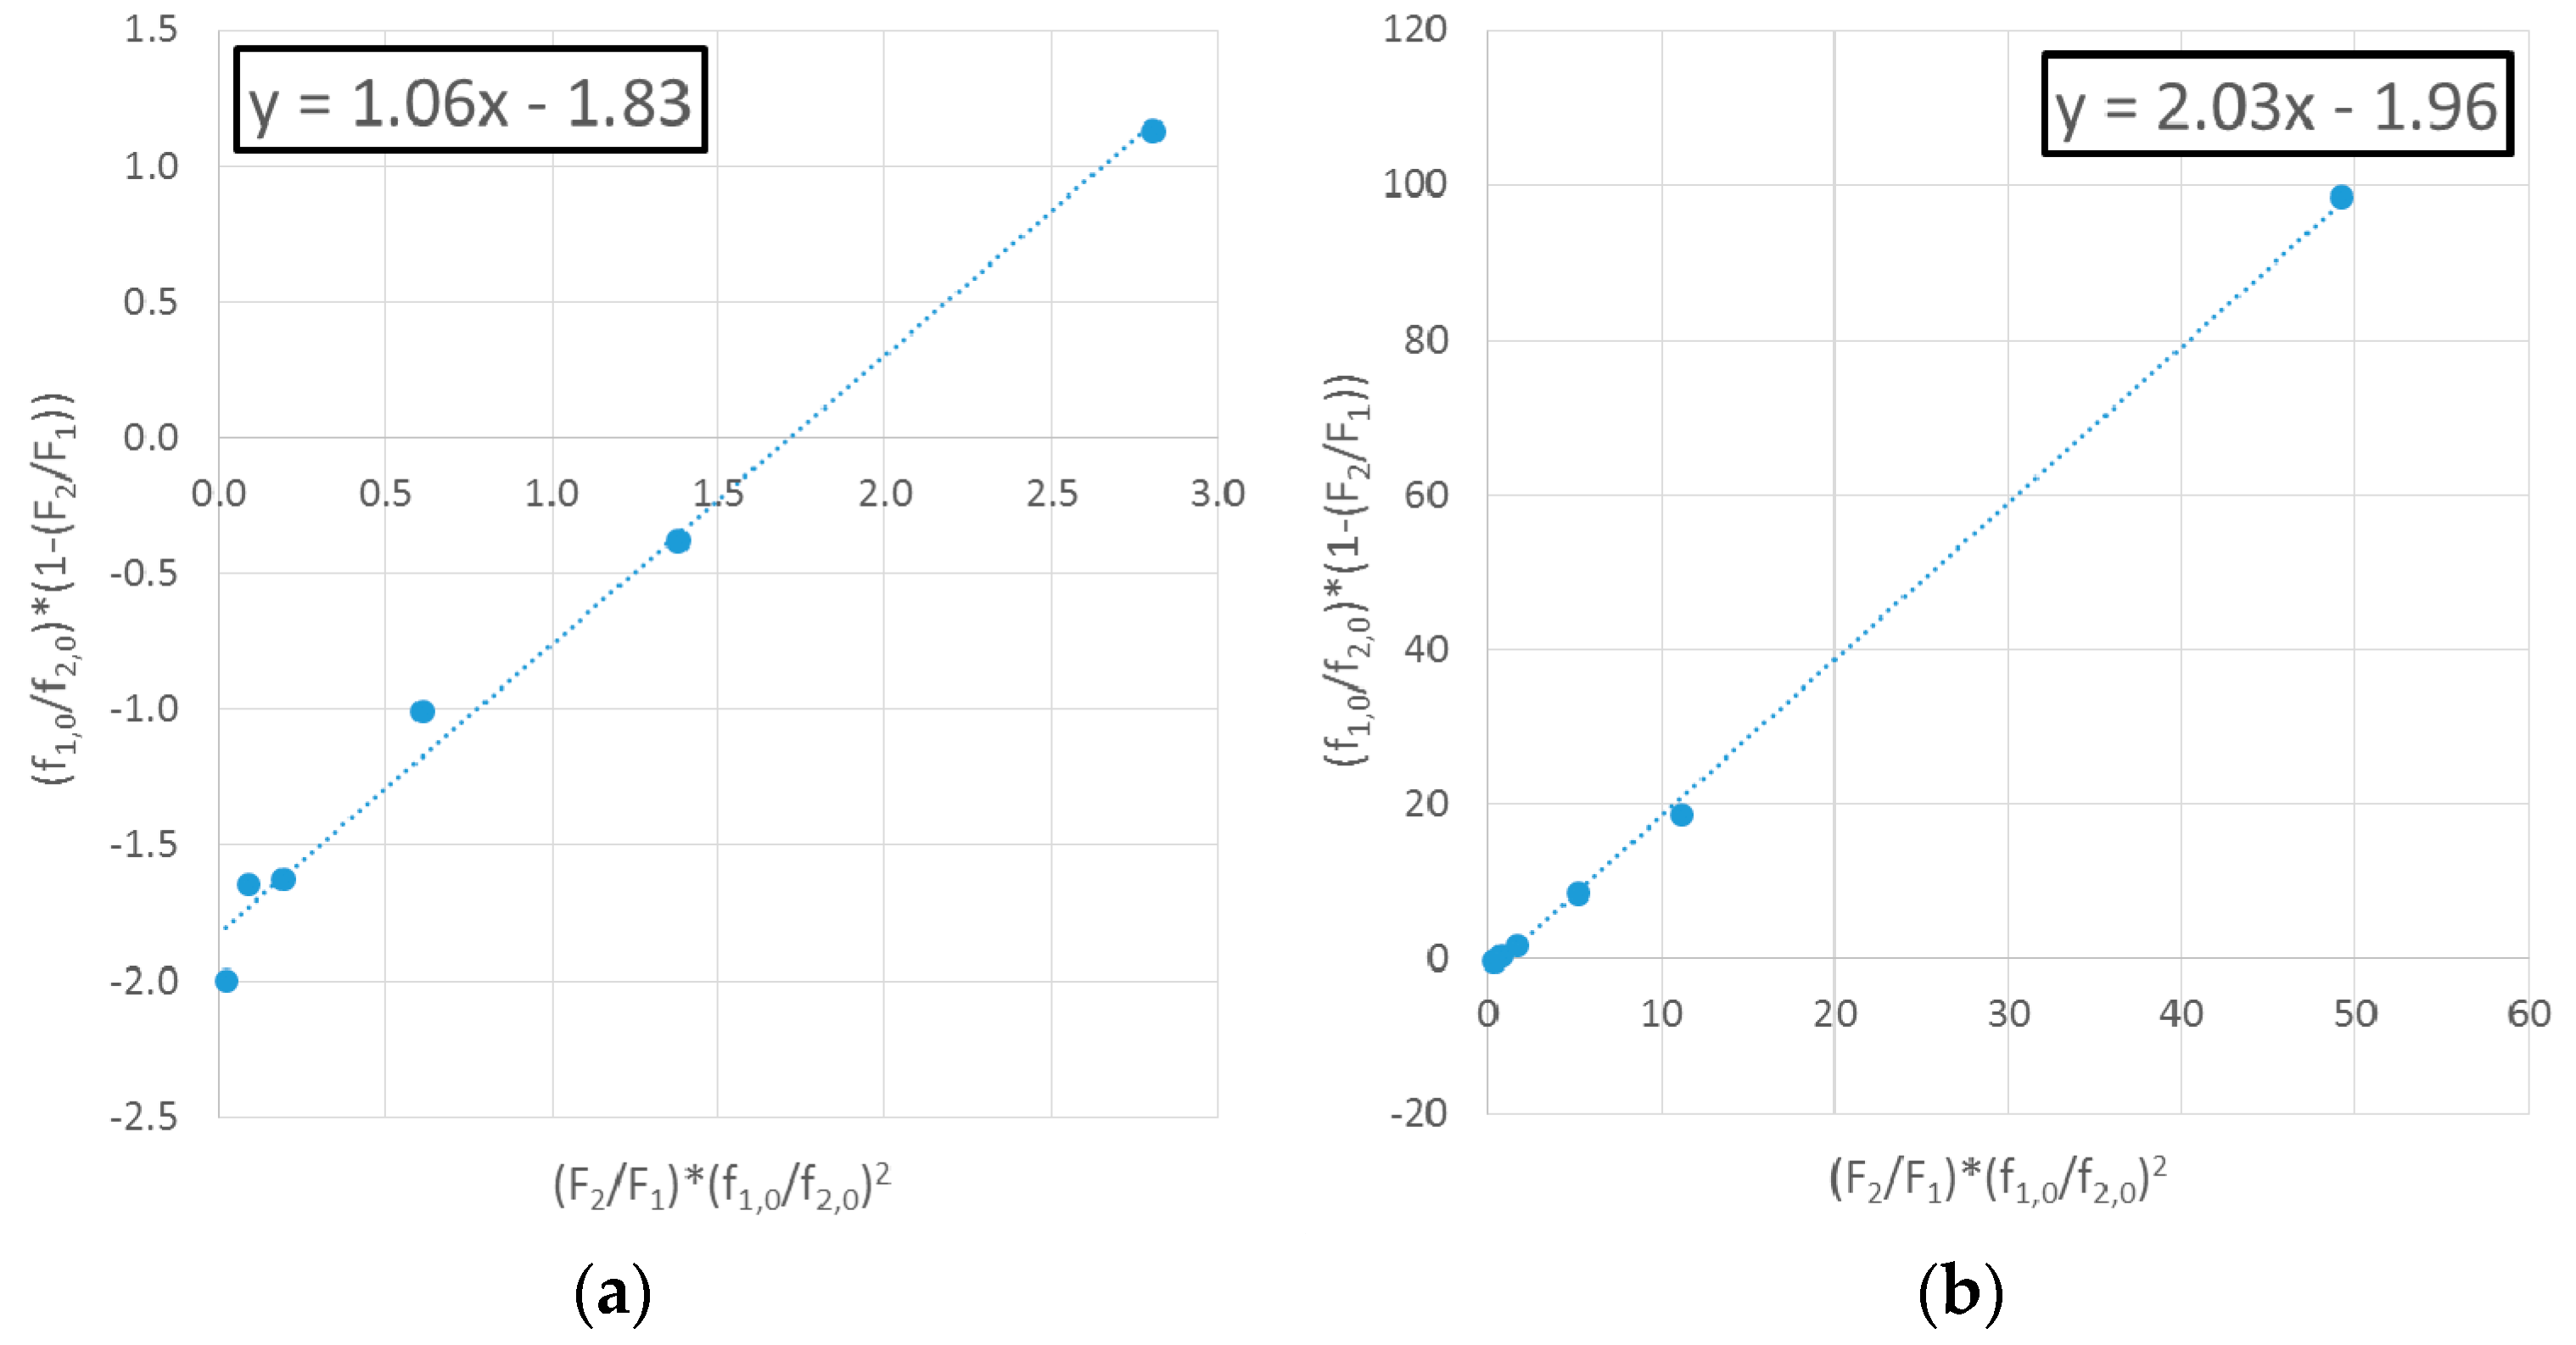
As discussed by Hagiopol [
15], the F-R method is often justified by its simplicity. However, it has many shortcomings, including unequal weighting of experimental data and symmetry issues (i.e., calculation results depend on which monomer is selected as M
1). The data set presented in [
11] is especially vulnerable to these shortcomings, largely due to the undesigned initial feed compositions (collection and use of undesigned data for parameter estimation also induce considerable correlation between the parameters, which is highly undesirable). As shown in
Table 2, some of the data are obtained under fairly low M
1 comonomer feed fraction; these conditions tend to have the greatest influence on the slope of a line, which ultimately affects reactivity ratio estimates obtained using the F-R method [
15].
The more pressing concern with the F-R method (also described by Hagiopol [
15]) is the lack of symmetry. Thus, values of
r1 and
r2 depend on which monomer is selected as M
1. To demonstrate this point, the data collected by Undin et al. [
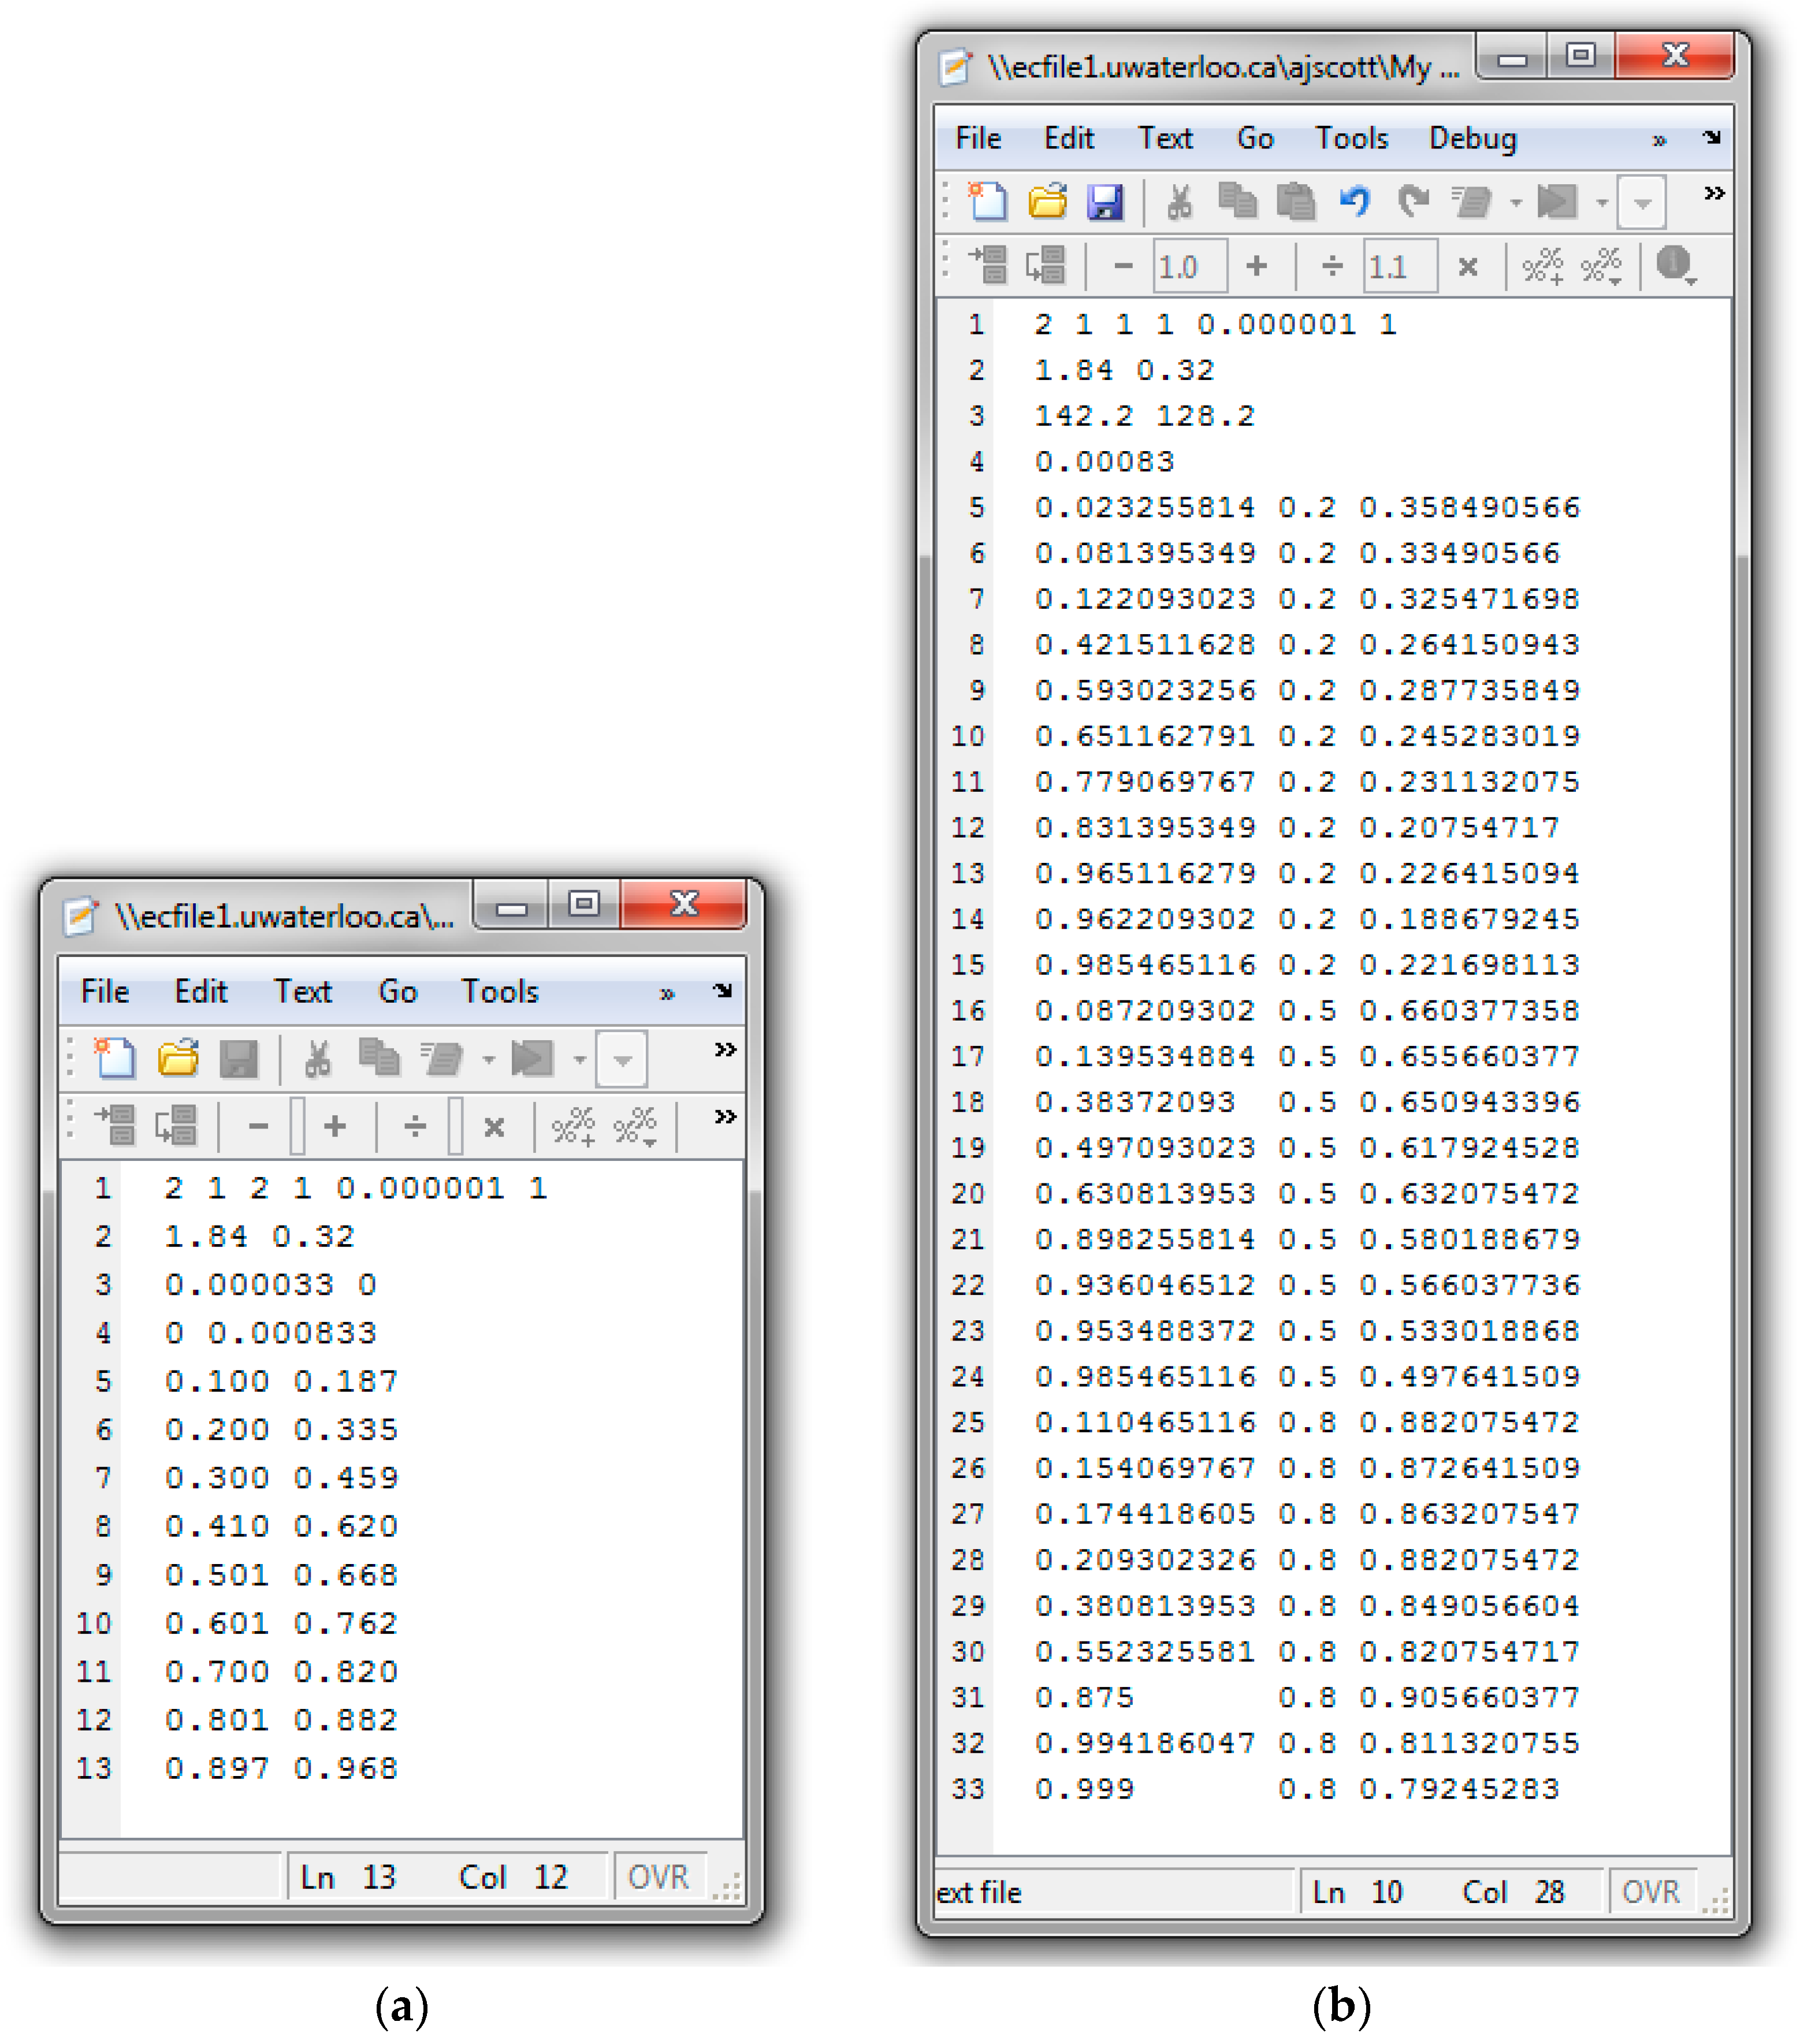
11] are evaluated with M
1 = MDO (which was performed incorrectly in the original work; see
Figure 4a) and with M
1 = VAc (performed herein for the demonstration; see
Figure 4b).
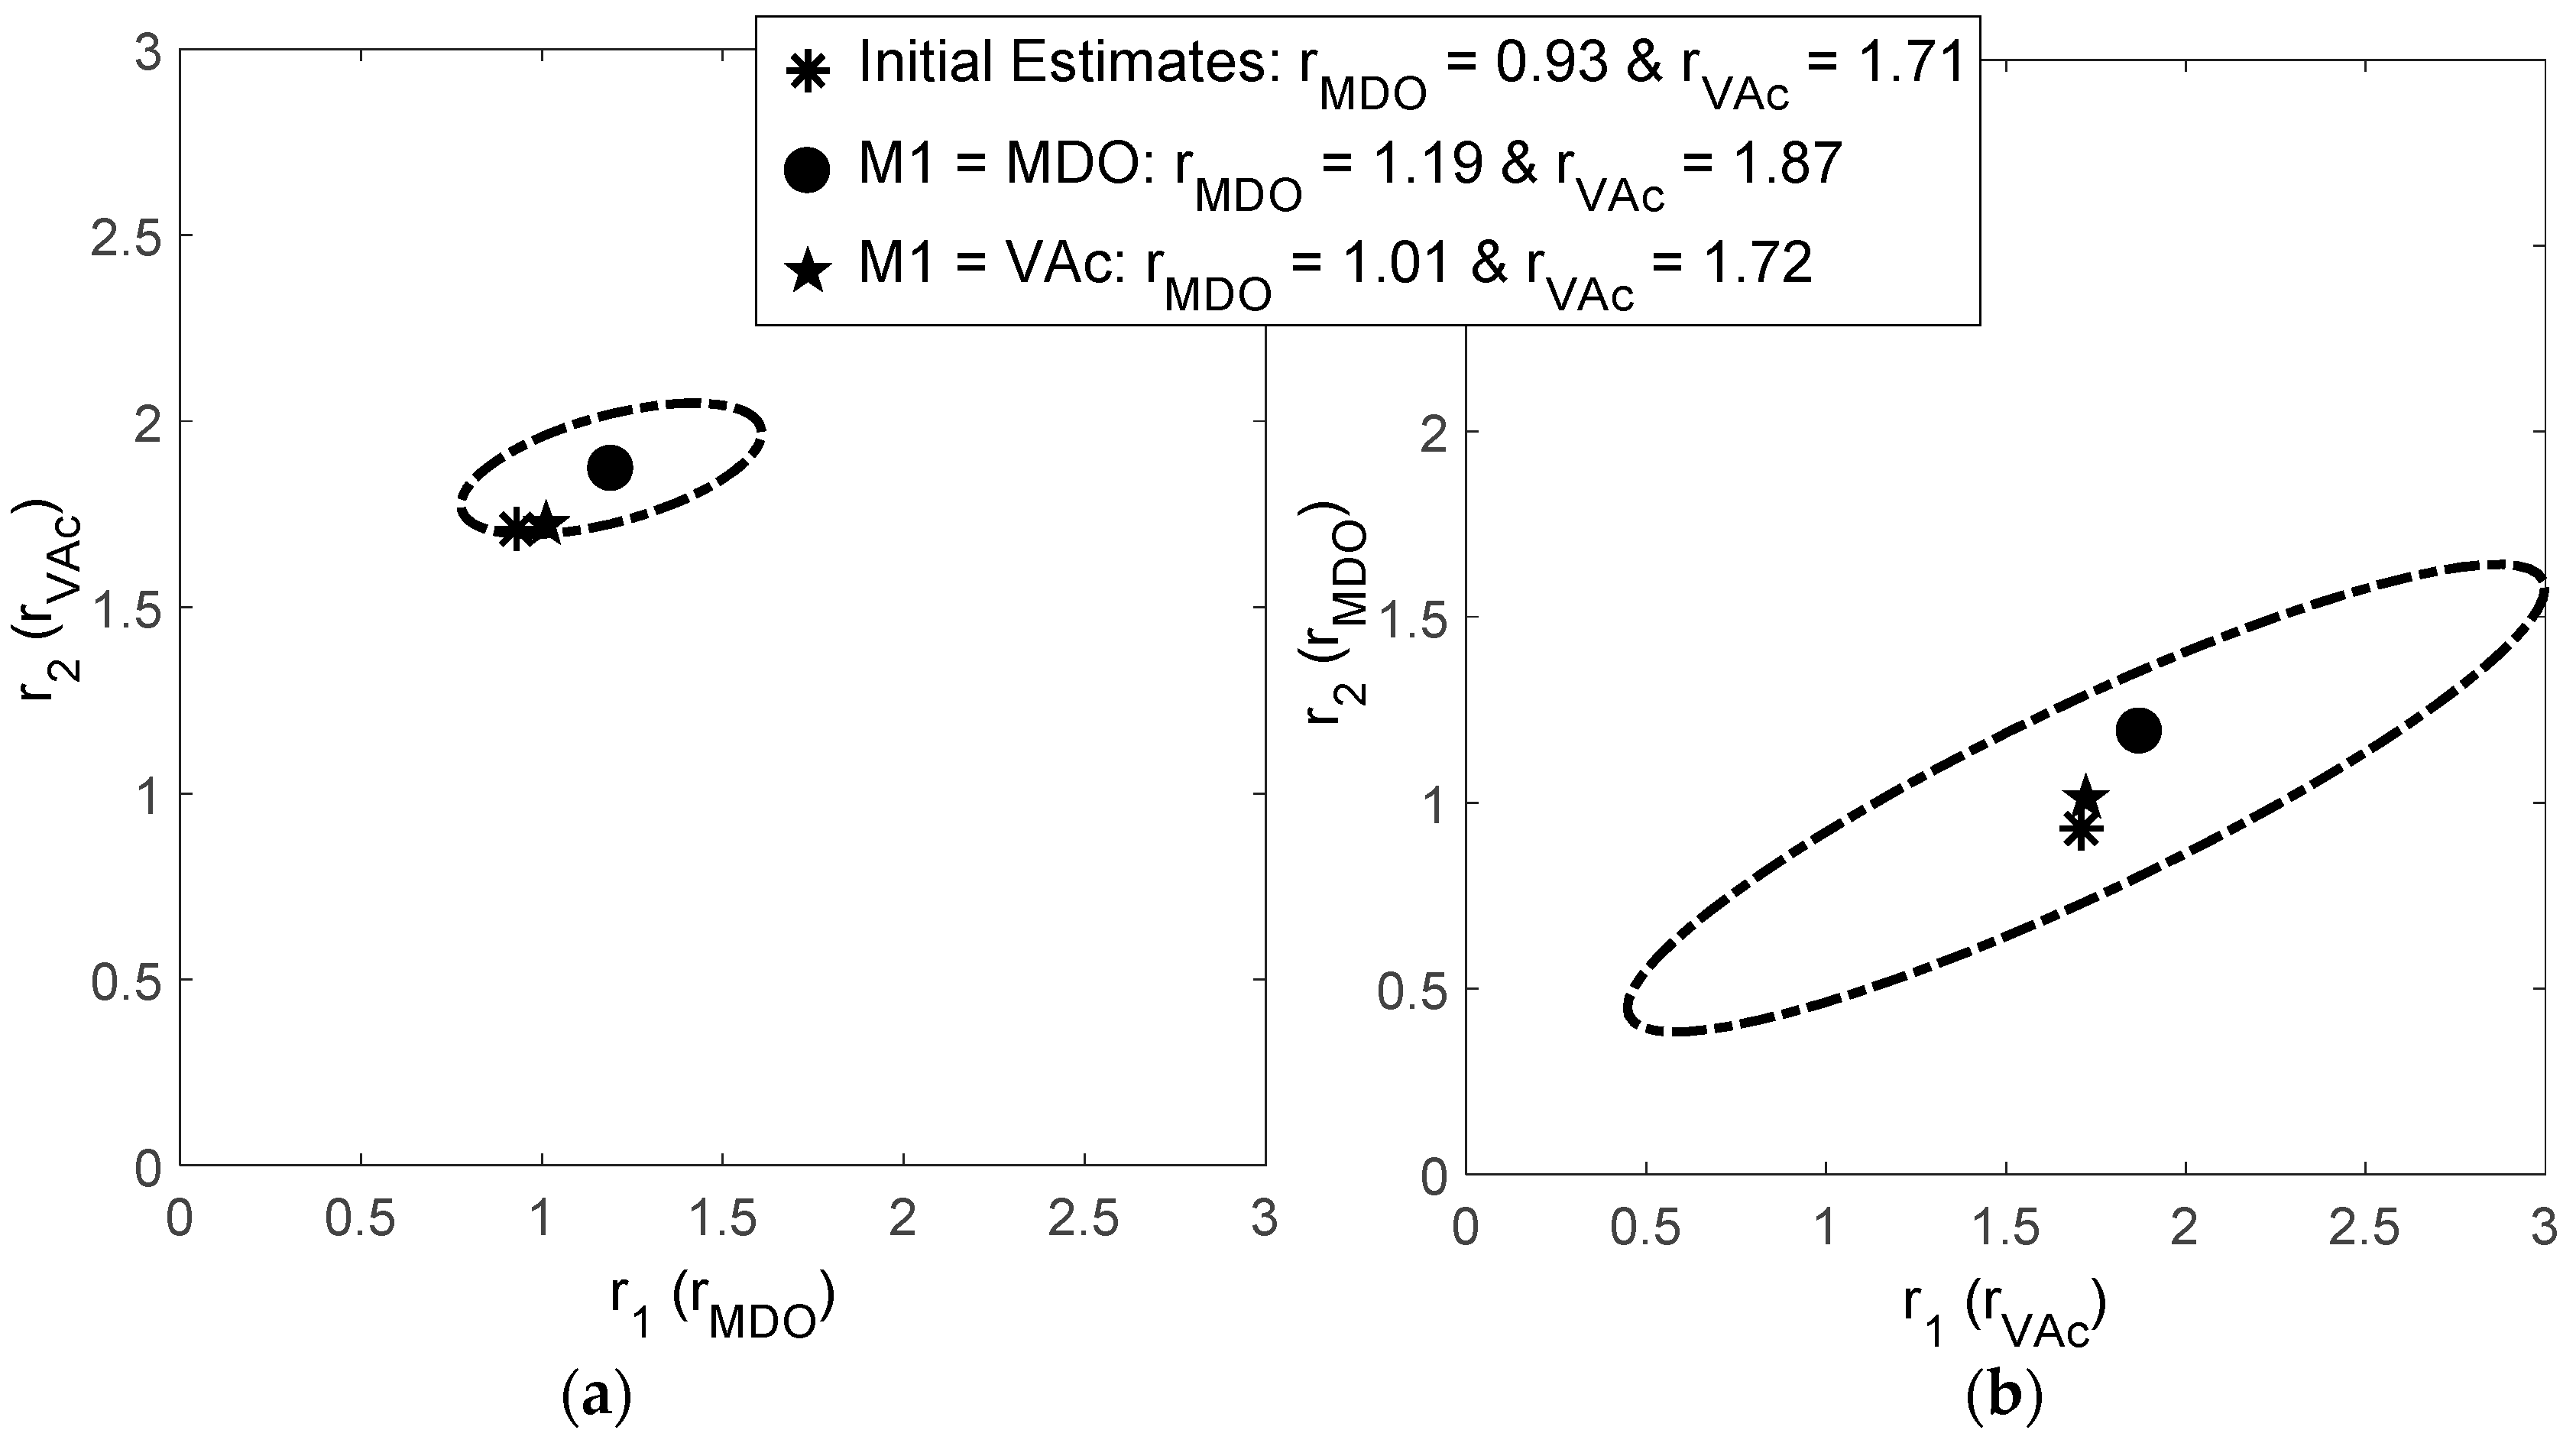
It is clear from
Figure 4 that the reactivity ratio estimates depend on which comonomer is selected as M
1; the fact that two reactivity ratio pairs can be obtained from a single estimation technique is problematic. It is also interesting to note that both analyses give
r1 > 1 and
r2 > 1. While this is physically impossible, it is a side-effect of experimental (and estimation) error. In reality, these results suggest that both reactivity ratios should be close to unity (which agrees with the findings of Undin et al. [
11] and Hedir et al. [
12]) but that at least one reactivity ratio is <1.
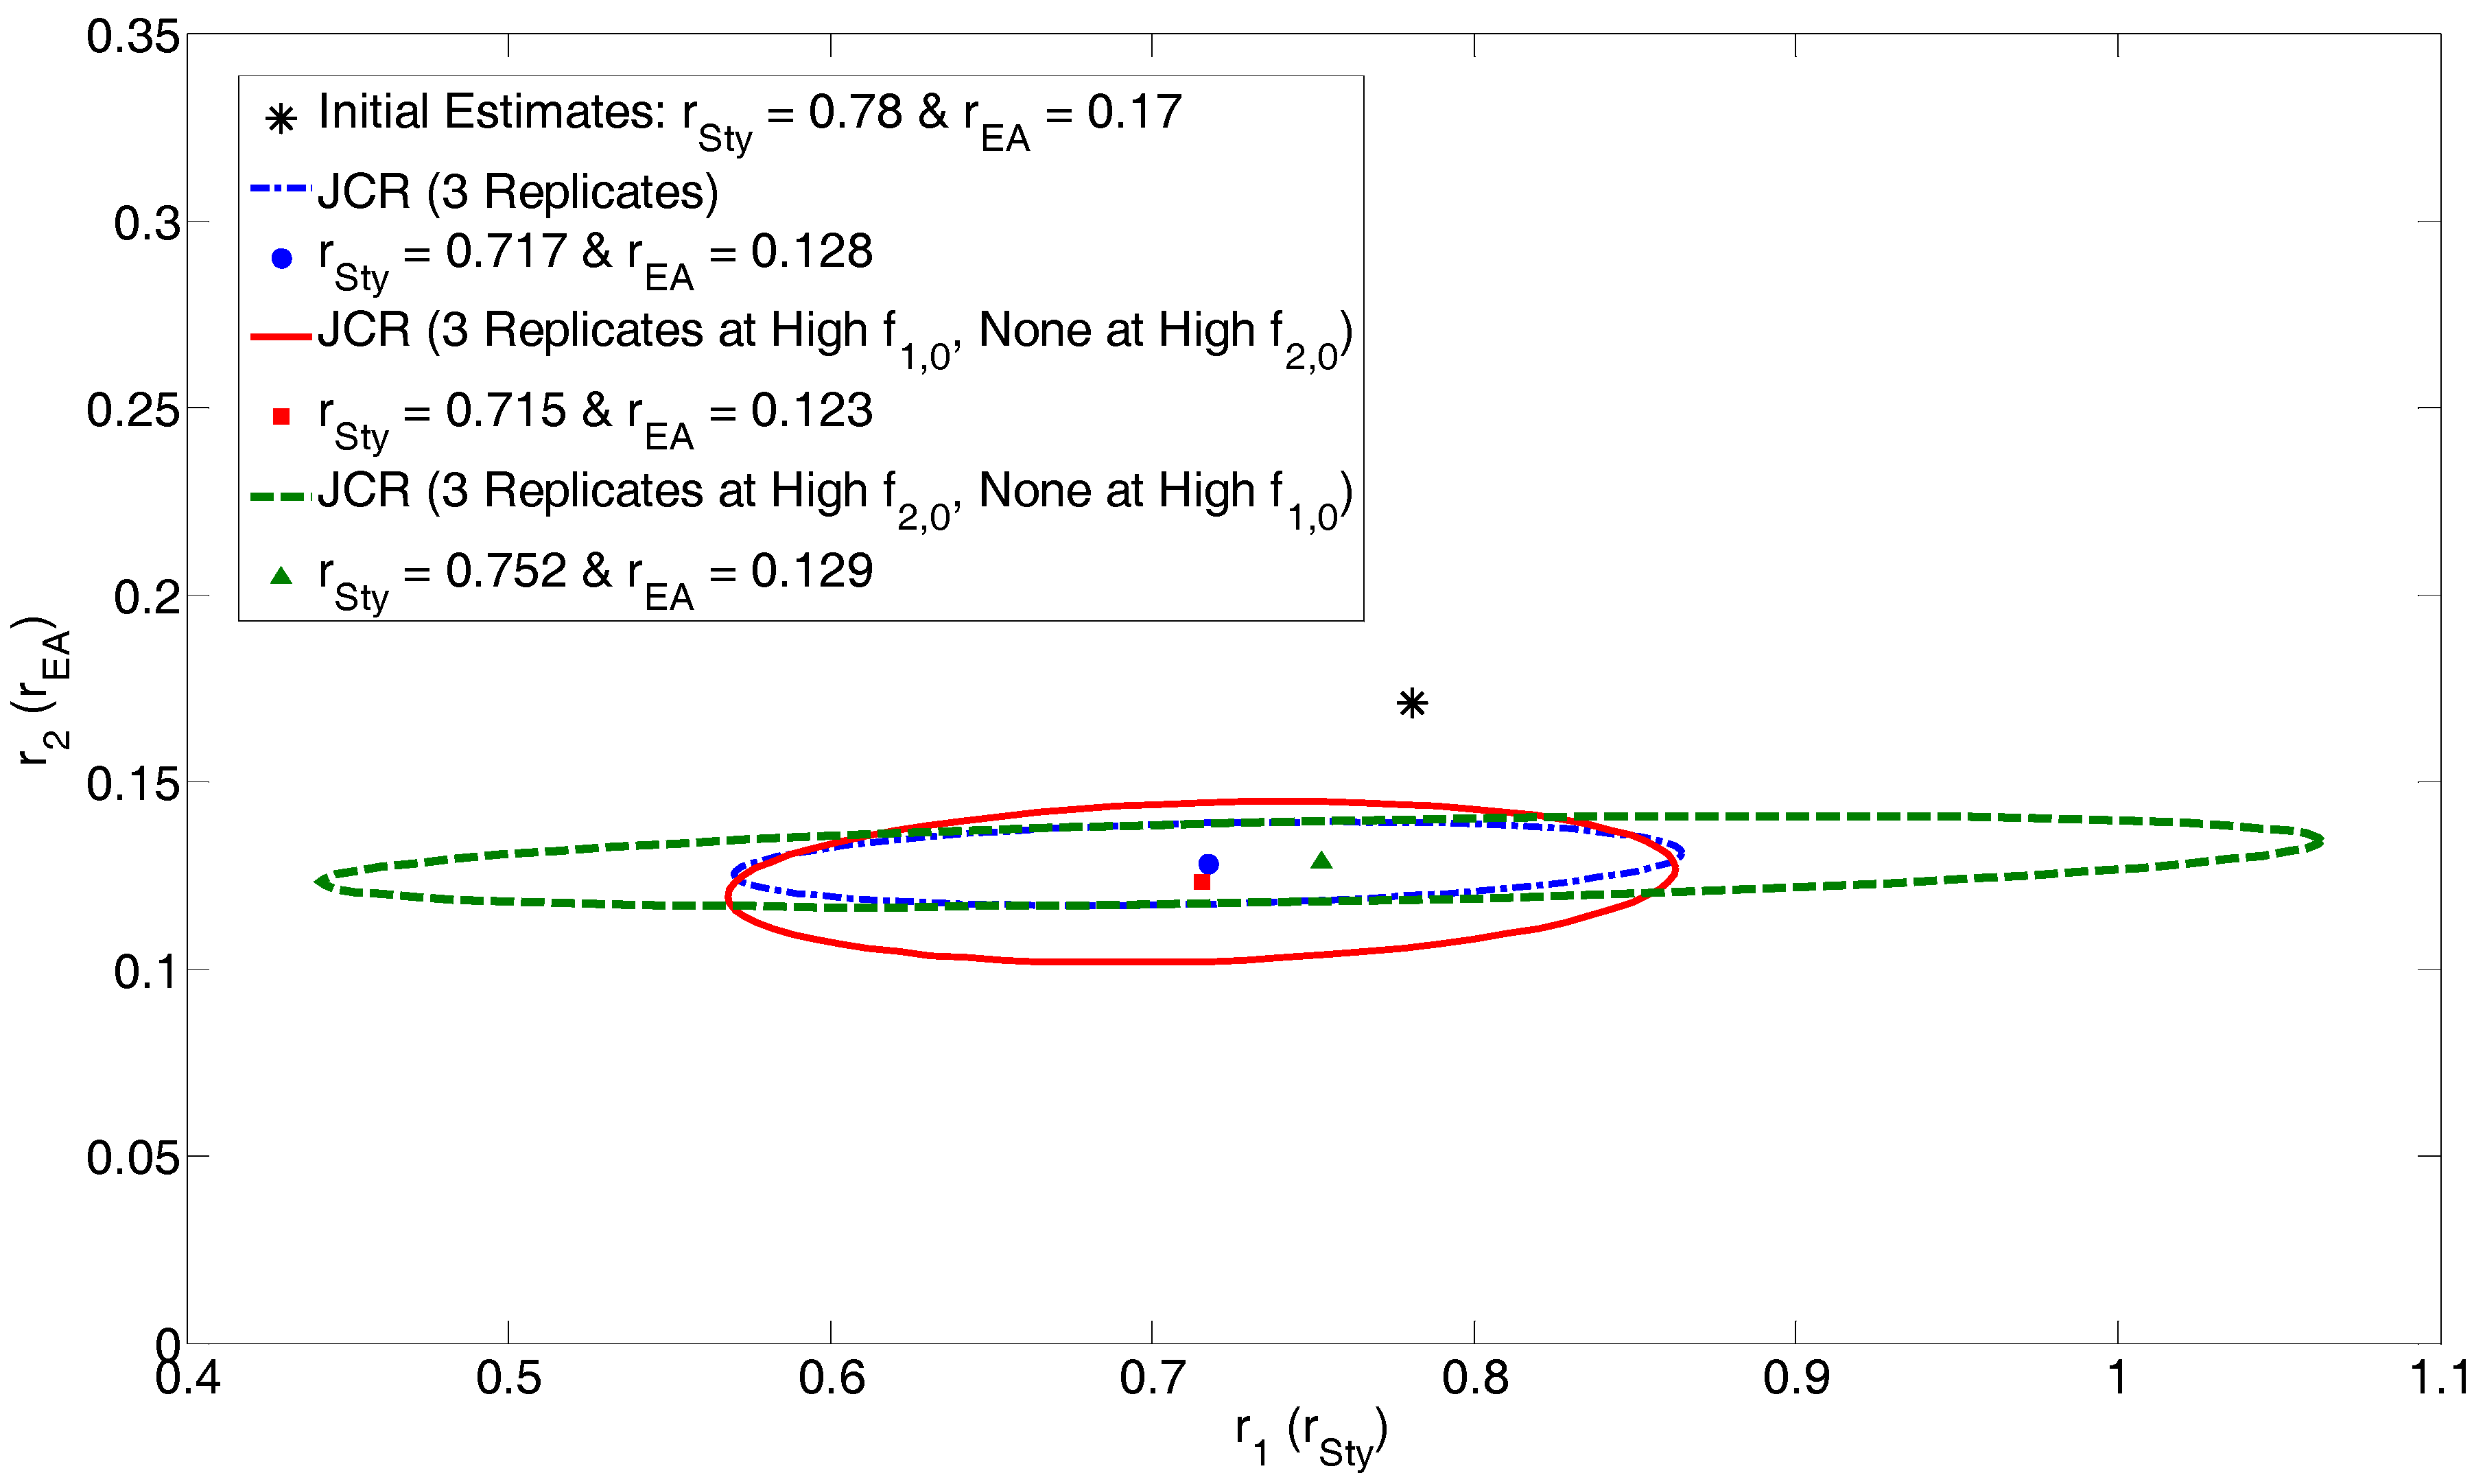
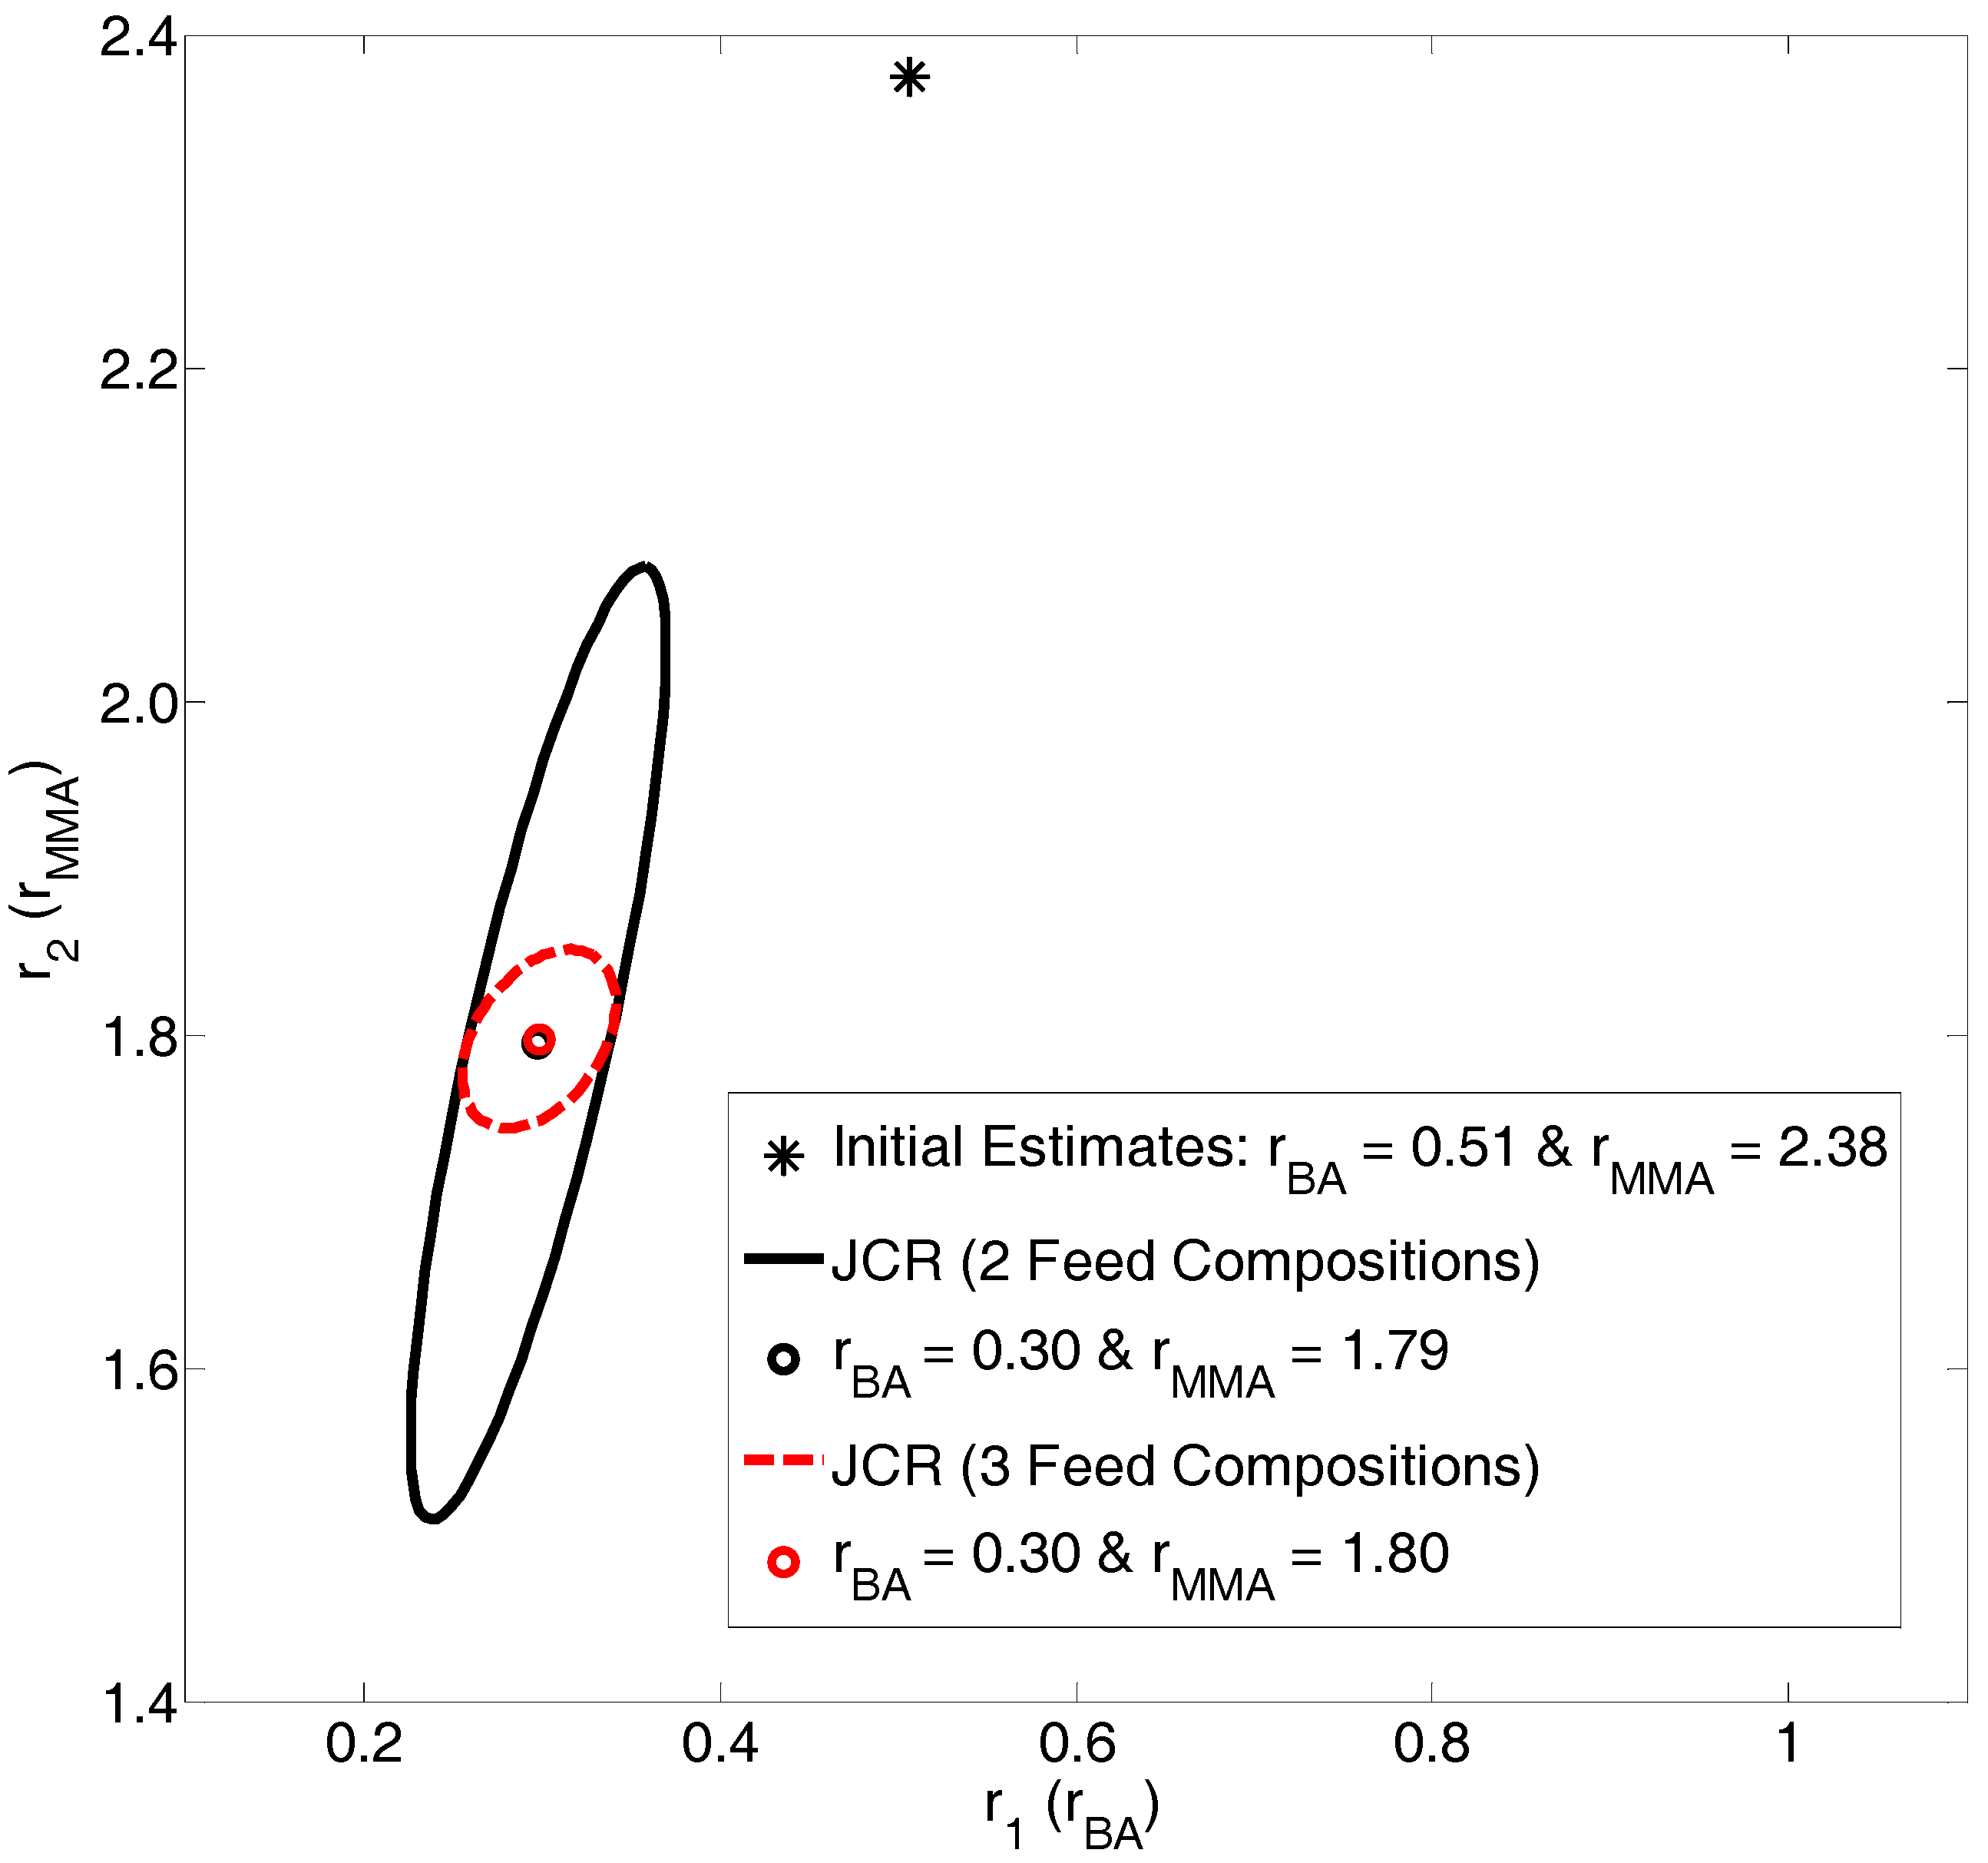
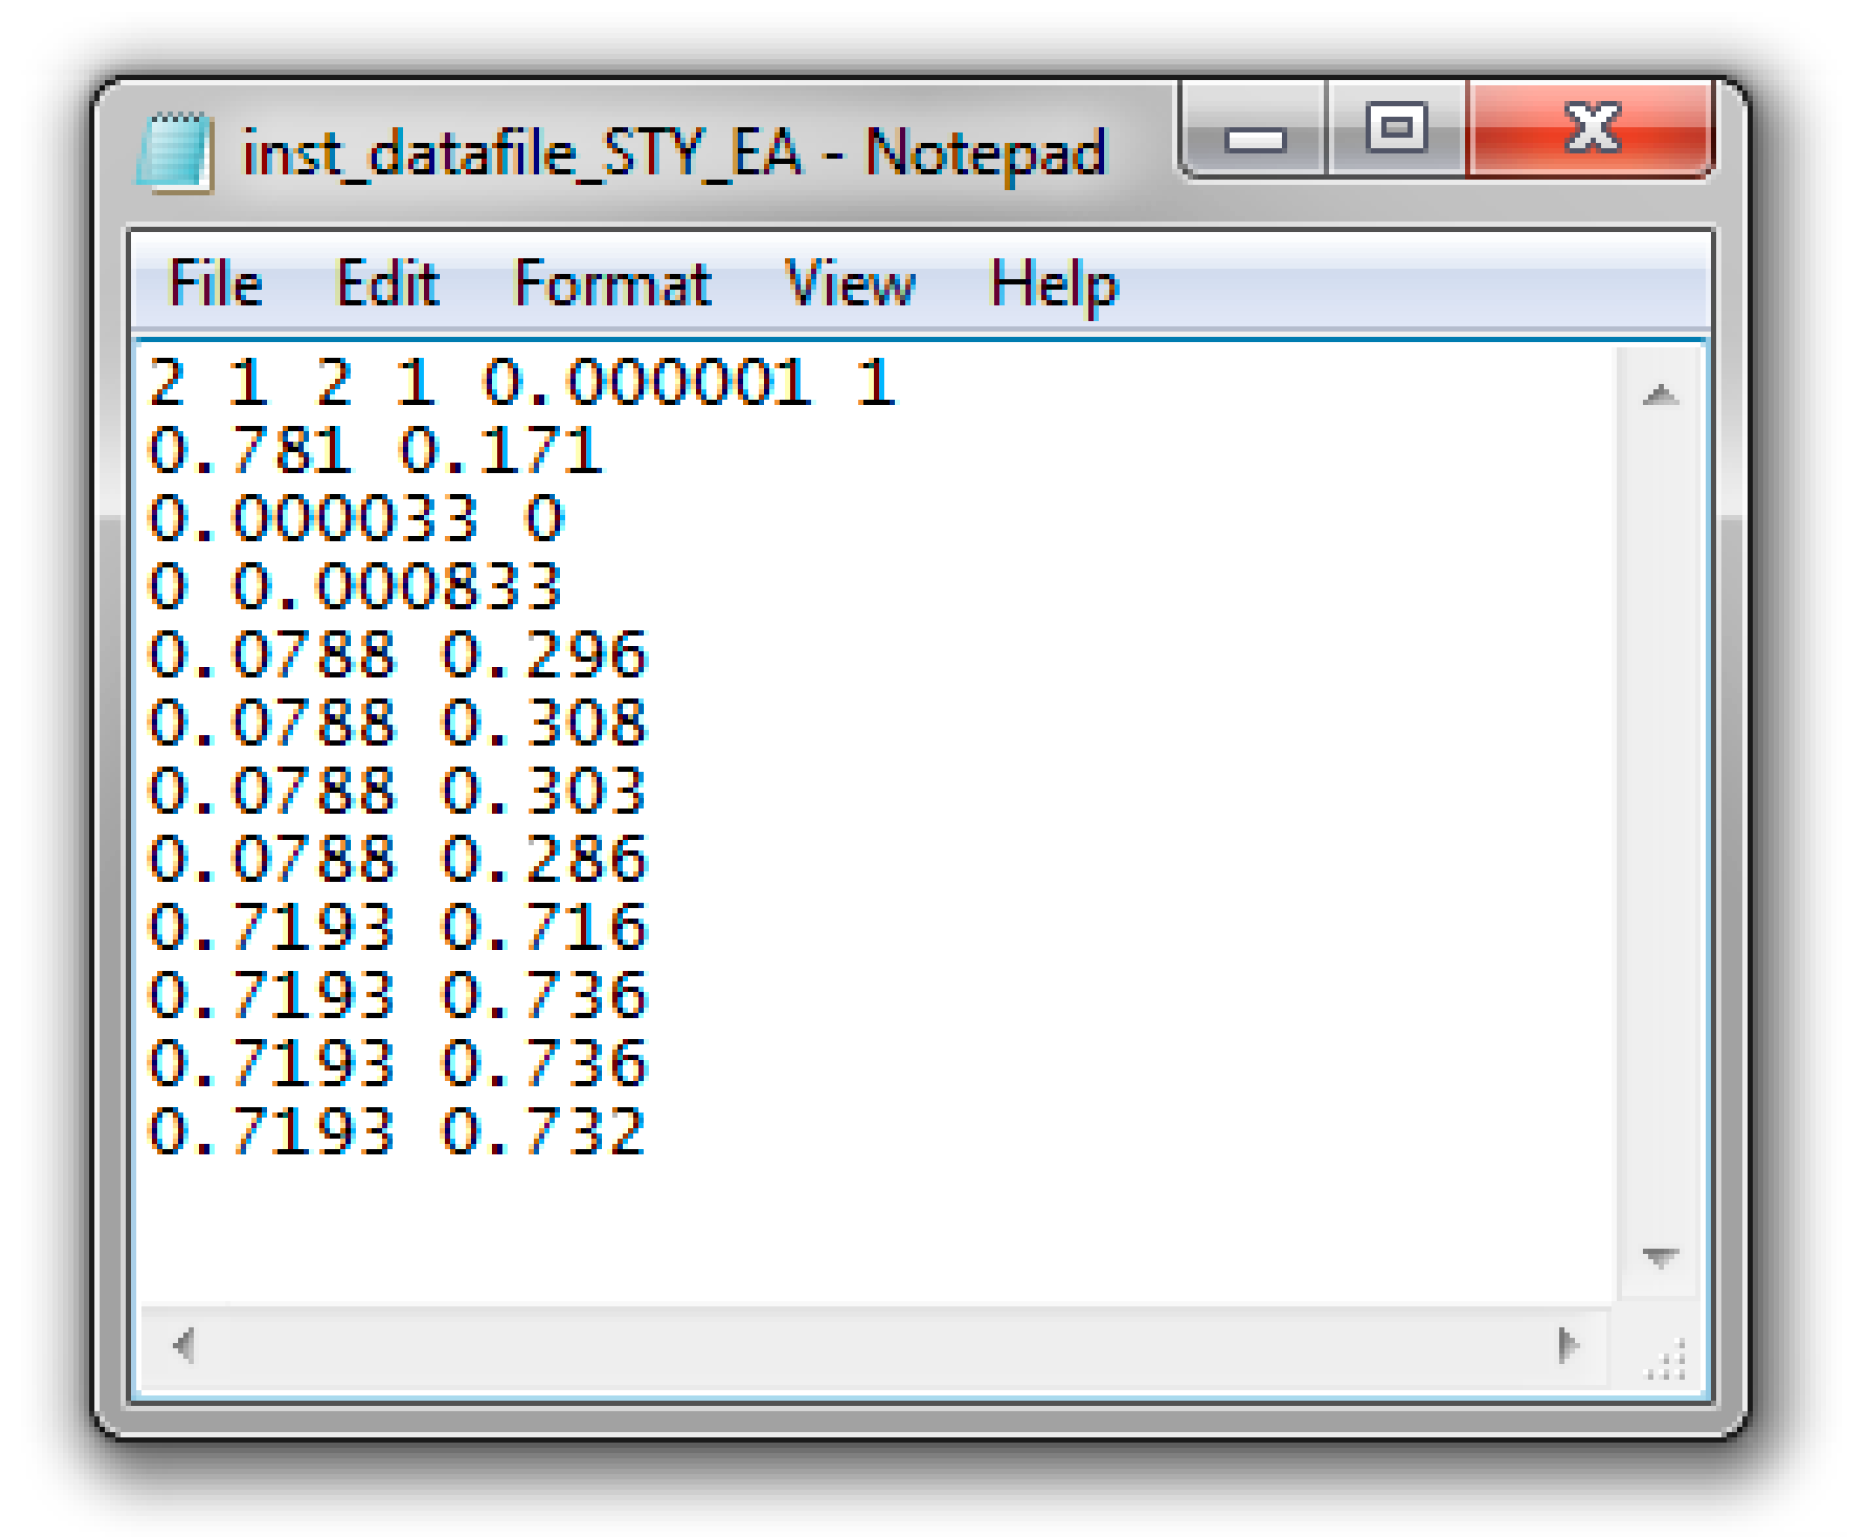
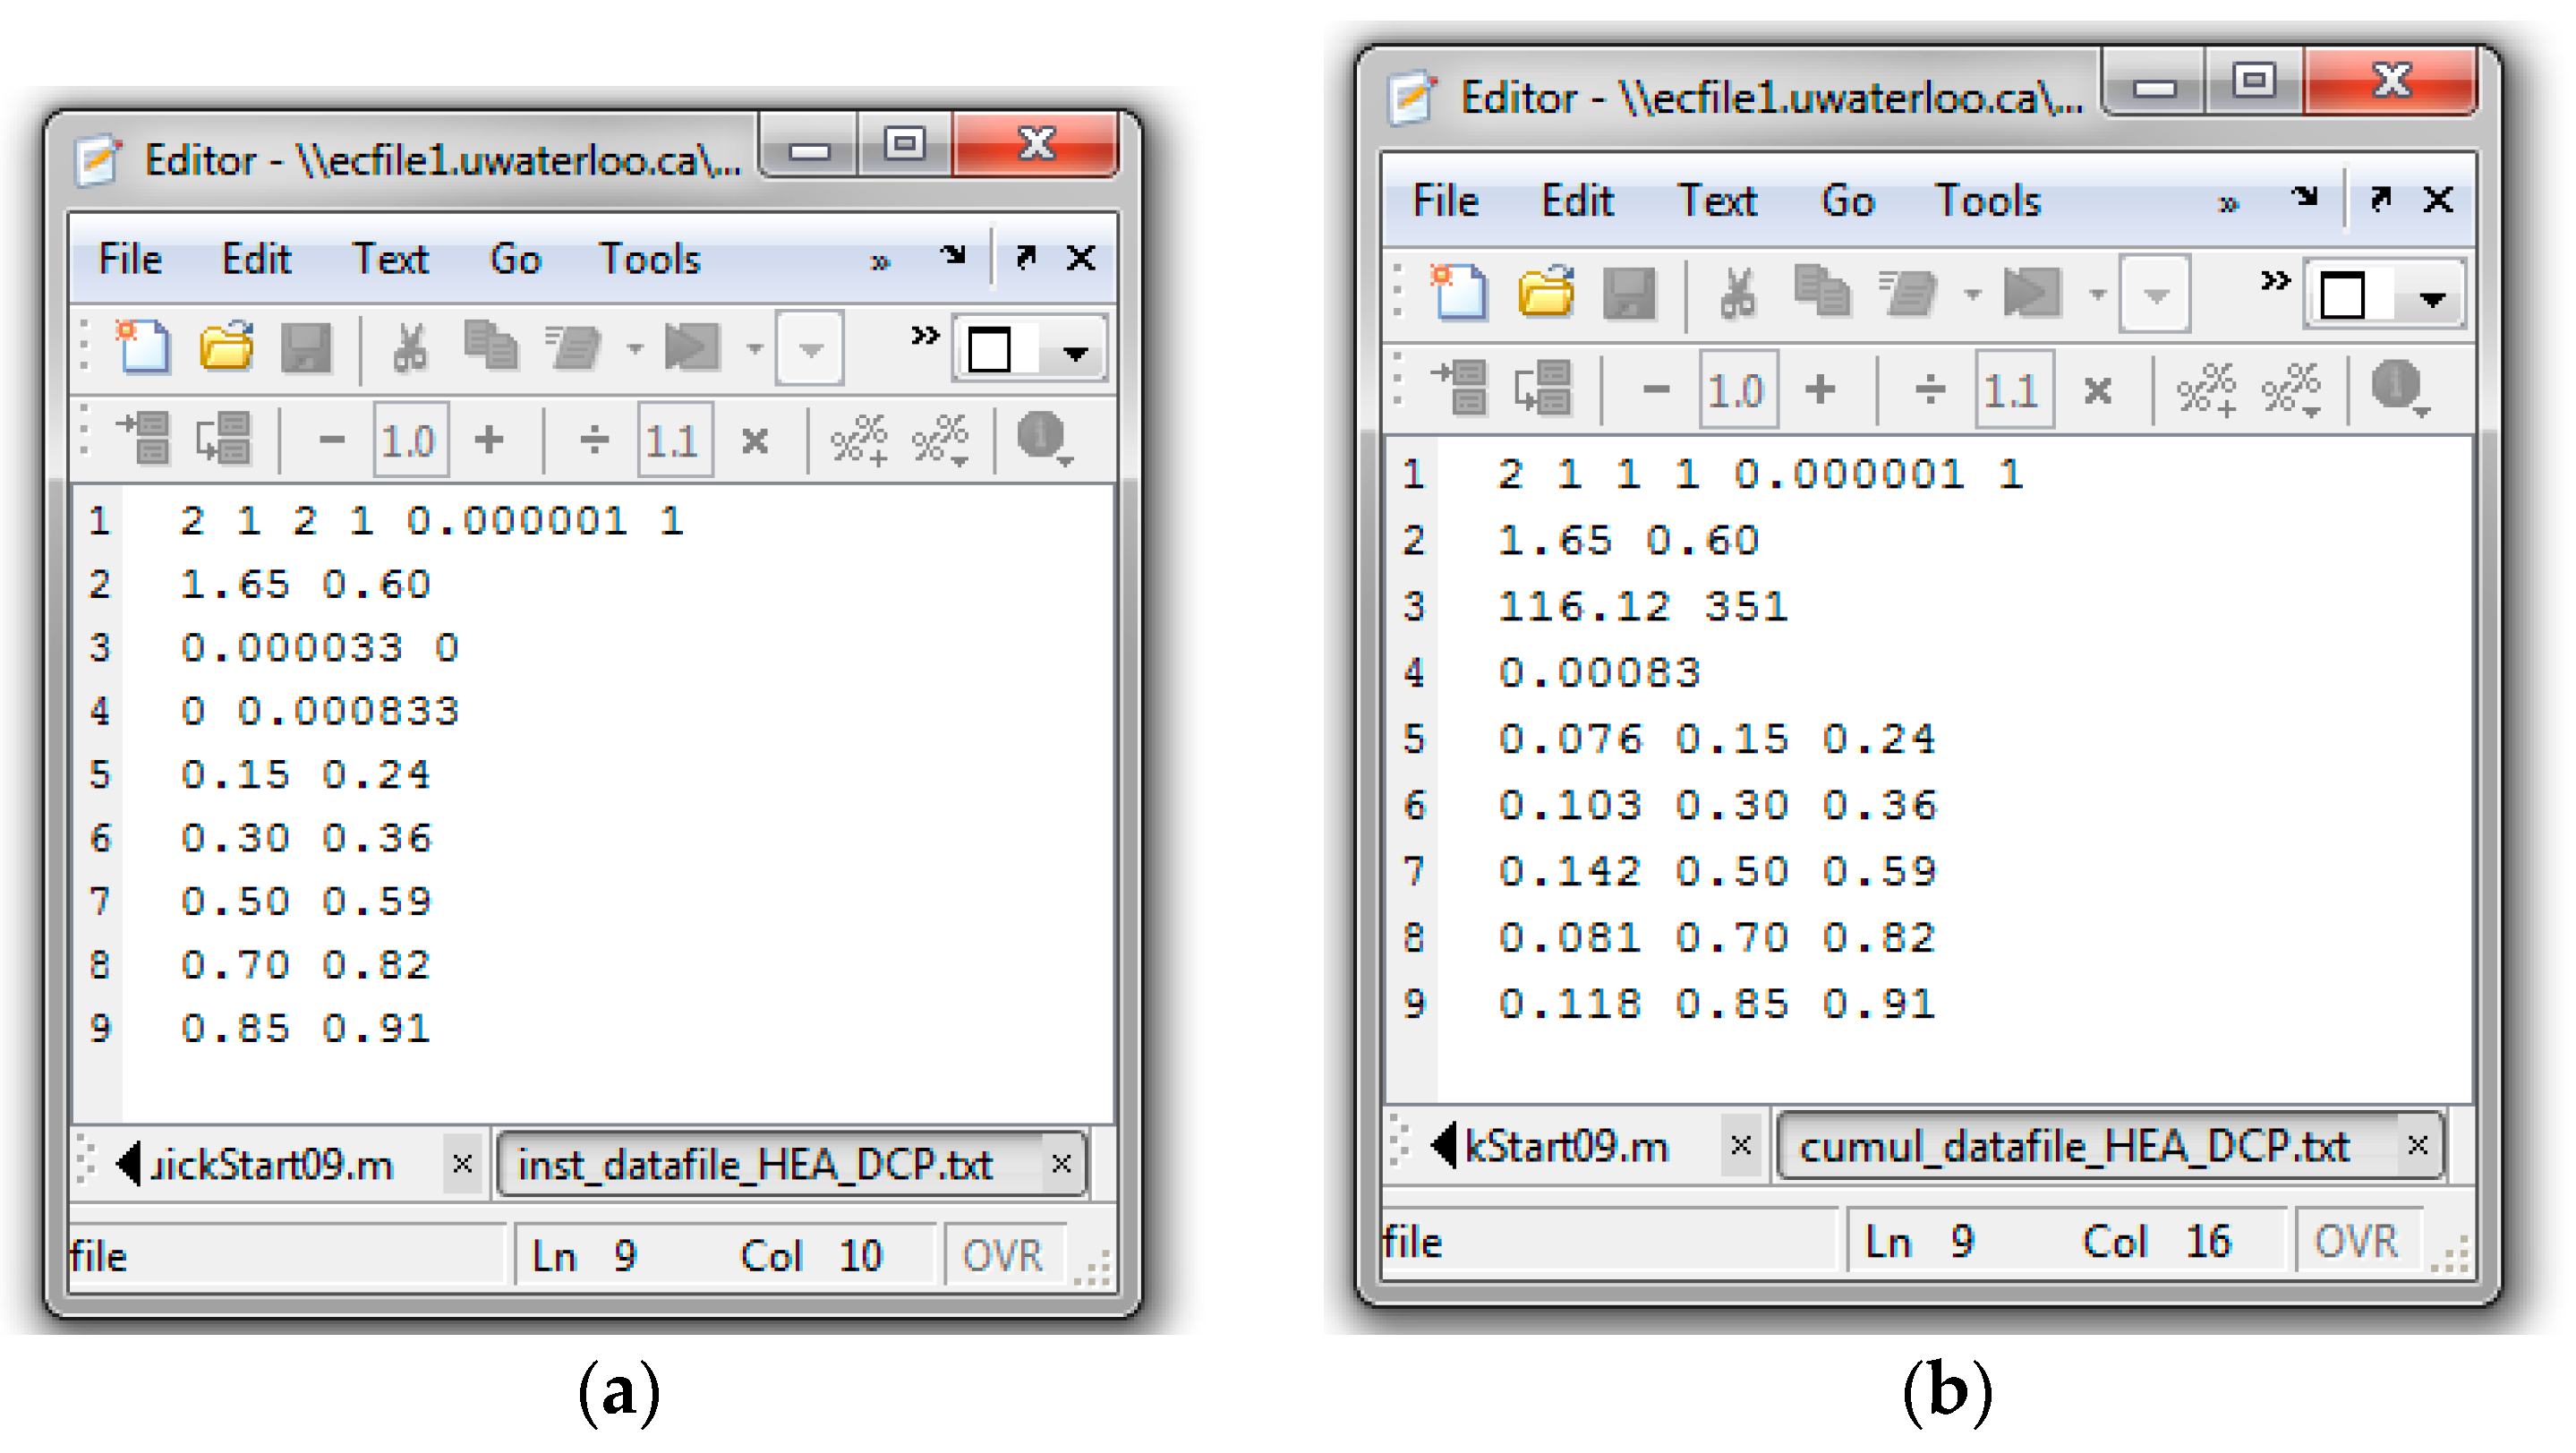
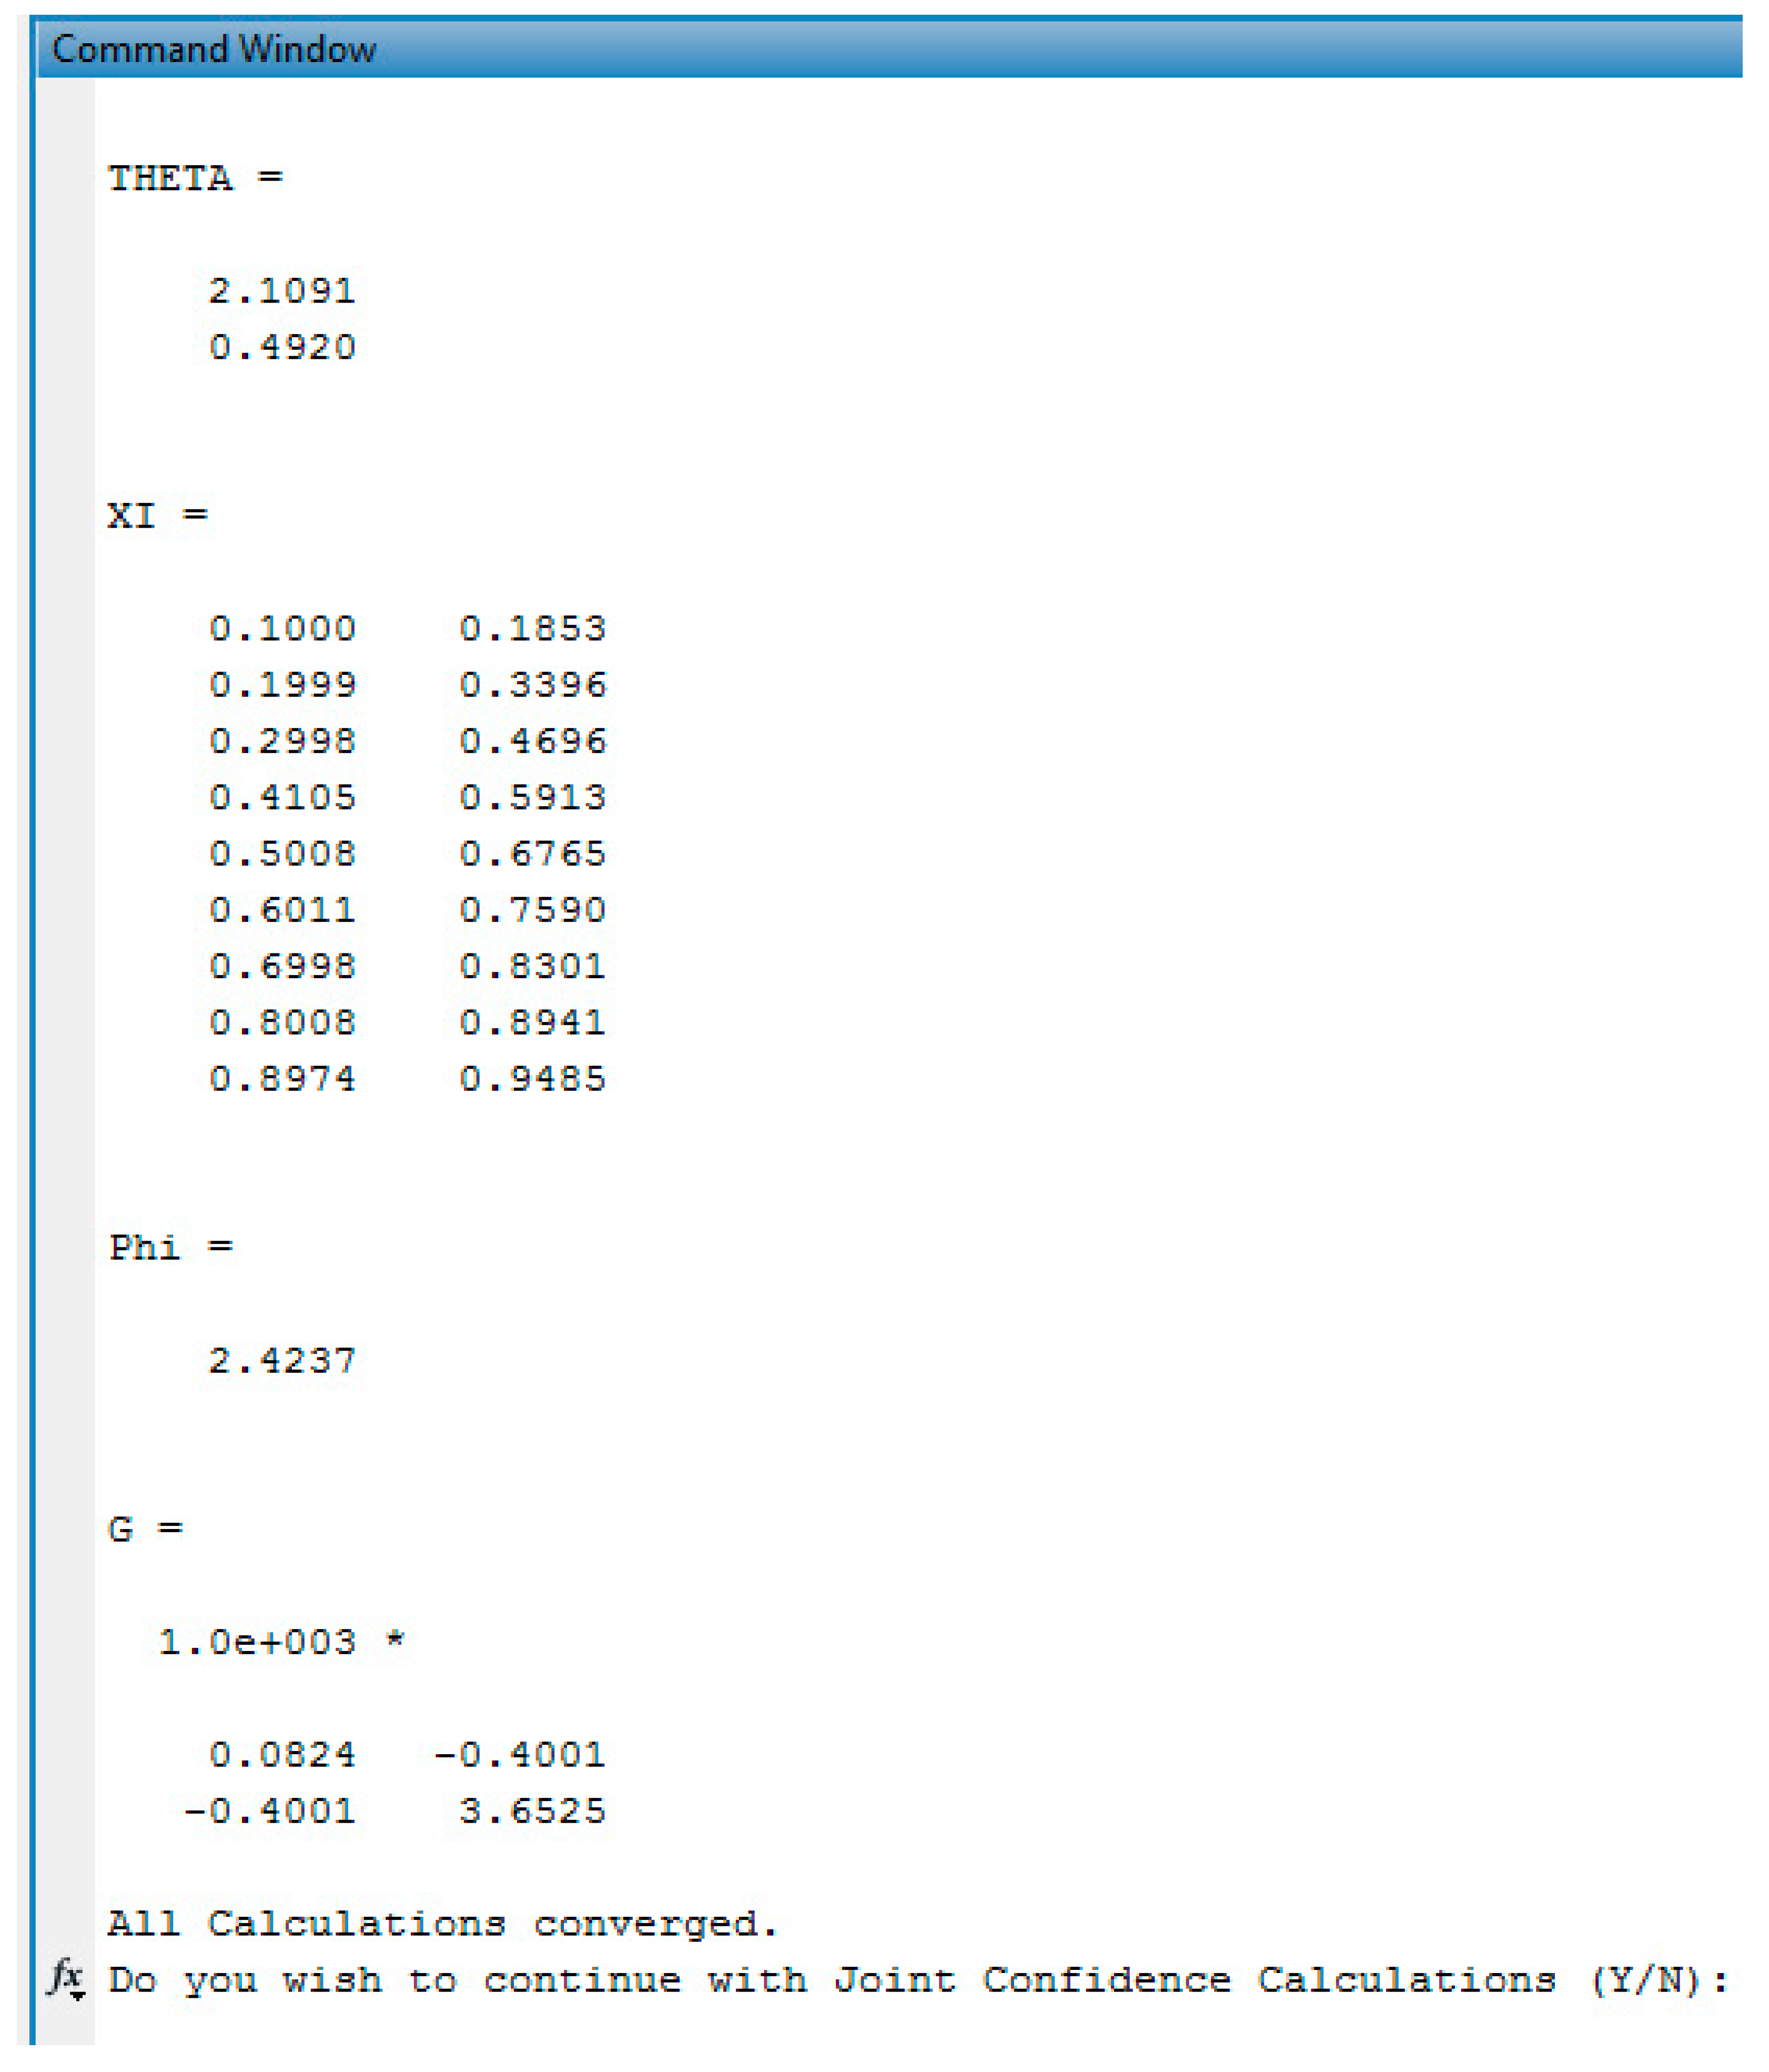
The issue of symmetry (combined with the statistical inaccuracy of using linear parameter estimation to evaluate non-linear models) highlights the need for a non-linear parameter estimation technique like EVM. When using EVM for reactivity ratio estimation, the influence of which comonomer is defined as M
1 has no impact on the parameter estimates. (If RR estimates are slightly different based on the choice of M
1, this is due to experimental error in the data). As shown in
Figure 5, reactivity ratio estimates are within the JCR, regardless of which monomer is identified as M
1. That is, slight discrepancies between EVM-obtained reactivity ratio estimates are well within the expected error (1% error in
fi,0 and 10% error in
; more on typical error levels in
Appendix A). As expected, using measured/reported values as program inputs (in this case,
fMDO,0 and
) provides us with a greater degree of confidence in our results; note that the JCR in
Figure 5a is smaller than that in
Figure 5b. There is also significantly more parameter correlation visible in
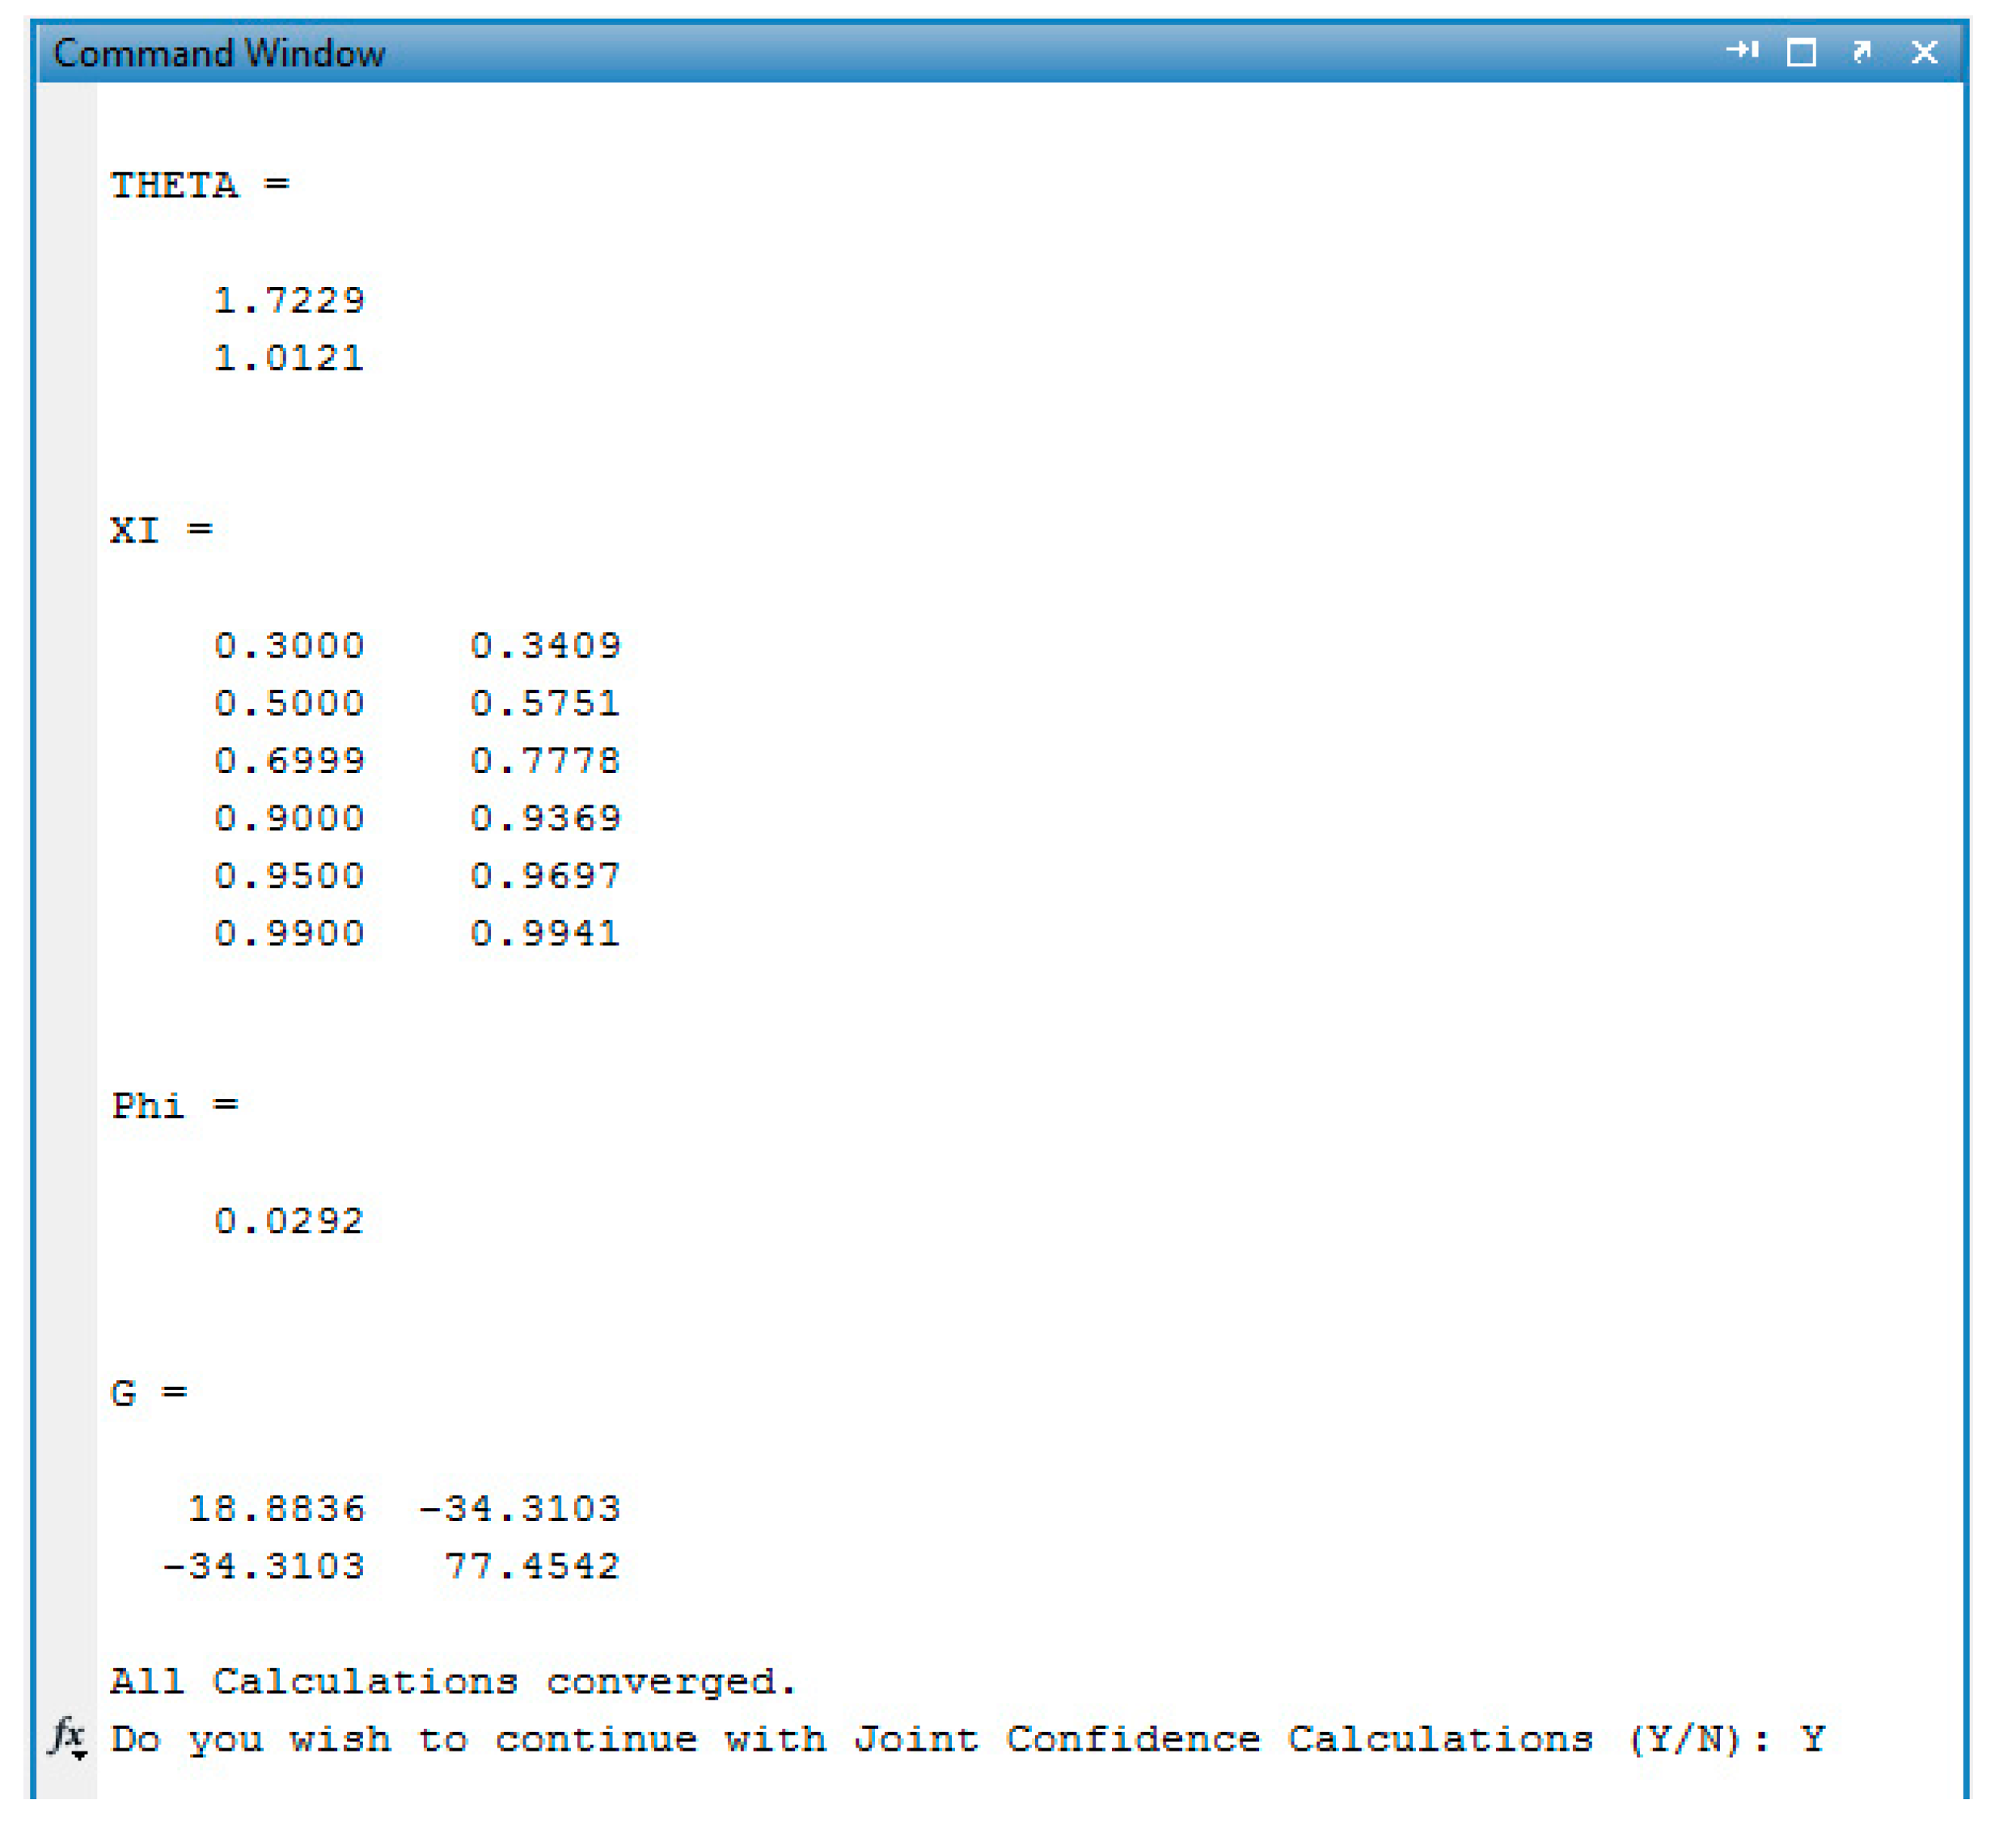
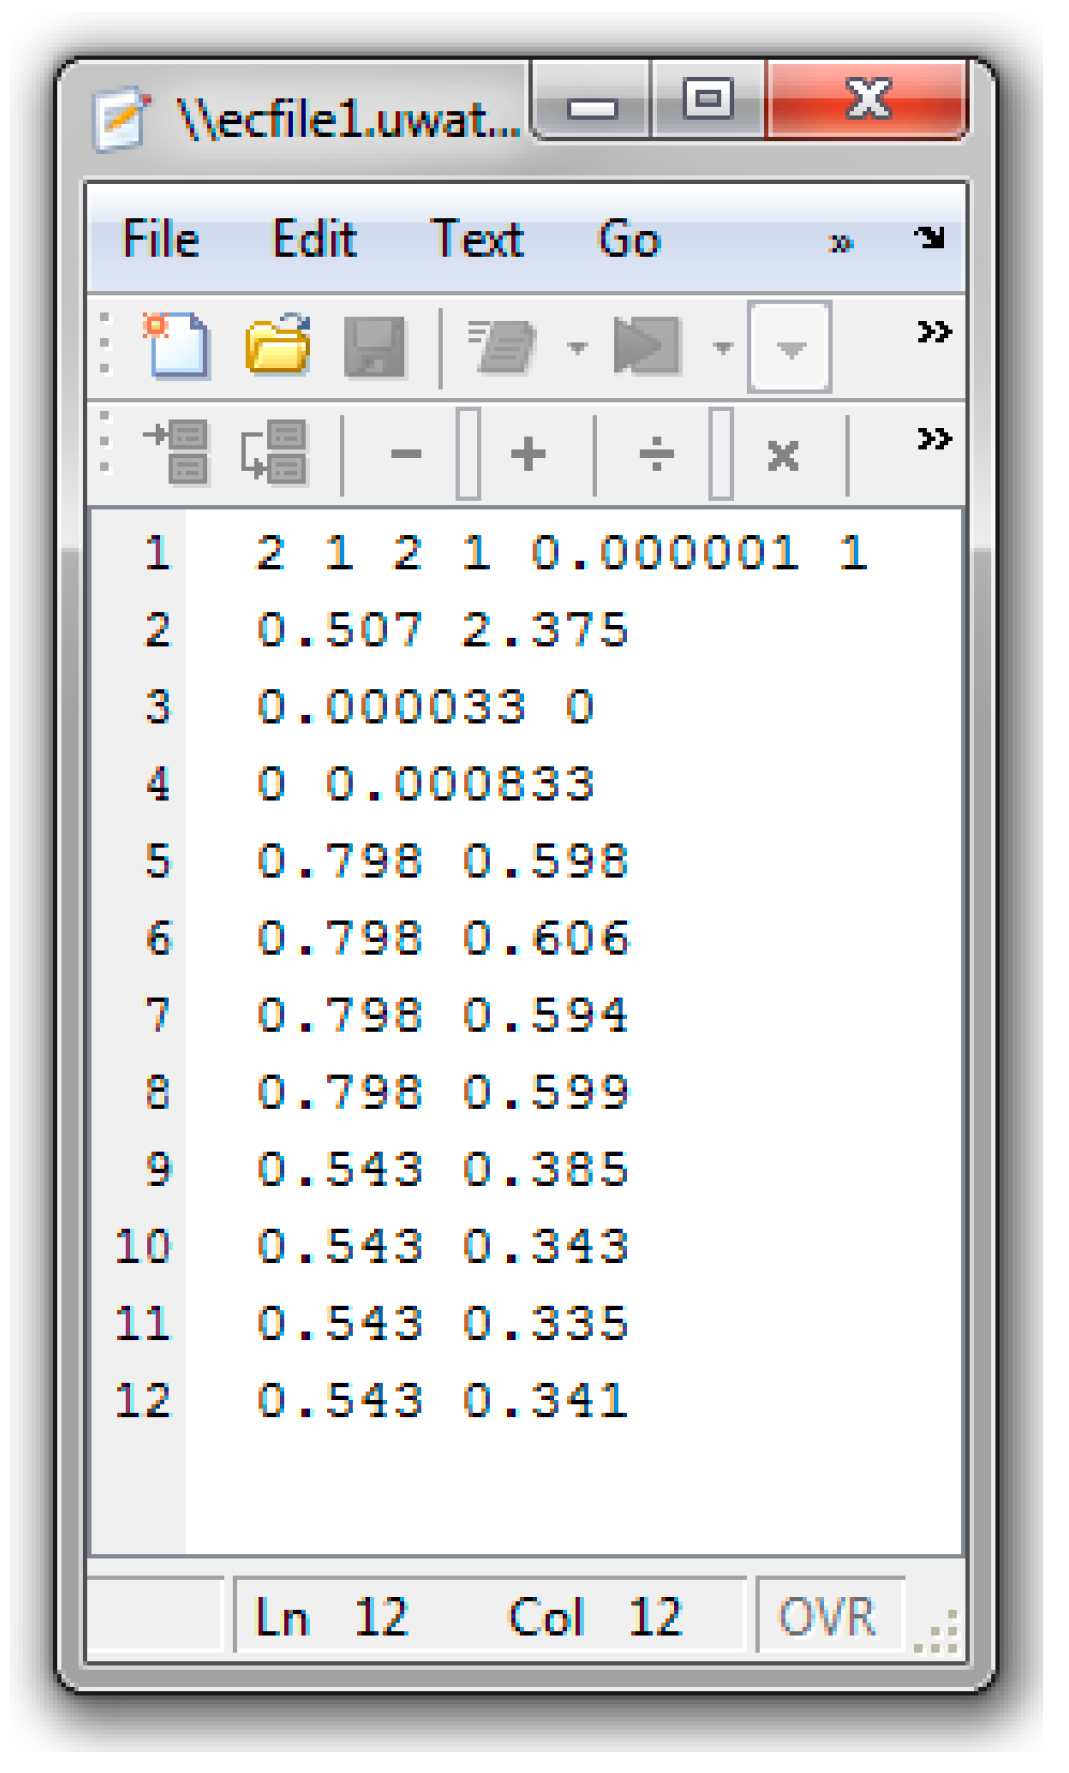
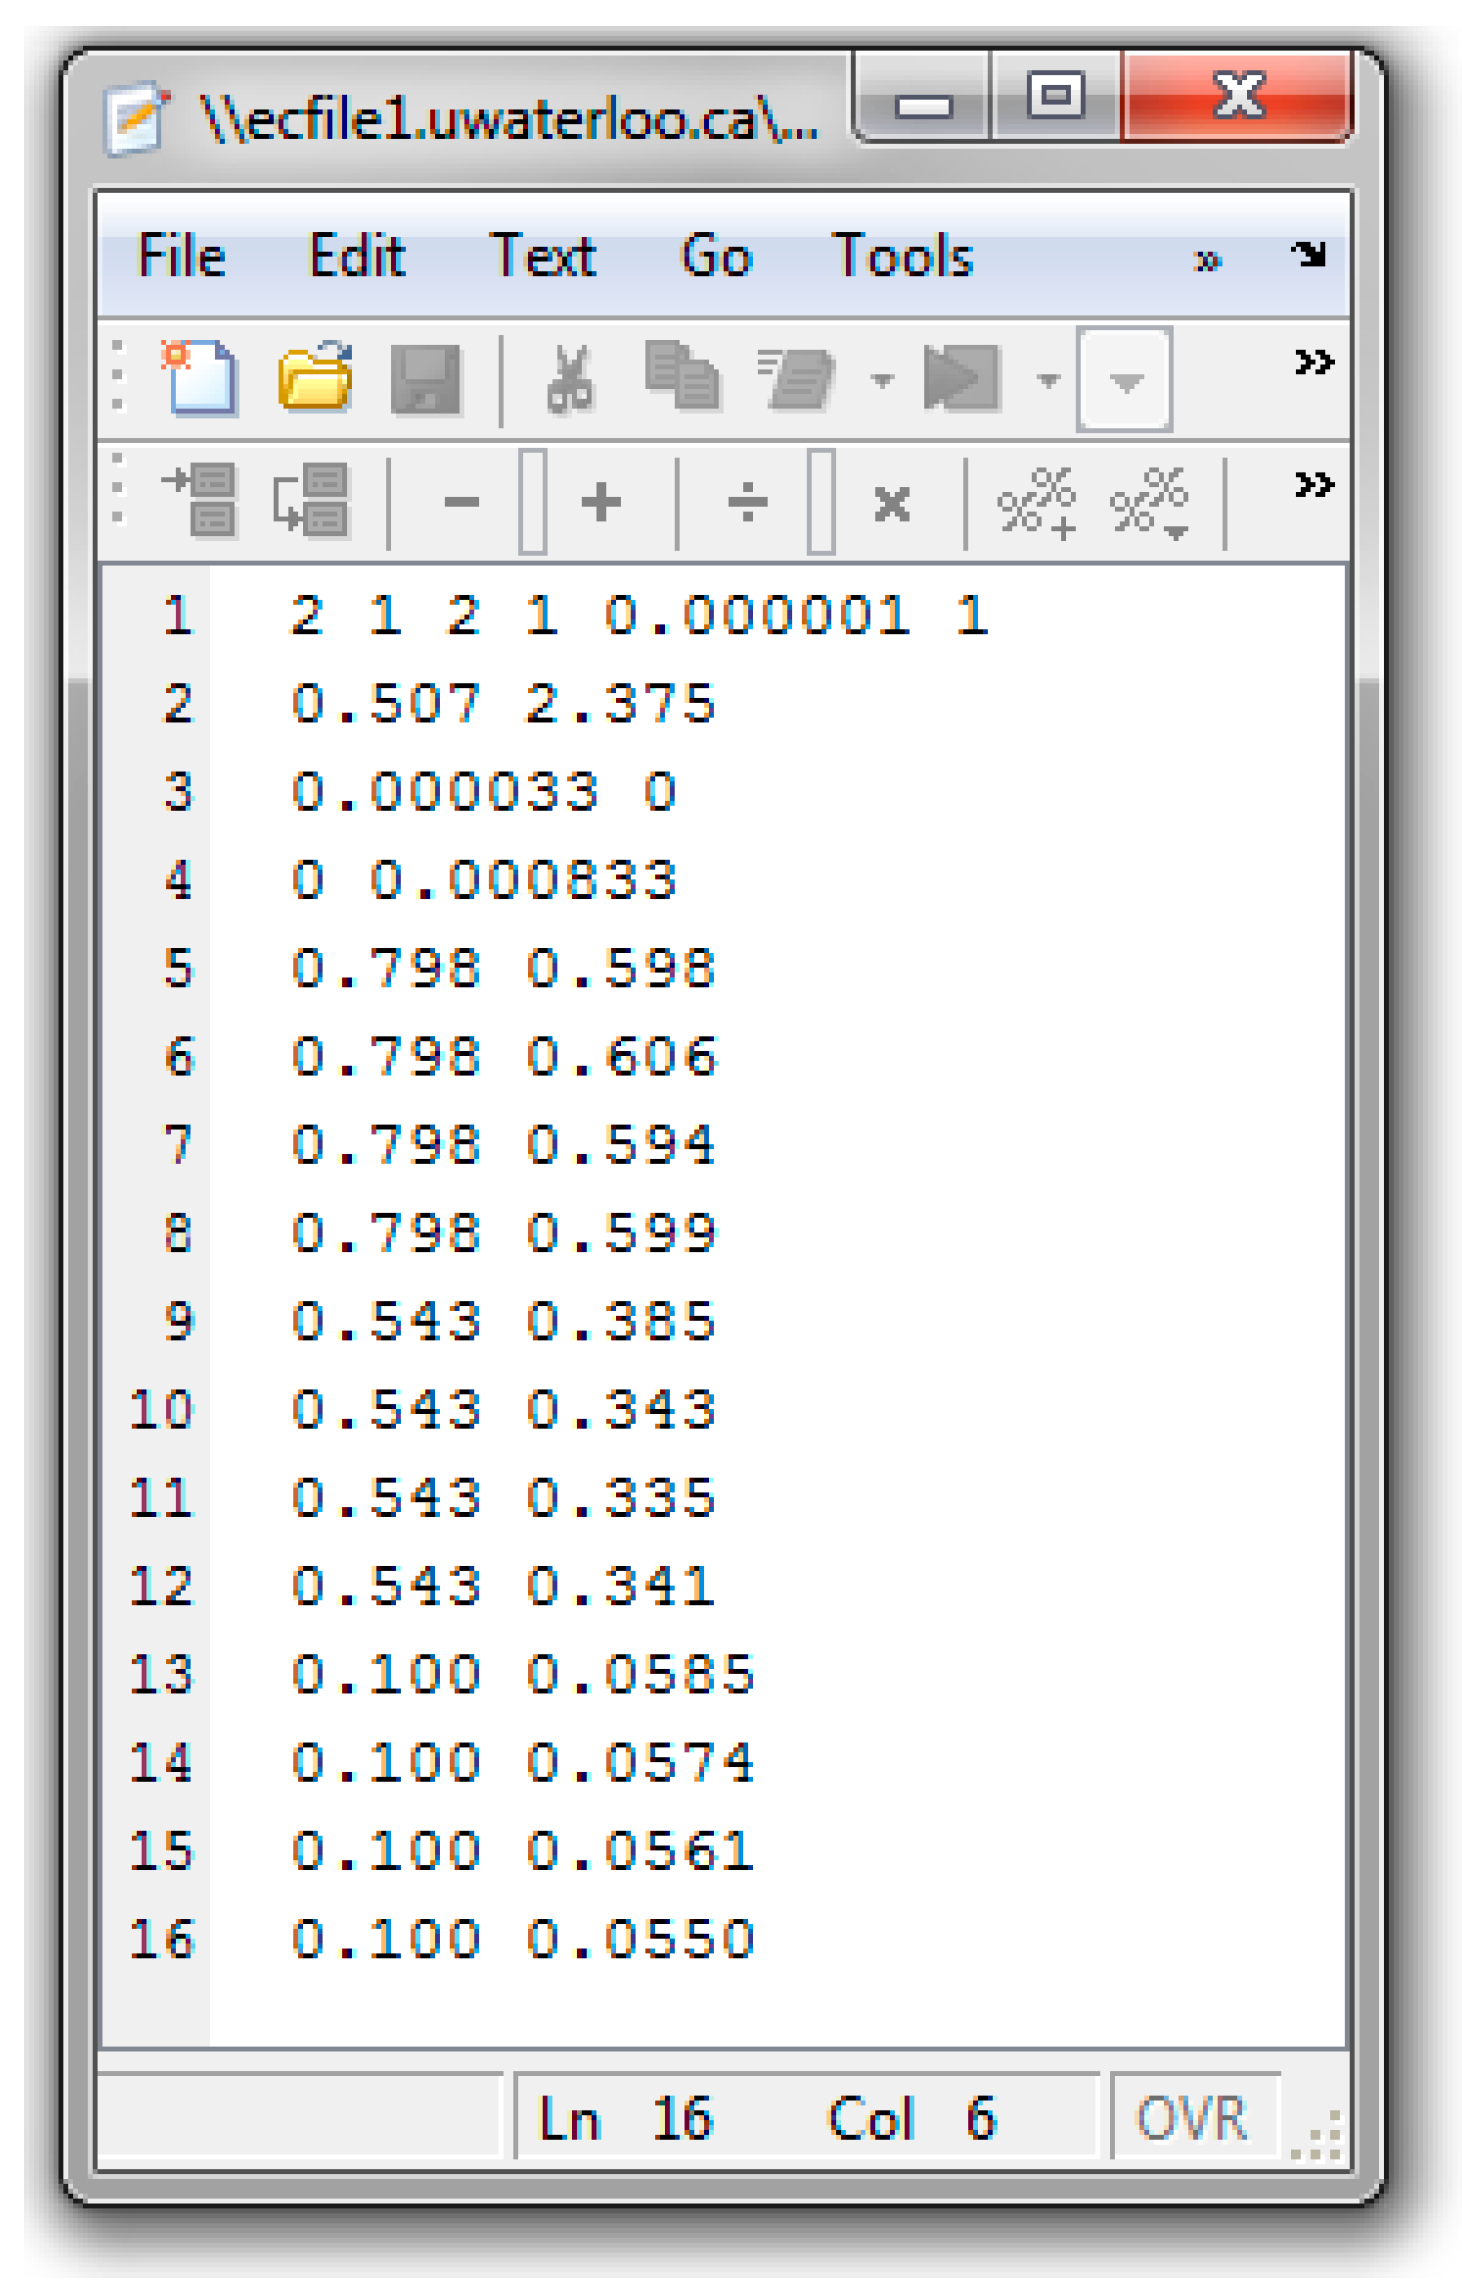
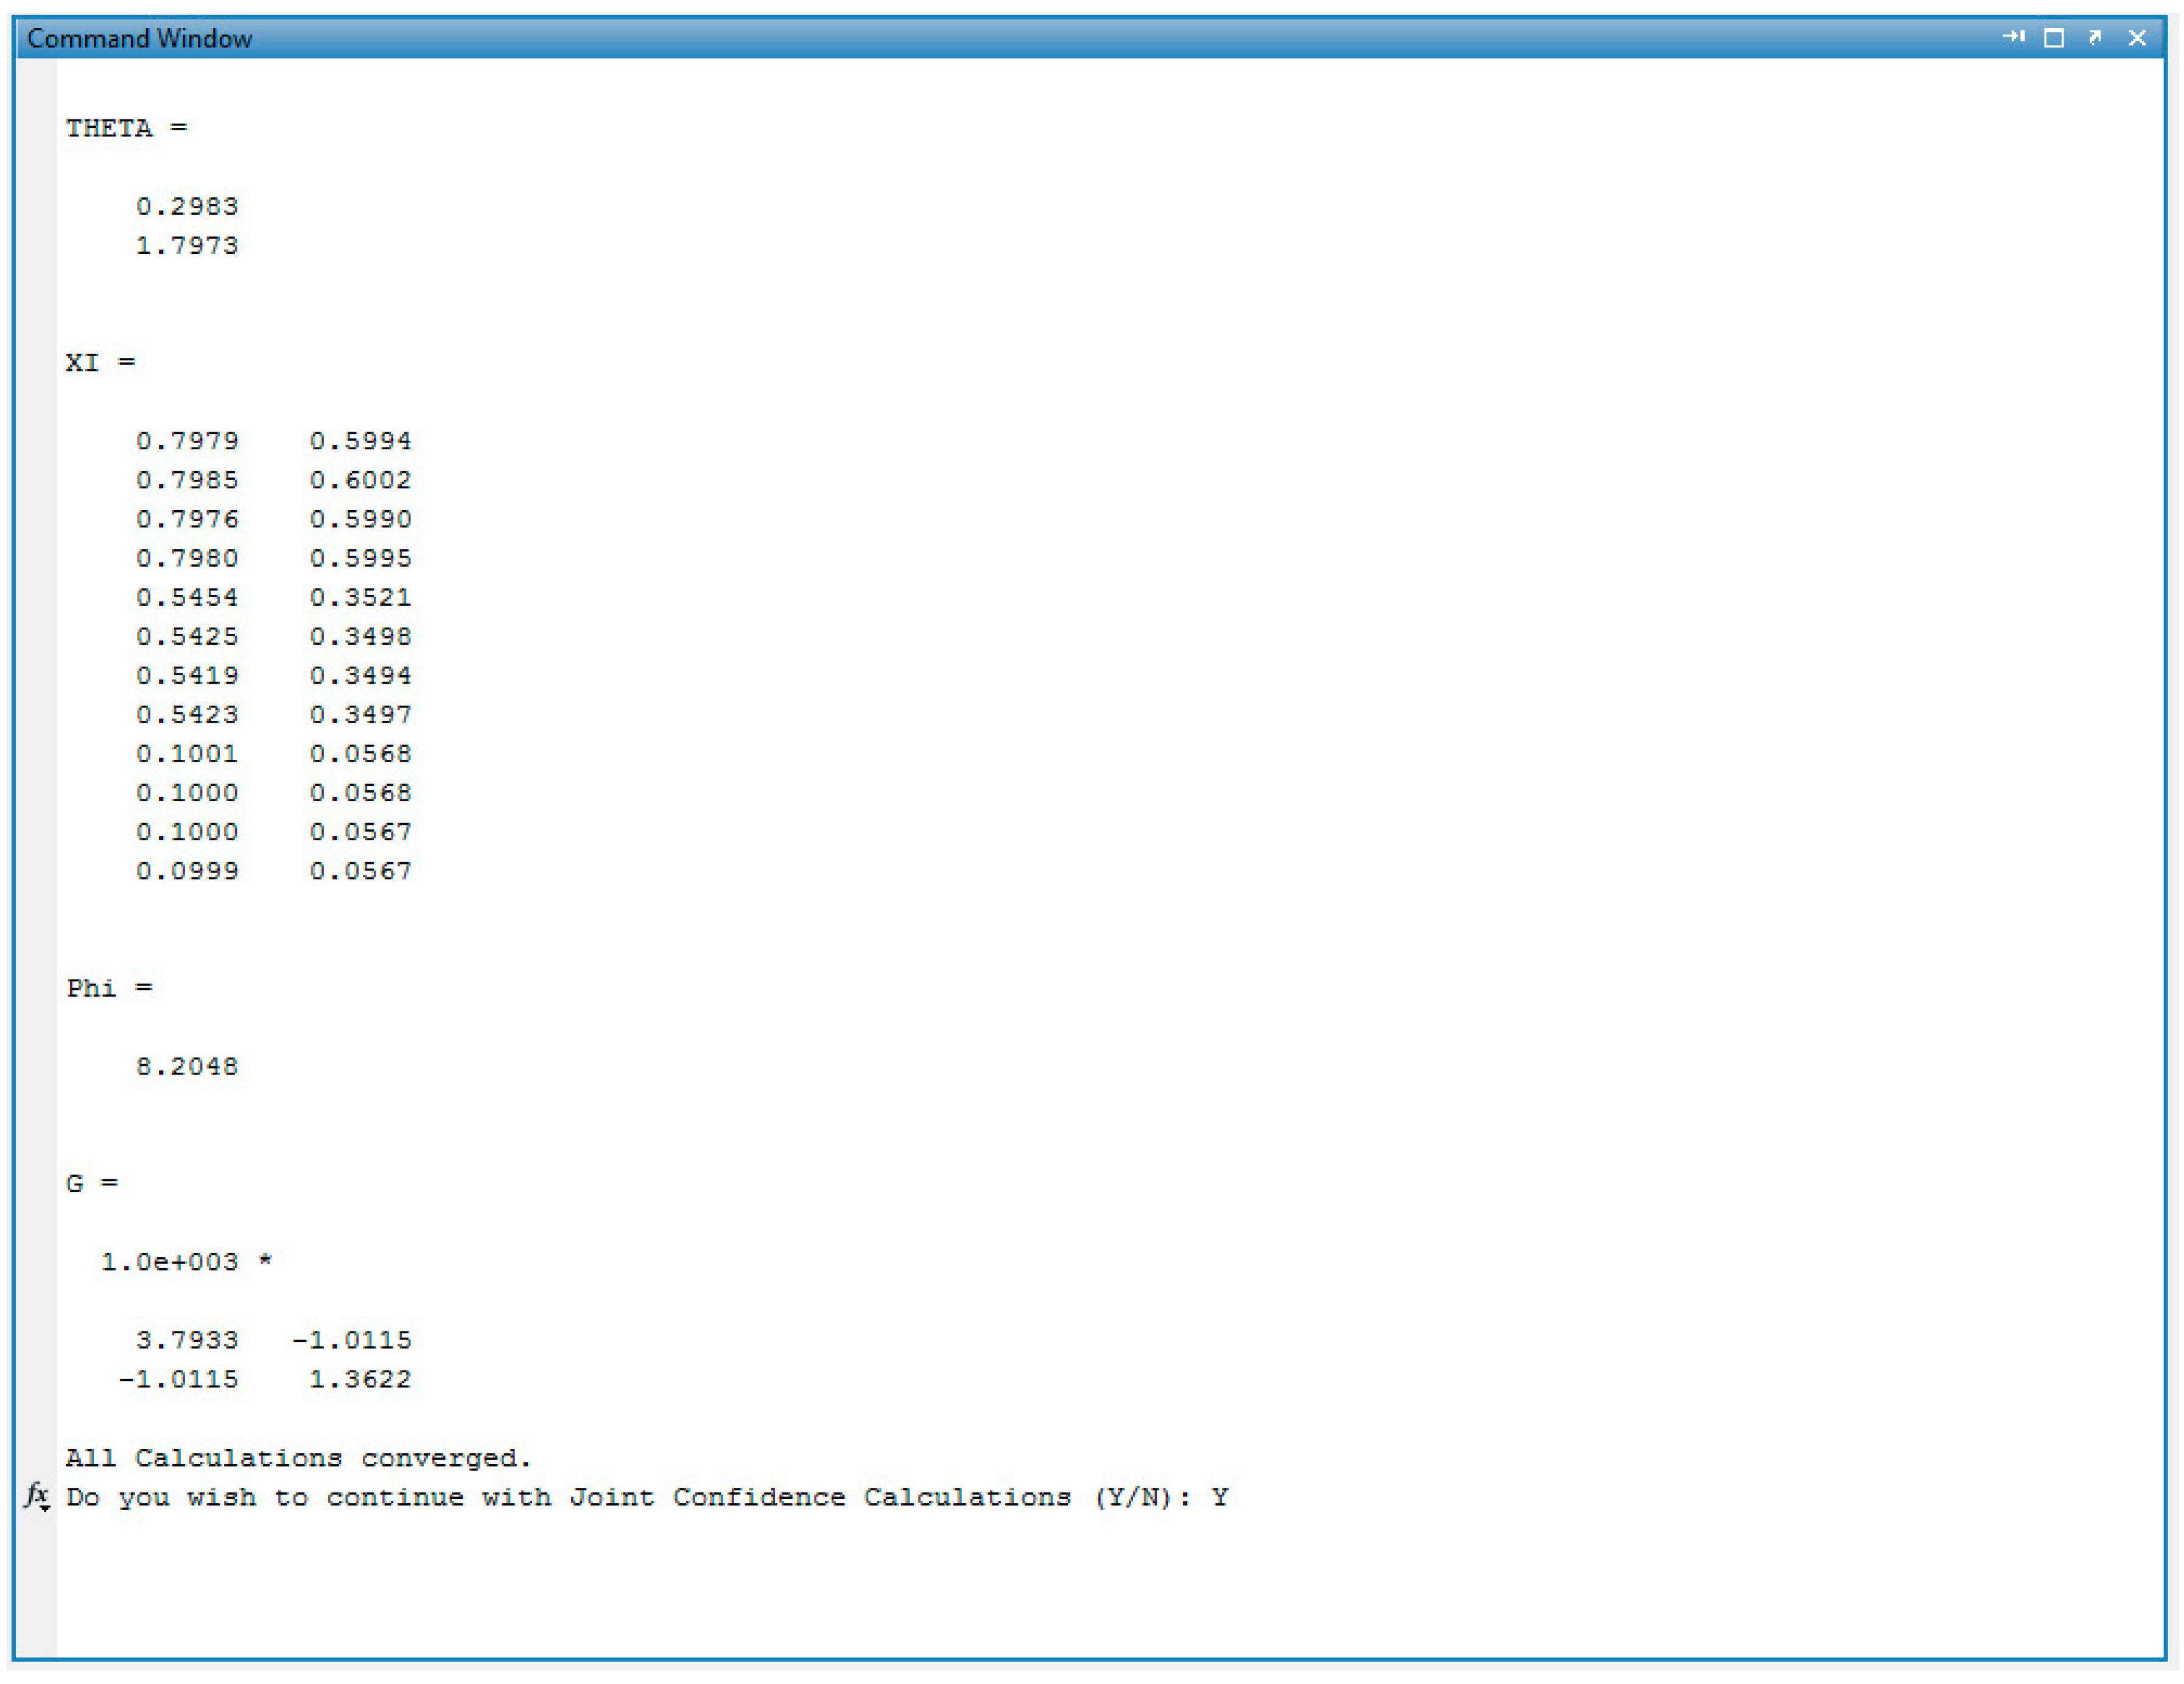
Figure 5b, as evidenced by the diagonal nature of the (more elongated) JCR. This, again, is as expected; the VAc data set was calculated from the measured MDO composition data, so correlation is inevitable here. For the interested reader, data files used for this analysis are provided in
Appendix C (
Section C.1).
In using EVM to re-analyze the data,
r1 > 1 and
r2 > 1 is still observed (see again
Figure 5). This outcome is likely a result of using cumulative composition data in an instantaneous model, since composition drift was not taken into account for this data set and conversion levels up to 80% are reported. Even the most statistically correct technique cannot reconcile cumulative experimental data with an instantaneous model (and, in this case, appropriate conversion data are unavailable for reanalysis with the cumulative EVM program).
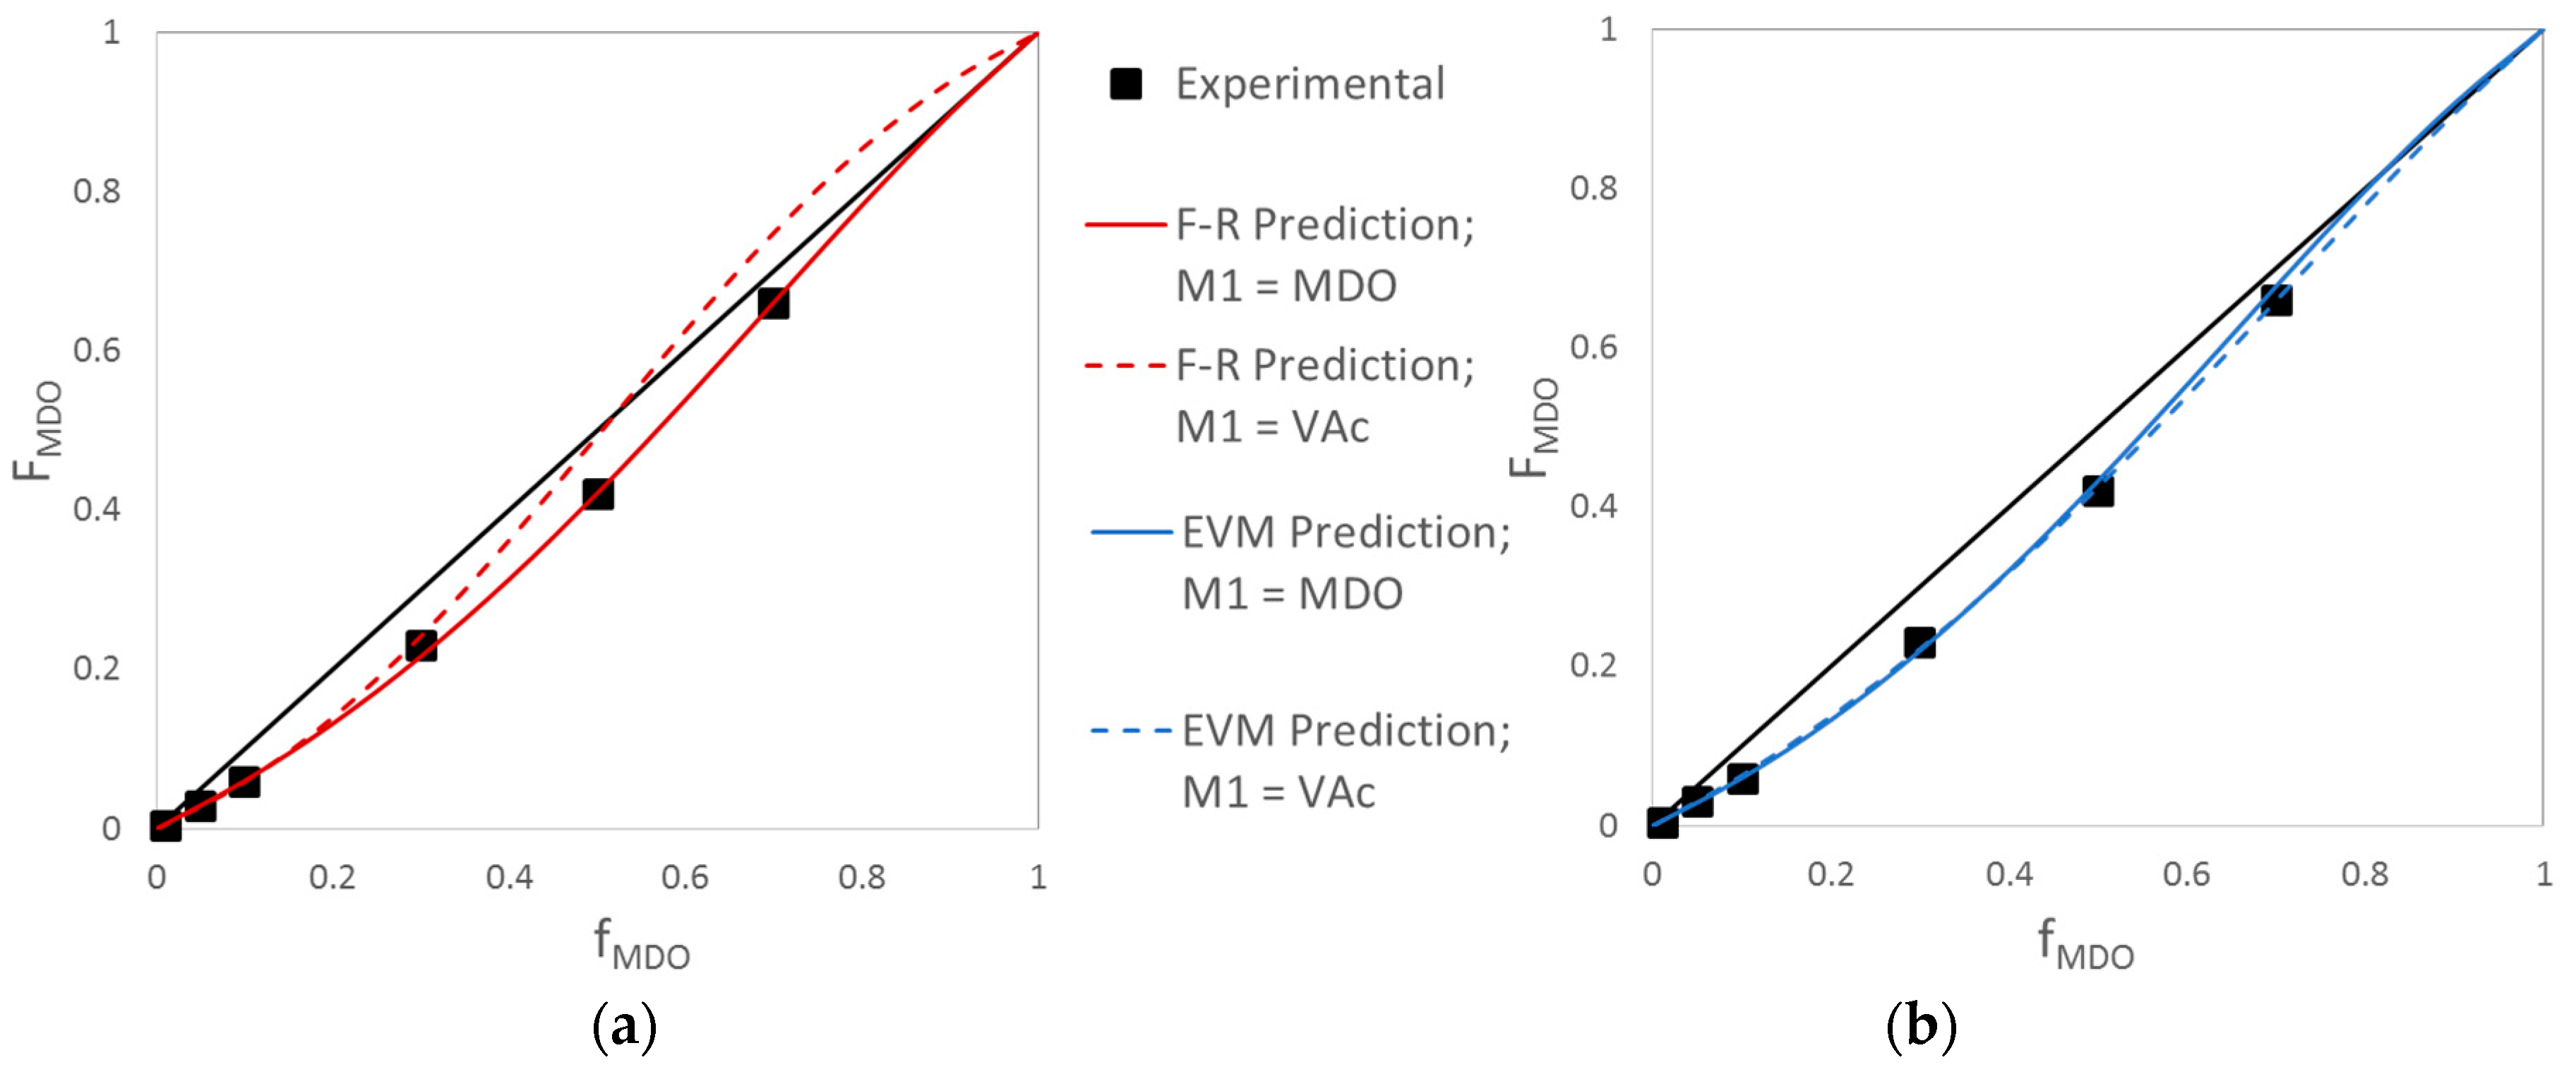
Finally, we can visually evaluate the prediction performance of the reactivity ratio estimates, which involves comparing the experimental values to those predicted by the ICC equation (Equation (1)). As shown in
Figure 6, the symmetry issues associated with the Fineman-Ross (F-R) technique have a significant impact on the prediction performance (red curves,
Figure 6a). In contrast, both of the predictions using EVM-obtained RR estimates (blue curves,
Figure 6b) are in agreement with each other and with the experimental data. This is compelling evidence to choose non-linear parameter estimation techniques like EVM over the statistically incorrect linear parameter estimation techniques.


