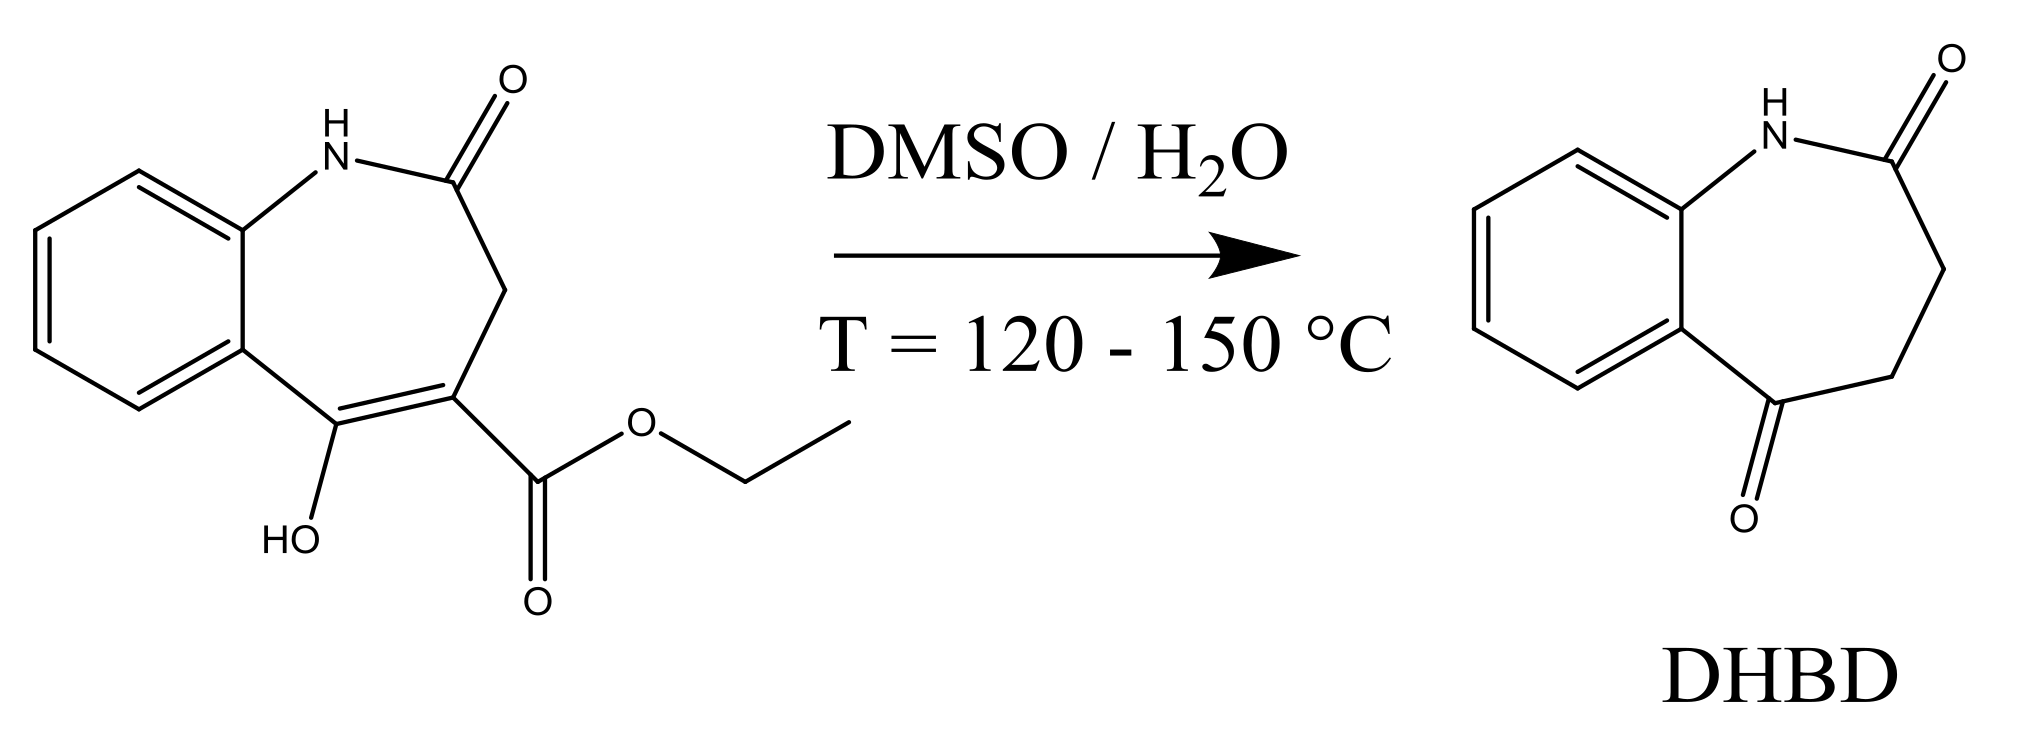
4.1. Synthesis of an API–Scaffold (DHBD)
During the early stages of API process development, different properties of the unit operations involved are analyzed in order to characterize and to optimize the synthesis as well as the downstream route. Reaction rates are regarded as key descriptors of the synthesis progression as they depend on, temperature, and time. As a first case study for MB-OED, the homogeneous synthesis of 3,4-dihydro-1
H-1-benzazepine-2,5-dione (DHBD) from the enolized 3-oxocarboxylic ester in wet dimethyl sulfoxide (DMSO) under neutral conditions and at elevated temperatures is presented; see
Figure 4.
DHBD and its derivatives are pharmaceutically relevant scaffolds utilized for the synthesis of various protein kinase inhibitors and anticancer agents [
55,
56,
57,
58,
59,
60]. In traditional reaction optimization studies, isothermal syntheses at various temperatures are carried out one by one, and the syntheses are analyzed with offline high-performance liquid chromatography (HPLC) in order to determine reaction kinetics. However, HPLC measurements are tedious in sample preparation and need increased amounts of reactant, which might not be available in the very early stage of API development. Alternatively, we implement the fast-sampling and labor free in situ attenuated total reflectance Fourier transform infrared (ATR-FTIR) spectroscopy in order to quantify the reactant concentration and, subsequently, to calculate reaction rate constants without the need for manual sampling. Combined with non-isothermal temperature profiles during the course of the reaction, temperature-dependent kinetic data, e.g., reaction rate constants at different temperatures and therefore Arrhenius parameters
and
of the reaction under study, can be derived from a single experimental run [
61]. The quality of the derived reaction rate constants critically depends on the design of the applied non-isothermal temperature profile.
In what follows, we assume an Arrhenius rate expression:
where
k is the rate constant,
T is the absolute temperature,
R is the ideal gas constant,
is the pre-exponential frequency factor, and
the activation energy. Because of the inherent correlation of the two Arrhenius parameters,
and
, the parameterization of the Arrhenius equation (Equation (
25)) is challenging. That is, independently of the applied experimental setup the correlation cannot be reduced for the Arrhenius rate [
62,
63] expression. At best, a parameter transformation might be applied to mitigate the correlation effect but changes the meaning of the identified parameters alike [
64]. Thus, for this particular MB-OED problem, any anti-correlation criteria, which include the modified
-criterion as well, fail. Only the overall uncertainty of the parameter estimates can be reduced in principle. For this very reason, we first derive MB-OED results based on local sensitivities (Equation (
4)) and the classical D-criterion (
Section 3), which is expected to minimize the volume of the parameter confidence ellipsoid [
14]:
The optimal experimental design problem is described in Equations (
26)–(28), where Equation (27) is the dynamic reaction model with the DMSO concentration
, and Equation (28) is the temperature constraint. A temperature profile divided into equidistant and constant subintervals is assumed. For all intervals, upper and lower temperature bounds are given as
100
and
150
while assuming continuous measurements of DHBD. Technically, the Matlab
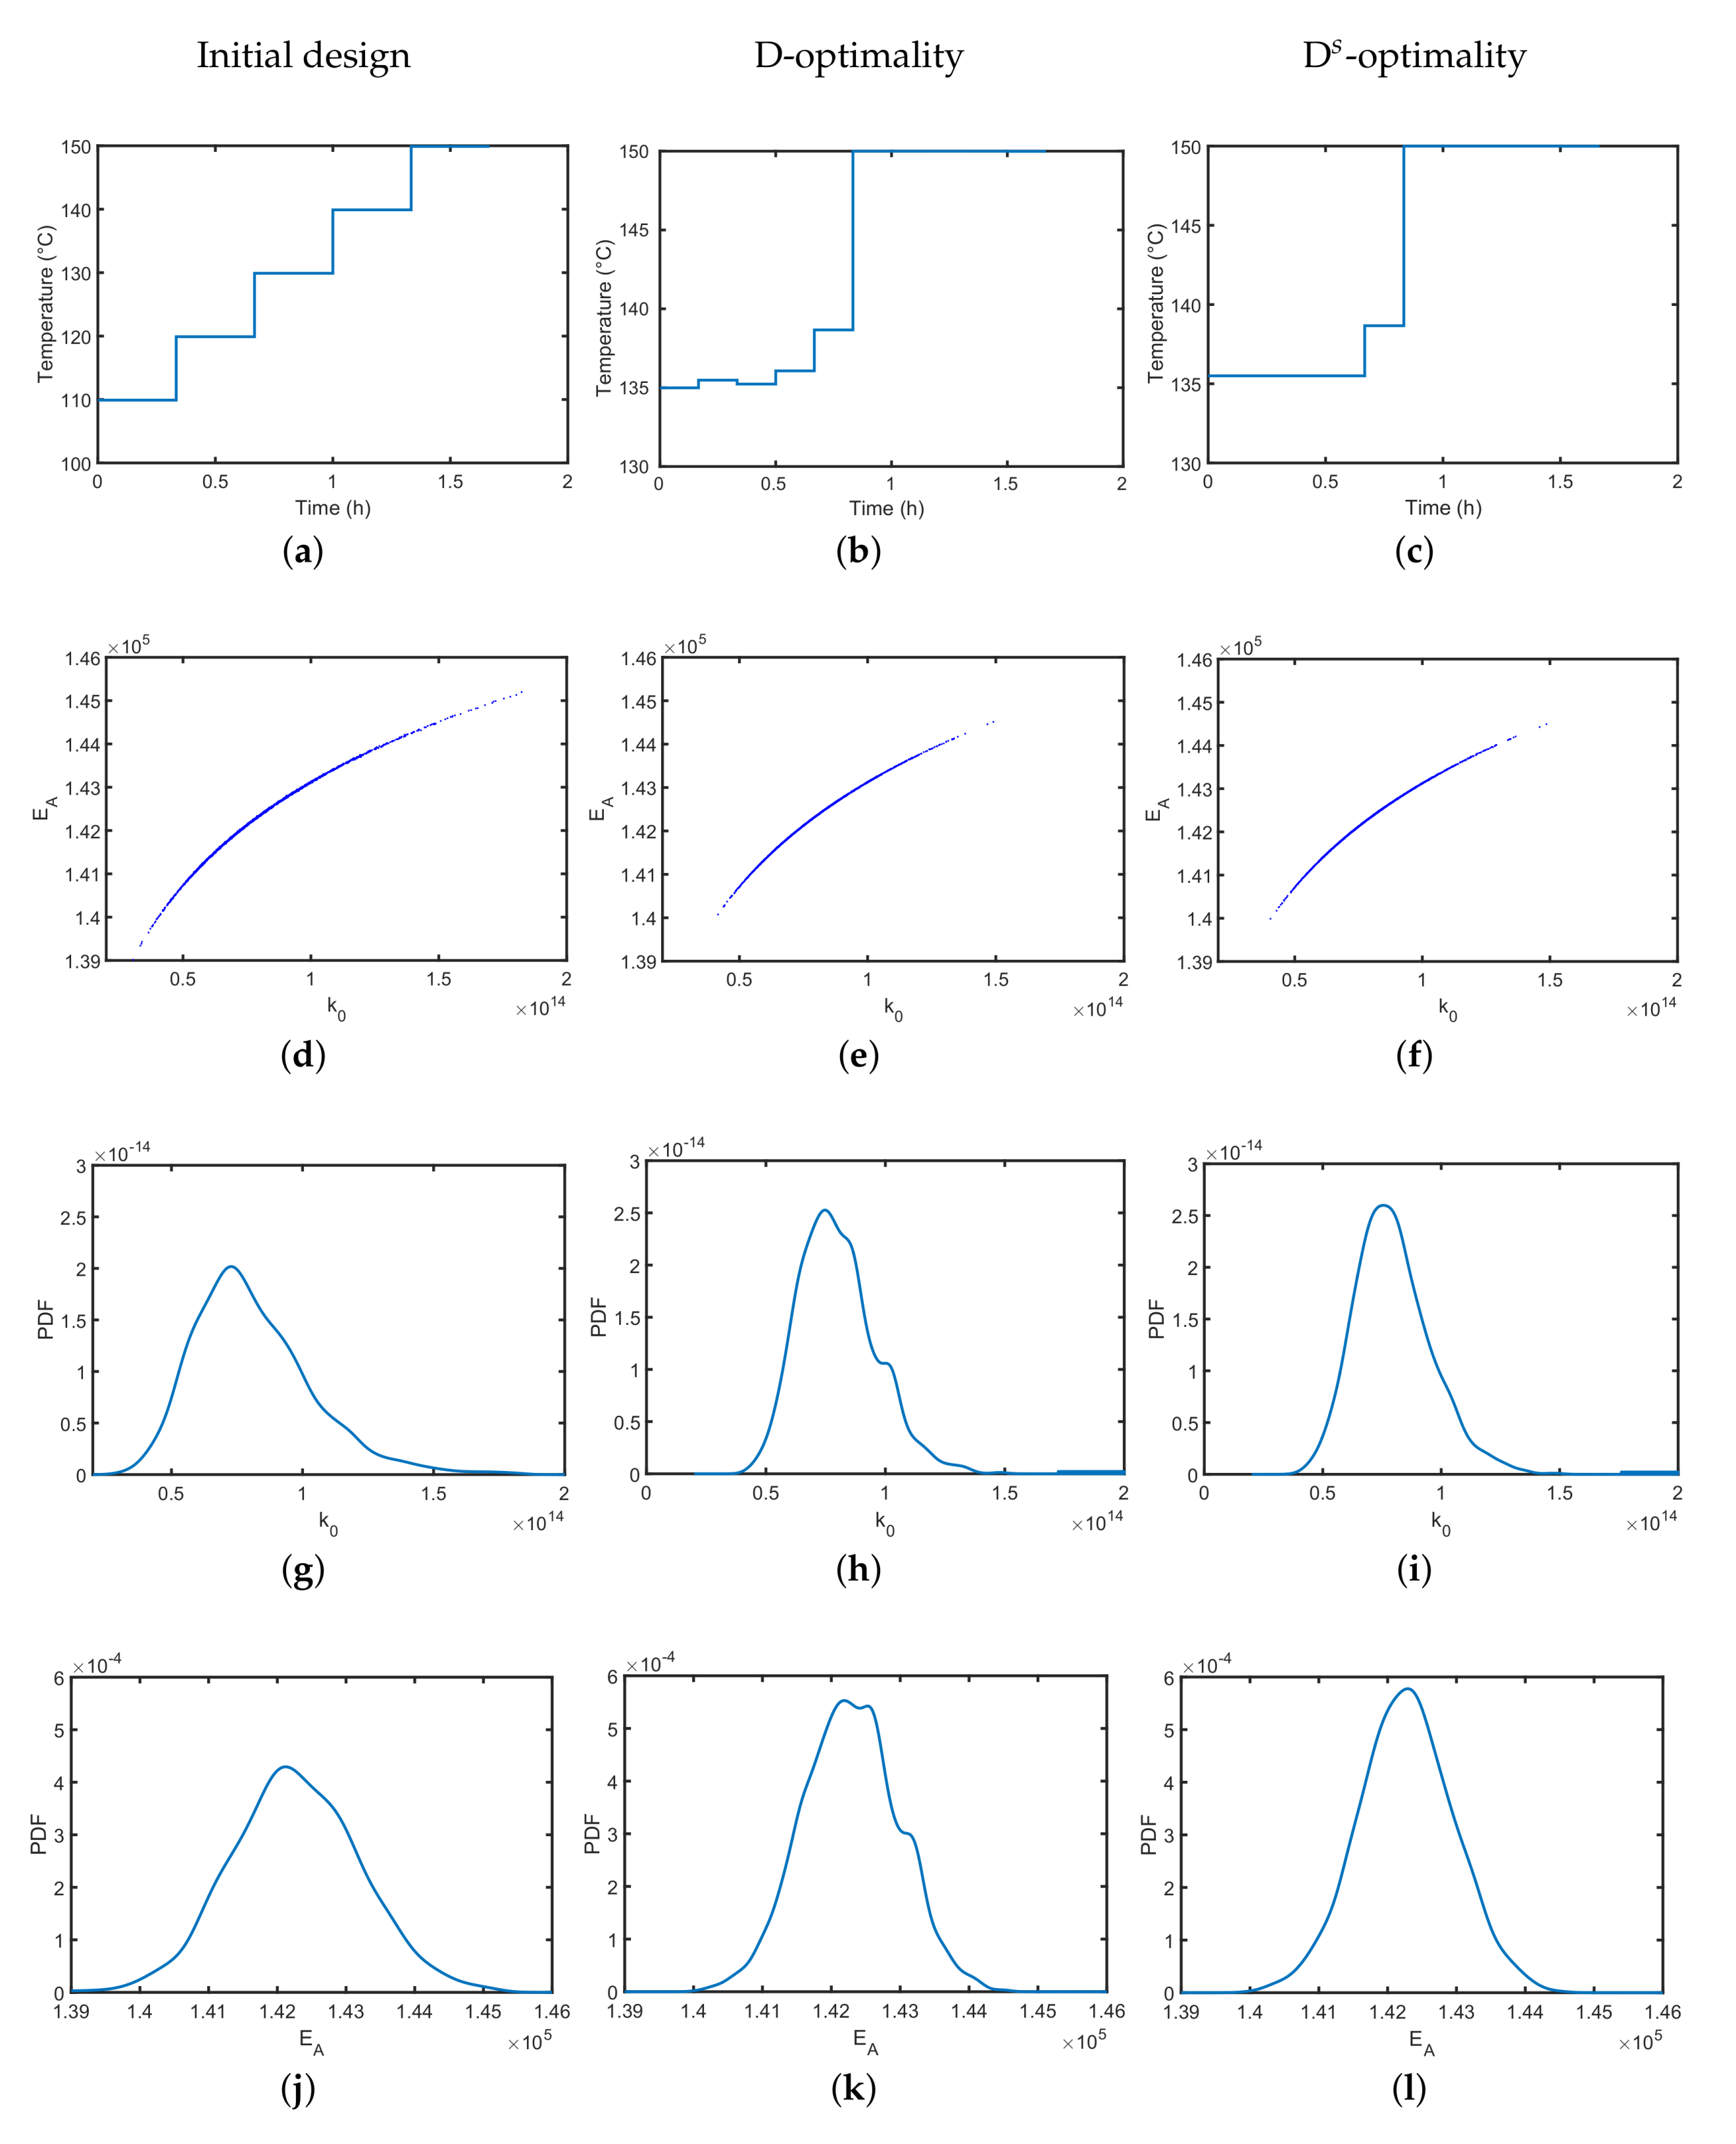
® (R2017a) optimizer fmincon is used to derive an optimal temperature profile; i.e., a profile that provides the most informative data and lowest parameter variations. The performance of the original and optimal temperature profile is validated with 2000 Monte Carlo simulations, where for each simulation and parameter identification, respectively, artificial experiment data are assumed with additive white noise. In
Figure 5a, we show a reference temperature profile of five temperature steps of equal step-size, which was chosen by educated guessing. The reference profile might already be a good choice to identify the two Arrhenius parameters as it covers the whole temperature range without any obvious preferences. In
Figure 5b, we see that the estimates are of finite variation, but as expected, they are strongly correlated. In
Figure 5g,j, the individual parameter distributions represent the parameter uncertainties of
and
from a different angle and represent their individual but finite variation. In the next step, the D-optimally designed temperature profile is derived numerically and shown in
Figure 5b. Compared to the reference temperature profile, less dedicated temperature steps are visible over the experimental course. However, the range of the temperature values is lower; i.e., it starts at a higher temperature of 135
and ends with the highest possible temperature of 150
. Assuming the same measurement imperfections, the uncertainty in the identified Arrhenius parameters can be reduced by the optimized temperature profile; i.e., the uncertainty of the individual parameters is lower as indicated by the probability density functions in
Figure 5h,k. The parameter correlation, however, as can be seen in
Figure 5e, remains at the same level. As the derived optimal temperature profile might be difficult to realize due to the small temperature shifts resulting in operability and control issues, a simplified D
-optimality temperature profile ignoring temperature shifts that are below 2 K variations (see
Figure 5c) could be implemented with almost no performance loss; see
Figure 5f,i,l for clarification. Similar lab-relevant constraints might be directly added to the underlying dynamic optimization problem [
65] but are beyond the scope of this paper.
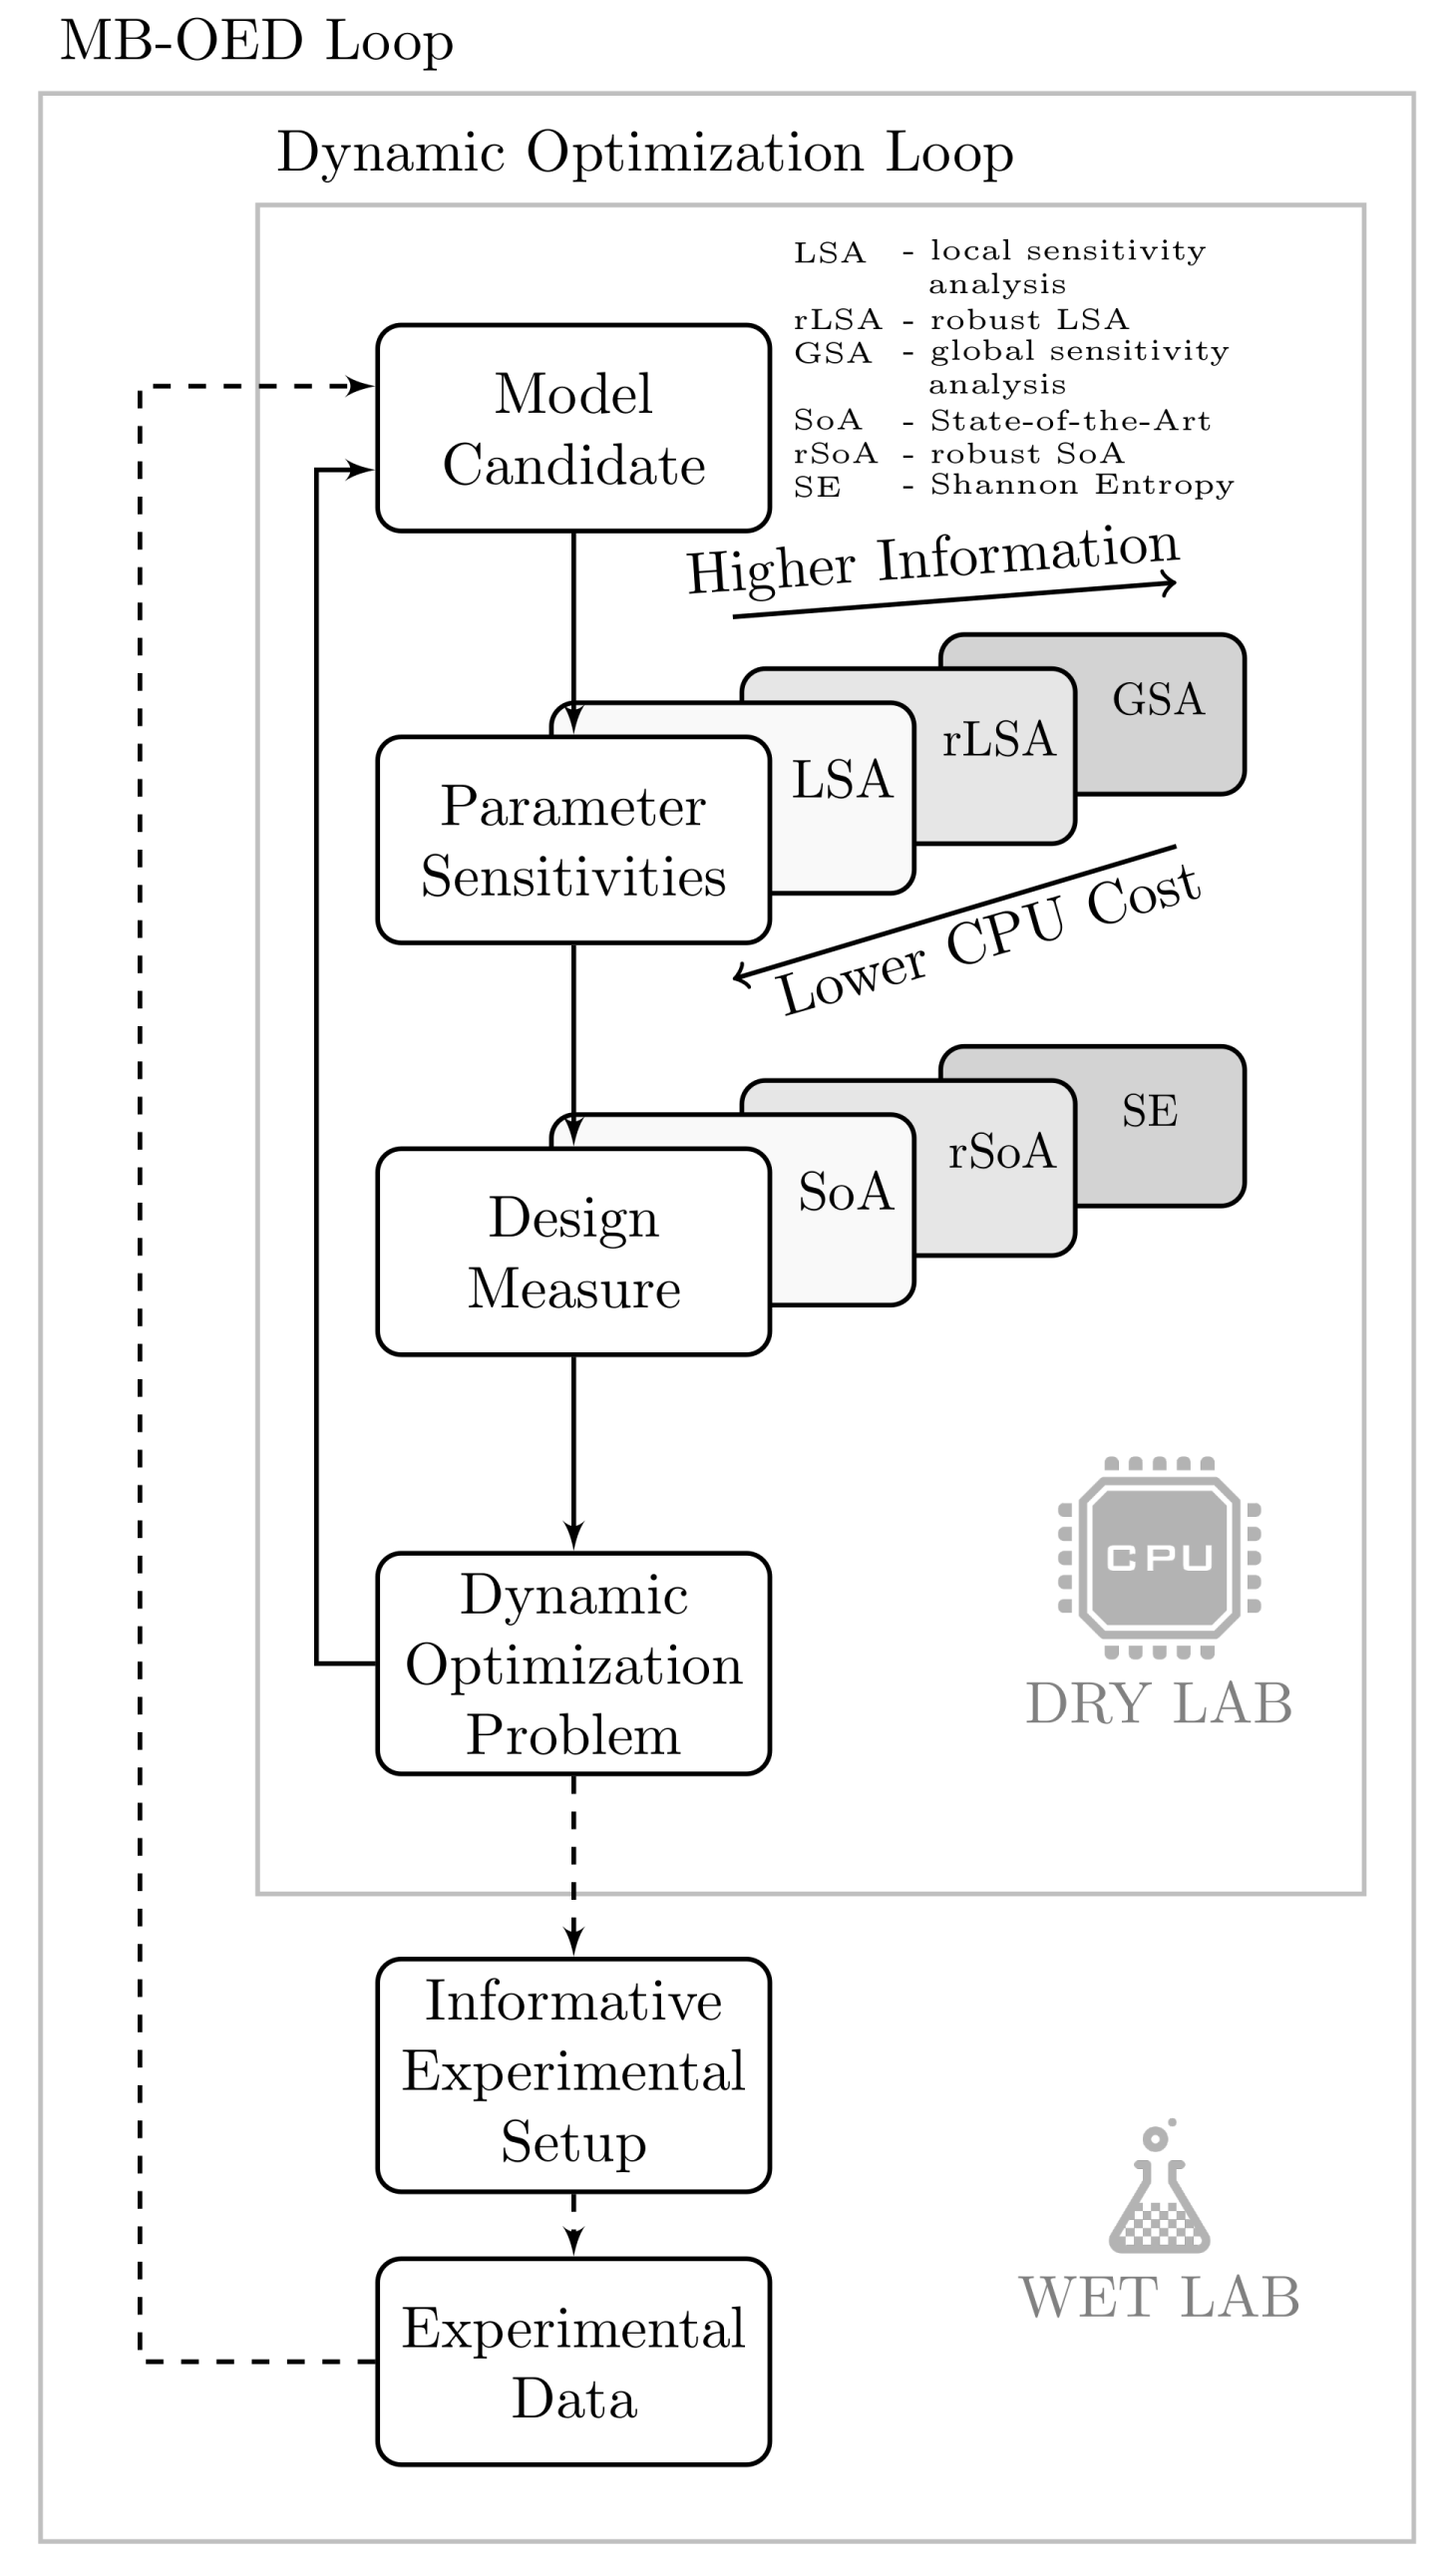
Thus far, only local sensitivities have been studied assuming the given reference Arrhenius parameters at which the local sensitivities have to be evaluated. The outcome of this local MB-OED strategy, however, depends critically on the quality of the reference parameters at which the local sensitivities (Equation (
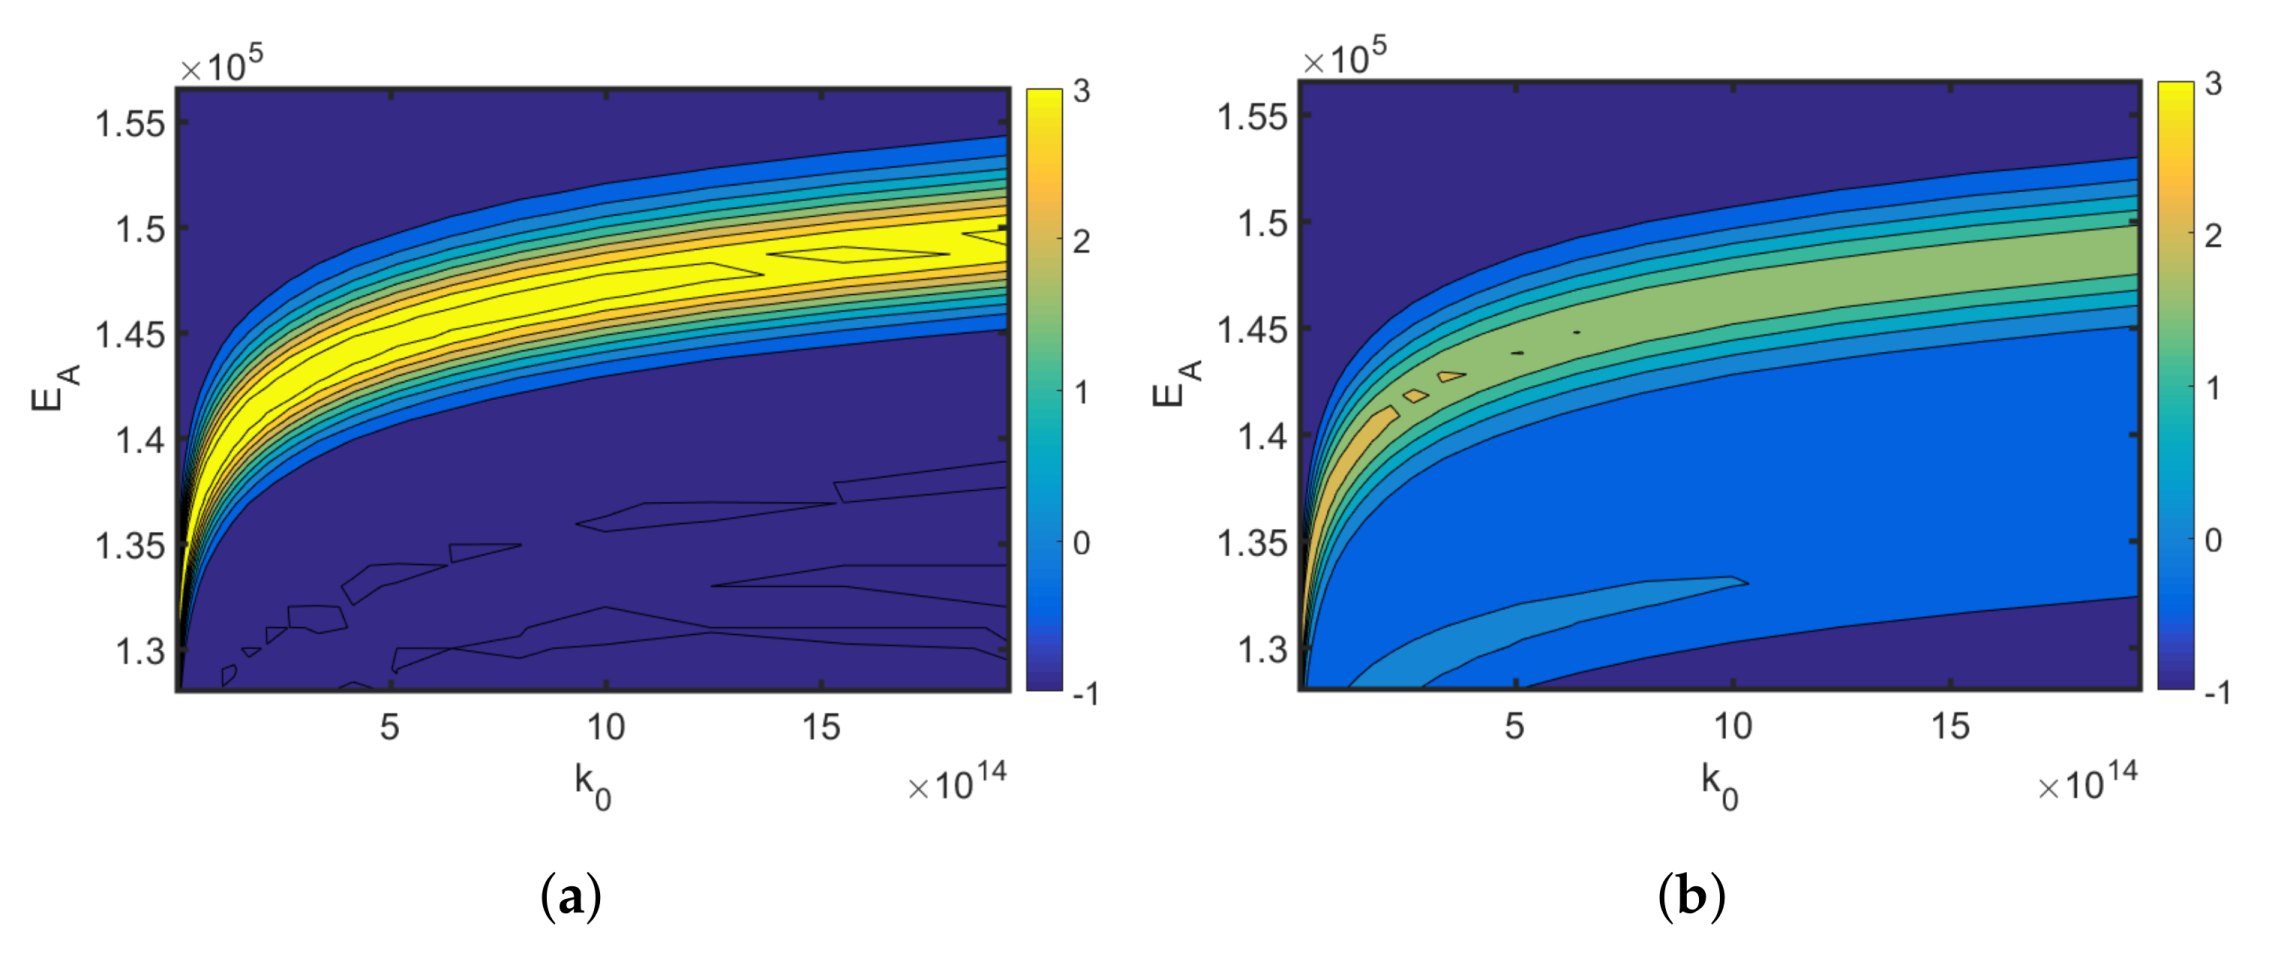
4)) are derived. Any deviation of these parameters from their nominal values leads to a change in the local sensitivity values and the D-optimality. In
Figure 6, the relative change in the optimized cost function is shown, which is defined as
The results show that a misspecification of the applied reference Arrhenius parameters is likely to result in sub-optimal temperature profiles, less informative measurement data, and higher parameter uncertainties. Alternatively, when the multi-point averaging approach is used (Equation (
8)), the calculated design is more robust against reference parameter variations; see
Figure 6b. The classical D-optimality shown in
Figure 6a degrades drastically with reference variations. The robust D-optimality, however, shown in
Figure 6b is less affected by changing the reference parameters. As the reference parameters are typically unknown but are needed to calculate local parameter sensitivities, a robust MB-OED strategy is expected to provide more valuable MB-OED results. Moreover, global parameter sensitivities are evaluated and used for a more credible D-optimality measure (
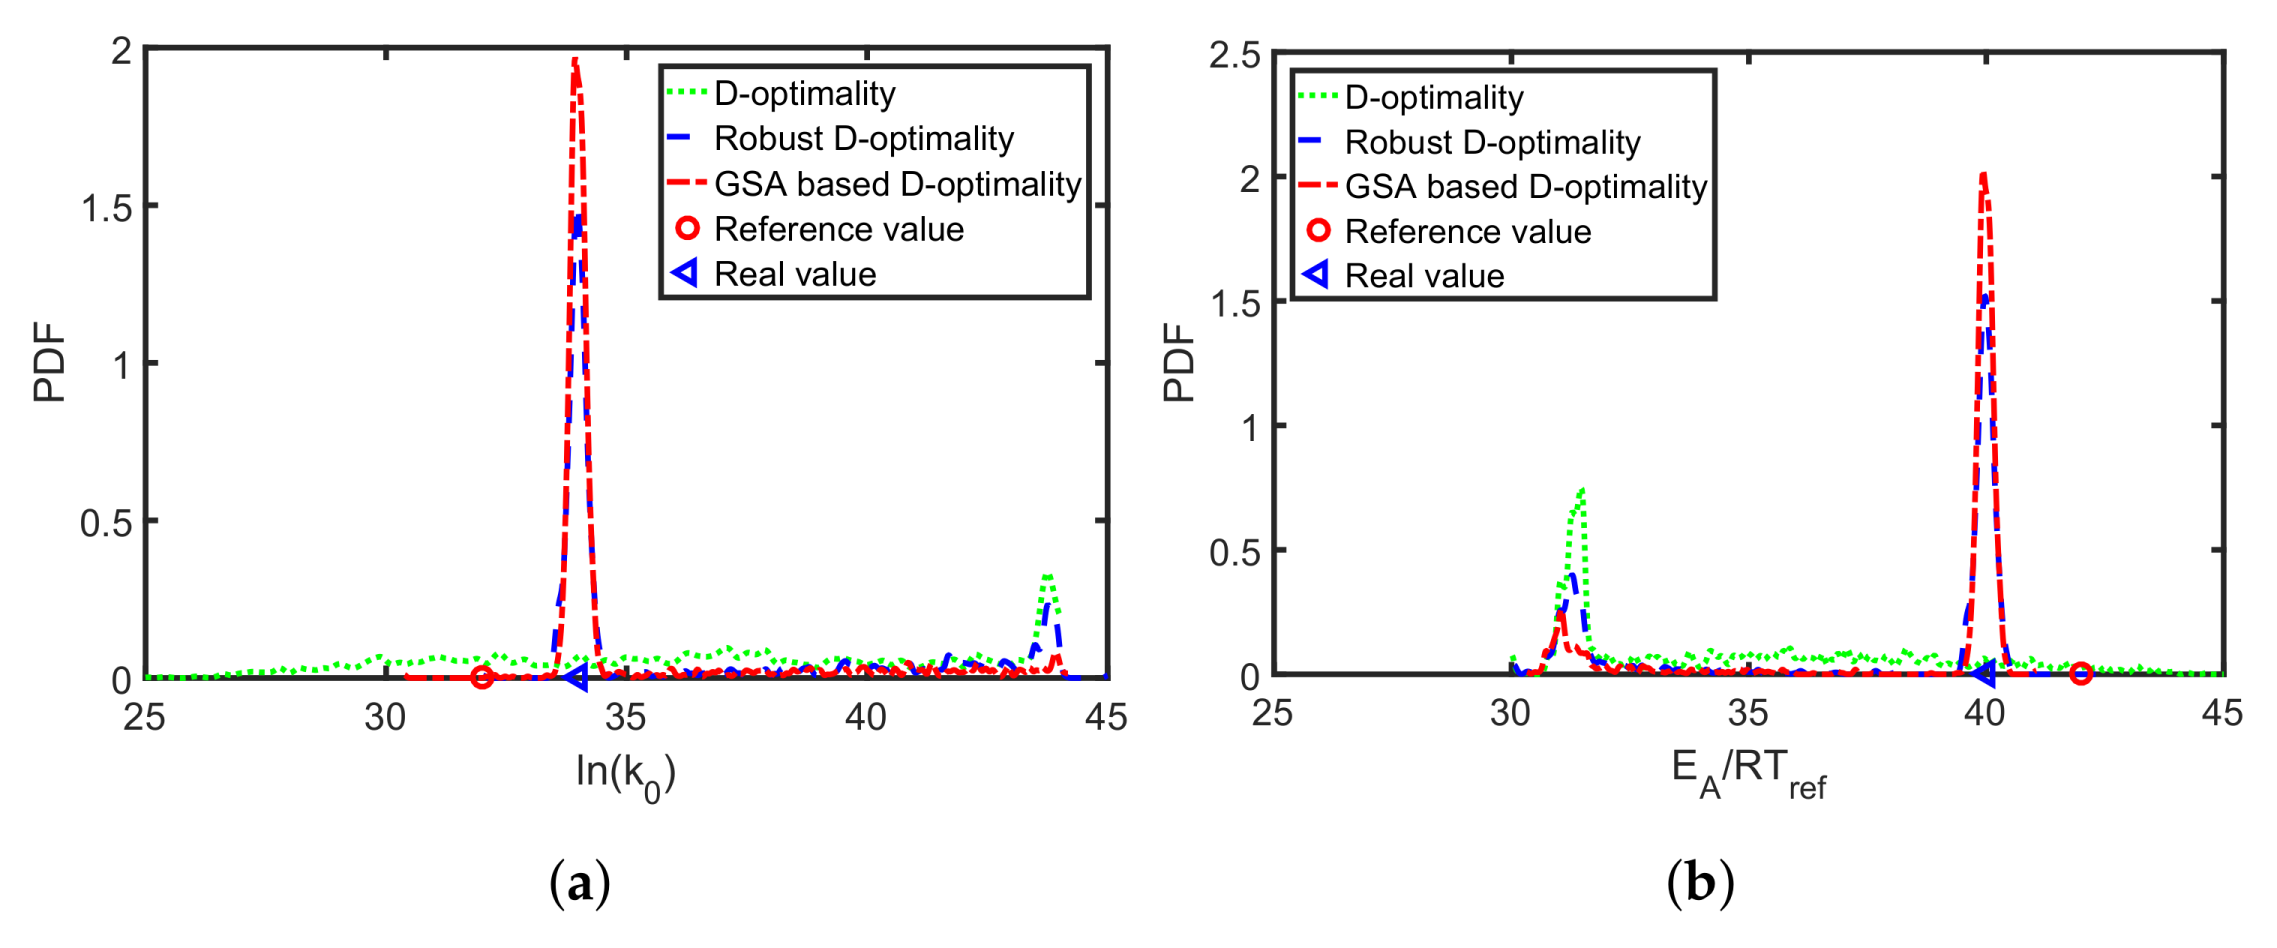
Table 4). The resulting parameter errors for the classical D-optimality, its multi-point averaging realization, and the global sensitivity-based D-design are analyzed. In
Figure 7, the multi-point averaging approach and the GSA-based MB-OED lead to more precise parameter estimates in comparison to the classical D-optimality as indicated by the density functions. Here, the GSA-based design results in the most precise estimates; i.e., the probability density functions of Arrhenius parameter have their highest peak close to the true values. Moreover, the multi-point averaging approach and the GSA-based design seem to be less corrupted by the misleading second local minima of the parameter identification problem, which is indicated by the second peak of the probability density functions in
Figure 7a,b. Please note, because the proposed PEM sampling strategy is used, only nine sample points for each iteration of the optimizations step are needed to calculate the multi-point averaging or GSA measures in the case of the two Arrhenius parameters.
The applied sensitivity measure has a strong impact on the MB-OED results for the Arrhenius parameters. The classical MB-OED based on local sensitivities is error-prone and is expected to provide sub-optimal experimental designs. For novel APIs, which are available only in very small quantities, each individual experimental run counts. Therefore, MB-OED following a multi-point averaging approach or GSA principles seems to be preferable. Combined with the proposed non-isothermal temperature profile strategy, the optimized temperature profiles ensure the best use of the API-scaffold DHBD and the most precise estimates of the kinetic rate parameters, and . In the next step, an MB-OED study of a more complex biochemical synthesis problem is presented where the focus is also on the effect of global design measures.
4.2. A Fed-Batch Bioreactor
In the second test case study, a fed-batch bioreactor is analyzed. A lumped version of a generic biomass-substrate model reads as follows:
where
is the biomass concentration,
is the substrate concentration,
V is the liquid volume, and
U is the inlet flow rate. The specific growth rate
and the specific consumption rate
follow Monod expressions
The nominal parameter values in Equations (
30)–(34) and the initial conditions for the dynamic model are listed in
Table 6.
For the experimental setups, the following constraints are considered. The duration of the reaction is set to 15 h. The biomass and the substrate concentration are measurable with a sample rate of 0.75 h, which results in a total set of 40 measurement samples. The maximum specific growth rate
, the half velocity constant
, and the yield coefficient
should be estimated by minimizing the difference between the measurements and the simulation results. In this simulation study, artificial measurement data [
67] are used with additive measurement noise of
and
for
and
, respectively. The MB-OED strategy aims at reducing the uncertainty of the parameters by optimizing the feeding policy of the fed-batch bioreactor. Thus, the inlet profile
U is parameterized by 20 constant segments of equal size, which are optimized to provide the most informative experimental data. The Monod kinetic parameters,
,
and
, are treated as uncertain. Their variations are expressed by uniform PDFs of different ranges, i.e.,
,
, and
, which might have been derived experimentally with a parameter identification procedure. In addition to
,
, and
, the model parameters are assumed to be given by the literature without any uncertainty. Thus, please note that only 19 sample points for each iteration of the optimization step are needed to calculate the multi-point averaging or GSA measures when using the proposed PEM sampling strategy.
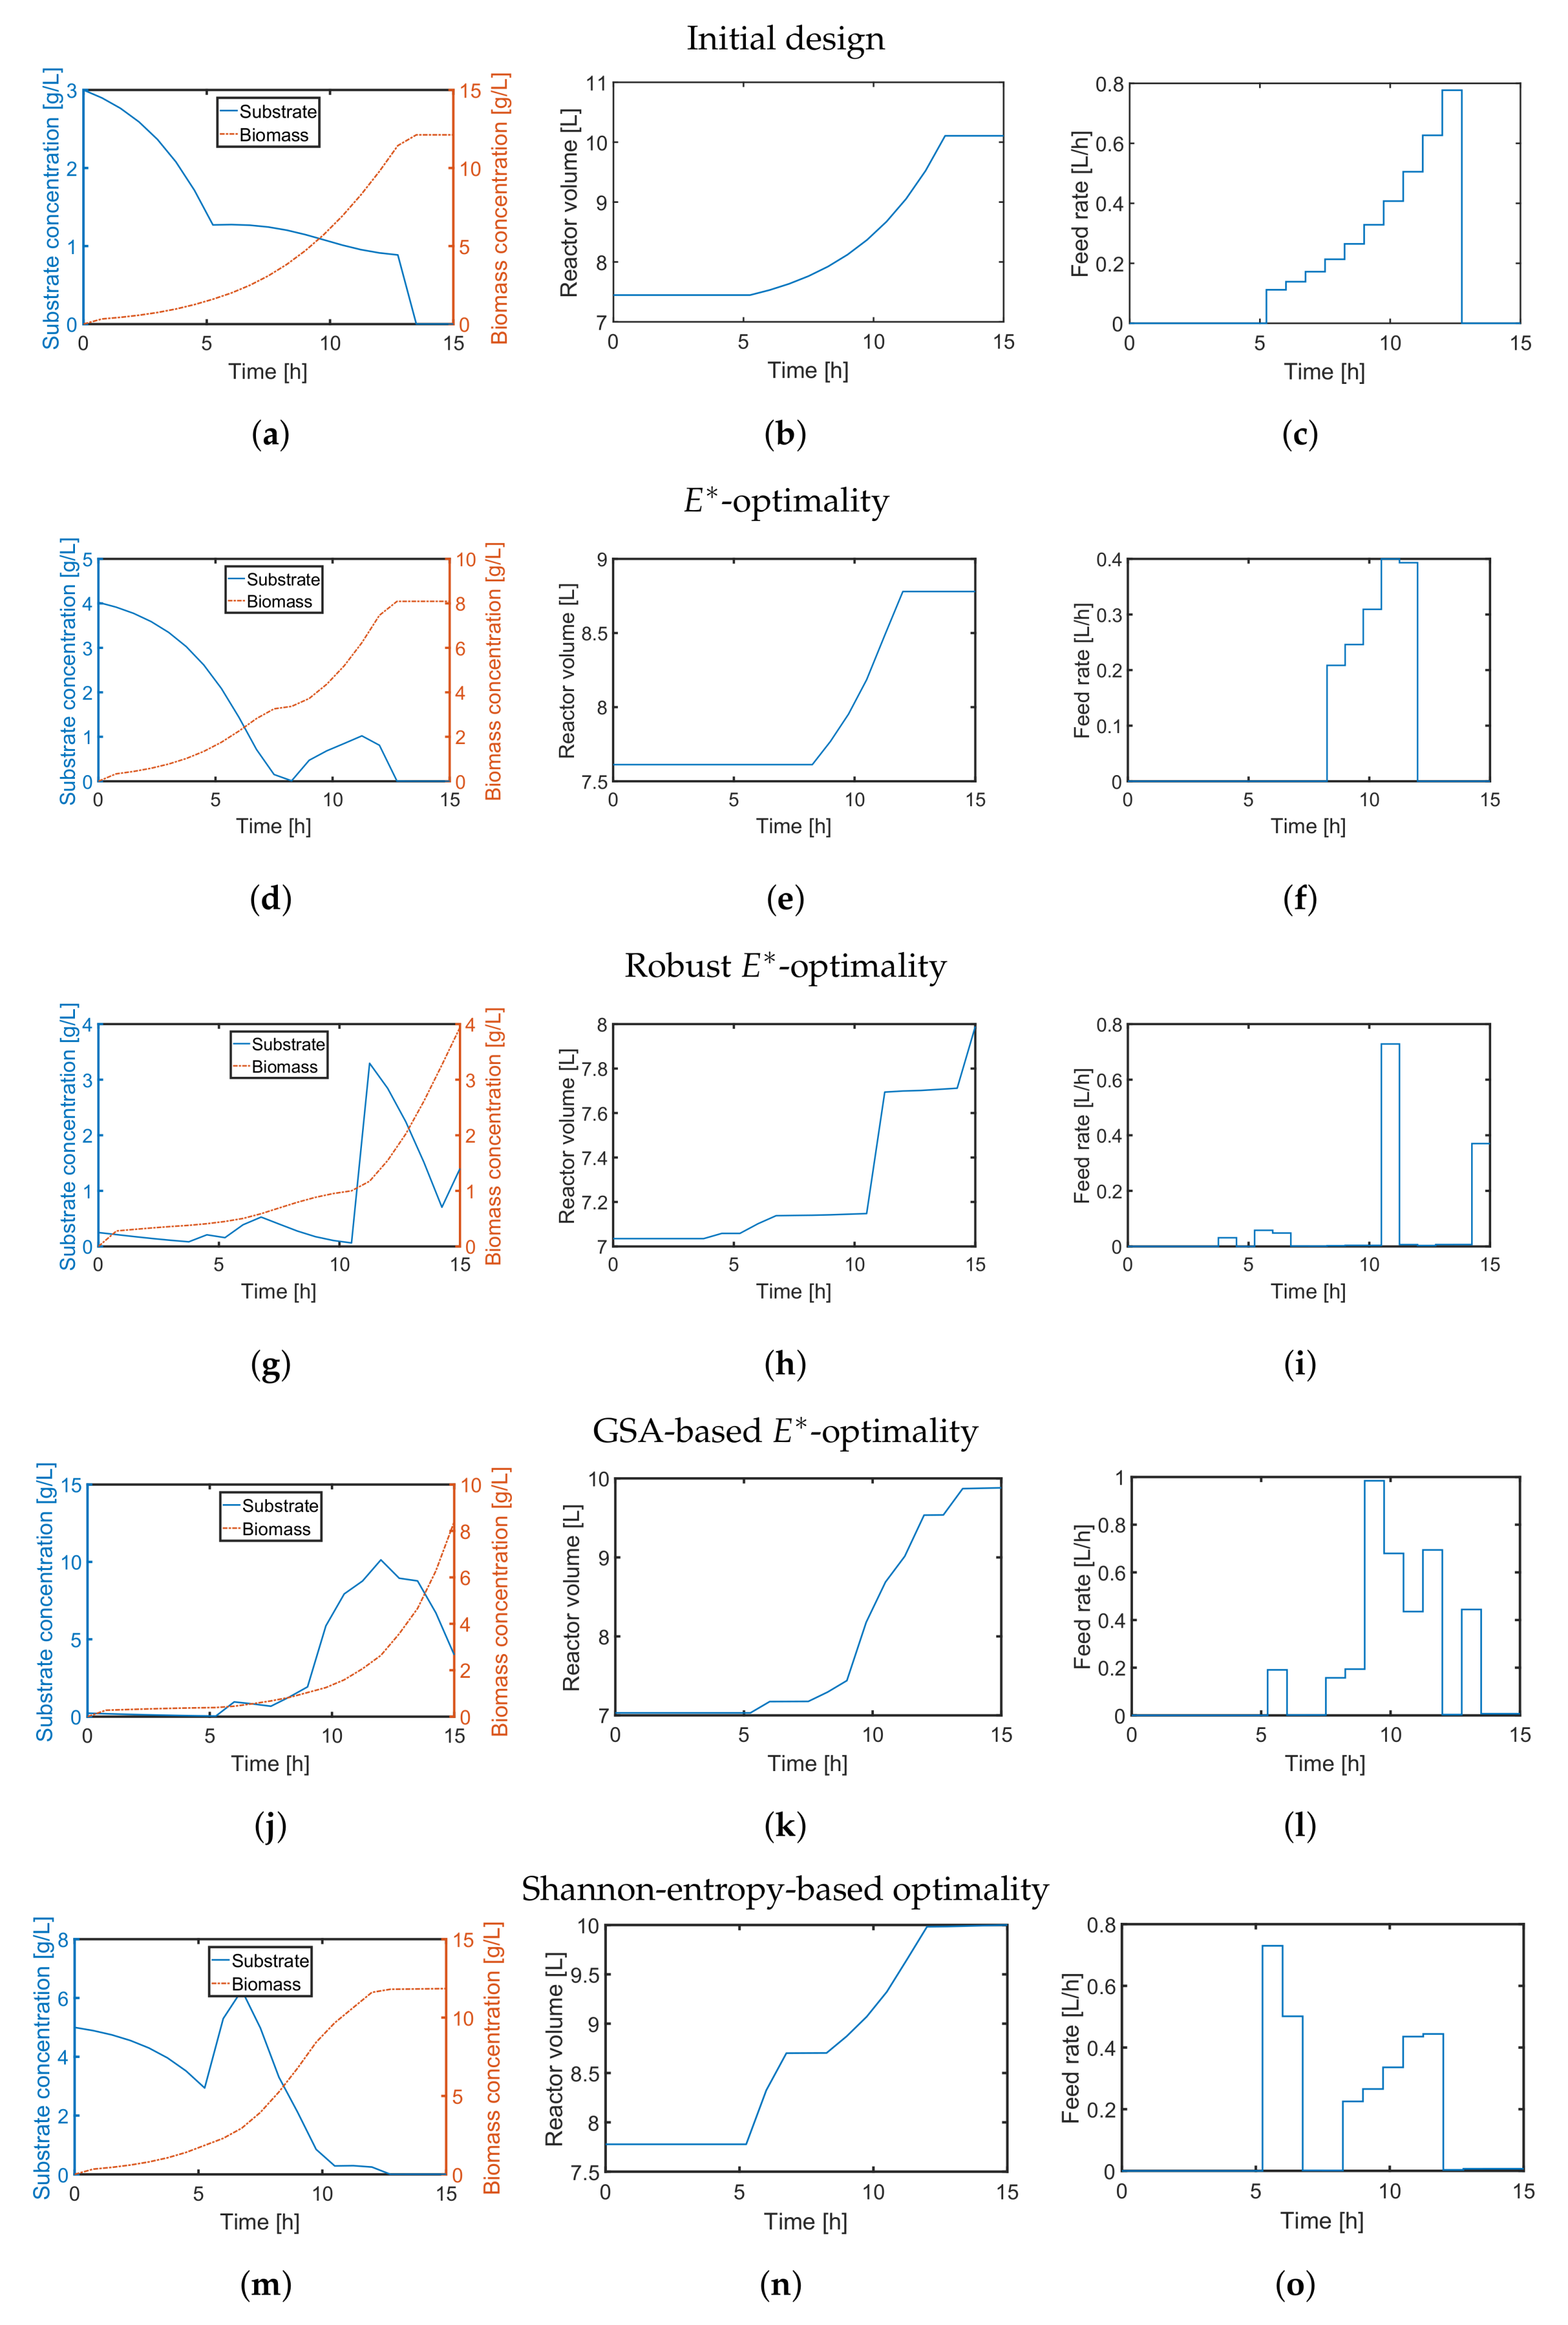
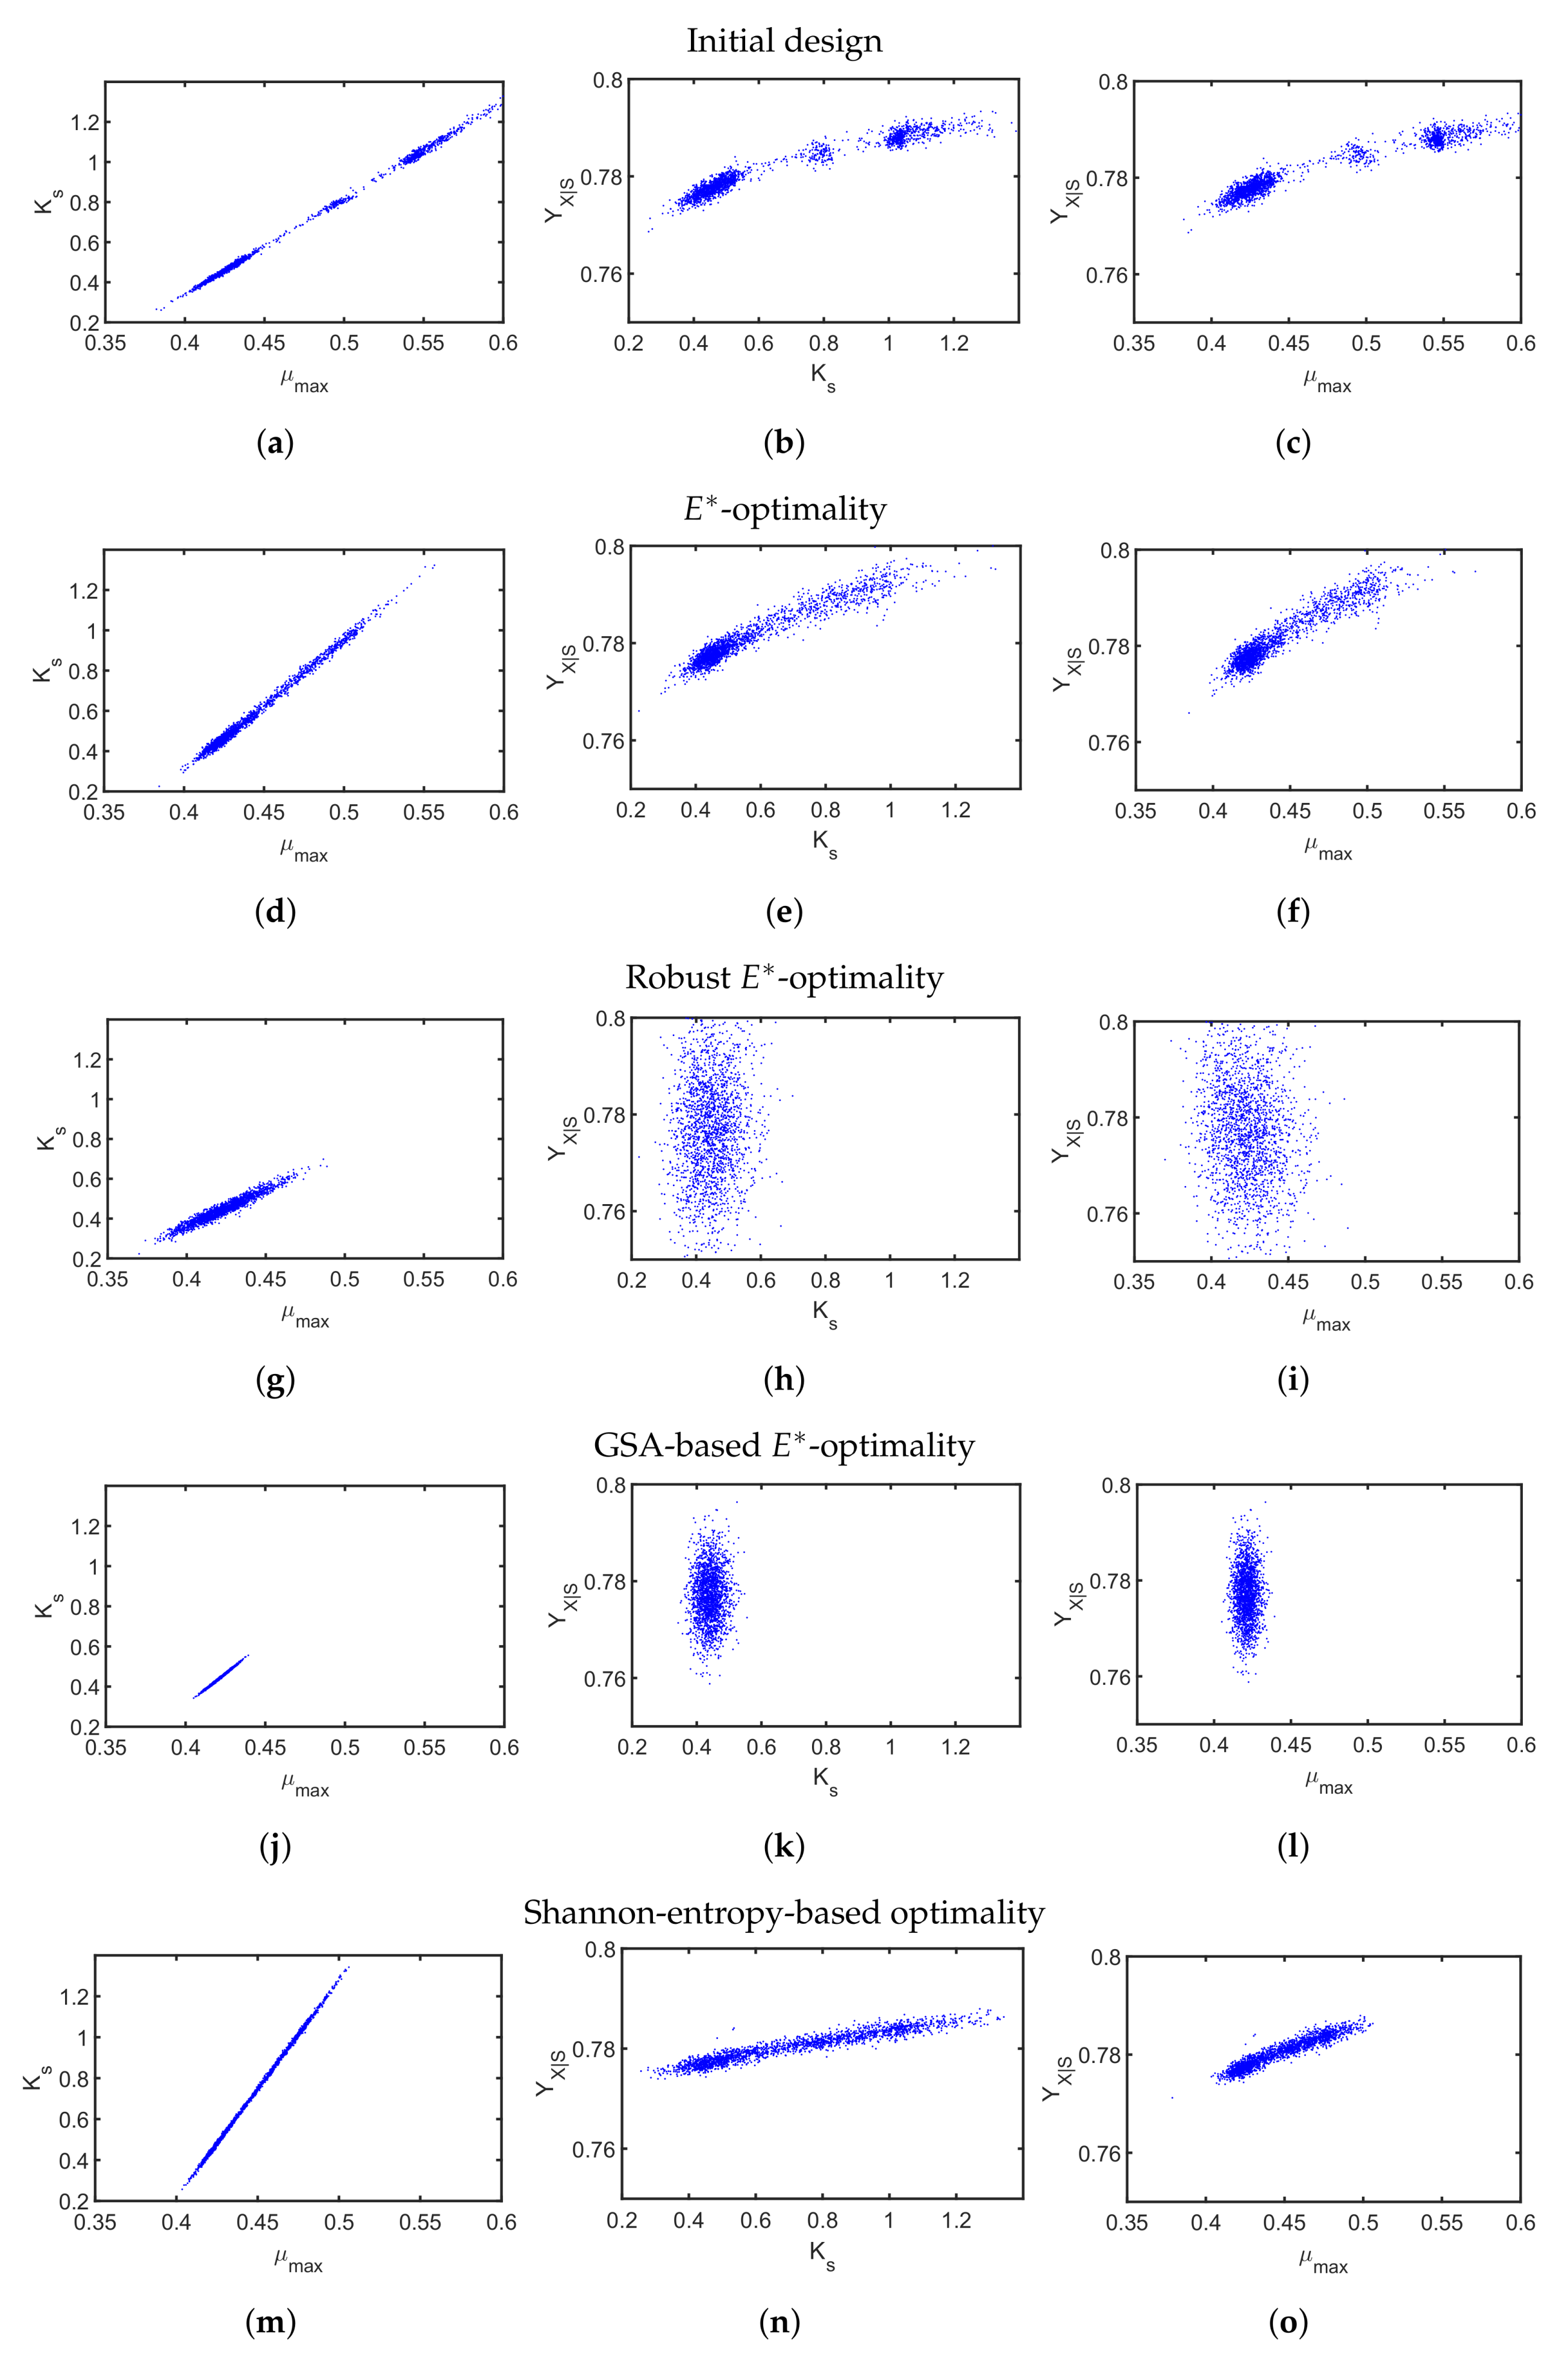
First, we applied the
-design to minimize imbalanced parameter sensitivities and uncertainty. Similar to the previous case study, we compare a default substrate inlet profile (
Figure 8c) with the outcome of the classical
-design in
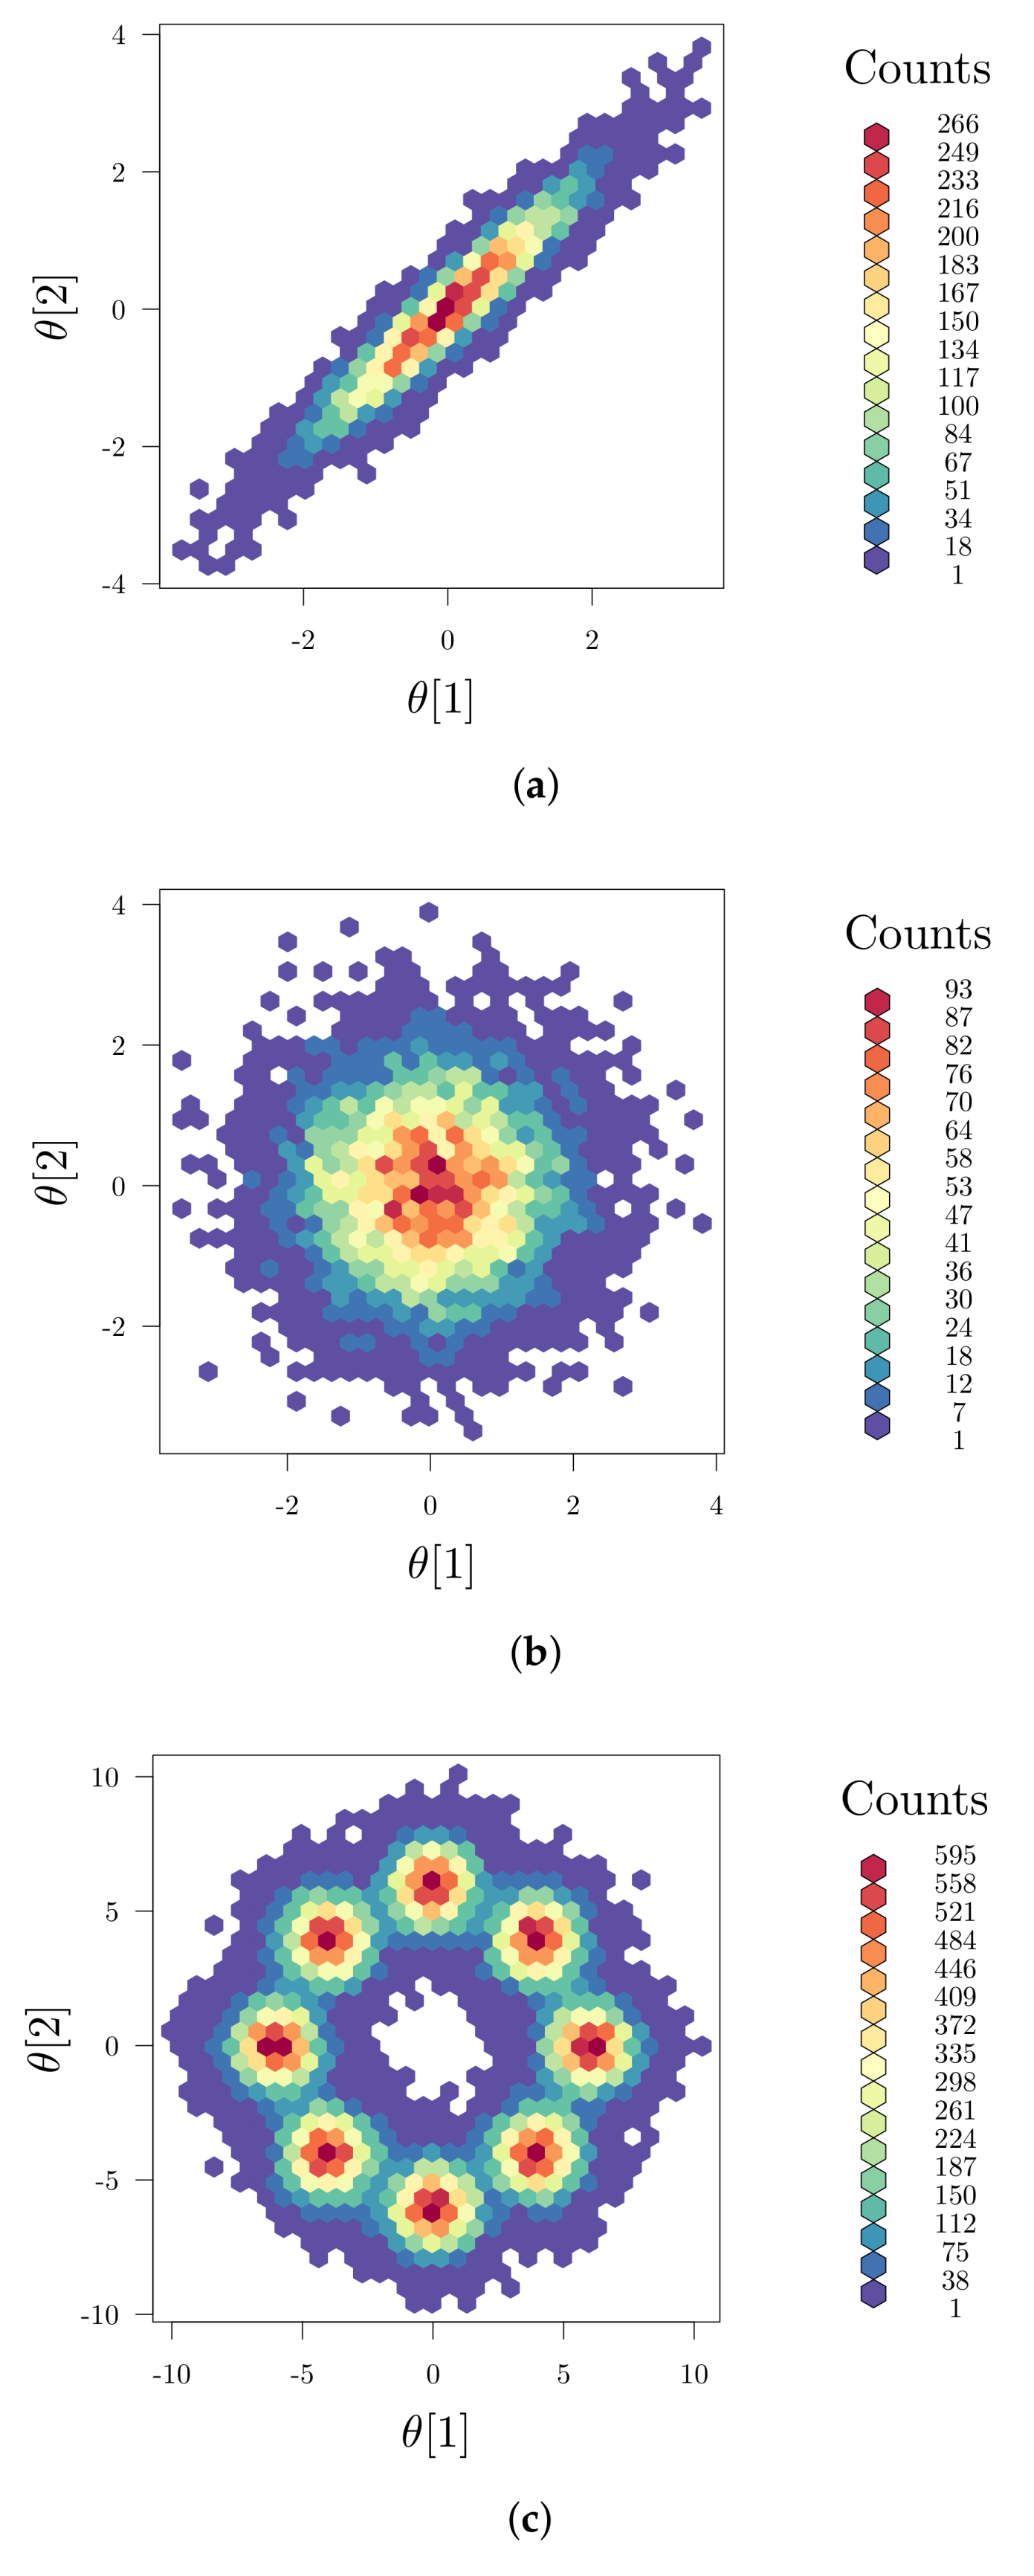
Figure 8d–f. The resulting parameter scatter plots based on the initial profile (
Figure 9a–c) show bimodal behavior indicating some severe nonlinearity and a non-convex optimization problem. For the classical
-design, the resulting parameter variations of all three parameters (
Figure 9d–f) could be only slightly improved while the parameter correlation for all parameter combinations is clearly visible. The multi-point averaging approach of the
-design, in turn, seems to be more appropriate. Applying a low initial substrate concentration (
Figure 8g) combined with an optimized impulse-like feeding rate (
Figure 8i), the quality of the parameter estimates can be improved as illustrated in
Figure 9g–i. In particular, the parameter correlations between
and
, and
and
are reduced. This effect can even be improved by implementing an MB-OED strategy based on GSA. A low initial substrate concentration (
Figure 8j) but a more complex feeding rate (
Figure 8l) results in more compact parameter scatter plots (
Figure 9j–l); i.e., fewer parameter uncertainties and parameter correlations. Finally, in the Shannon 1 study, we also analyze the performance of a Shannon-entropy-based (
Table 5) multi-objective design using
as a weighting vector for
Please note that the third element was set to zero as the sum of the first-order Sobol indices () was always greater or equal to 0.9; i.e., there is no strong multivariate dependency of the analyzed parameters.
Similar to the
-design, the derived initial substrate concentration is high; see
Figure 8m. For the feeding rate, there are two distinct feeding periods as illustrated in
Figure 8o. The resulting parameter estimates, which are summarized in
Figure 9m–o, show no significant improvement in the parameter estimates in comparison to the unoptimized initial experimental setting or the
-design. The main reason here is the tedious tuning of the multi-objective function, i.e., providing an optimal weighting vector
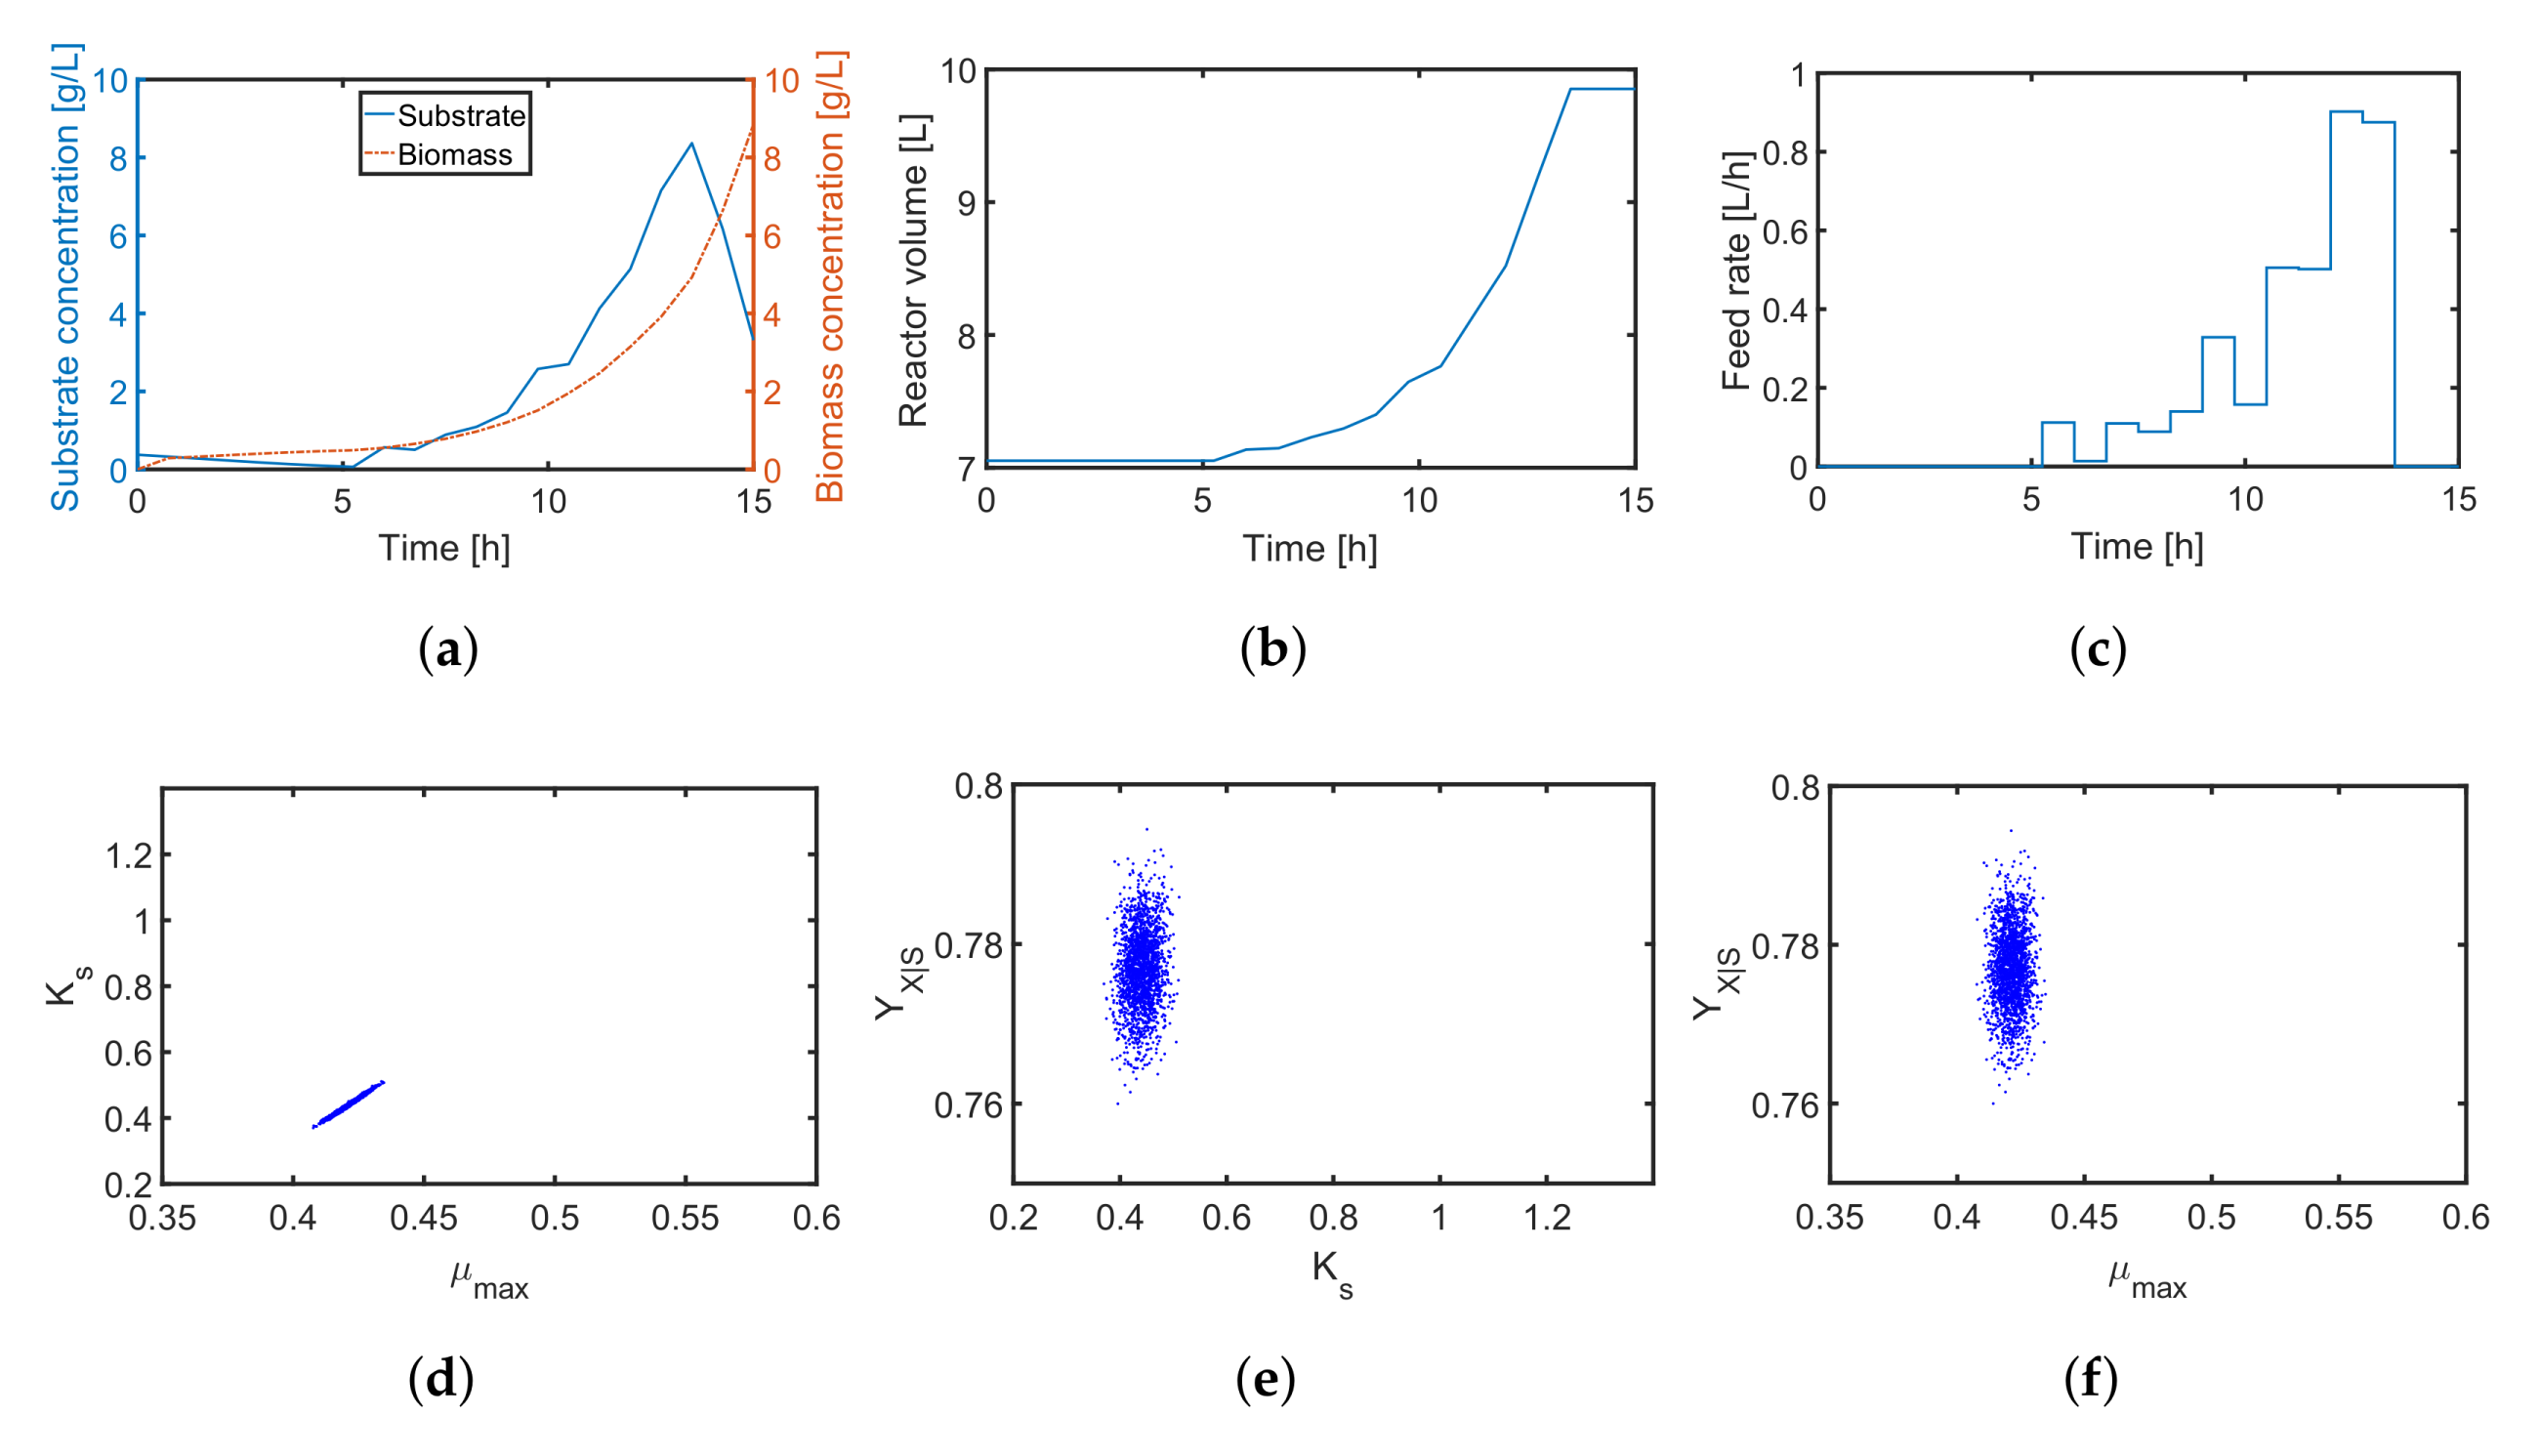
w. For instance, when using
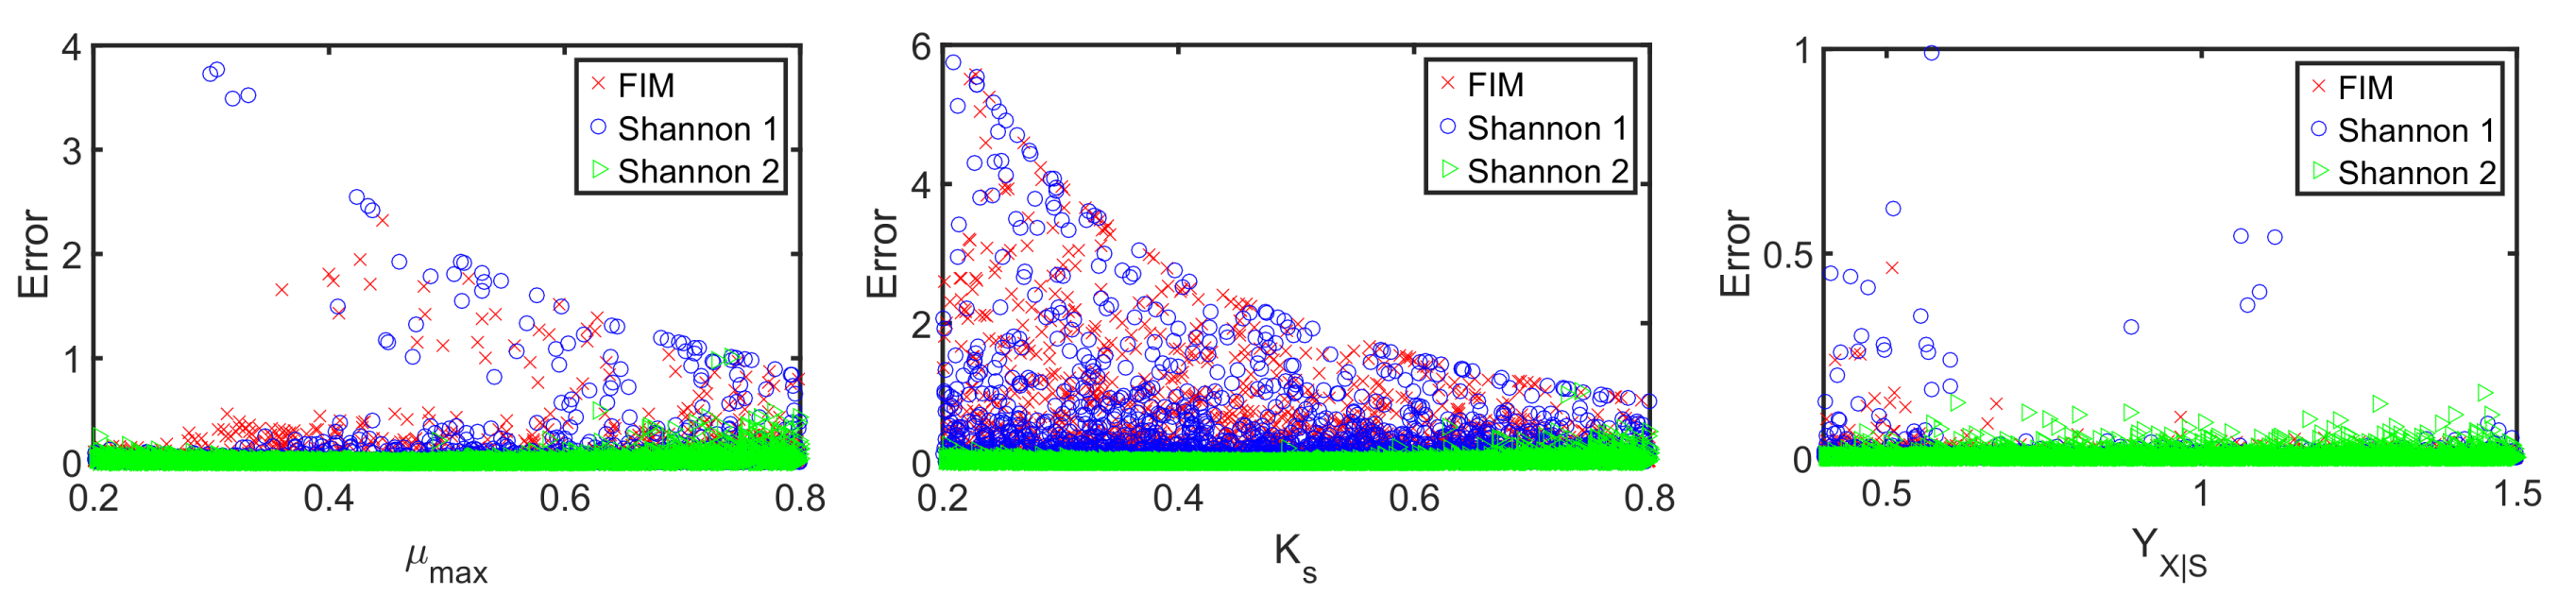
in the Shannon 2 study, the quality of the parameter estimates improves significantly as illustrated in
Figure 10. In comparison to the previous MB-OED results, the Shannon-entropy-based design in combination with a proper weight vector
w leads to improved parameter estimates, i.e., lower parameter variations and correlations as shown in
Figure 10d–f. A low initial substrate concentration (
Figure 10a) followed by a gradual increase in the feeding rate (
Figure 10c) provide very informative data and precise parameter estimates, respectively. This conclusion can be validated by analyzing
Figure 11. The relative parameter errors
clearly indicate the second Shannon-entropy-based design as the most suitable one for the parameter identification problem. Please note parameters
were sampled from their assumed uniform density functions.

 ,
, 
