Simultaneous Energy and Water Optimisation in Shale Exploration

 ,
,  ,
, 


Abstract
:
1. Introduction
- Low-level heating and the ability to operate with moderate temperature and pressure; this is a very crucial factor in shale exploration due to the availability of wasted energy from flaring which can be used as an energy source for MD.
- The ability to treat a highly concentrated feed, which is the case with water, generated from hydraulic fracturing.
- Compact size and modular nature: MD is characterised with a small footprint due to the high surface area to volume ratio of the membrane. It can also be easily adjusted to the required capacity by the removal or addition of MD modules, which allow for easy movement from one well pad to another. All of these factors make MD a candidate desalination technology in this study.
2. Problem Statement
- Number of freshwater sources (interruptible and uninterruptible);
- Set of well pads S to be fractured with a known volume of water required for fracturing and a maximum allowable contaminant concentration in the fracturing fluid;
- Total number of frac stages for each well pad;
- Earliest fracturing date for each well pad;
- Set of wastewater injection wells D;
- Volume of water required per stage;
- Minimum and maximum number of stages that can be fractured per day;
- Time horizon of interest;
- Network of regenerator;
- Gas storage facility;
- Historical stream data for the interruptible source,
- Optimal fracturing schedule of the well pads;
- Minimum freshwater intake and wastewater generation;
- Optimal operation and design conditions of the regenerator such as the number of membrane modules and the energy consumption;
- Feasibility of using captured flared gas as an energy source for the regenerator.
- The wells in each well pad are aggregated [4];
- Each well pad is connected to exactly one of the impoundment through piping [4];
- The number of fracturing stages that could be fractured per day is kept constant at 4 instead of allowing it to be variable between 2 and 4 stages [4];
- The flowback water from the fractured well pad is assumed to be 25% [10] of the initial water used;
- The capacity of the wastewater tank and fracturing tank on each well pad varies depending on its water requirement;
- The water treatment unit is located onsite and can be moved from one well pad to the other;
- The historical flowrate data for the interruptible water source from each calendar year is treated as a scenario, and each year is treated with equal probability [4].
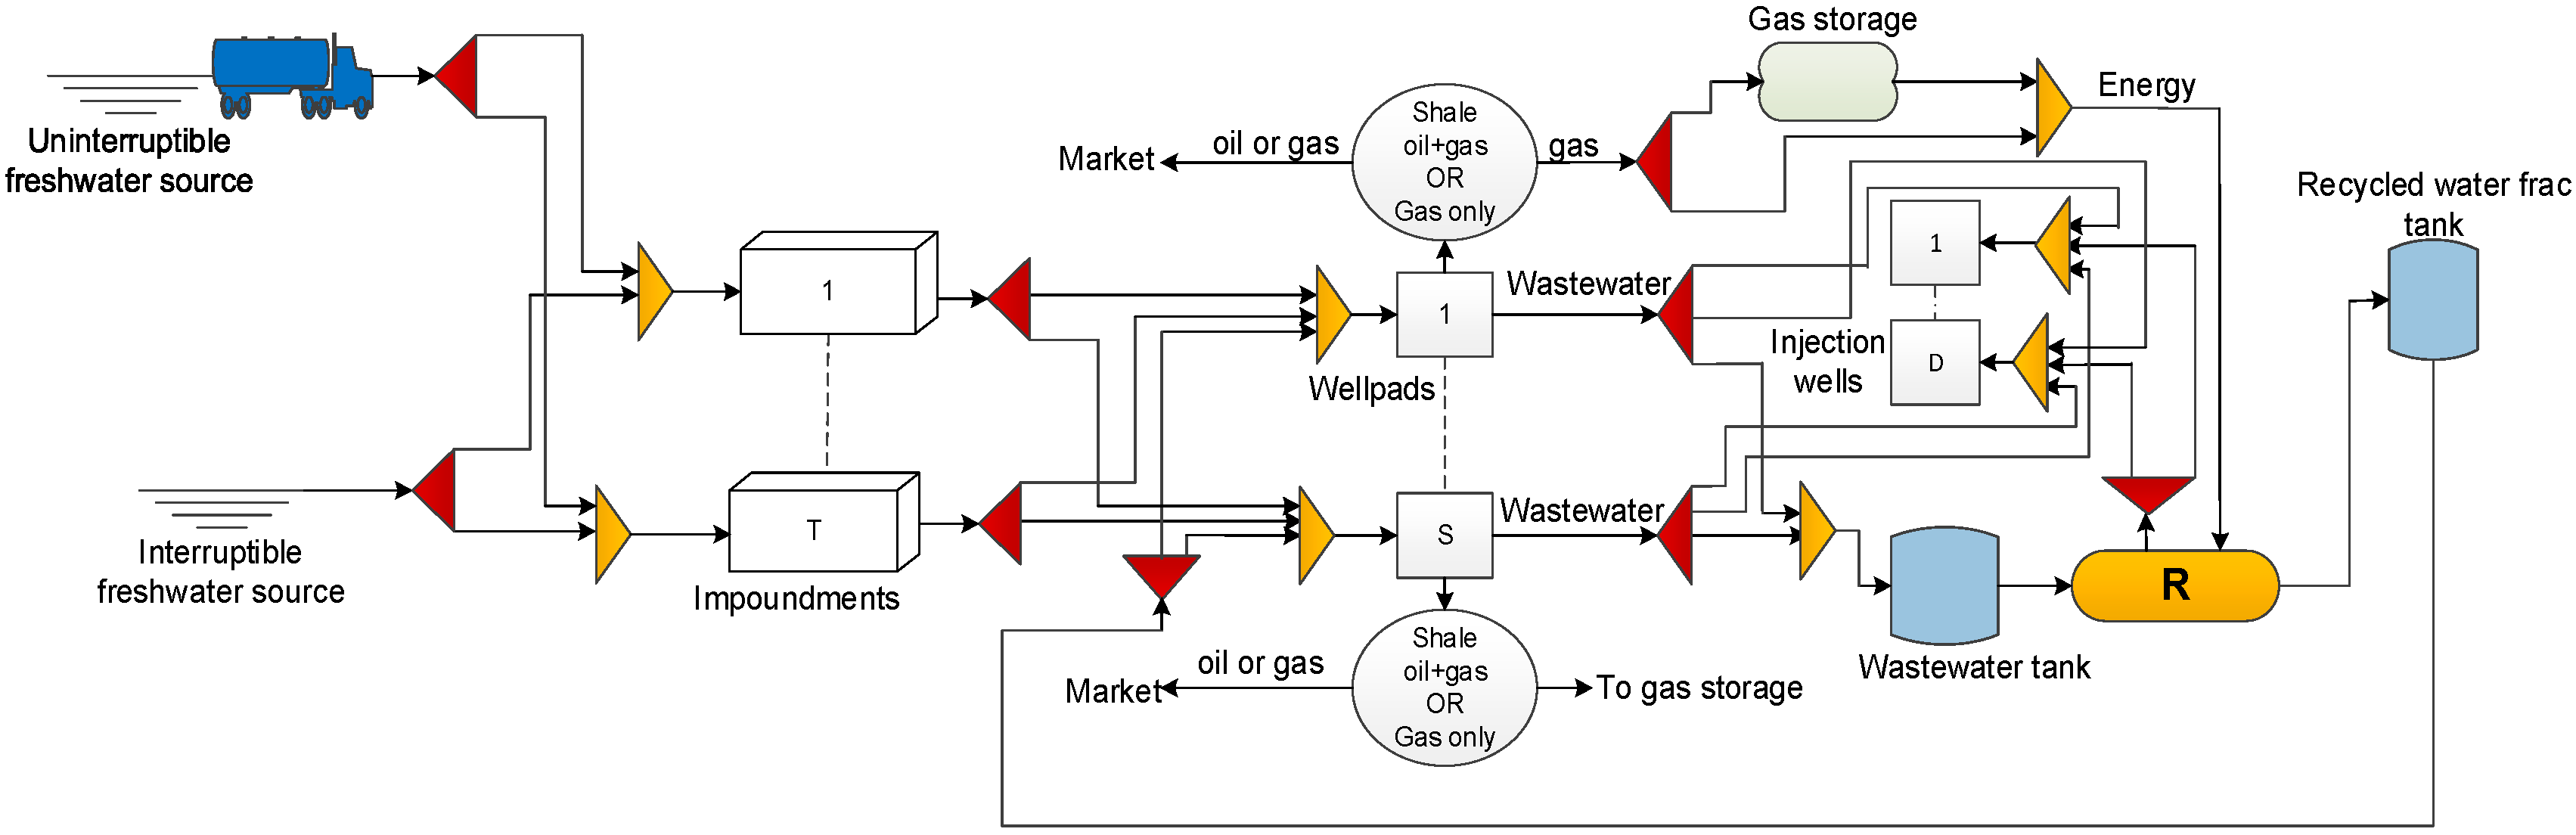
3. Superstructure Representation
- The transfer of water from the wastewater tank to the regenerator R is conducted provided that there is a well pad to be fractured. Whenever the regenerator starts operation, it operates continuously until the wastewater tank becomes empty.
- The regenerator only operates if there is a well pad to be fractured, otherwise it remains inactive.
- The performance of the regenerator is specified based on a variable removal ratio.
4. Model Formulation
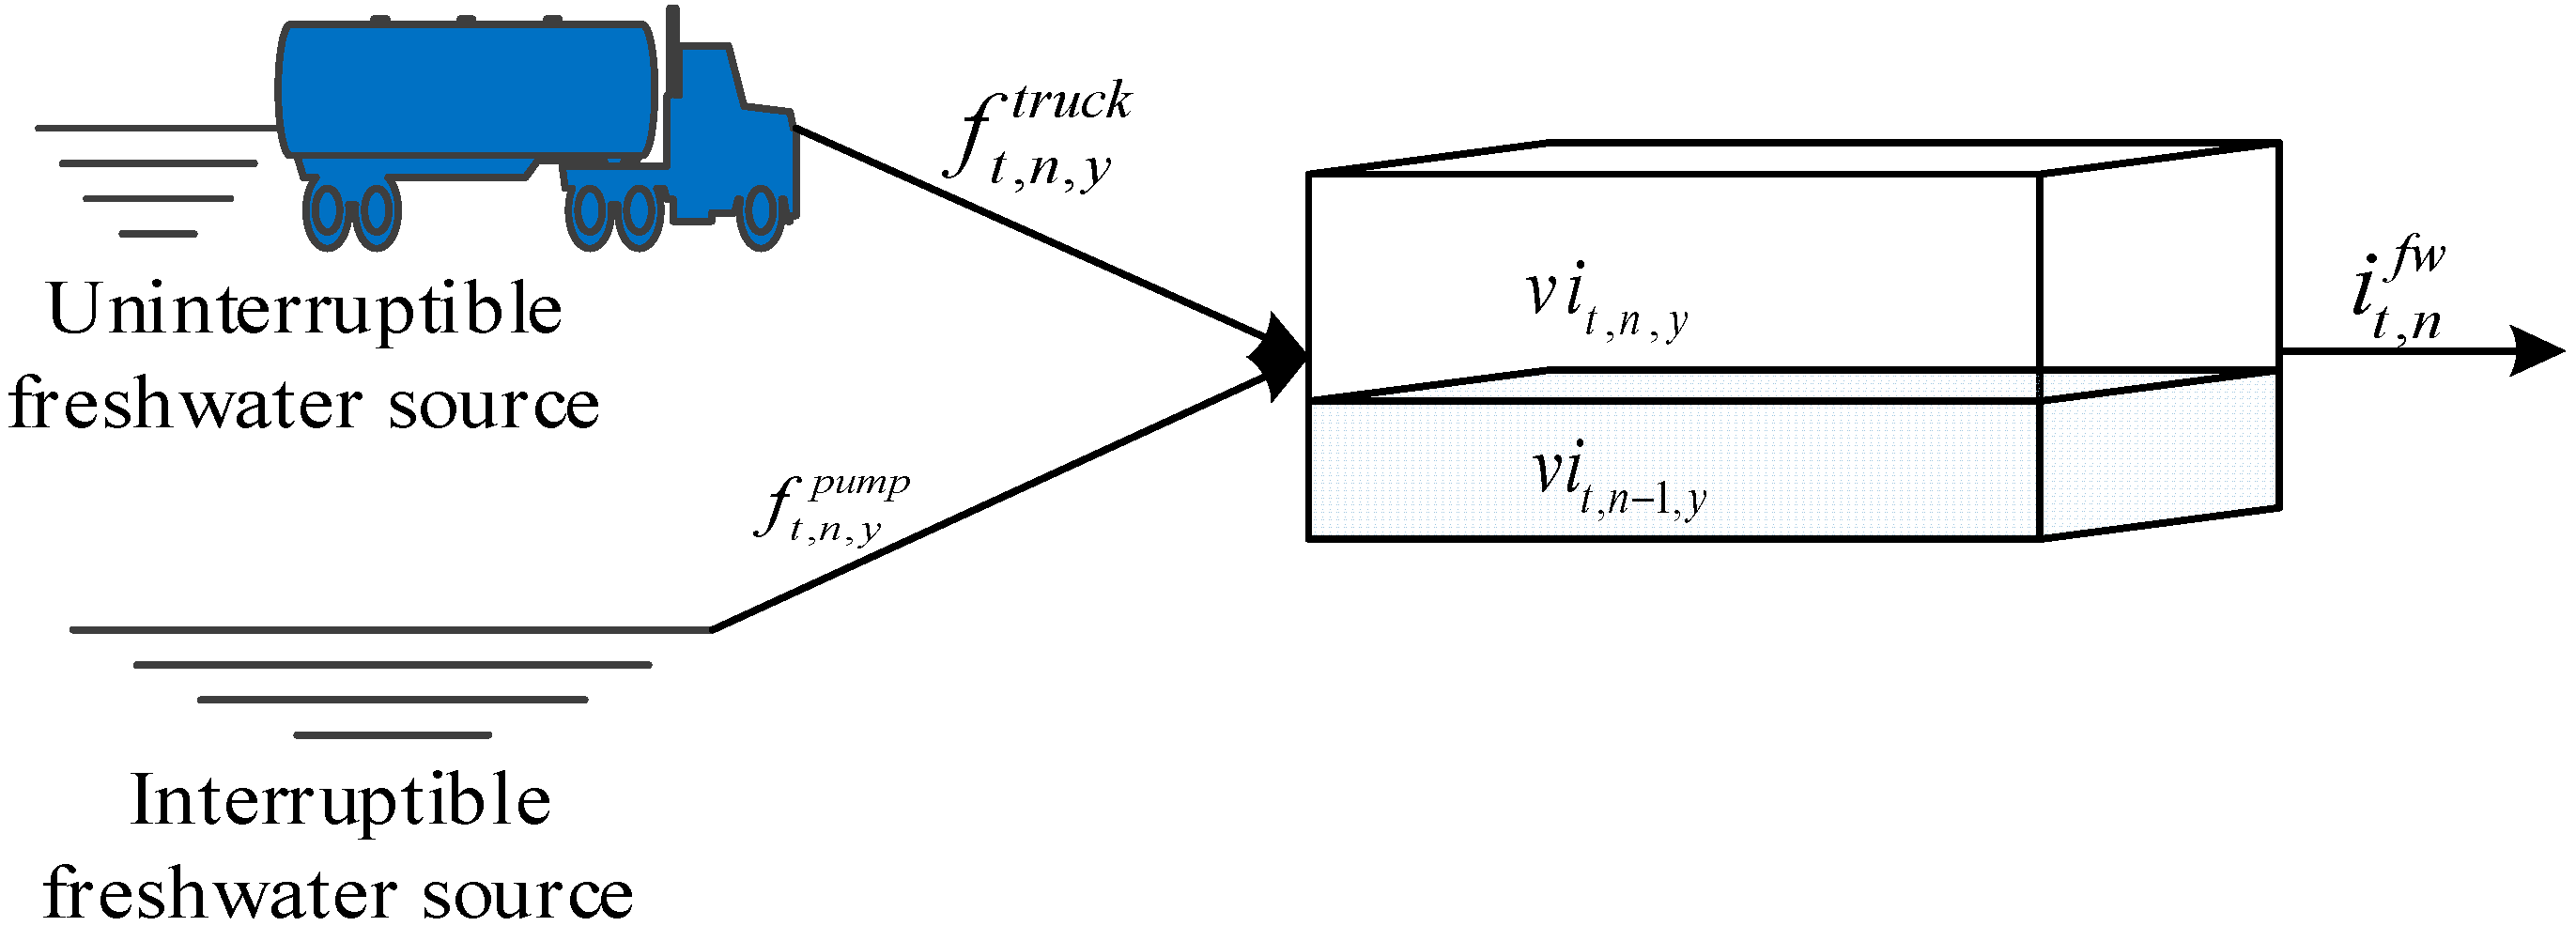
4.1. Mass Balance Constraint
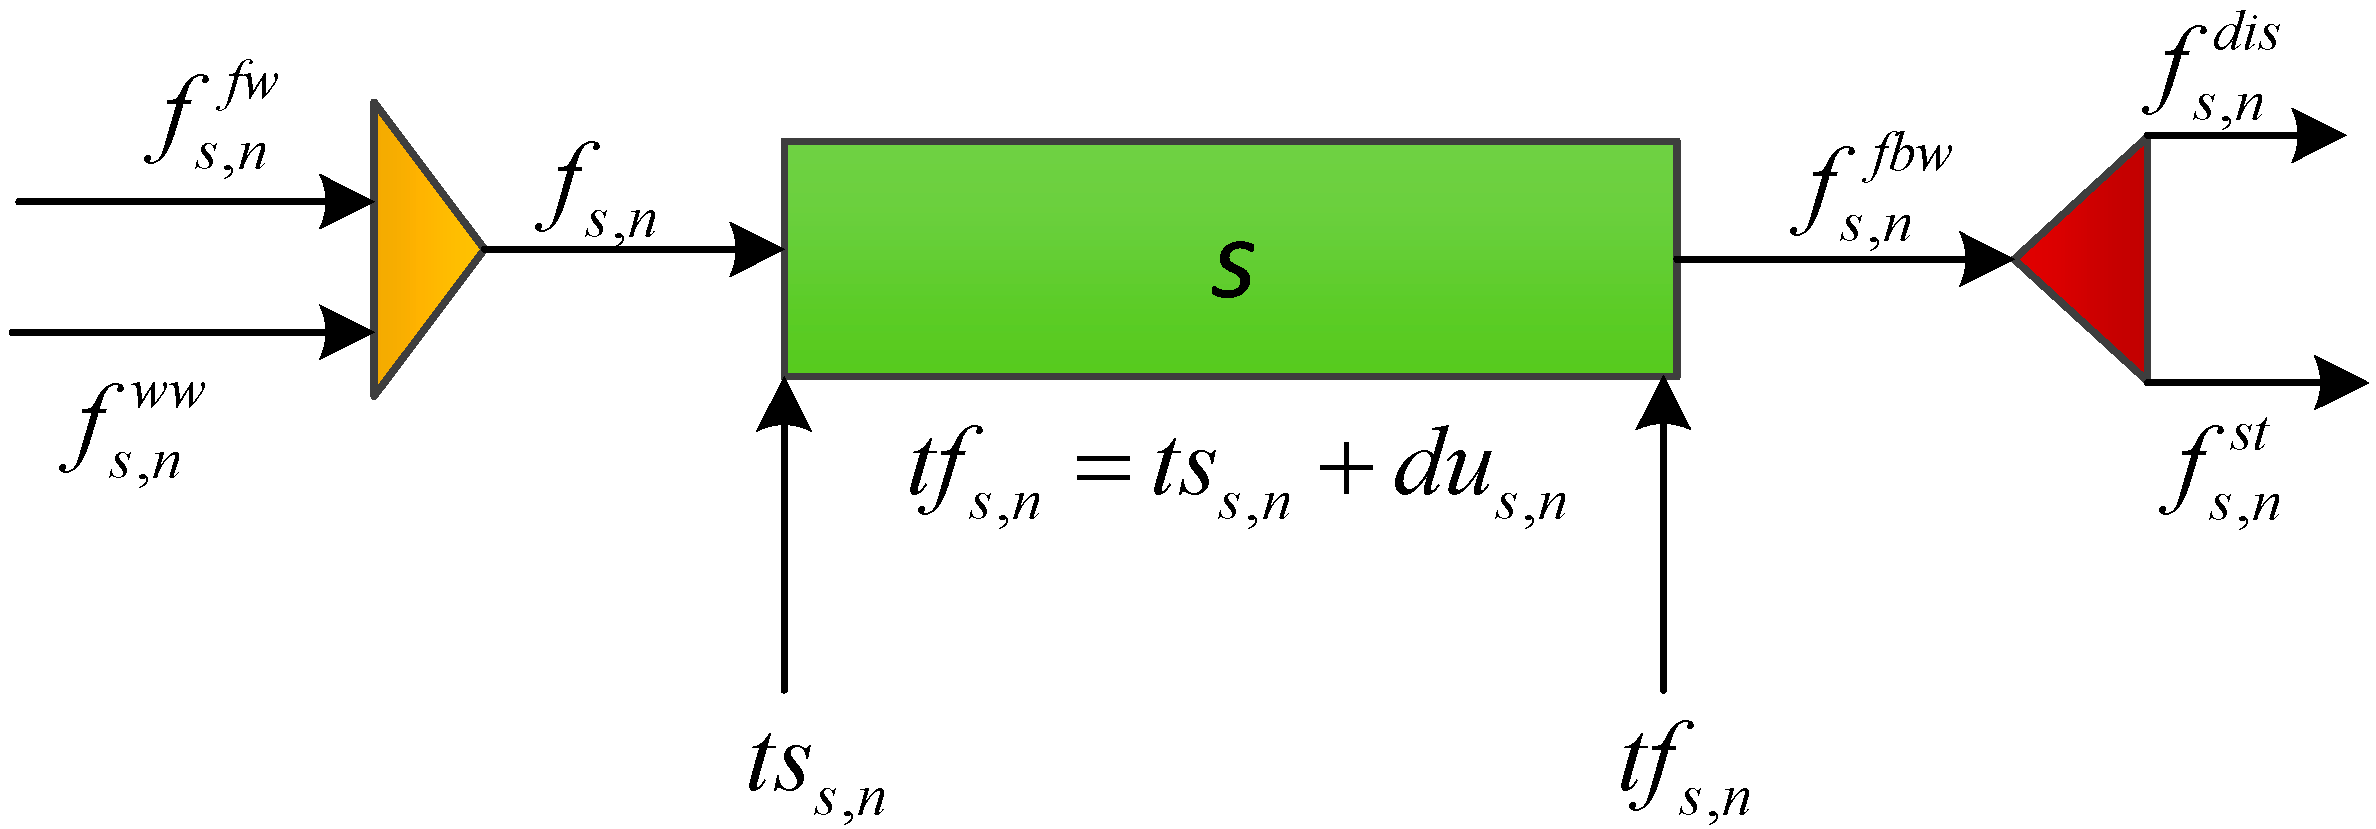
4.1.1. Mass Balance around Well Pad s
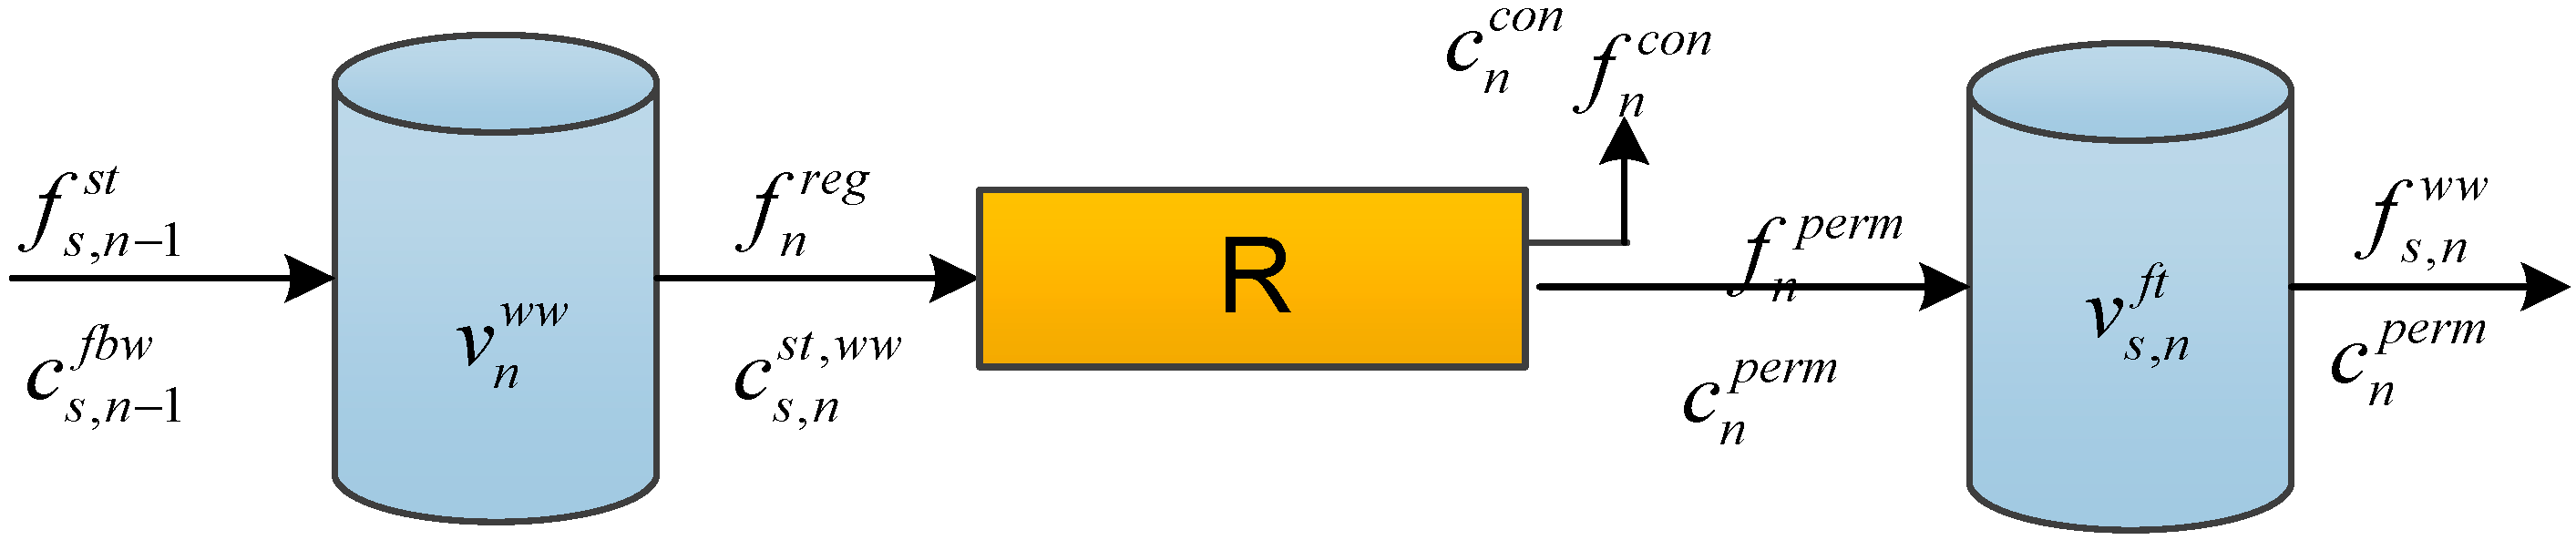
4.1.2. Mass Balance around the Wastewater Storage Tank and the Fracturing Tank
4.1.3. Mass Balance around the Regenerator
4.2. Scheduling Model
- well pad scheduling,
- wastewater storage tank scheduling, and
- regenerator scheduling.
4.2.1. Well Pad Scheduling
4.2.2. Storage Tank Scheduling
4.2.3. Regenerator Scheduling
4.2.4. Tightening Constraint
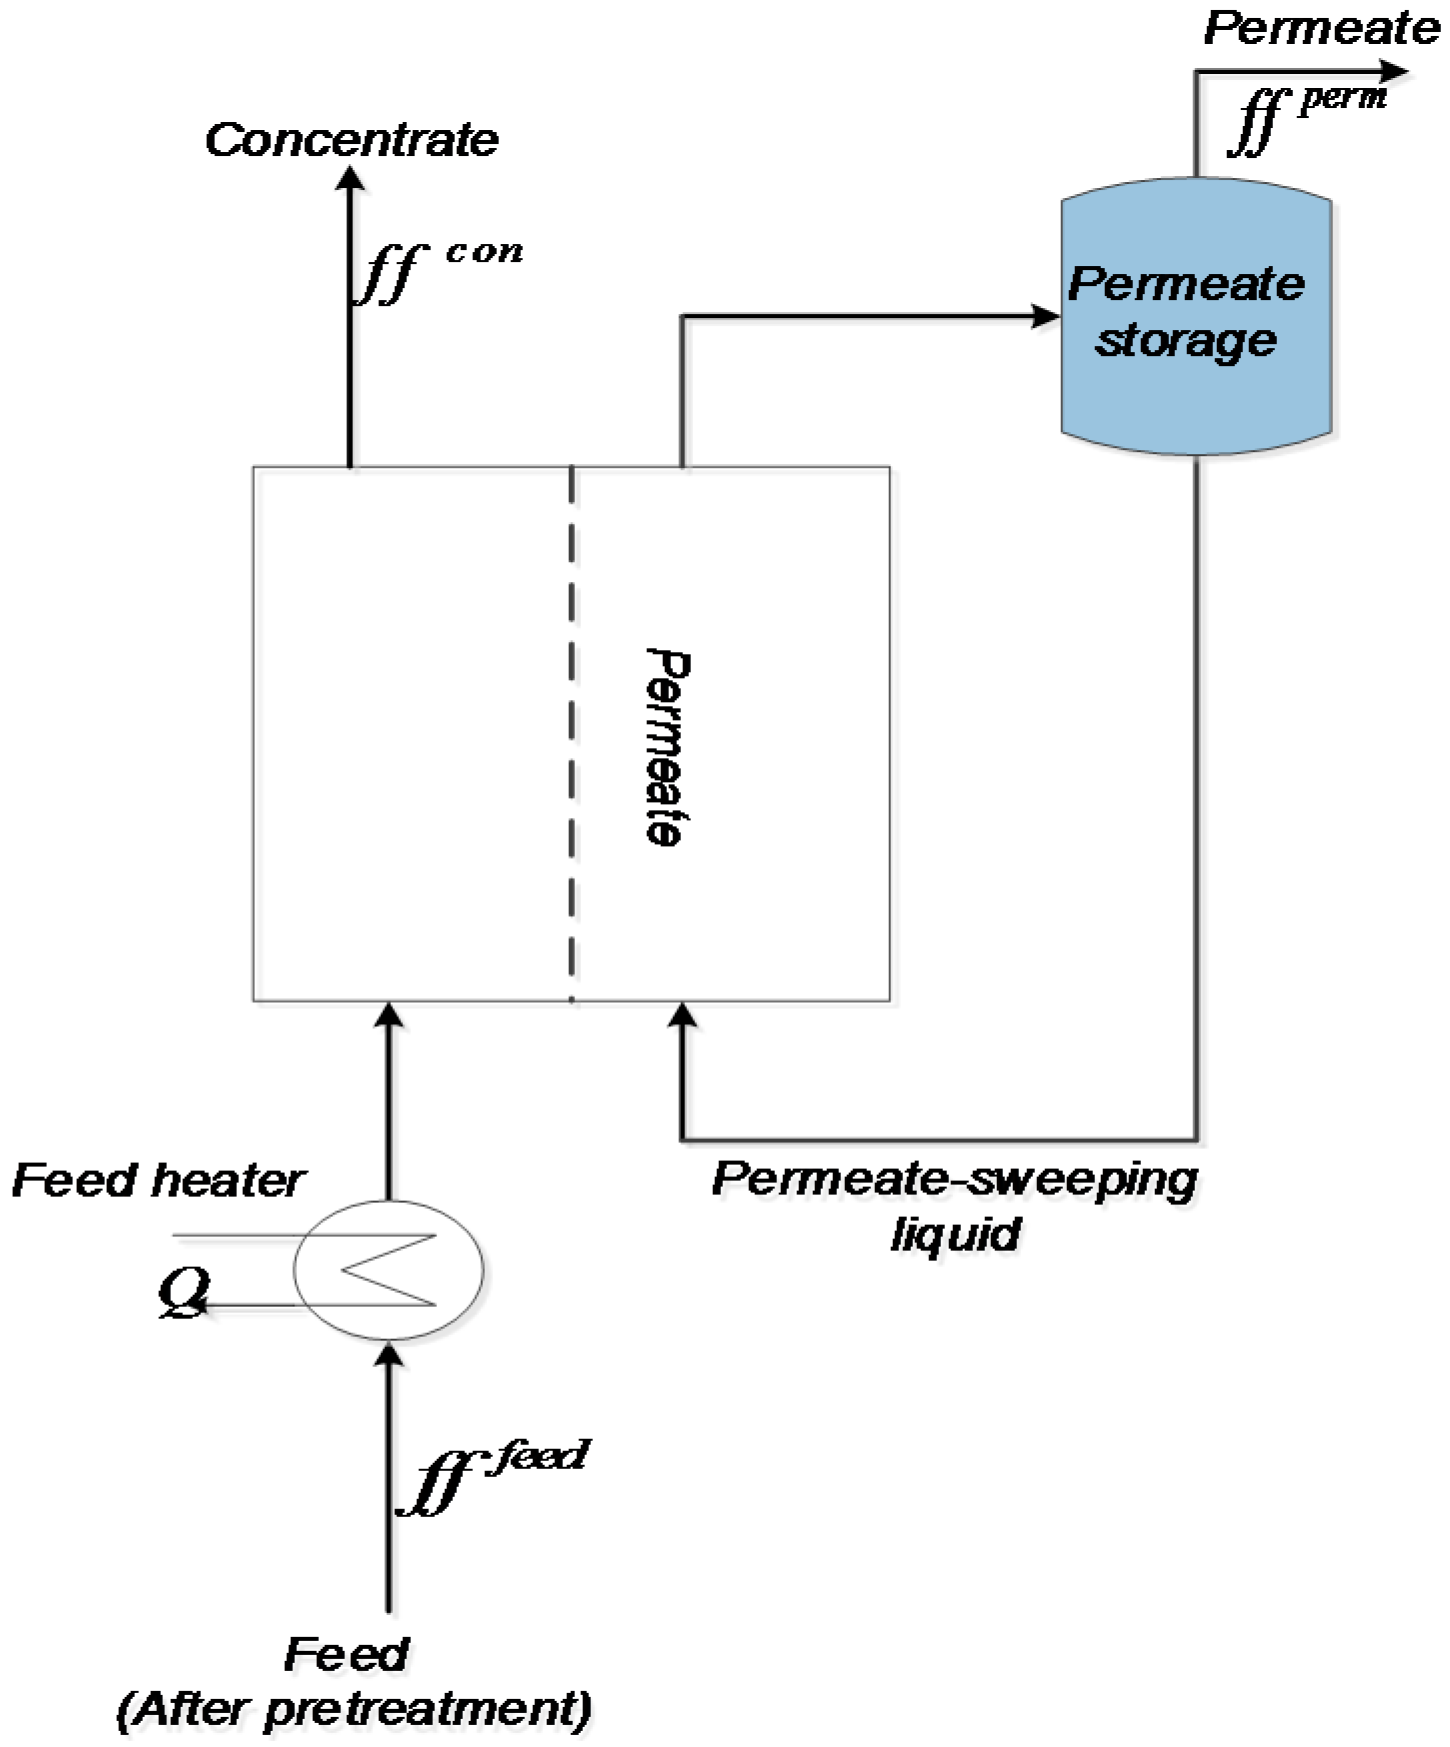
4.3. Membrane Distillation (MD) Model
4.4. Additional Constraints
4.5. Objective Function
- : Total area of membranes (m2), defined by Equation (65).
- : Water pumped from an interruptible source at time point n in scenario year y (m3), defined by Equation (8).
- : Water trucked from an uninterruptible source at time point n in scenario year y (m3), defined by Equation (8).
- : Freshwater required to fracture well pad s at time point n (m3), defined by Equation (2).
- : Wastewater required to fracture well pad s at time point n (m3), defined by Equation (2).
- : Total flowback water to be treated at time point n (m3), defined by Equations (15).
- : Total flowrate into MD (m3/day), defined by Equation (43).
- : Total freshwater required from impoundment t for fracturing at time point n (m3), defined by Equation (7).
- : Water flux across the membrane (kg/(m2·s)), defined by Equation (46).
- : Water vapour pressure of the feed in MD (pa), defined by Equation (47).
- : Water vapour pressure of the permeate in MD (pa), defined by Equation (48).
- : Heat required by the feed into MD (kJ/day), defined by Equation (55).
- : Regenerator removal ratio, defined by Equation (64).
- : Temperature of the feed on the membrane (K), defined by Equation (60).
- : Temperature of the permeate on the membrane (K), defined by Equation (60).
- : Membrane average temperature (K), defined by Equation (51).
- : Temperature of the feed in the bulk (K), defined by Equation (55).
- : Temperature of permeate in the bulk (K), defined by Equation (51).
- : Volume of impoundment t at time point n in scenario year y (m3), defined by Equation (8).
- : Activity coefficient of water in the feed for membrane distillation, defined by Equation (49).
5. Case Study
6. Conclusions and Recommendations for Future Work
Author Contributions
Funding
Conflicts of Interest
Nomenclature
| Sets | |
| {d | d = injection well} | |
| {n | n = time point} | |
| {s | s = well pad} | |
| {t | t = an interruptible source and its corresponding impoundment} | |
| Match between well pad s and source t | |
| {y | y = historical river flowrate data year} | |
| Parameters | |
| Availability time of well pad s, day | |
| Annual operating time, h | |
| Temperature independent base value for the permeability, kg/m2.s.pa.K1.334 | |
| Specific heat capacity of the feed stream, KJ/(kg K) | |
| Maximum inlet concentration in the treatment unit, mg/L t | |
| Concentration of the feed water in MD, mg/L | |
| Maximum inlet concentration in well pad s, mg/L | |
| Flowback water concentration in well pad s, mg/L | |
| Crew transition time between well pads, day | |
| Maximum capacity of injection well d, m3 | |
| Distance from well pad s to a treatment facility, km | |
| Time horizon of interest, day | |
| Liquid recovery for the regenerator | |
| Number of historical year, year | |
| Freshwater pumping cost, $/m3 | |
| Freshwater trucking cost, $/m3 | |
| Wastewater pumping cost, $/m3/km | |
| Cost of wastewater disposal, $/m3 | |
| Cost of wastewater storage, $/m3 | |
| Cost of heating, $/(109 J) | |
| Gas production of well pad s, m3 | |
| Unit price of natural gas, $/m3 | |
| Availability date of well pad s, day | |
| Time required fracturing well pad s, day | |
| Temperature of feed water in the treatment unit, K | |
| Ratio of recycled reject to raw feed | |
| Maximum capacity of storage, m3 | |
| Minimum capacity of storage, m3 | |
| Amount of water required to fracture well pad s, m3 | |
| Molar concentration of NaCl in the feed | |
| Membrane thickness, mm | |
| Energy density, kJ/ m3 | |
| Density of water, kg/ m3 | |
| Binary variables | |
| Defines the beginning of stimulating each well pad s at time point n | |
| Transfer of water from well pad to storage at time point n | |
| Transfer of water from storage to the regenerator at time point n | |
| Continuous variables | |
| Required membrane area, m2 | |
| Annualised fixed capital cost for the regenerator, $/year | |
| Annualised heating cost for the regenerator, $/year | |
| Annualised operating cost for the regenerator, $/year | |
| Membrane permeability, kg/(m2 pa) | |
| Flowback water concentration of well pad s at time point n, mg/L | |
| Contaminant concentration in the treatment unit at time point n, mg/L | |
| Outlet concentration of contaminant from the regenerator at time point n, mg/L | |
| Contaminant concentration removed from the water by the regenerator at time point n, mg/L | |
| Permeate concentration from MD, mg/L | |
| Retentate concentration from MD, mg/L | |
| Duration of well pad s at time point n, day | |
| Thermal energy consumption per unit of water treated, kJ/m3 | |
| Thermal energy required at time point n, kJ | |
| Total water required to fracture well pad s at time point n, m3 | |
| Water pumped from interruptible source at time point n in scenario year y, m3 | |
| Water trucked from uninterruptible source at time point n in scenario year y, m3 | |
| Freshwater required to fracture well pad s at time point n, m3 | |
| Wastewater required to fracture well pad s at time point n, m3 | |
| Flowback water from well pad s at time point n, m3 | |
| Flowback water sent to storage tank from well pad s at time point n, m3 | |
| Flowback water sent to disposal from well pad s at time point n, m3 | |
| Total flowback water to be treated at time point n, m3 | |
| Amount of water collected as permeate from the regenerator at time point n, m3 | |
| Amount of retentate from the regenerator at time point n, m3 | |
| Total water sent to disposal at time point n, m3 | |
| Throughput of an injection well d at time point n, m3 | |
| Total flowrate into MD, m3/day | |
| Total flowrate into MD, kg/day | |
| Permeate flowrate from MD, kg/day | |
| Retentate flowrate from MD, kg/day | |
| Total freshwater required from impoundment t for fracturing at time point n, m3 | |
| Water flux across the membrane, kg/(m2·s) | |
| Membrane thermal conductivity, kW/(m·K) | |
| Expected gas production of well pad s at time point n, m3 | |
| Water vapour pressure of the feed in MD, pa | |
| Water vapour pressure of the permeate in MD, pa | |
| Heat required by the feed into MD, kJ/day | |
| Regenerator removal ratio | |
| Start time of well pad s at time point n, day | |
| Finish time of well pad s at time point n, day | |
| Time that corresponds to time point n, day | |
| Start time of regeneration at time point n, day | |
| Duration of regeneration at time point n, day | |
| Time at which water is transferred from well pad s to storage tank at time point n, day | |
| Temperature of the feed on the membrane, K | |
| Temperature of the permeate on the membrane, K | |
| Membrane average temperature, K | |
| Temperature of the feed in the bulk, K | |
| Temperature of permeate in the bulk, K | |
| Volume of impoundment t at time point n in scenario year y, m3 | |
| Capacity of wastewater tank at time point n, m3 | |
| Capacity of fracturing tank on well pad s at time point n, m3 | |
| Volume of natural gas needed to produce the required energy at time point n, m3 | |
| Mole fraction of water in the feed | |
| Activity coefficient of water in the feed for membrane distillation | |
| Overall thermal efficiency of the regenerator | |
| Latent heat of vaporisation for water, kJ/kg | |
| Temperature polarisation coefficient | |
| Superscript | |
| con | Concentrate |
| cons | Consumption |
| dis | Disposal |
| feed | Feed |
| ft | Fracturing tank |
| fw | Freshwater |
| fbw | Flowback water |
| gas | Gas |
| ht | Heating |
| max | Maximum |
| min | Minimum |
| nat | Natural gas |
| pump | Pumping |
| perm | Permeate |
| reg | Regenerator |
| st | Storage |
| total | Total |
| truck | Trucking |
| vap | Vapour |
| ww | Wastewater |
| Subscript | |
| bp | Permeate bulk |
| bf | Feed bulk |
| m | Membrane |
| mp | Membrane permeate |
| mf | Membrane feed |
| wf | Feed water |
| wp | Permeate water |
References
- Al-Douri, A.; Sengupta, D.; El-Halwagi, M.M. Shale Gas Monetization—A review of downstream processing of chemical and fuels. J. Nat. Gas. Eng. 2017, 45, 436–455. [Google Scholar] [CrossRef]
- Zhang, C.; El-Halwagi, M.M. Estimate the capital cost of shale-gas monetization projects. Chem. Eng. Prog. 2017, 113, 28–32. [Google Scholar]
- Arthur, J.D.; Bohm, B.; Layne, M. Hydraulic fracturing considerations for natural gas wells of the Marcellus Shale. In Proceedings of the Ground Water Protection Council 2008 Annual Forum, Cincinnati, OH, USA, 21–24 September 2008; pp. 1–16. [Google Scholar]
- Yang, L.; Grossmann, I.E.; Manno, J. Optimization models for shale gas water management. AIChE J. 2014, 60, 3490–3501. [Google Scholar] [CrossRef] [Green Version]
- Vengosh, A. How Much Water Does U.S. Fracking Really Use? 2015. Available online: https://today.duke.edu/2015/09/frackfoot (accessed on 25 May 2018).
- Hasaneen, R.; El-Halwagi, M.M. Integrated process and microeconomic analyses to enable effective environmental policy for shale gas in the United States. Clean Technol. Environ. Policy 2017, 19, 1775–1789. [Google Scholar] [CrossRef]
- Petrakis, S. Reduce cooling water consumption: New closed loop cooling method improves process cooling tower operations. Hydrocarb. Process. 2008, 87, 95–98. [Google Scholar]
- Elsayed, N.A.; Barrufet, M.A.; Eljack, F.T.; El-Halwagi, M.M. Optimal design of thermal membrane distillation systems for the treatment of shale gas flowback water. Int. J. Membr. Sci. 2015, 2, 1–9. [Google Scholar]
- Elsayed, N.A.; Barrufet, M.A.; El-Halwagi, M.M. Integration of thermal membrane distillation networks with processing facilities. Ind. Eng. Chem. Res. 2013, 53, 5284–5298. [Google Scholar] [CrossRef]
- Yang, L.; Grossmann, I.E.; Mauter, M.S.; Dilmore, R.M. Investment optimization model for freshwater acquisition and wastewater handling in shale gas production. AIChE J. 2015, 61, 1770–1782. [Google Scholar] [CrossRef]
- Gao, J.; You, F. Optimal design and operations of supply chain networks for water management in shale gas production: MILFP model and algorithm for the water-enegy nexus. AIChE J. 2015, 61, 1184–1208. [Google Scholar] [CrossRef]
- Gao, J.; You, F. Deciphering and handling uncertainty in shale gas supply chain design and optimization: Novel modelling framework and computational efficient solution algorithm. AIChE J. 2015, 61, 3739–3760. [Google Scholar] [CrossRef]
- Bartholomew, T.V.; Mauter, M.S. Multiobjective optimization model for minimizing cost and environmental impact in shale gas water and wastewater management. ACS Sustain. Chem. Eng. 2016, 4, 3728–3735. [Google Scholar] [CrossRef]
- Lira-Barragán, L.; Ponce-Ortega, J.M.; Guillén-Gosálbez, G.; El-Halwagi, M.M. Optimal Water Management under Uncertainty for Shale Gas Production. Ind. Eng. Chem. Res. 2016, 55, 1322–1335. [Google Scholar] [CrossRef]
- Yang, L.; Salcedo-Diaz, R.; Grossmann, I.E. Water network optimization with wastewater regeneration models. Ind. Eng. Chem. Res. 2014, 53, 17680–17695. [Google Scholar] [CrossRef] [Green Version]
- Kamrava, S.; Gabriel, K.J.; El-Halwagi, M.M.; Eljack, F.T. Managing abnormal operation through process integration and cogeneration systems. Clean Techn. Environ. Policy 2015, 17, 119–128. [Google Scholar] [CrossRef]
- Kazi, M.K.; Eljack, F.; Elsayed, N.A.; El-Halwagi, M.M. Integration of energy and wastewater treatment alternatives with process facilities to manage industrial flares during normal and abnormal operations: A multi-objective extendible optimization framework. Ind. Eng. Chem. Res. 2016, 55, 2020–2034. [Google Scholar] [CrossRef]
- Glazer, Y.R.; Kjellsson, J.B.; Sanders, K.T.; Webber, M.E. Potential for using energy from flared gas for on-site hydraulic fracturing wastewater treatment in Texas. Environ. Sci. Technol. Lett. 2014, 1, 300–304. [Google Scholar] [CrossRef]
- Wikramanayake, E.; Bahadur, V. Flared natural gas-based onsite atmospheric water harvesting (AWH) for oilfield operations. Environ. Res. Lett. 2016, 11, 1748–9326. [Google Scholar] [CrossRef]
- Yun, Y.; Ma, R.; Zhang, W.; Fane, A.G.; Li, J. Direct contact membrane distillation mechanism for high concentration NaCl solutions. Desalination 2006, 188, 251–262. [Google Scholar] [CrossRef]
- Gregory, K.B.; Vidic, R.D.; Dzombak, D.A. Water management challenges associated with the production of shale gas by hydraulic fracturing. Elements 2011, 7, 181–186. [Google Scholar] [CrossRef]
- Lawson, K.W.; Lloyd, D.R. Membrane distillation: Review. J. Membr. Sci. 1997, 124, 9–25. [Google Scholar] [CrossRef]
- Camacho, L.M.; Dume´e, L.; Zhang, J.; Li, J.D.; Duke, M.; Gomez, J.; Gray, S. Advances in membrane distillation for water desalination and purification applications. Water 2013, 5, 94–196. [Google Scholar] [CrossRef]
- Estrada, J.M.; Bhamidimarri, R. A review of the issues and treatment options for wastewater from shale gas extraction by hydraulic fracturing. Fuel 2016, 182, 292–303. [Google Scholar] [CrossRef]
- Engle, M.A.; Rowan, E.L. Geochemical evolution of produced waters from hydraulic fracturing of the Marcellus Shale, northern Appalachian Basin: A multivariate compositional data analysis approach. Int. J. Coal Geol. 2014, 126, 45–56. [Google Scholar] [CrossRef]
- El-Halwagi, M.M. Sustainable Design through Process Integration: Fundamentals and Applications to Industrial Pollution Prevention, Resource Conservation, and Profitability Enhancement; Elsevier: Oxford, UK, 2012. [Google Scholar]
- Khayet, M.; Matsuura, T. Membrane Dstillation: Principles and Applications; Elsevier: Amsterdam, The Netherlands, 2011. [Google Scholar]
- Schofield, R.W.; Fane, A.G.; Fell, C.J.D. Heat and mass transfer in membrane distillation. J. Membr. Sci. 1987, 33, 299–313. [Google Scholar] [CrossRef]
- Al-Obaidani, S.; Curcio, E.; Macedonio, F.; Di Profio, G.; Al-Hinai, H.; Drioli, E. Potential of membrane distillation in seawater desalination: thermal efficiency, sensitivity study and cost estimation. J. Memb. Sci. 2008, 323, 85–98. [Google Scholar] [CrossRef]
- MINLPLib. Available online: http://www.minlplib.org (accessed on 19 June 2018).
- Nohra, C.J.; Sahinidis, N.V. Global optimization of nonconvex problems with convex-transformable intermediates. J. Glob. Optim. 2018, 1–22. [Google Scholar] [CrossRef]
- Tawarmalani, M.; Sahinidis, N.V. A polyhedral branch-and-cut approach to global optimization. Math. Program. 2005, 103, 225–249. [Google Scholar] [CrossRef]
- Suarez, F.; Urtubia, R. Tackling the water-energy nexus: an assessment of membrane distillation driven by salt-gradient solar ponds. Clean Technol. Environ. Policy 2016, 18, 1–16. [Google Scholar] [CrossRef]
- Al-Aboosi, F.Y.; El-Halwagi, M.M. An integrated approach to water-energy nexus in shale gas production. Processes 2018, 6, 52. [Google Scholar] [CrossRef]
- Baaqeel, H.; El-Halwagi, M.M. Optimal multi-scale capacity planning in seawater desalination systems. Processes 2018, 6, 68. [Google Scholar] [CrossRef]
- El-Halwagi, M.M. A return on investment metric for incorporating sustainability in process integration and improvement projects. Clean Technol. Environ. Policy 2017, 19, 611–617. [Google Scholar] [CrossRef]
- Guillen-Cuevas, K.; Ortiz-Espinoza, A.P.; Ozinan, E.; Jiménez-Gutiérrez, A.; Kazantzis, N.K.; El-Halwagi, M.M. Incorporation of safety and sustainability in conceptual design via a return on investment metric. ACS Sustain. Chem. Eng. 2018, 6, 1411–1416. [Google Scholar] [CrossRef]


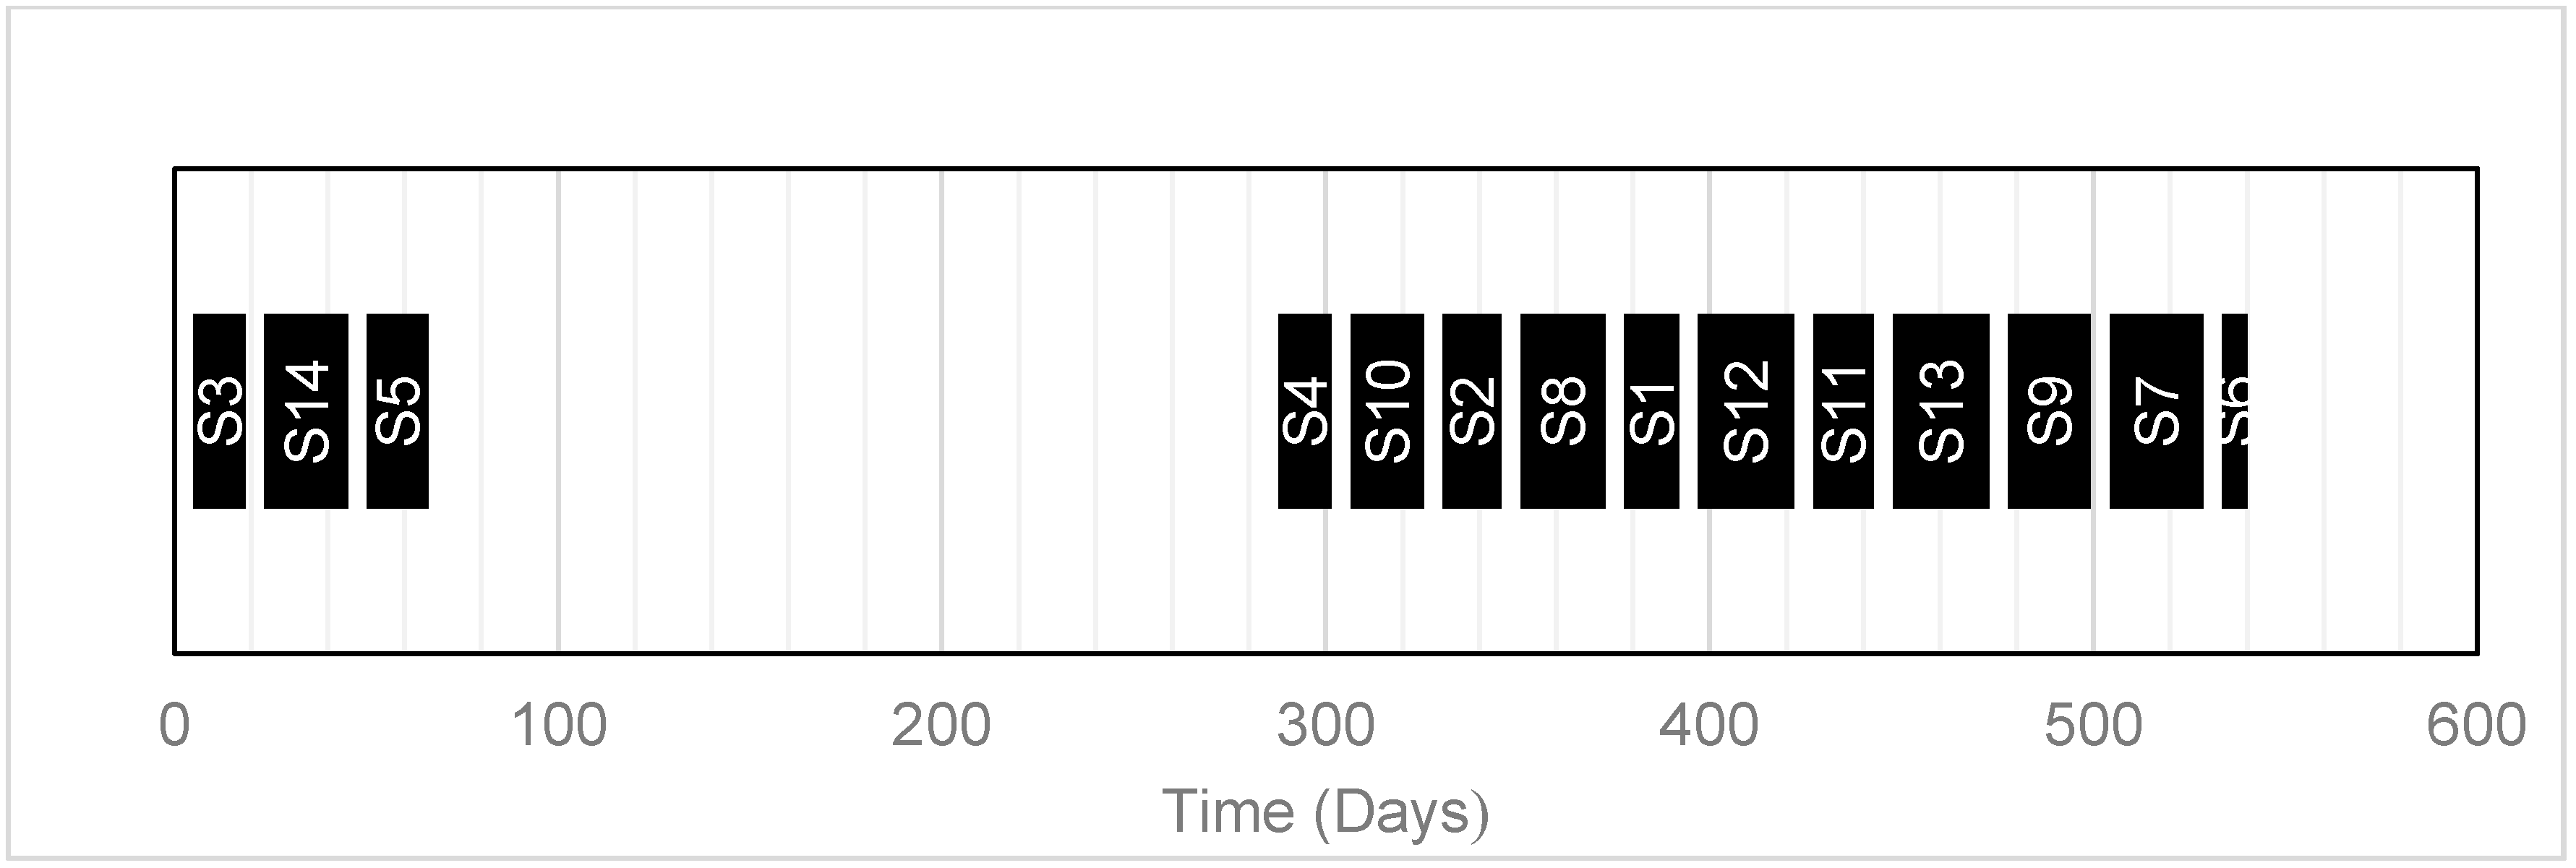
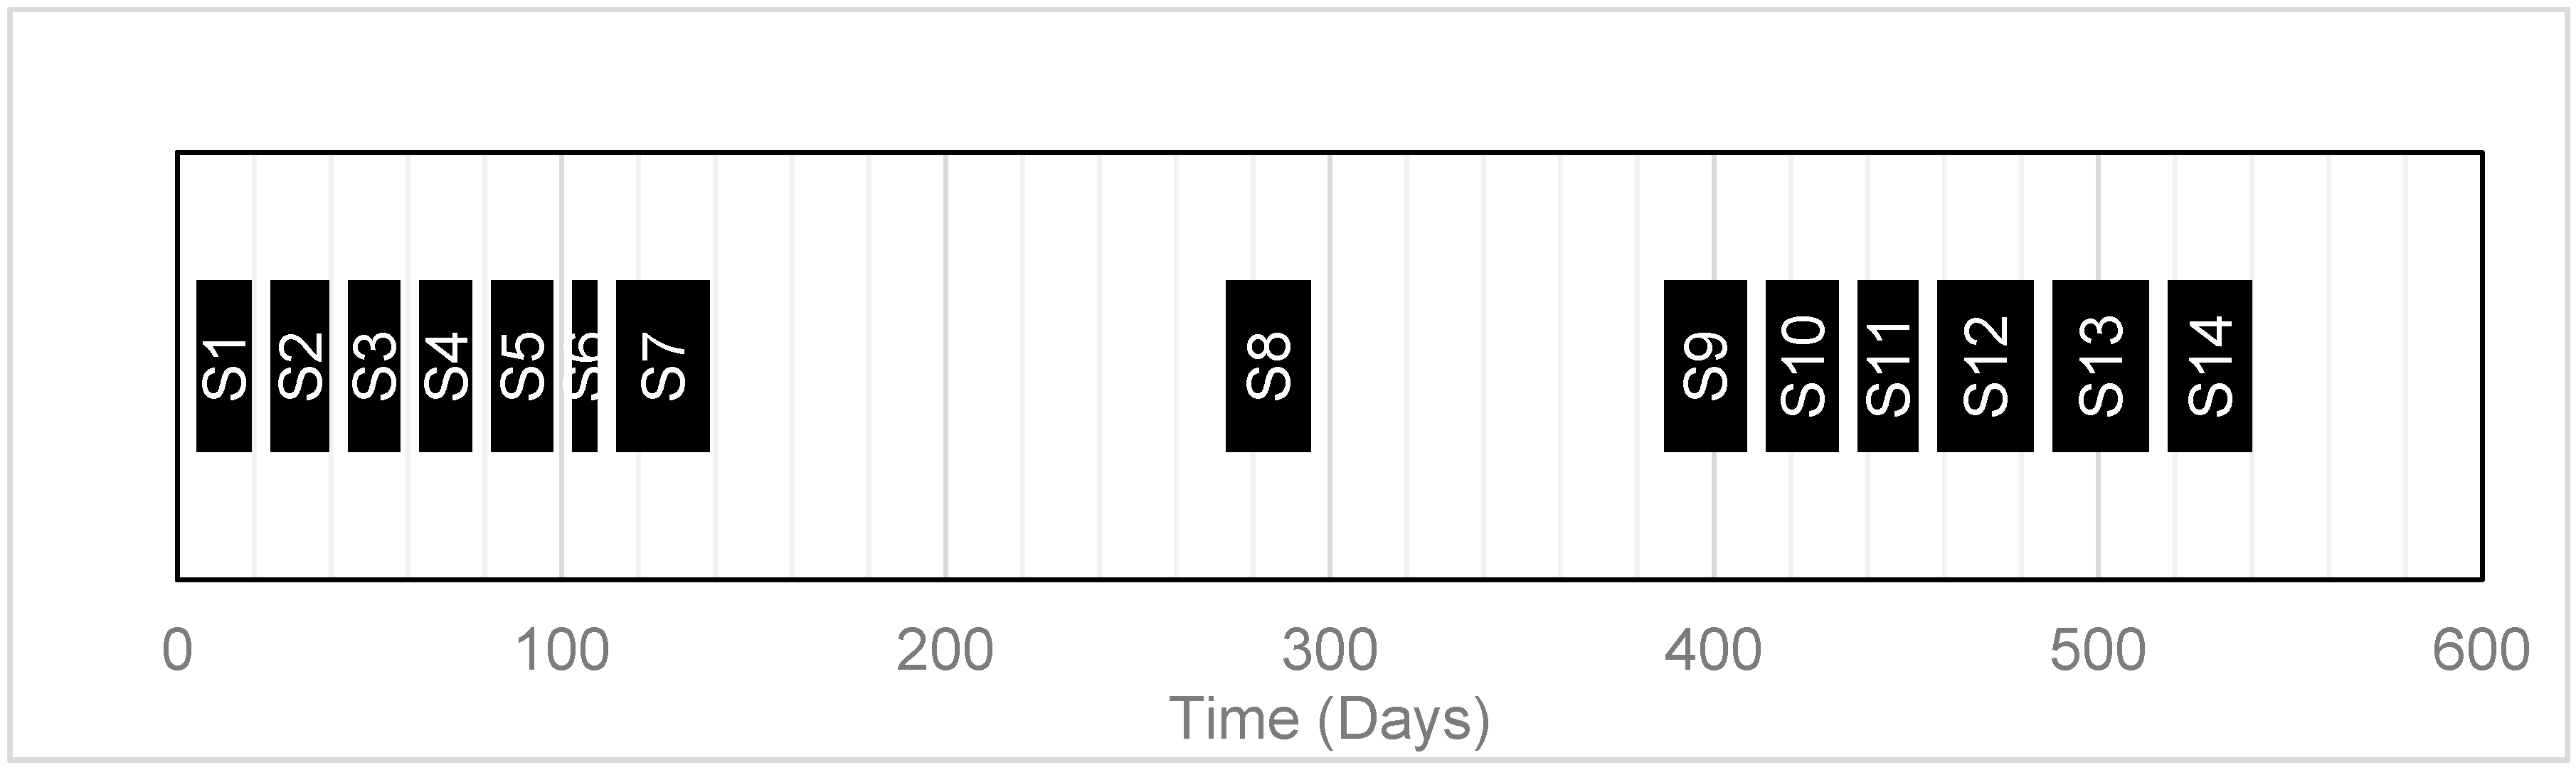
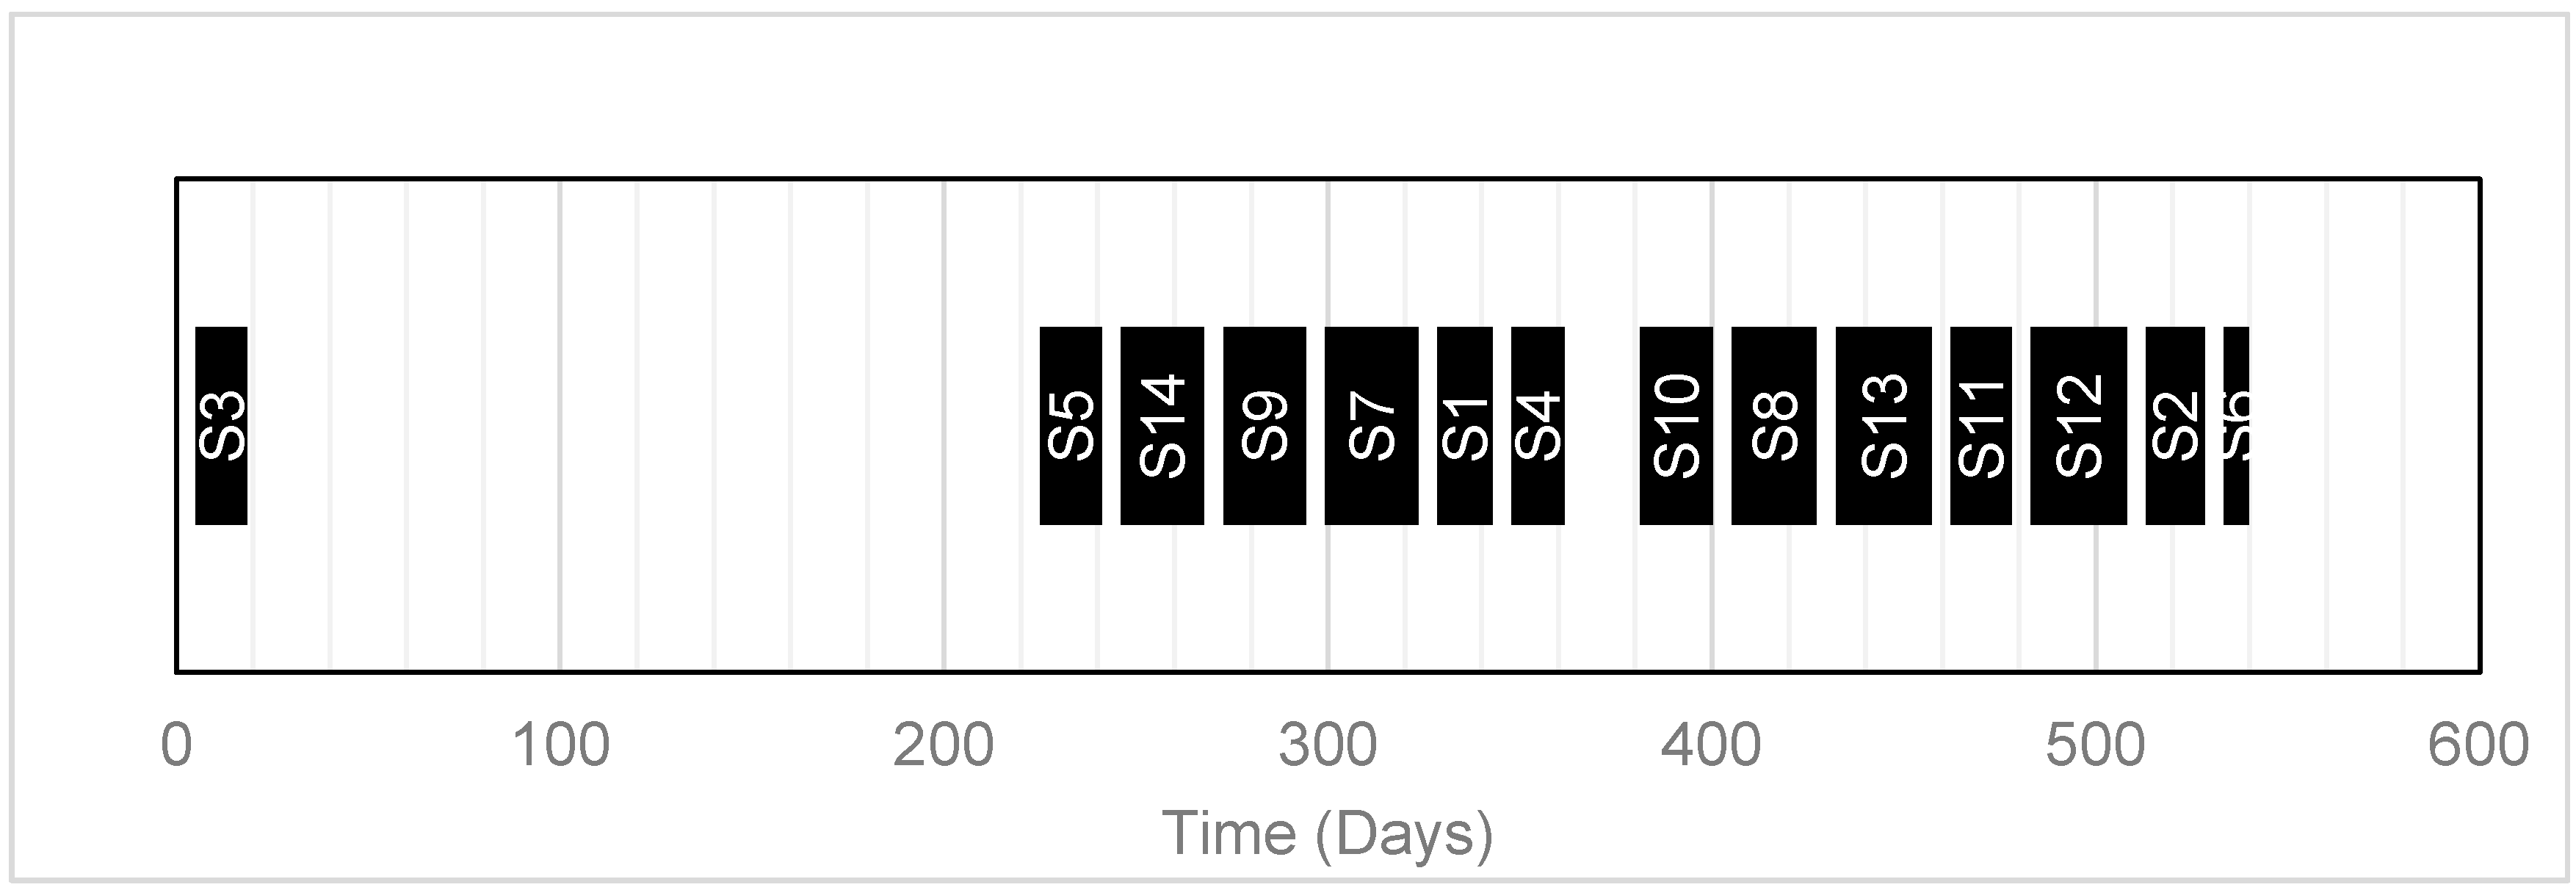
| Well Pads | S1 | S2 | S3 | S4 | S5 | S6 | S7 | S8 | S9 | S10 | S11 | S12 | S13 | S14 |
|---|---|---|---|---|---|---|---|---|---|---|---|---|---|---|
| Match with takepoints TPs,t | t2 | t1 | t1 | t1 | t1 | t2 | t2 | t2 | t2 | t2 | t2 | t1 | t1 | t2 |
| Earliest fracturing day | 1 | 1 | 1 | 1 | 1 | 39 | 1 | 273 | 273 | 273 | 396 | 379 | 379 | 1 |
| No. of stages | 57 | 61 | 54 | 55 | 64 | 26 | 97 | 88 | 86 | 76 | 63 | 100 | 100 | 87 |
| Parameter | Value |
|---|---|
| Crew transition time (day) | 5 |
| Volume of fracturing fluid used per stage (m3) | 950 |
| Freshwater used (%) | 85 |
| Storage cost ($/m3) | 0.59 |
| Freshwater trucking cost ($/m3) | 29.35 |
| Freshwater pumping cost ($/m3) | 15.93 |
| Disposal cost ($/m3) | 134.18 |
| Wastewater pumping cost ($/km/m3) | 0.28 |
| Wastewater storage cost ($/m3) | 0.59 |
| Temperature-independent base value of membrane permeability BWB (kg/(m2 s pa K1.334)) | 3.9 × 10⁻¹⁰ |
| Membrane thickness (mm) | 0.65 |
| Membrane life time (year) | 4 |
| Annual operation time (h) | 8000 |
| Heating cost ($/(109 J)) | 5 |
| Supply temperature (K) | 293 |
| Specific heat capacity (kJ/(kg K)) | 4 |
| Average TDS concentration of the feed into membrane distillation (MD) (mg/L) | 200,000 |
| Scenario 1 | Scenario 2 | Scenario 3 | |
|---|---|---|---|
| Freshwater pumped (1000, m3) | 818.80 | 640.30 | 635.30 |
| Freshwater trucked (1000, m3) | 0 | 0 | 0 |
| Regenerated water (1000, m3) | 0 | 178.53 | 183.53 |
| Freshwater saved (%) | 0 | 21.80 | 22.42 |
| Freshwater trucking cost ($1000) | 0 | 0 | 0 |
| Freshwater pumping cost ($1000) | 13,043 | 10,019 | 10,012 |
| Disposal cost ($1000) | 0 | 2119 | 1450 |
| Wastewater pumping cost ($1000) | 0 | 10.01 | 11.65 |
| Wastewater storage cost ($1000) | 0 | 1740 | 1747 |
| Treatment cost ($1000) | 0 | 11,307 | 10,575 |
| Revenue ($1000) | - | 261,240 | 261,240 |
| Profit ($1000) | - | 235,860 | 237,340 |
| Scenario 1 | Scenario 2 | Scenario 3 | |
|---|---|---|---|
| No. of constraints | 5698 | 9324 | 9418 |
| No. of continuous variables | 3796 | 6023 | 6103 |
| No. of binary variables | 210 | 435 | 435 |
| Non-linear terms | - | 1458 | 1514 |
| CPU time (s) | 0.11 | 51.82 | 458.59 |
| No. of slots | 14 | 14 | 14 |
| No. of time points | 15 | 15 | 15 |
| Design Variables | Optimum Values |
|---|---|
| MD feed temperature (K) | 354 |
| Required membrane area (m2) | 186.67 × 10³ |
| Thermal efficiency | 0.98 |
| Thermal energy (kJ/day) | 610 × 106 |
| Permeate flux (kg/(m2 s)) | 0.013 |
| Removal ratio (RR) (%) | 1 |
© 2018 by the authors. Licensee MDPI, Basel, Switzerland. This article is an open access article distributed under the terms and conditions of the Creative Commons Attribution (CC BY) license (http://creativecommons.org/licenses/by/4.0/).
Share and Cite
Oke, D.; Majozi, T.; Mukherjee, R.; Sengupta, D.; El-Halwagi, M.M. Simultaneous Energy and Water Optimisation in Shale Exploration. Processes 2018, 6, 86. https://doi.org/10.3390/pr6070086
Oke D, Majozi T, Mukherjee R, Sengupta D, El-Halwagi MM. Simultaneous Energy and Water Optimisation in Shale Exploration. Processes. 2018; 6(7):86. https://doi.org/10.3390/pr6070086
Chicago/Turabian StyleOke, Doris, Thokozani Majozi, Rajib Mukherjee, Debalina Sengupta, and Mahmoud M. El-Halwagi. 2018. "Simultaneous Energy and Water Optimisation in Shale Exploration" Processes 6, no. 7: 86. https://doi.org/10.3390/pr6070086
APA StyleOke, D., Majozi, T., Mukherjee, R., Sengupta, D., & El-Halwagi, M. M. (2018). Simultaneous Energy and Water Optimisation in Shale Exploration. Processes, 6(7), 86. https://doi.org/10.3390/pr6070086