Model Validation and Process Design of Continuous Single Pass Tangential Flow Filtration Focusing on Continuous Bioprocessing for High Protein Concentrations
Abstract
:1. Introduction
2. Theory
2.1. Model Development
2.1.1. Concentration Polarization
2.1.2. Boundary Layer Model
2.1.3. Pressure Drop
2.2. Influence of Protein Concentration
3. Material & Methods
3.1. Filtration Setup
3.2. Media
3.3. Analytics
3.4. Dataset for Modelling
3.5. Design of Experiments
4. Results and Discussion
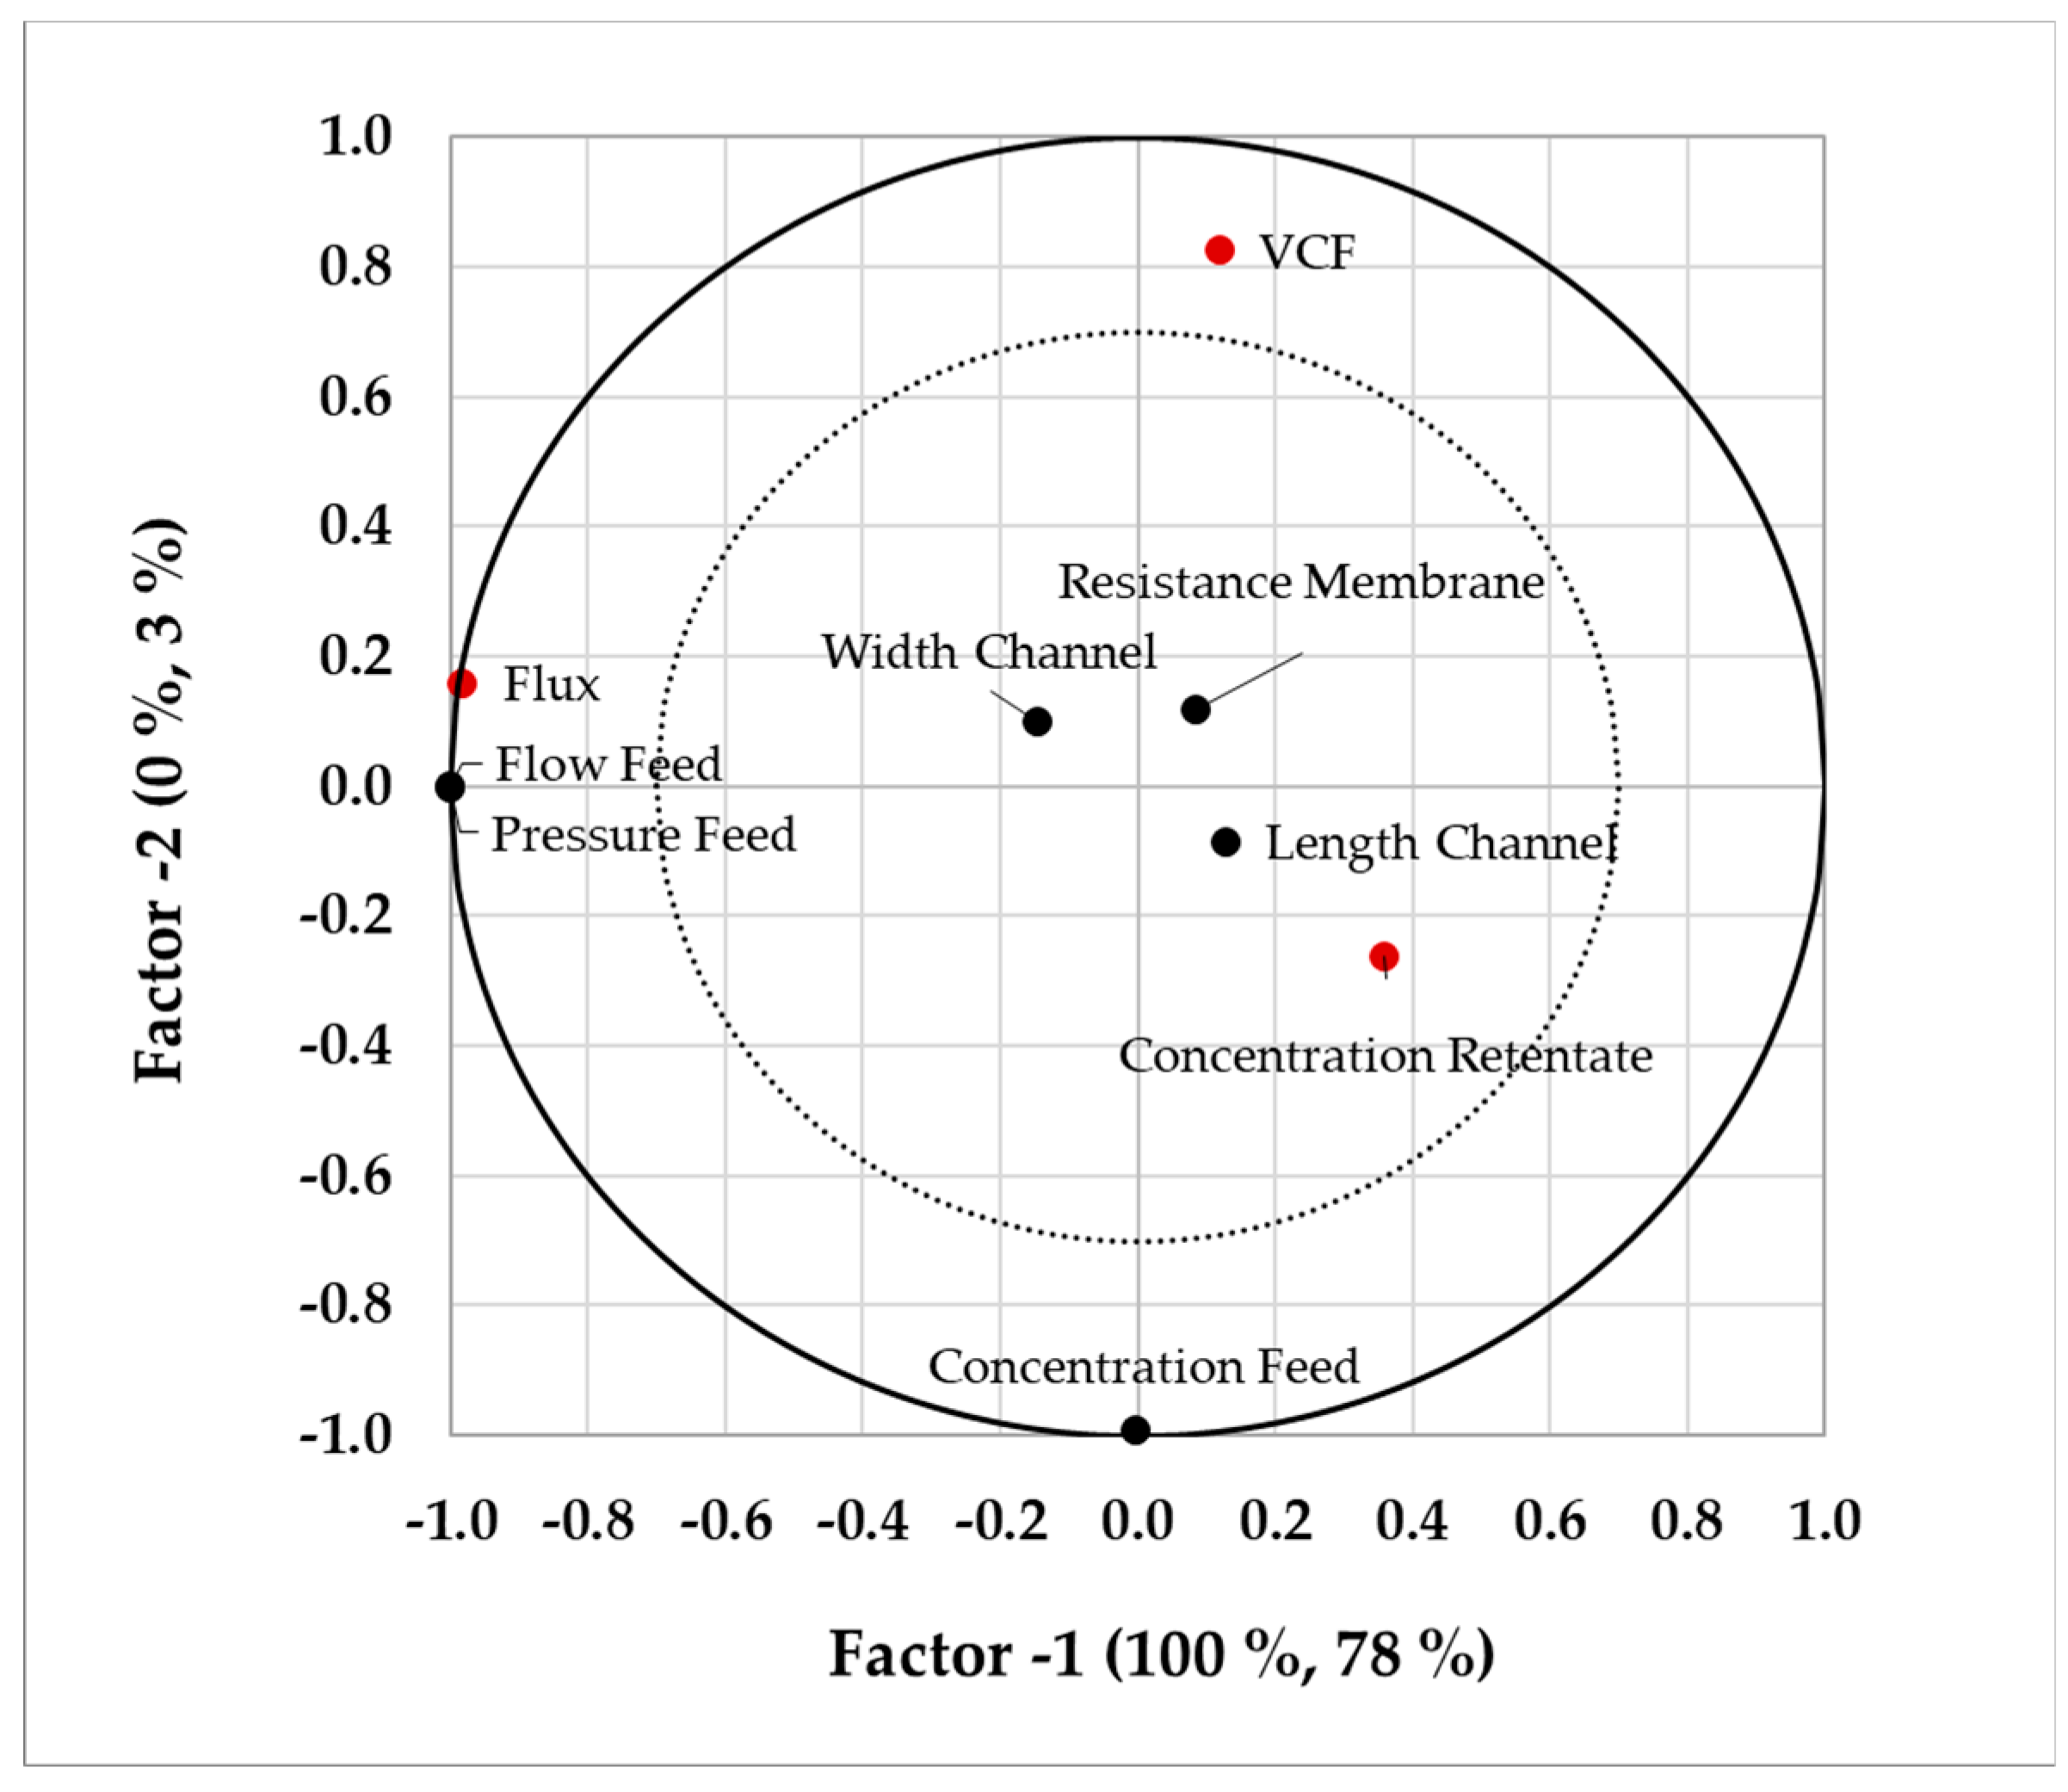
4.1. Sensitivity Study
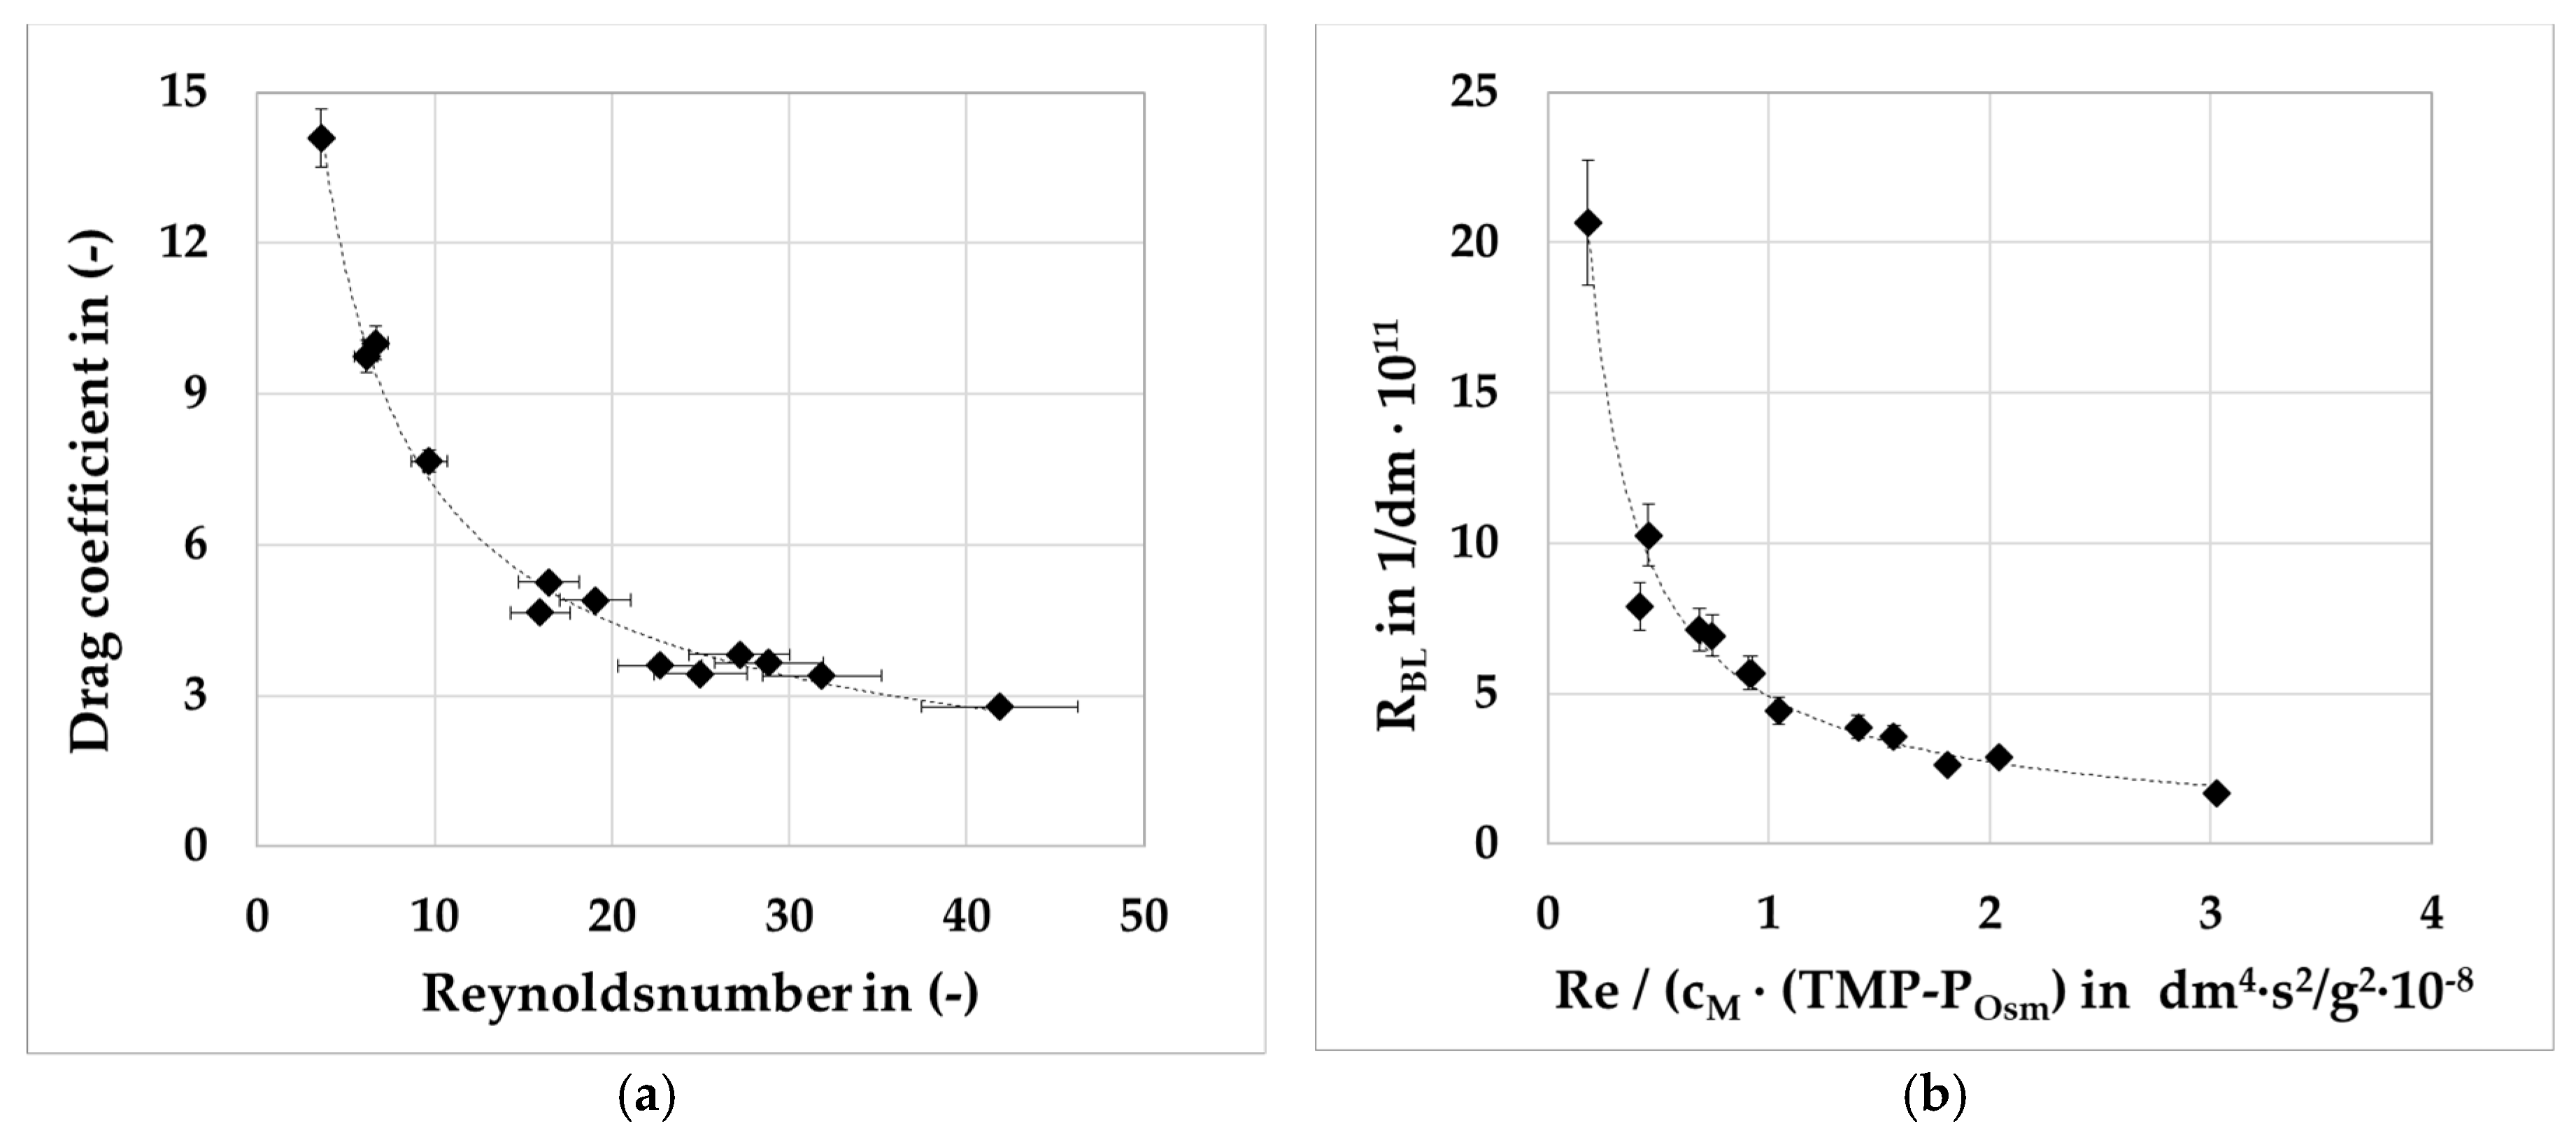
4.2. Parameter Determination
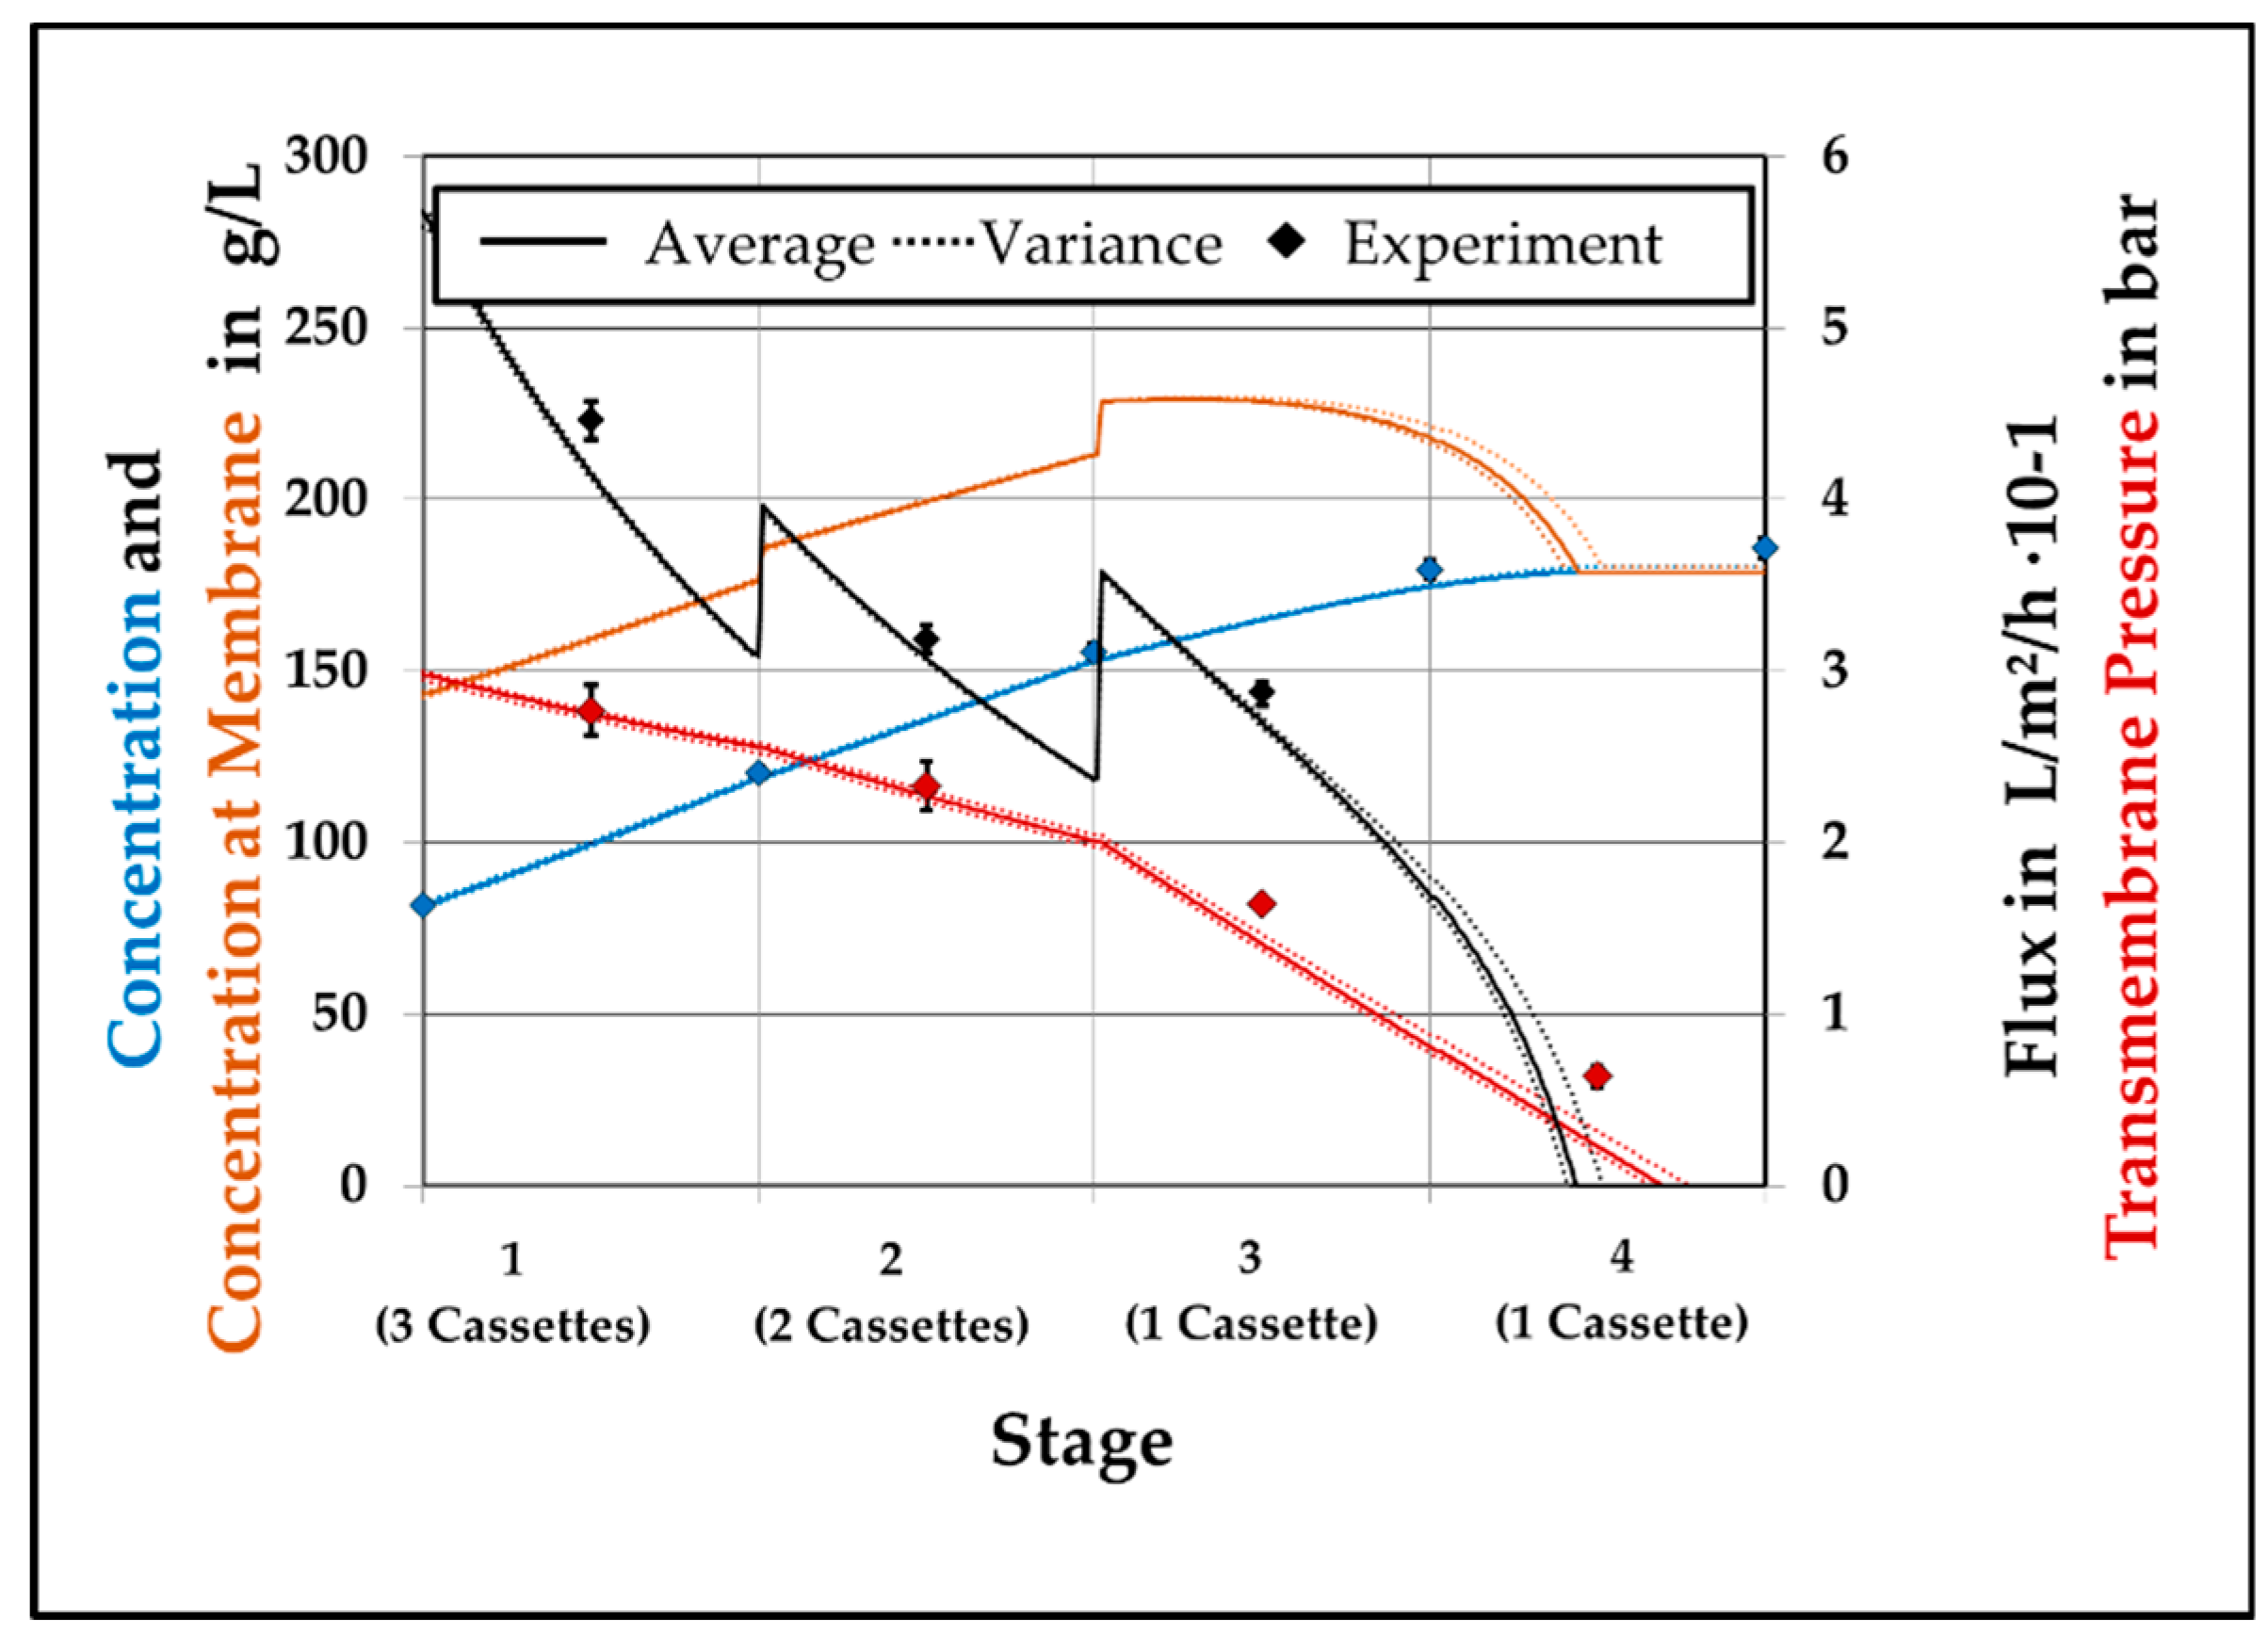
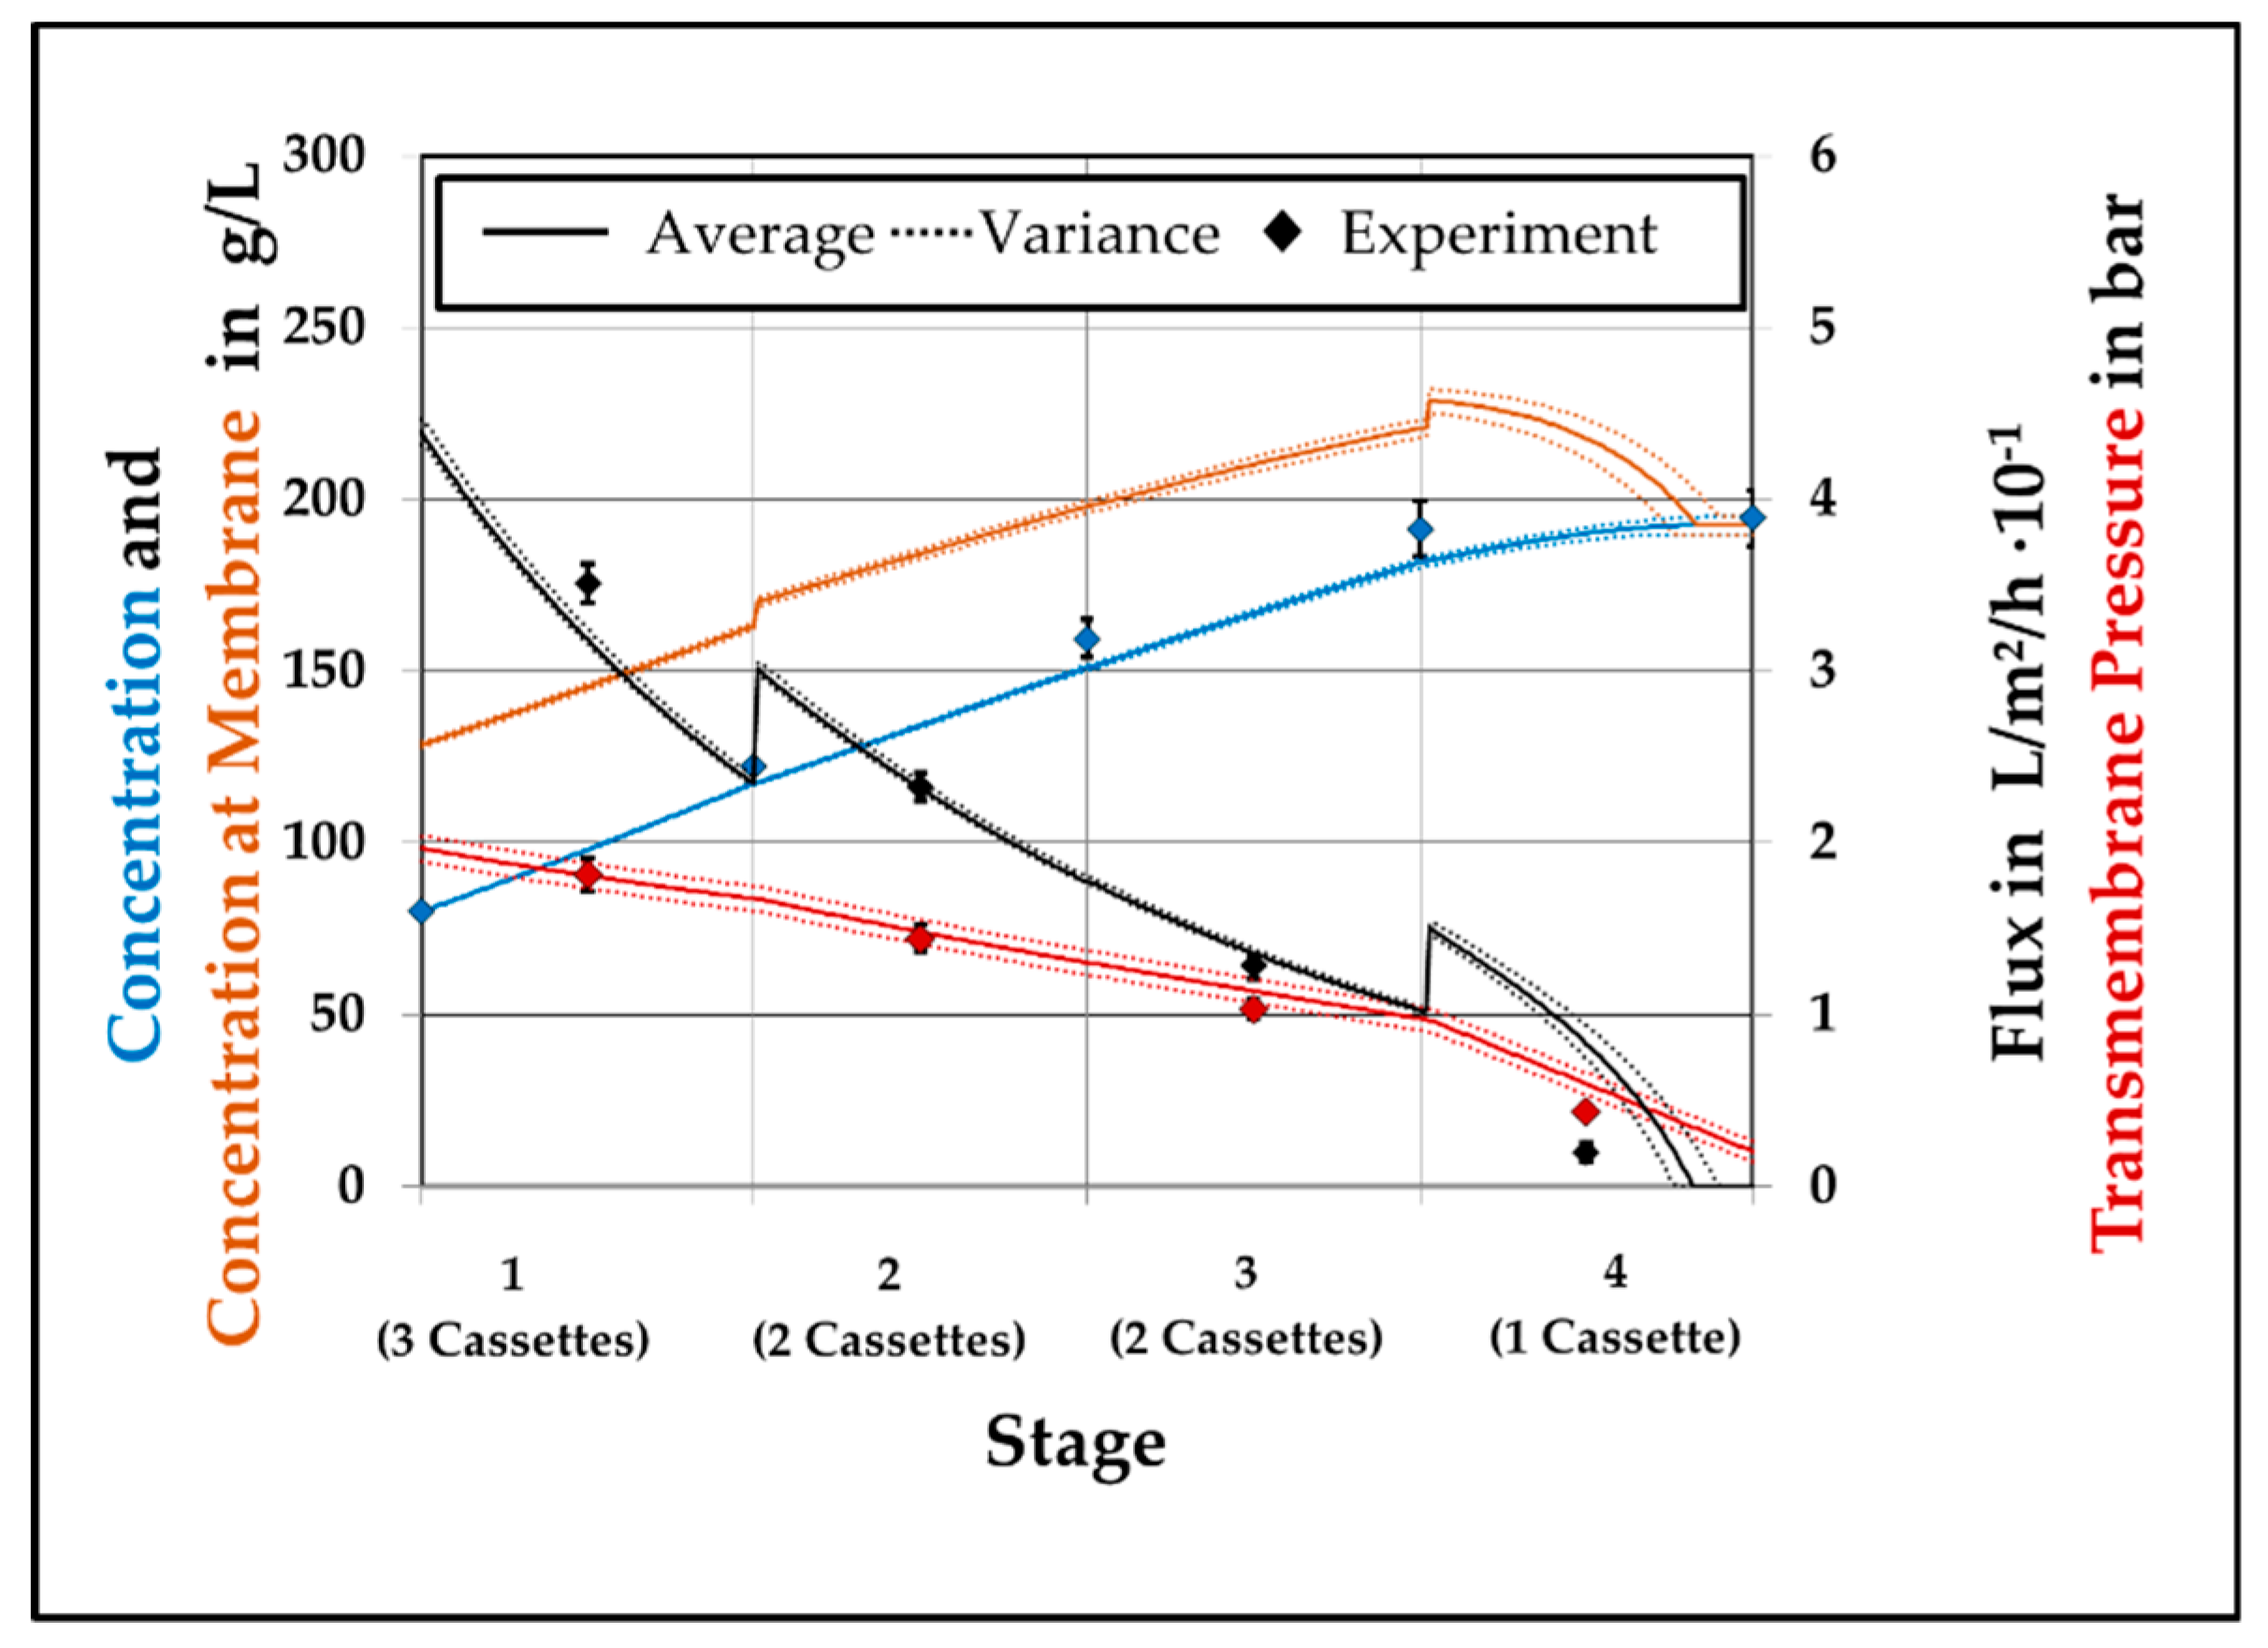
4.3. Model Validation
4.4. Model Assited Optimization
4.5. Comparison to Commercial SPTFF-Kit
5. Conclusions
Author Contributions
Funding
Acknowledgments
Conflicts of Interest
Symbols and Abbreviations
| A | Factor for osmotic Pressure |
| BLM | Boundary layer model |
| BSA | Bovine serum albumin |
| C | Concentration in the liquid phase, g/L |
| cM | Concentration at membrane, g/L |
| cB | Concentration in bulk phase, g/L |
| cF | Concentration of feed, g/L |
| cRet | Concentration of retentate, g/L |
| CWRT | Clean water resistance test |
| dh | Hydraulic diameter, m |
| DoE | Design of experiments |
| Dp | Molecular diffusion coefficient, m²/s |
| DSP | Downstream processing |
| FMEA | Failure Modes and Effect Analysis |
| Jv | Volumetric flux, L/m²/h |
| kf | Mass transfer coefficient, m/s |
| Lch | Length of channel, m |
| OPEX | Operational expenditure |
| P | Pressure, bar |
| PAT | Process analytical technology |
| PLS | Partial least square |
| pOSM | Osmotic pressure, bar |
| QbD | Quality by design |
| RM | Resistance of Membrane, 1/m |
| RBL | Resistance of Boundary layer, 1/m |
| Sc | Schmidt number, - |
| SC | Side component |
| Sh | Sherwood number |
| SFM | Stagnant film model |
| T | Temperature, °C |
| TC | Target component |
| TMP | Transmembrane pressure, bar |
| ueff | Effective velocity, m/s |
| V | Volume, dm³ |
| wch | Width of channel, m |
| VCF | Volumetric concentration factor, - |
| Xc | Factor for drag coefficient, - |
| XR | Factor for boundary layer resistance, g²·s²/dm5 |
| Yc | Exponent for drag coefficient, - |
| YR | Exponent for boundary layer resistance, - |
| ρSol | density of solution, g/L |
| ηSol | dynamic viscosity of solution, g/m/s |
| ηp | dynamic viscosity of permeate, g/m/s |
References
- Huter, M.J.; Strube, J. Model-Based Design and Process Optimization of Continuous Single Pass Tangential Flow Filtration Focusing on Continuous Bioprocessing. Processes 2019, 7, 317. [Google Scholar] [CrossRef]
- Cheryan, M. Ultrafiltration and Microfiltration Handbook; Technomic Pub. Co.: Lancaster, PA, USA, 1998. [Google Scholar]
- Baker, R.W. Membrane Technology and Applications, 3rd ed.; Wiley: Chichester, UK, 2012. [Google Scholar]
- Jungbauer, A. Continuous downstream processing of biopharmaceuticals. Trends Biotechnol. 2013, 31, 479–492. [Google Scholar] [CrossRef] [PubMed]
- Zydney, A.L. Continuous downstream processing for high value biological products: A Review. Biotechnol. Bioeng. 2016, 113, 465–475. [Google Scholar] [CrossRef] [PubMed]
- Sommerfeld, S.; Strube, J. Challenges in biotechnology production—Generic processes and process optimization for monoclonal antibodies. Chem. Eng. Process.: Process Intensif. 2005, 44, 1123–1137. [Google Scholar] [CrossRef]
- Fröhlich, H.; Villian, L.; Melzner, D.; Strube, J. Membrane Technology in Bioprocess Science. Chem. Ing. Tech. 2012, 84, 905–917. [Google Scholar] [CrossRef]
- Thiess, H.; Leuthold, M.; Grummert, U.; Strube, J. Module design for ultrafiltration in biotechnology: Hydraulic analysis and statistical modeling. J. Membr. Sci. 2017, 540, 440–453. [Google Scholar] [CrossRef]
- Grote, F.; Fröhlich, H.; Strube, J. Integration of Reverse-Osmosis Unit Operations in Biotechnology Process Design. Chem. Eng. Technol. 2012, 35, 191–197. [Google Scholar] [CrossRef]
- Grote, F.; Fröhlich, H.; Strube, J. Integration of Ultrafiltration Unit Operations in Biotechnology Process Design. Chem. Eng. Technol. 2011, 34, 673–687. [Google Scholar] [CrossRef]
- Charcosset, C. Membrane Processes in Biotechnology and Pharmaceutics; Elsevier Verlag: Oxford, UK, 2012. [Google Scholar]
- Dizon-Maspat, J.; Bourret, J.; D’Agostini, A.; Li, F. Single pass tangential flow filtration to debottleneck downstream processing for therapeutic antibody production. Biotechnol. Bioeng. 2012, 109, 962–970. [Google Scholar] [CrossRef]
- Binabaji, E.; Ma, J.; Zydney, A.L. Intermolecular Interactions and the Viscosity of Highly Concentrated Monoclonal Antibody Solutions. Pharm. Res. 2015, 32, 3102–3109. [Google Scholar] [CrossRef]
- Binabaji, E.; Ma, J.; Rao, S.; Zydney, A.L. Ultrafiltration of highly concentrated antibody solutions: Experiments and modeling for the effects of module and buffer conditions. Biotechnol. Prog. 2016, 32, 692–701. [Google Scholar] [CrossRef] [PubMed]
- Lutz, H.; Arias, J.; Zou, Y. High concentration biotherapeutic formulation and ultrafiltration: Part 1 pressure limits. Biotechnol. Prog. 2017, 33, 113–124. [Google Scholar] [CrossRef] [PubMed]
- Scopes, R.K. Protein Purification. Principles and Practice, 3rd ed.; Springer-Verlag: Berlin/Heidelberg, Germany, 1994. [Google Scholar]
- ICH. Quality Risk Management Q9, (Step 4 version); ICH: Geneva, Switzerland, 2005; Available online: https://www.ich.org/fileadmin/Public_Web_Site/ICH_Products/Guidelines/Quality/Q9/Step4/Q9_Guideline.pdf (accessed on 17 January 2018).
- ICH. Pharmaceutical Quality System Q10, (Step 4 version); ICH: Geneva, Switzerland, 2008; Available online: http://www.ich.org/fileadmin/Public_Web_Site/ICH_Products/Guidelines/Quality/Q10/Step4/Q10_Guideline.pdf (accessed on 17 January 2018).
- ICH. Pharmaceutical Development Q8 (R2), (Step 4 version); ICH: Geneva, Switzerland, 2009; Available online: https://www.ich.org/fileadmin/Public_Web_Site/ICH_Products/Guidelines/Quality/Q8_R1/Step4/Q8_R2_Guideline.pdf (accessed on 2 January 2015).
- ICH. Development and Manufacturing of Drug Substances Q11, (Step 4 version); ICH: Geneva, Switzerland, 2013; Available online: http://www.ich.org/fileadmin/Public_Web_Site/ICH_Products/Guidelines/Quality/Q11/Q11_Step_4.pdf (accessed on 17 January 2018).
- Degerman, M.; Westerberg, K.; Nilsson, B. A Model-Based Approach to Determine the Design Space of Preparative Chromatography. Chem. Eng. Technol. 2009, 32, 1195–1202. [Google Scholar] [CrossRef]
- Del Val, I.J.; Kontoravdi, C.; Nagy, J.M. Towards the implementation of quality by design to the production of therapeutic monoclonal antibodies with desired glycosylation patterns. Biotechnol. Prog. 2010, 26, 1505–1527. [Google Scholar] [CrossRef]
- FDA. Guidance for Industry: Pharmacogenomic Data Submissions. Biotechnol. Law Rep. 2003, 23, 68–86. [Google Scholar]
- US Department of Health and Human Services. Guidance for Industry—Sterile Drug Products Produced by Aseptic Processing—Current Good Manufacturing Practice; FDA: Silver Spring, MD, USA, 2004.
- Food and Drug Administration. Guidance for Industry PAT—A Framework for Innovative Pharmaceutical Development, Manufacturing, and Quality Assurance; FDA: Silver Spring, MD, USA, 2004.
- Schmidt, A.; Strube, J. Distinct and Quantitative Validation Method for Predictive Process Modeling with Examples of Liquid-Liquid Extraction Processes of Complex Feed Mixtures. Processes 2019, 7, 298. [Google Scholar] [CrossRef]
- Sixt, M.; Uhlenbrock, L.; Strube, J. Toward a Distinct and Quantitative Validation Method for Predictive Process Modelling—On the Example of Solid-Liquid Extraction Processes of Complex Plant Extracts. Processes 2018, 6, 66. [Google Scholar] [CrossRef]
- Sixt, M.; Strube, J. Systematic and Model-Assisted Evaluation of Solvent Based- or Pressurized Hot Water Extraction for the Extraction of Artemisinin from Artemisia annua L. Processes 2017, 5, 86. [Google Scholar] [CrossRef]
- Kornecki, M.; Strube, J. Accelerating Biologics Manufacturing by Upstream Process Modelling. Processes 2019, 7, 166. [Google Scholar] [CrossRef]
- Zobel-Roos, S.; Mouellef, M.; Ditz, R.; Strube, J. Distinct and Quantitative Validation Method for Predictive Process Modelling in Preparative Chromatography of Synthetic and Bio-Based Feed Mixtures Following a Quality-by-Design (QbD) Approach. Processes 2019, 7, 580. [Google Scholar] [CrossRef]
- Sixt, M.; Strube, J. Systematic Design and Evaluation of an Extraction Process for Traditionally Used Herbal Medicine on the Example of Hawthorn (Crataegus monogyna JACQ.). Processes 2018, 6, 73. [Google Scholar] [CrossRef]
- Zobel-Roos, S.; Schmidt, A.; Mestmäcker, F.; Mouellef, M.; Huter, M.; Uhlenbrock, L.; Kornecki, M.; Lohmann, L.; Ditz, R.; Strube, J. Accelerating Biologics Manufacturing by Modeling or: Is Approval under the QbD and PAT Approaches Demanded by Authorities Acceptable Without a Digital-Twin? Processes 2019, 7, 94. [Google Scholar] [CrossRef]
- Michaels, A.S. New Separation Technique for CPI. Chem. Eng. Prog. 1968, 64, 31–43. [Google Scholar]
- Da Costa, A.R.; Fane, A.G.; Fell, C.J.D.; Franken, A.C.M. Optimal channel spacer design for ultrafiltration. J. Membr. Sci. 1991, 62, 275–291. [Google Scholar] [CrossRef]
- Saeed, A. Effect of Feed Channel Spacer Geometry on Hydrodynamics and Mass Transport in Membrane Modules. Ph.D. Thesis, Curtin University, Perth, WA, Australia, 2012. [Google Scholar]
- Wijmans, J.G.; Nakao, S.; Smolders, C.A. Flux limitation in ultrafiltration: Osmotic Pressure Model and Gel Layer Model. J. Membr. Sci. 1984, 20, 115–124. [Google Scholar] [CrossRef]
- Binabaji, E.; Rao, S.; Zydney, A.L. The osmotic pressure of highly concentrated monoclonal antibody solutions: Effect of solution conditions. Biotechnol. Bioeng. 2014, 111, 529–536. [Google Scholar] [CrossRef]
- Yousef, M.A.; Datta, R.; Rodgers, V.G.J. Free-Solvent Model of Osmotic Pressure Revisited: Application to Concentrated IgG Solution under Physiological Conditions. J. Colloid Interface Sci. 1998, 197, 108–118. [Google Scholar] [CrossRef]
- Wijmans, J.G.; Nakao, S.; van den Berg, J.W.A.; Troelstra, F.R.; Smolders, C.A. Hydrodynamic resistance of concentration polarization boundary layers in ultrafiltration. J. Membr. Sci. 1985, 22, 117–135. [Google Scholar] [CrossRef] [Green Version]
- Young, M.E.; Carroad, P.A.; Bell, R.L. Estimation of diffusion coefficients of proteins. Biotechnol. Bioeng. 1980, 22, 947–955. [Google Scholar] [CrossRef]
- Da Costa, A.R.; Fane, A.G.; Wiley, D.E. Spacer characterization and pressure drop modelling in spacer-filled channels for ultrafiltration. J. Membr. Sci. 1994, 87, 79–98. [Google Scholar] [CrossRef]
- Pall Life Sciences. Application Note—Volume Reduction and Process Optimization with Cadence™ Inline Concentrator; Pall Life Sciences: PALL: Nassau County, NY, USA, 2013. [Google Scholar]

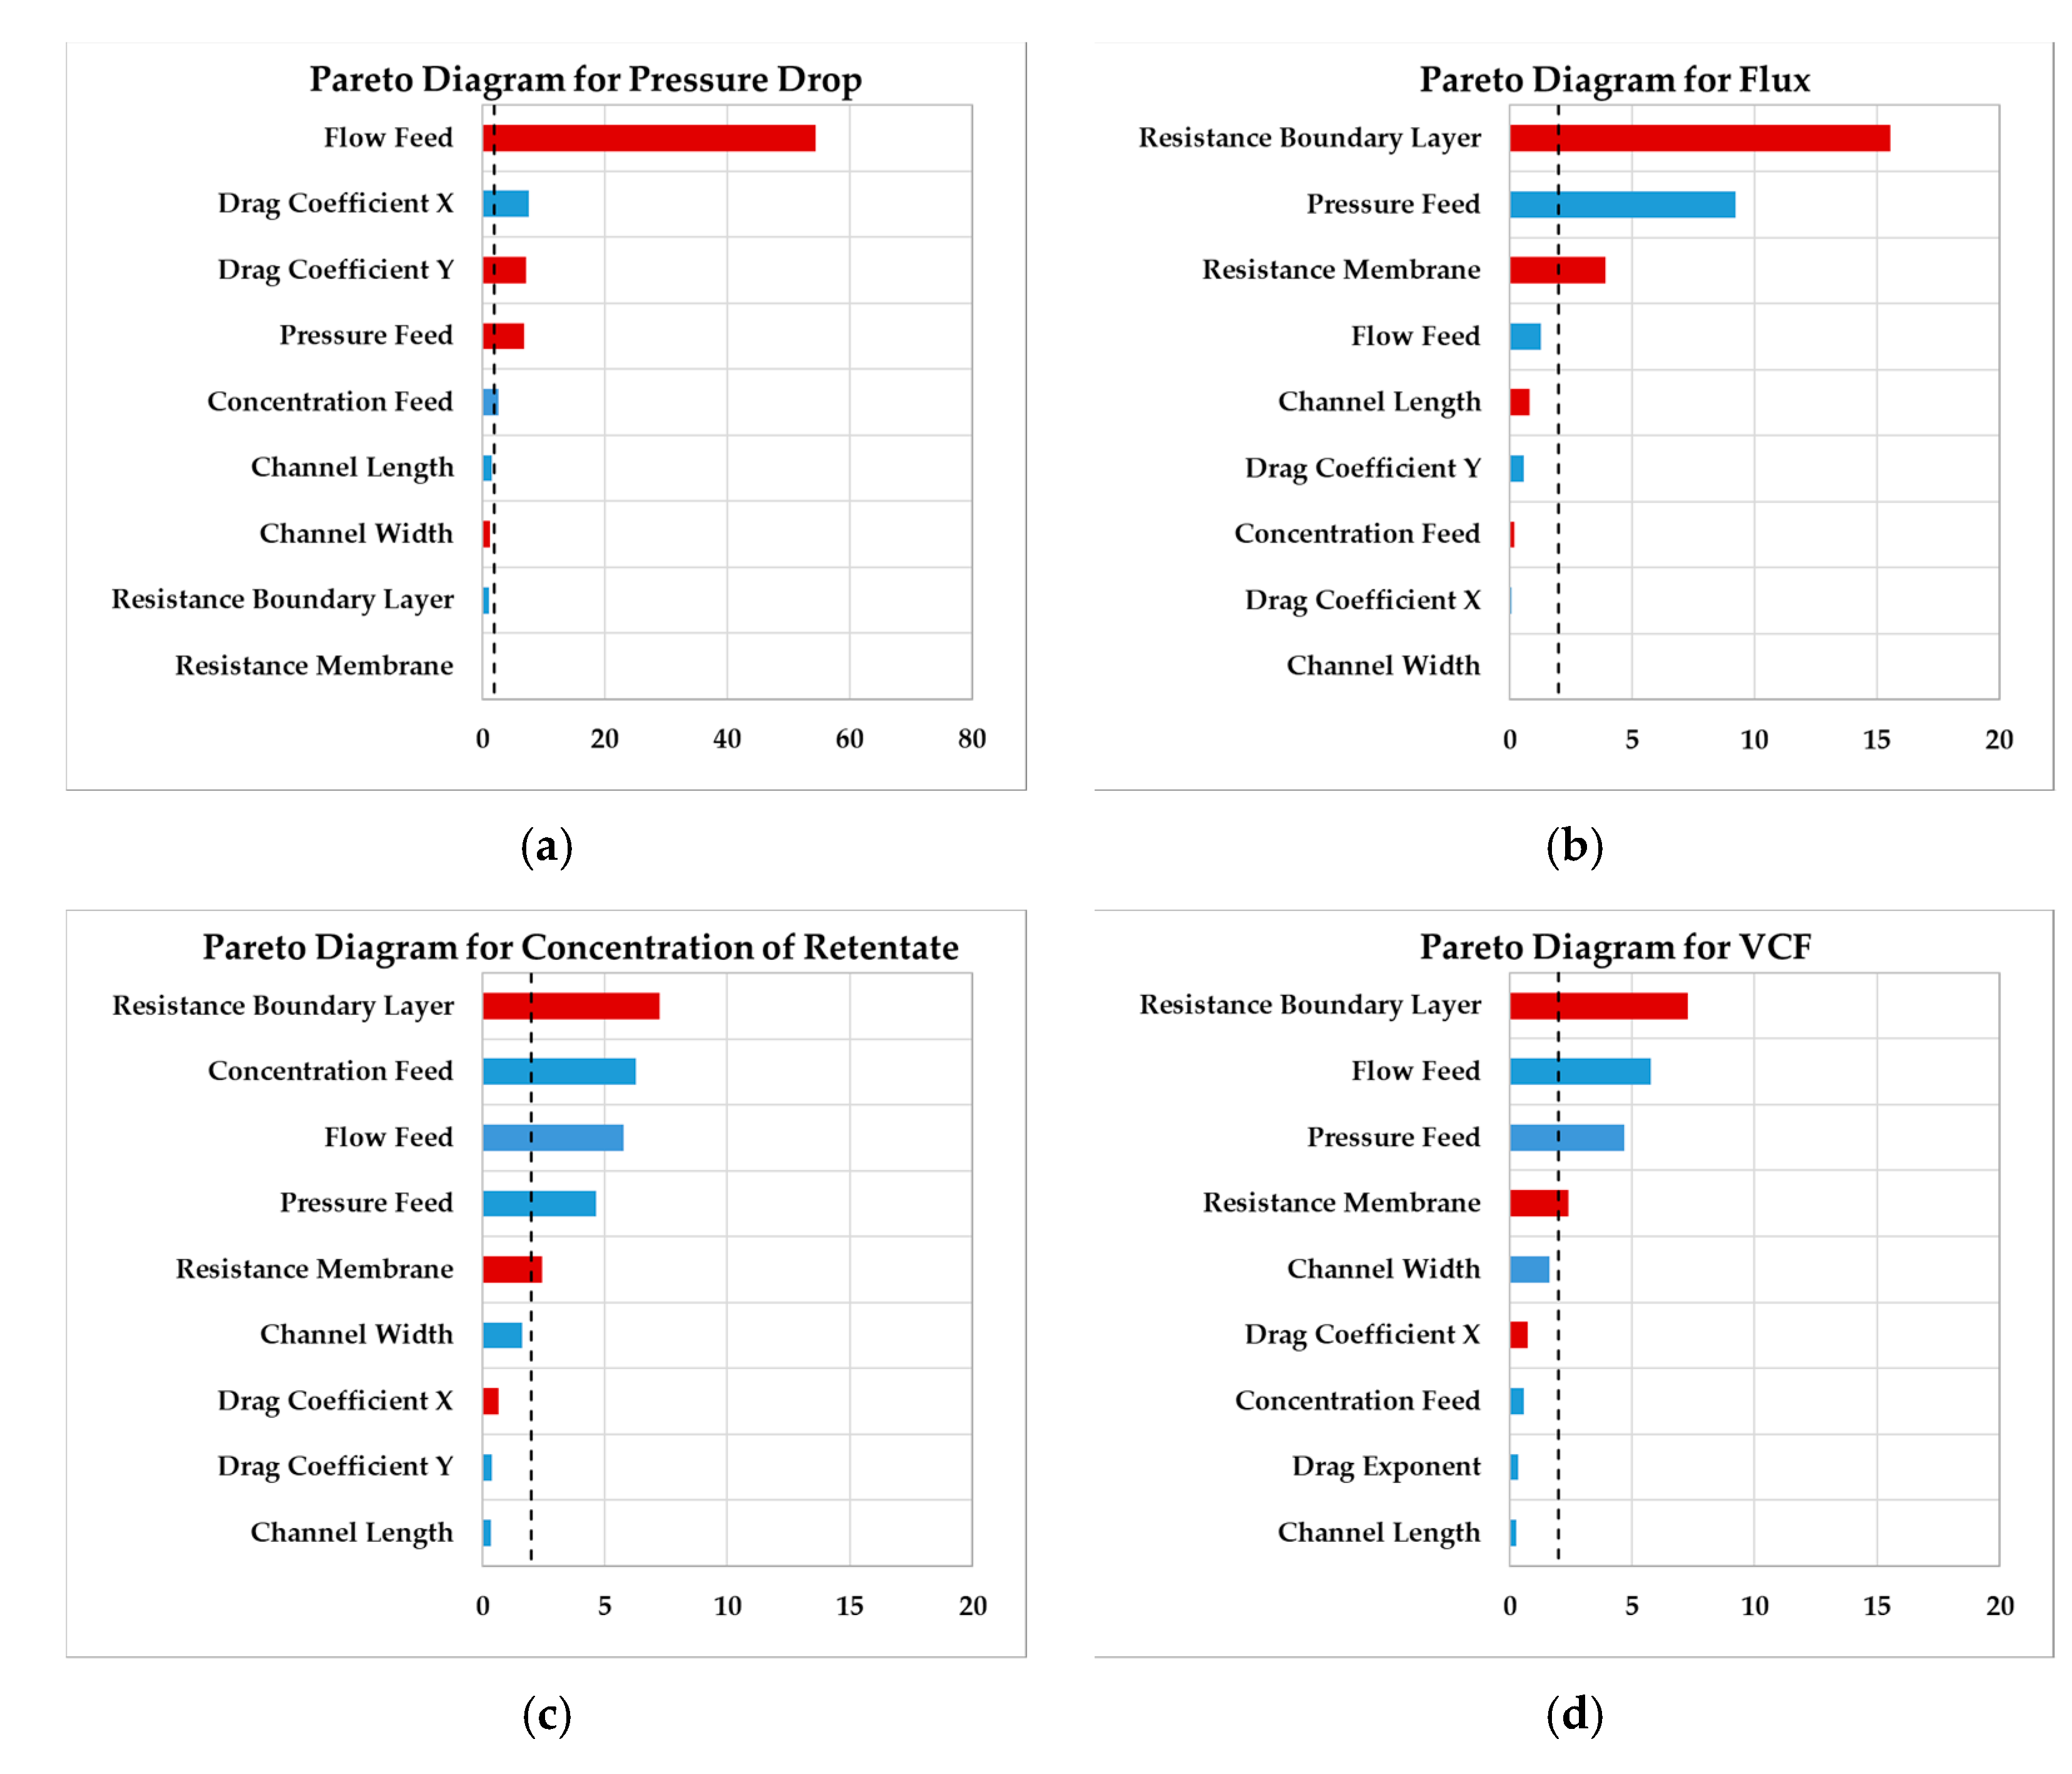

| Variable | Range | Unit | Explanation | Expected Effect | |
|---|---|---|---|---|---|
| Pressure drop | VCF | ||||
| Feed concentration | 75–85 | (g/L) | 80 g/L represents the medium concentration, with 5 g/L variation to represent process fluctuations of prior separation units. | Low | Medium |
| Feed flow | 17–45 | (mL/min) | With 50 mL/min as minimal throughput for the stacked system, 17 mL represents the lower boundary for a single cassette. With the used pump the maximal feed flow was 45 mL per channel, until 4 bar feed pressure are reached. | High | High |
| Feed pressure | 2.0–4.0 | (bar) | 2 bar represent the minimal pressure which is reached at 50 mL/min for a stacked system. 4 bar is the maximum operation pressure, described by the manufacturer. | High | High |
| Membrane length | 1.39–1.43 | (dm) | For length and width of the membrane a tolerance of ± 2 mm is assumed | Low | No |
| Membrane width | 0.34–0.38 | (dm) | Medium | Low | |
| Drag factor Xc | 30–35 | (-) | For both drag factor coefficients, the variation of the drag coefficients of the previous study are taken | Medium | Low |
| Drag factor Yc | −0.75–−0.80 | (-) | Medium | Low | |
| RM | 2.5–4.0 | (1/m) × 1012 | For membrane resistance the range of typical values for 30 kDa membranes are taken. | Low | Medium |
| RBL | 1–20 | (1/m) × 1012 | The boundary layer resistance showed a broad variation in prior experiments. To represent this, a large range is assumed | Medium | High |
| Parameter | Unit | Value |
|---|---|---|
| Effective membrane area per cassette | (m²) | 0.01 |
| Hydraulic diameter | (m) | 1.01 × 10⁻⁴ |
| Drag factor coefficients | ||
| Xc | (-) | 36.8 |
| Yc | (-) | −0.68 |
| RM | (1/m) × 1012 | 3.25 ± 0.4 |
| VCF (-) | Pressure Drop (bar) | |
|---|---|---|
| Experiment | 2.31 ± 0.12 | 2.92 ± 0.01 |
| Model prediction | 2.19 ± 0.12 | 3.00 ± 0.00 |
| Difference | 5.2% | 2.8% |
| VCF (-) | Pressure Drop (bar) | |
|---|---|---|
| Experiment | 2.44 ± 0.07 | 1.94 ± 0.08 |
| Model prediction | 2.44 ± 0.03 | 1.79 ± 0.02 |
| Difference | 0% | 8% |
| Validation Experiment | Optimized Process | |||
|---|---|---|---|---|
| VCF [-] | Pressure Drop [bar] | VCF [-] | Pressure Drop [bar] | |
| Experiment | 2.37 ± 0.02 | 2.84 ± 0.1 | 2.41 ± 0.05 | 1.98 ± 0.01 |
| Model prediction | 2.46 ± 0.05 | 2.66 ± 0.1 | 2.48 ± 0.02 | 1.69 ± 0.02 |
| Difference | 4.7% | 6.4% | 3.1% | 10% |
© 2019 by the authors. Licensee MDPI, Basel, Switzerland. This article is an open access article distributed under the terms and conditions of the Creative Commons Attribution (CC BY) license (http://creativecommons.org/licenses/by/4.0/).
Share and Cite
Huter, M.J.; Jensch, C.; Strube, J. Model Validation and Process Design of Continuous Single Pass Tangential Flow Filtration Focusing on Continuous Bioprocessing for High Protein Concentrations. Processes 2019, 7, 781. https://doi.org/10.3390/pr7110781
Huter MJ, Jensch C, Strube J. Model Validation and Process Design of Continuous Single Pass Tangential Flow Filtration Focusing on Continuous Bioprocessing for High Protein Concentrations. Processes. 2019; 7(11):781. https://doi.org/10.3390/pr7110781
Chicago/Turabian StyleHuter, Maximilian Johannes, Christoph Jensch, and Jochen Strube. 2019. "Model Validation and Process Design of Continuous Single Pass Tangential Flow Filtration Focusing on Continuous Bioprocessing for High Protein Concentrations" Processes 7, no. 11: 781. https://doi.org/10.3390/pr7110781
APA StyleHuter, M. J., Jensch, C., & Strube, J. (2019). Model Validation and Process Design of Continuous Single Pass Tangential Flow Filtration Focusing on Continuous Bioprocessing for High Protein Concentrations. Processes, 7(11), 781. https://doi.org/10.3390/pr7110781


