1. Introduction
In biopharmaceutical processes, membrane-based unit operations are chosen in several positions of the downstream processing (DSP). Due to their mild process conditions and low operation costs, they are used for different tasks in between the main purification steps. Next to sterile filtration, the protein concentration is enhanced by ultrafiltration and to exchange the surrounding medium diafiltration is used [
1,
2,
3,
4,
5,
6,
7,
8,
9,
10,
11,
12]. On the one hand, they are placed in front of the most purification steps to enhance their performance and lower production costs and on the other hand they are used in the end of the process for the formulation of the target protein [
6]. The concentration of monoclonal antibodies for therapeutic use exceeds 150 g/L. These high concentrations of target molecules lead to increased viscosity and reaches values up to of 80 mPa·s [
13]. This not only affects the pressure drop, but significantly lowers the filtration performance of the filtration setup and therefore boosts expenditure (OPEX). Even though solution adjustments of the pH value or by adding excipients are possible to lower the mentioned effects [
14,
15], a risk for precipitation remains with increasing salt concentrations [
16]. Another approach to handle these highly concentrated solutions is by altering the filtration setup or geometries of the membrane cassettes.
Like in the previous study, this work focusses on modelling an SPTFF unit for ultrafiltration purposes [
1]. Further information on the setup of continuous ultrafiltration and especially the multistep SPTFF is discussed in [
1] as well. By implementing process models in the early stage of a process development, different combinations of unit operations can be evaluated. Next to the increased process development, process robustness and quality of the product are needed. Therefore, the Quality-by-Design (QbD) approach is demanded by authorities [
17,
18,
19,
20,
21,
22,
23,
24,
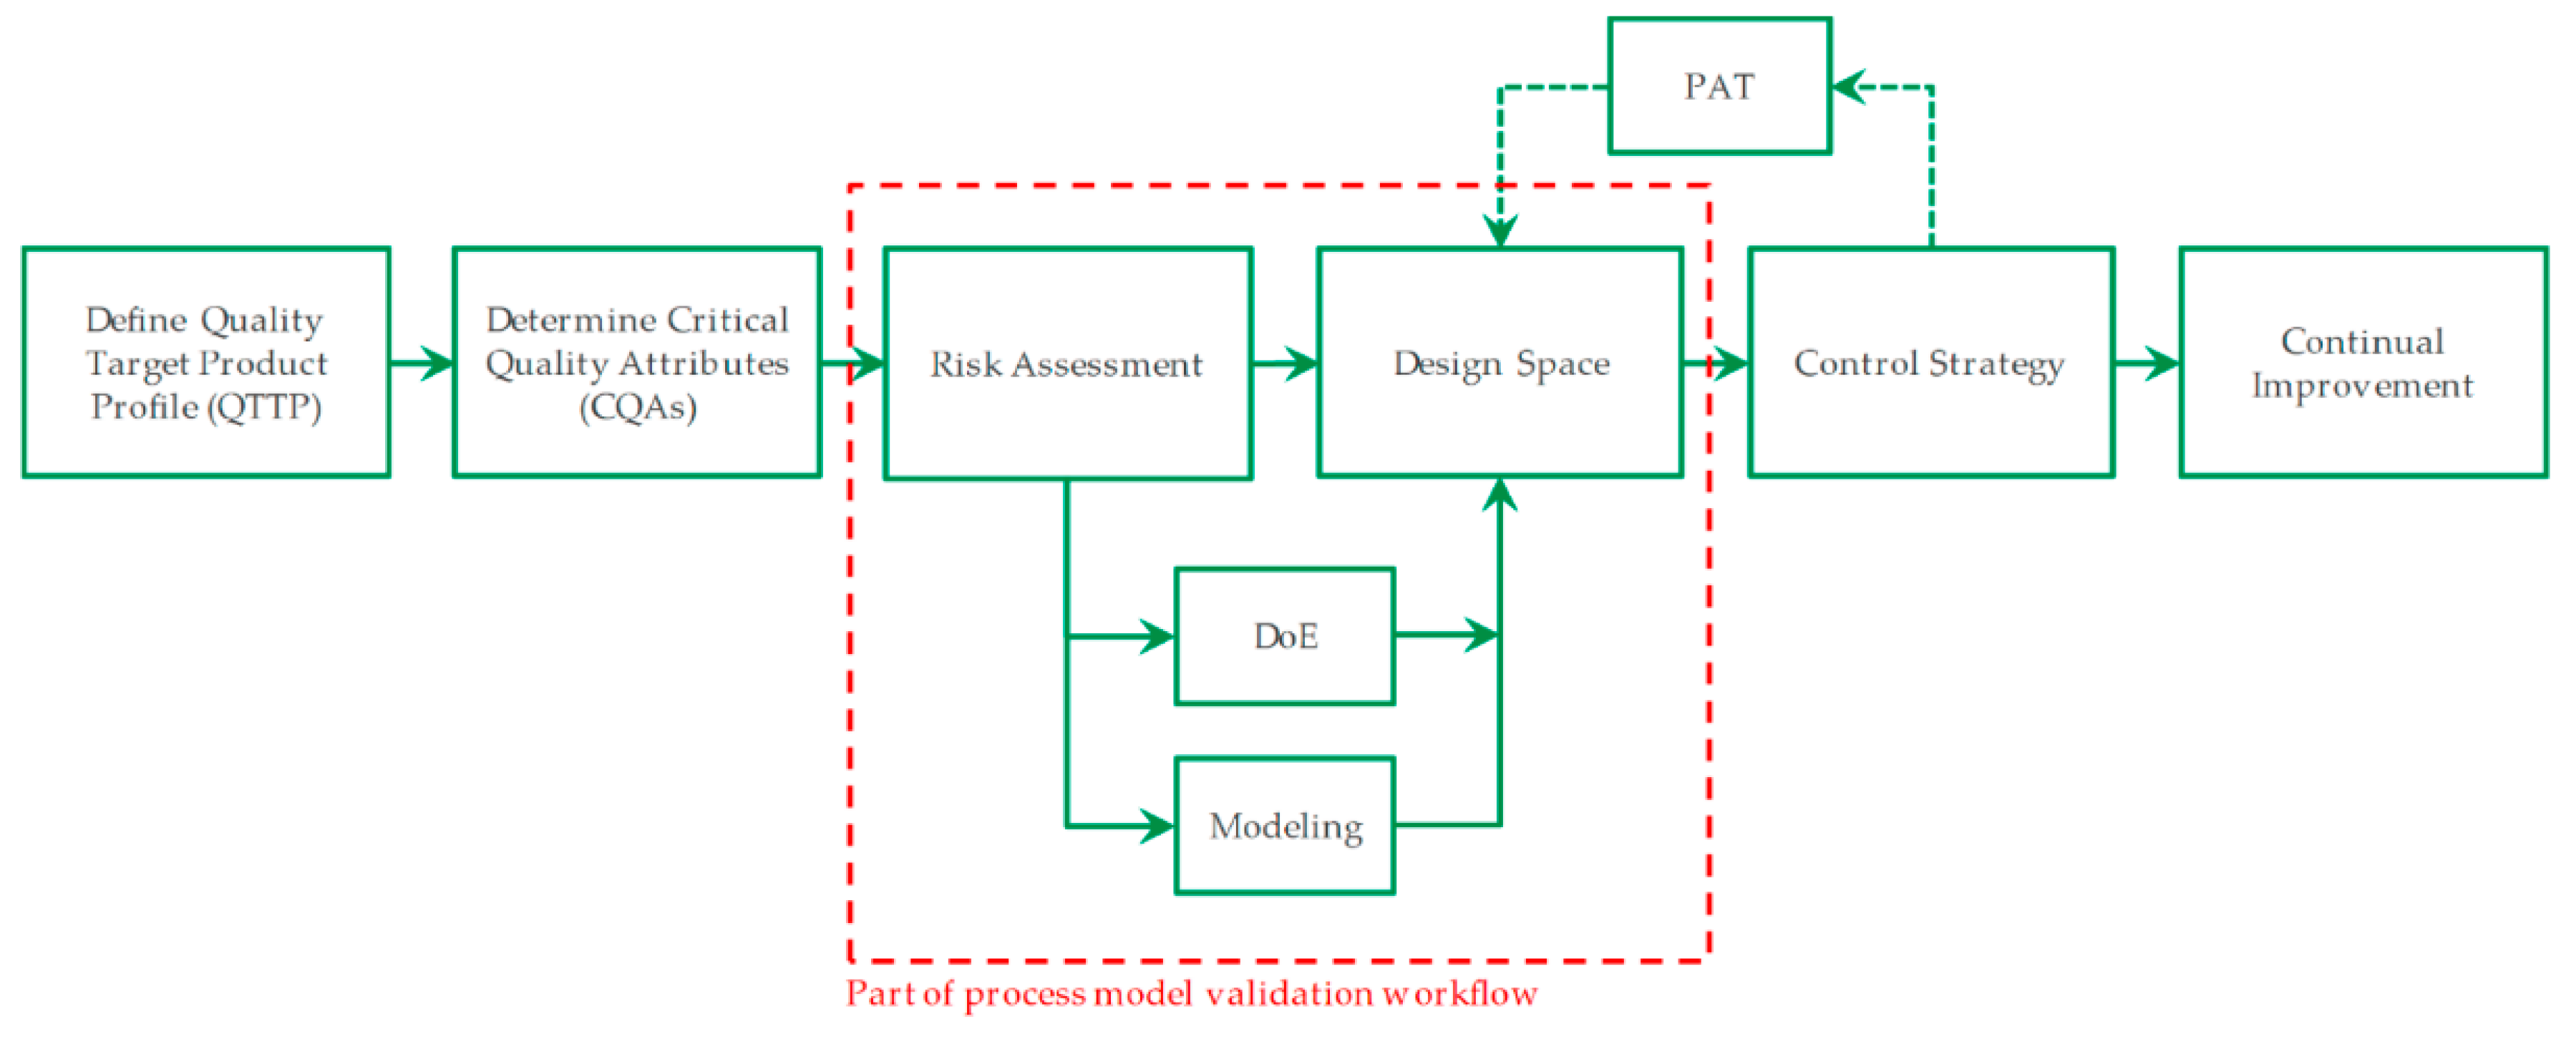
25]. An exemplary workflow for fast process development with usage of model-based process design is visualized in
Figure 1. The red square marks the focused area, which is presented in this manuscript. To help evaluate the stability of each operation point inside the design space and sensitivities relating to operation parameters have to be identified. This leads to a more robust process. Because practical experiments would exceed a rational amount, model assisted process design is a promising approach.
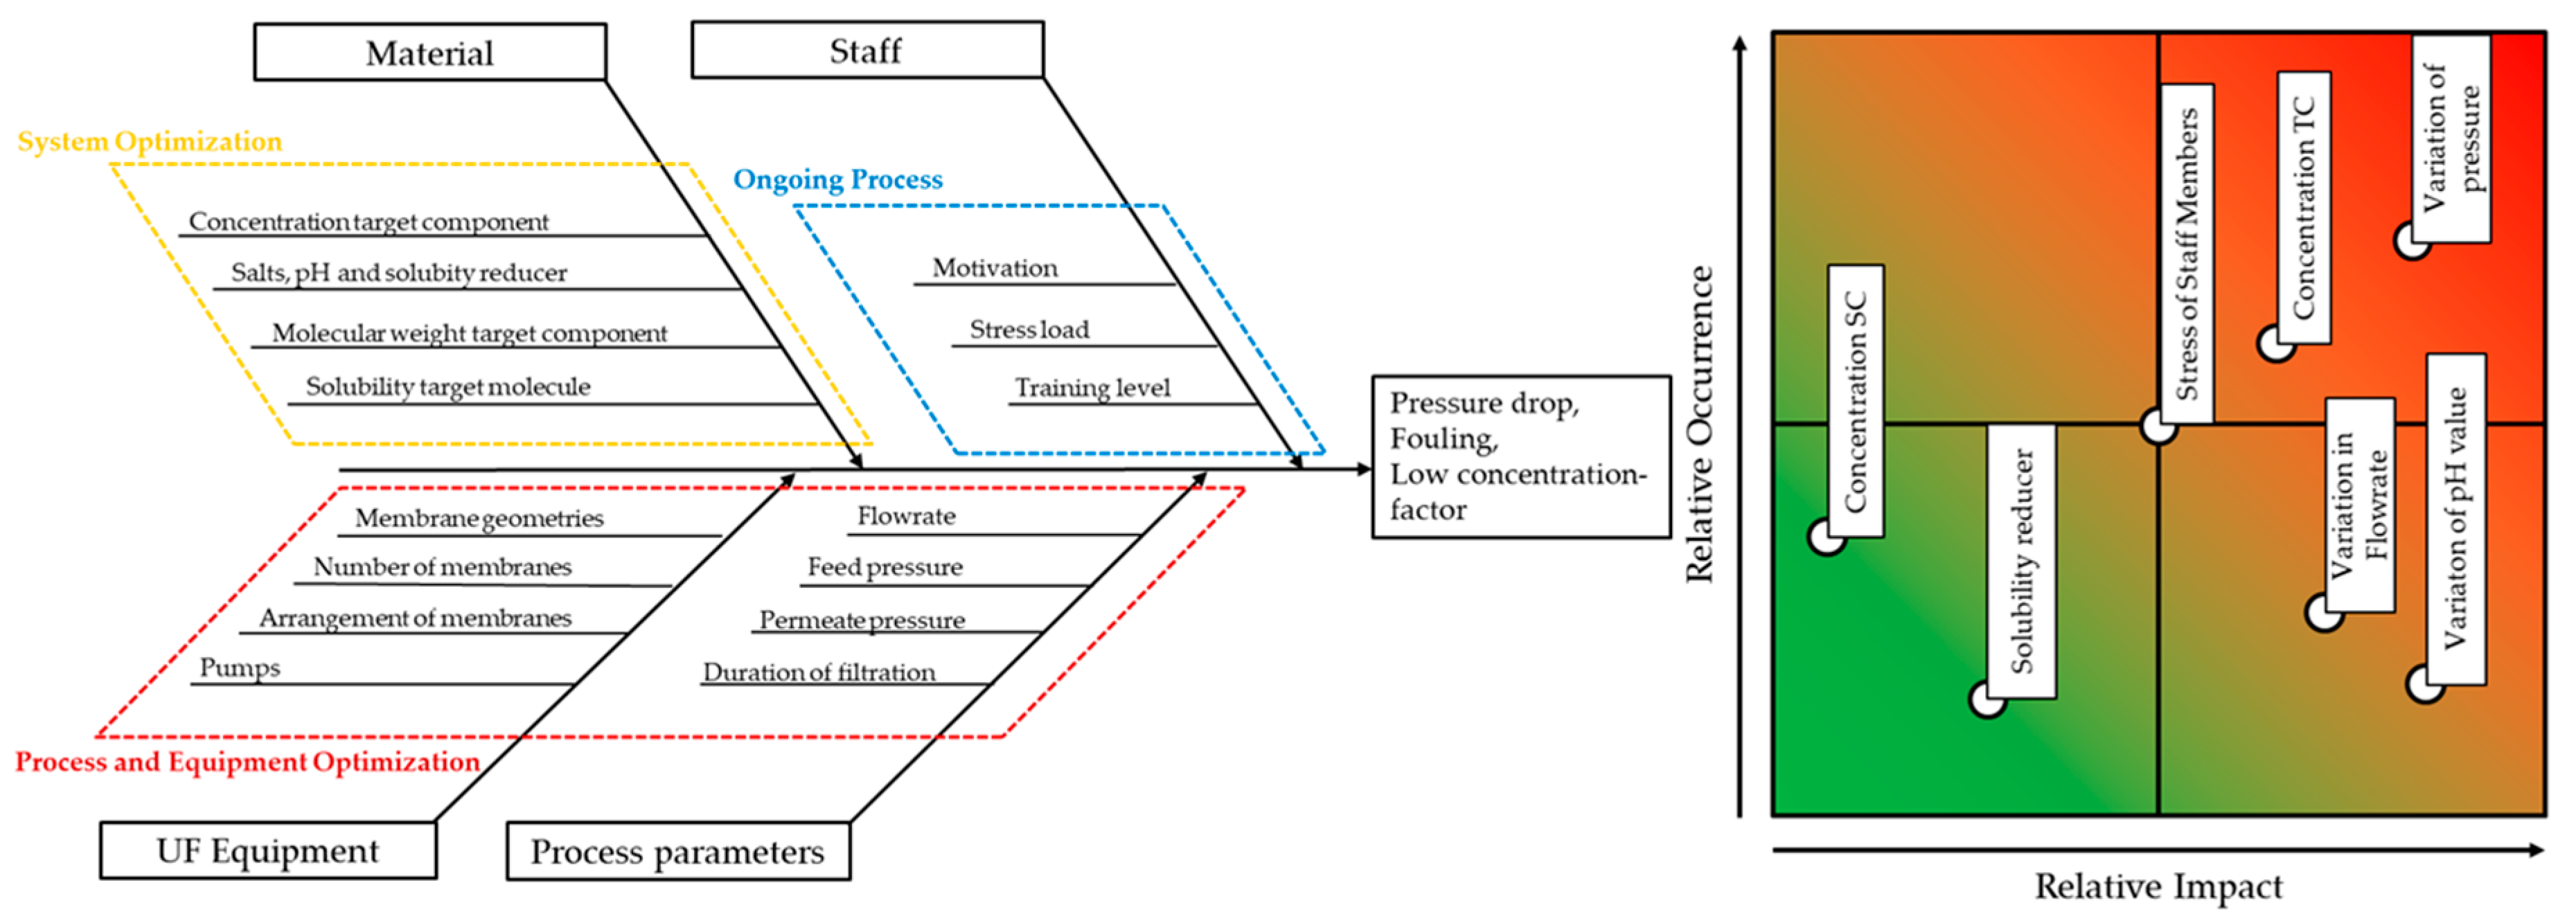
If model accuracy and precision are proven by few experiments, not only optimized assemblies can be developed, but also control strategies can be designed afterwards. For this purpose, the correlations must cover all possible parameters and ensure a stable process point. But at the first step, the critical quality attributes and product profiles have to be defined. Additionally, a risk assessment is required, which can be visualized with aid of Ishikawa diagrams and failure-mode-effect-analysis like shown in
Figure 2. Even though this is not part of the model itself, it is part of the QbD approach. More on, this is helpful to define all necessary variables, which are relevant for position in the process.
While the Ishikawa (or Fish Bone) diagram is a qualitative approach to visualize the influences of the process, the Failure-Mode-Effect-Analysis (FMEA) is more quantitative and sorts relevant effects regarding its occurrence and its impact. In case of continuous ultrafiltration for proteins, the process is mainly influenced by pressure and flowrate. While higher flow rates increase the throughput, they also lead to higher feed pressures and pressure losses. Furthermore, the used equipment sets the boundaries for possible throughput and the used membrane configurations have an impact on the feed pressure resulting from the feed flow. Besides this process optimization, fluctuating pH values or other solubility reducers can affect the stability of the protein and lead to precipitation [
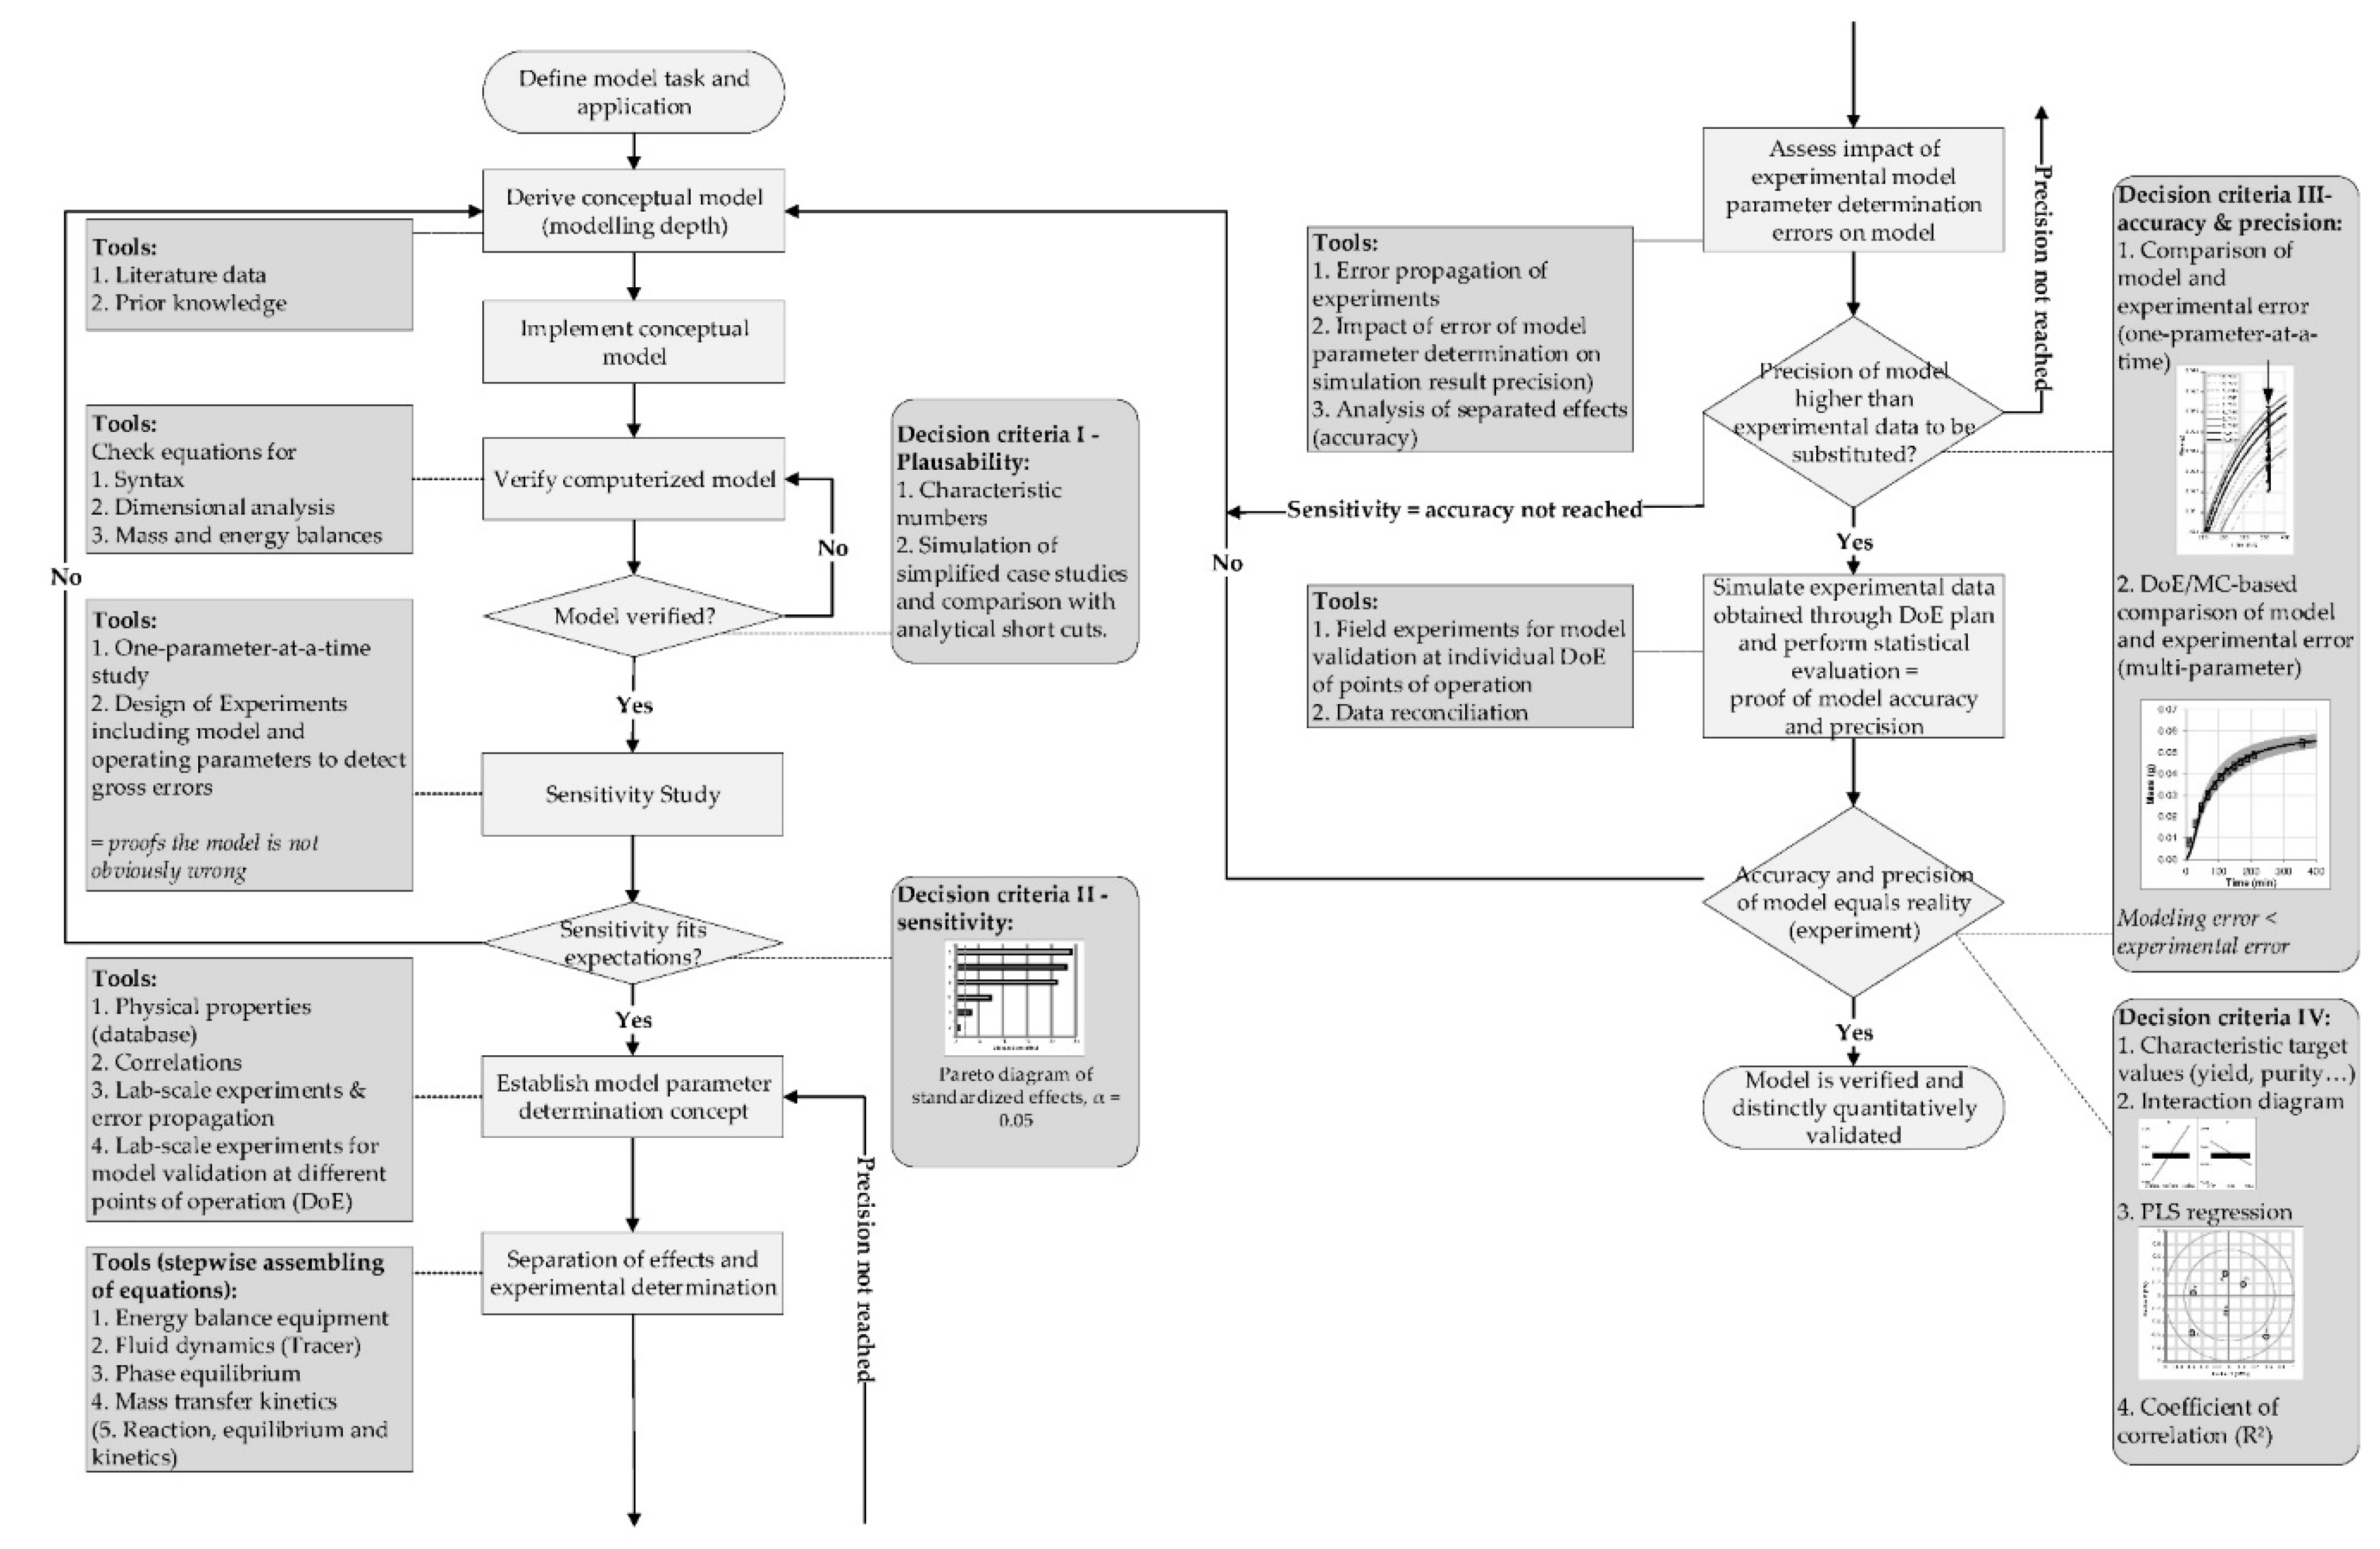
16]. This can result in fouling and reduction of filtration performance, but in a late stage of DSP, this is not likely to occur, which reduces the necessity for this aspect. The general workflow for model development is presented in
Figure 3.
Step 1
At first, the design space has to be defined [
26,
27,
28,
29,
30]. Like mentioned in
Figure 2, ultrafiltration and specifically SPTFF is affected by several influences, like equipment (e.g., cassettes, setup), operating parameters (feed pressure, feed flow) and solution properties (concentration target component (TC), density, viscosity). This design space in return defines the necessary variables that the model must be able to reproduce (for example volumetric concentration factor (VCF) and pressure drop). In the sub sequential procedure, suitable equations have to be found from literature and prior knowledge to fulfill this task. Whether these equations lead to the correct results, can be checked with different approaches, like comparison of results to experimental or literature data. In case of this study, Step 1 is described in the previous study for protein concentrations below 5 g/L, but high viscosities up to 8 m Pas [
1].
Step 2
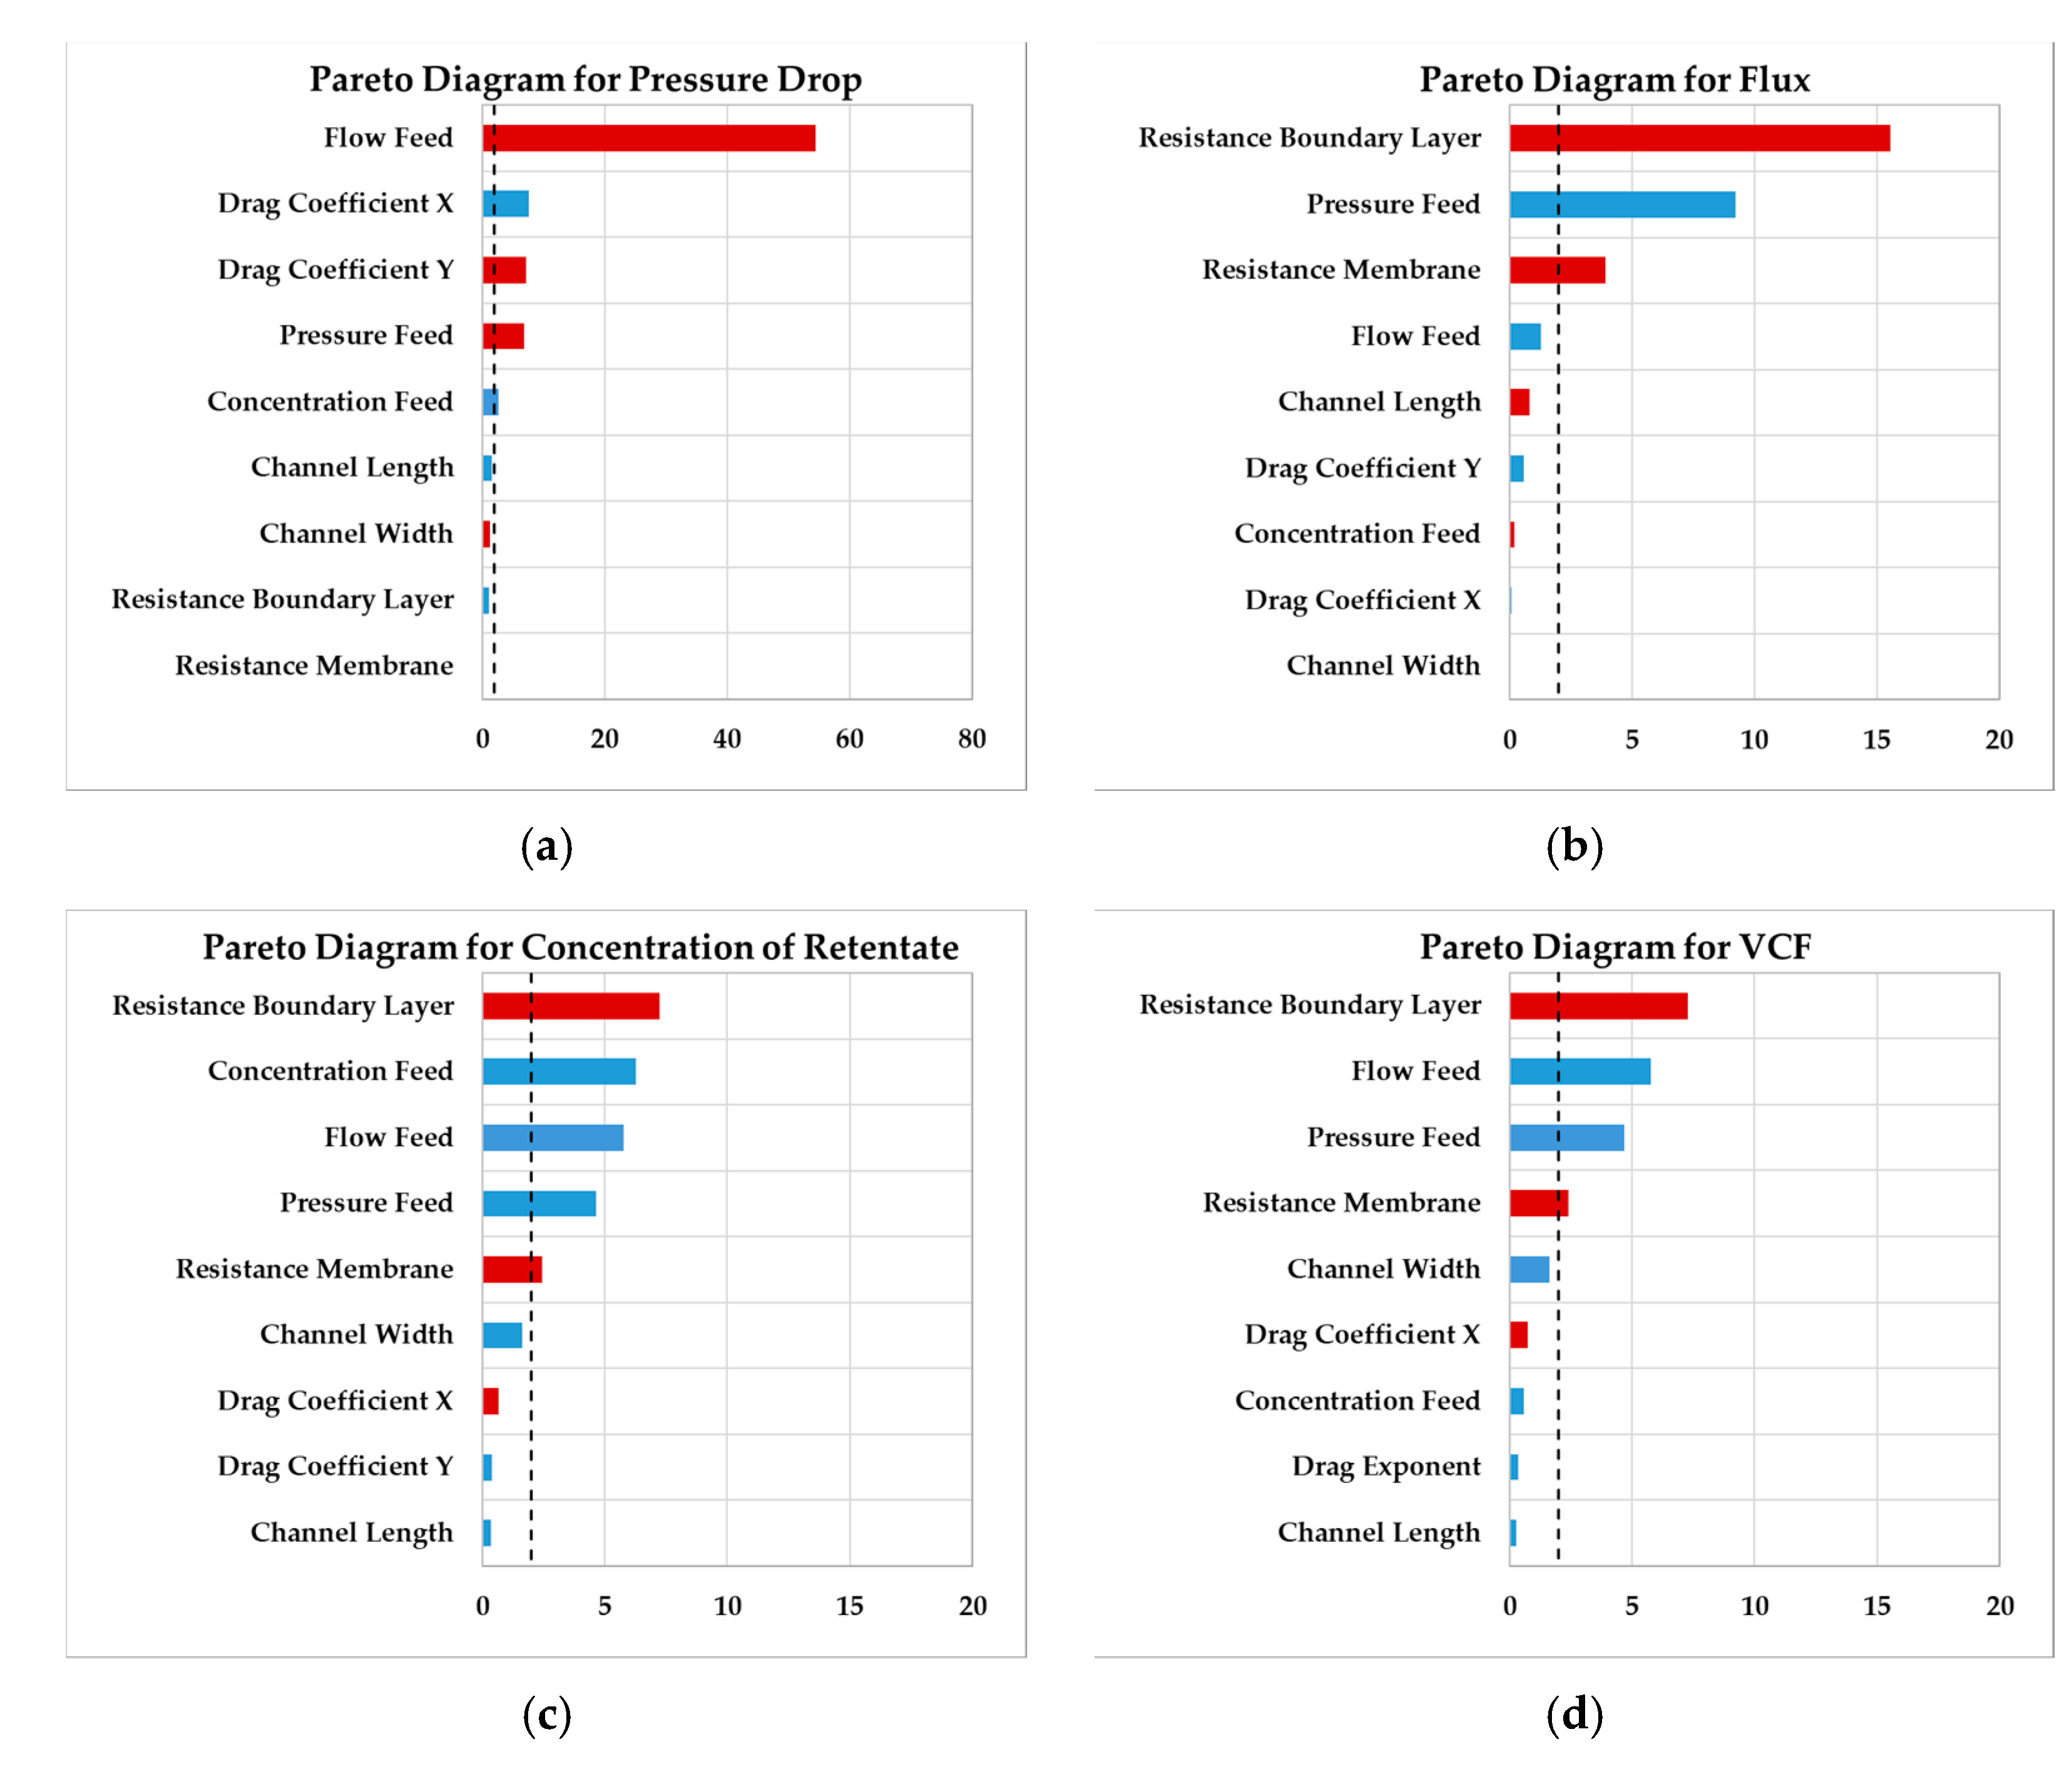
The second decision is based on sensitivity of process parameters. To develop a robust process, the sensitivity of each parameter affecting the unit operation has to be determined. By defining the possible range of the parameters, like design space of operating parameters or tolerances of the cassette, a model-based parameter study can be performed. Since the number of simulations is favorable reduced, statistical analyses of a design-of-experiments (DoE) plan are performed.
By feeding the simulation results into analysis tools, Pareto charts of standardized effects can be generated to visualize significance values. Using this analysis tools, it has to be kept in mind, that it is only valid for the given design space and is not applicable for further use without additional tests.
Step 3
Followed by the sensitivity study, the parameter determination concept is developed. Less significant parameters need a lower accuracy compared to sensitive parameters. The determination concept itself should separate effects so that the model itself becomes more modular. This modular approach allows a greater transferability to other systems. Geometrical properties should be measured first, solution properties in a sequential step [
1].
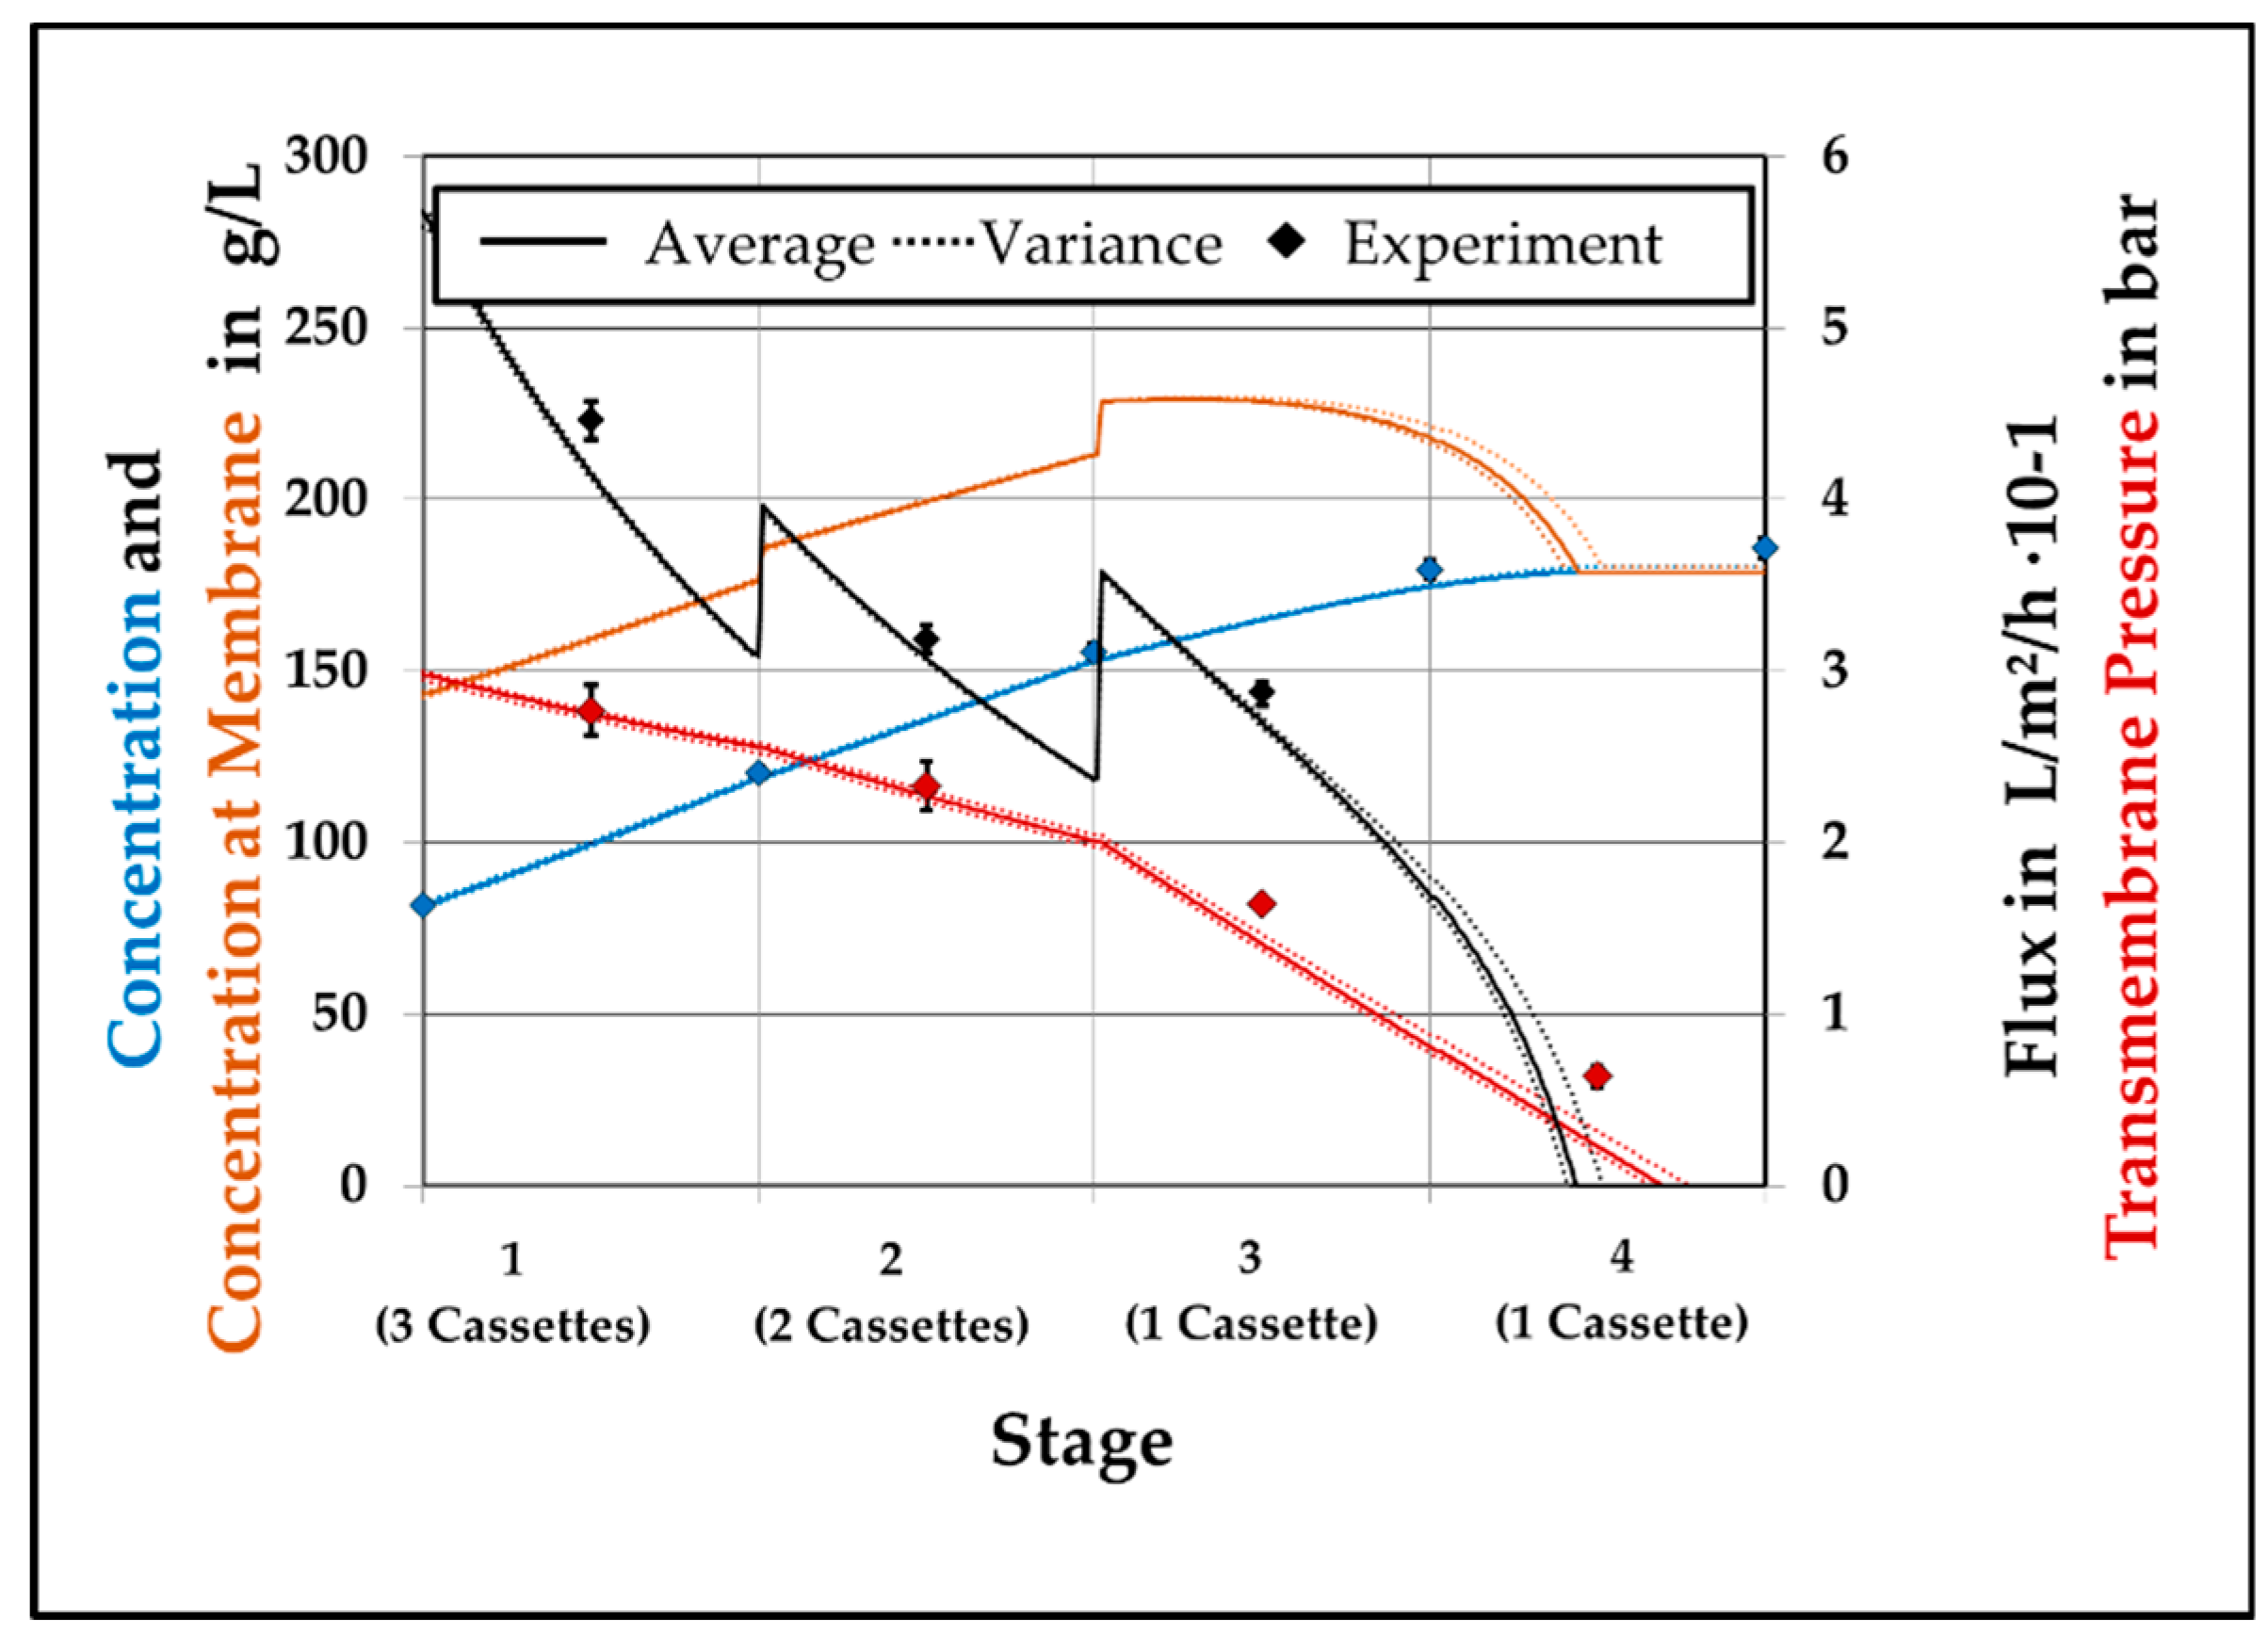
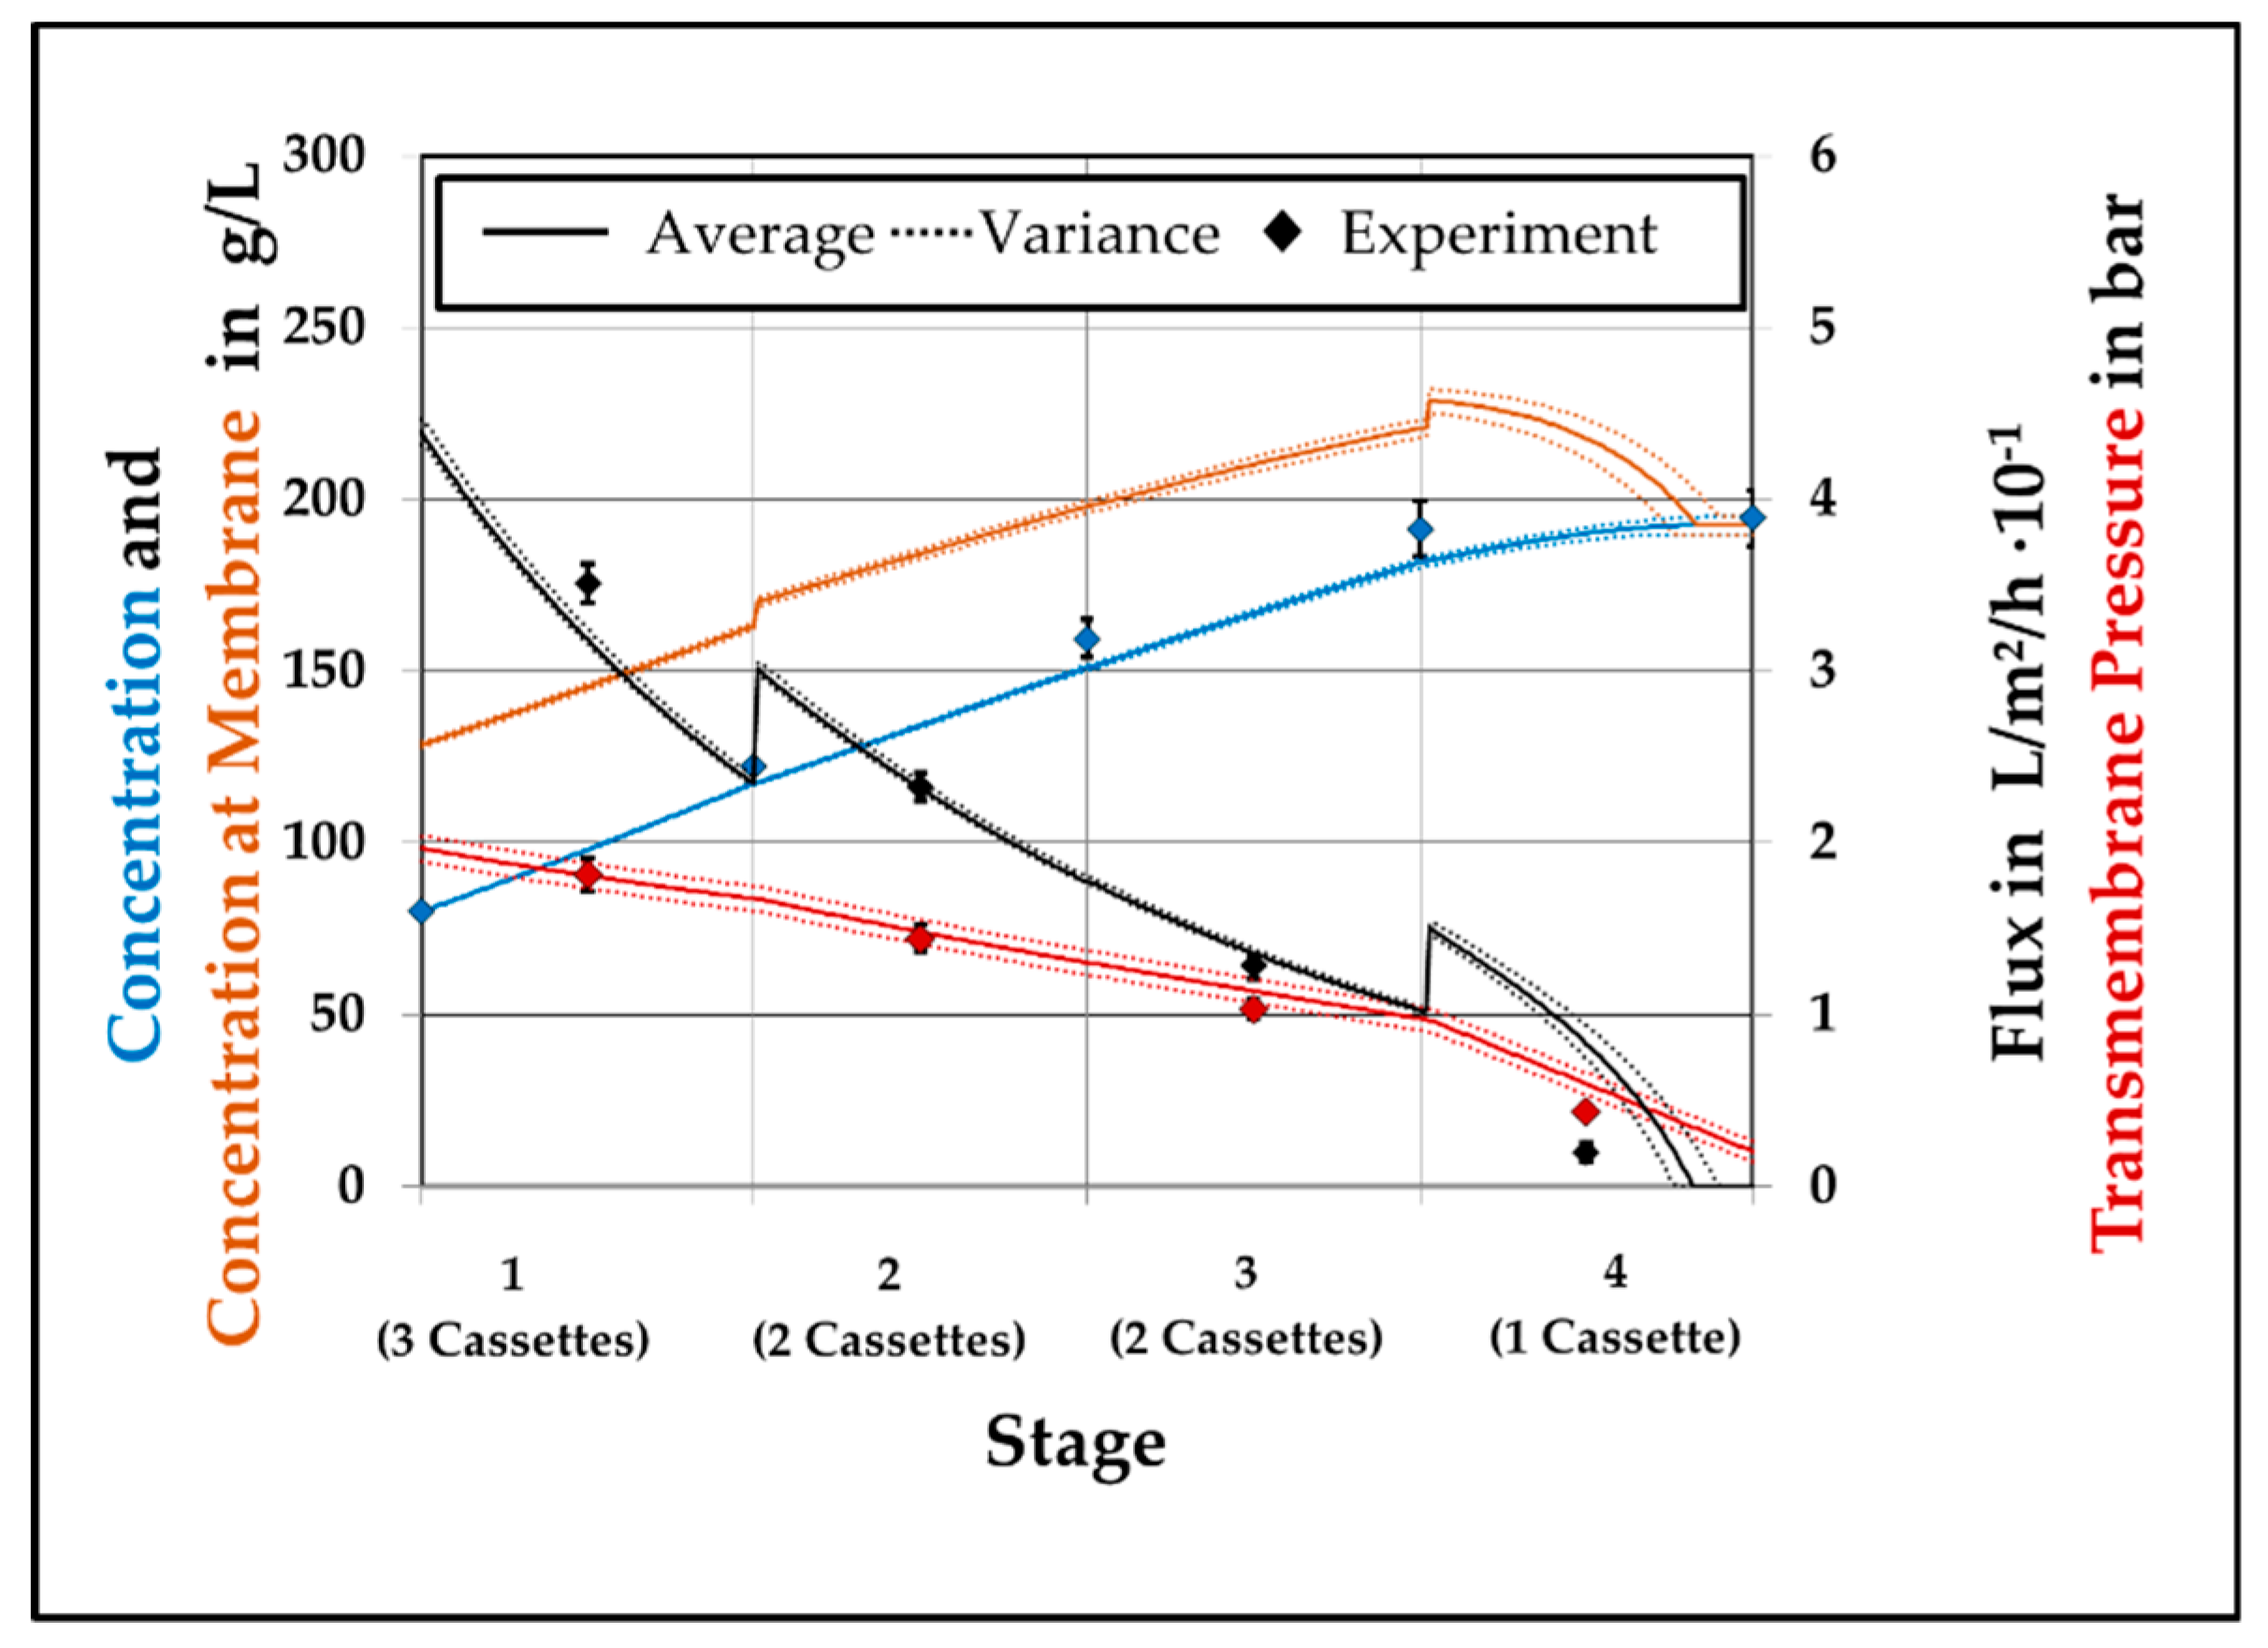
As a next step simulation and experimental results are compared for model validation. While this can be performed for each effect in a final attempt it has to be validated for the whole process step. In case of the researched multi-step SPTFF this also transfers the simulation from single cassettes to parallel and sequential structures. Due to this fact, small variations in the first stage can result in larger deviations in later stages, due to different ingoing parameters.
Step 4
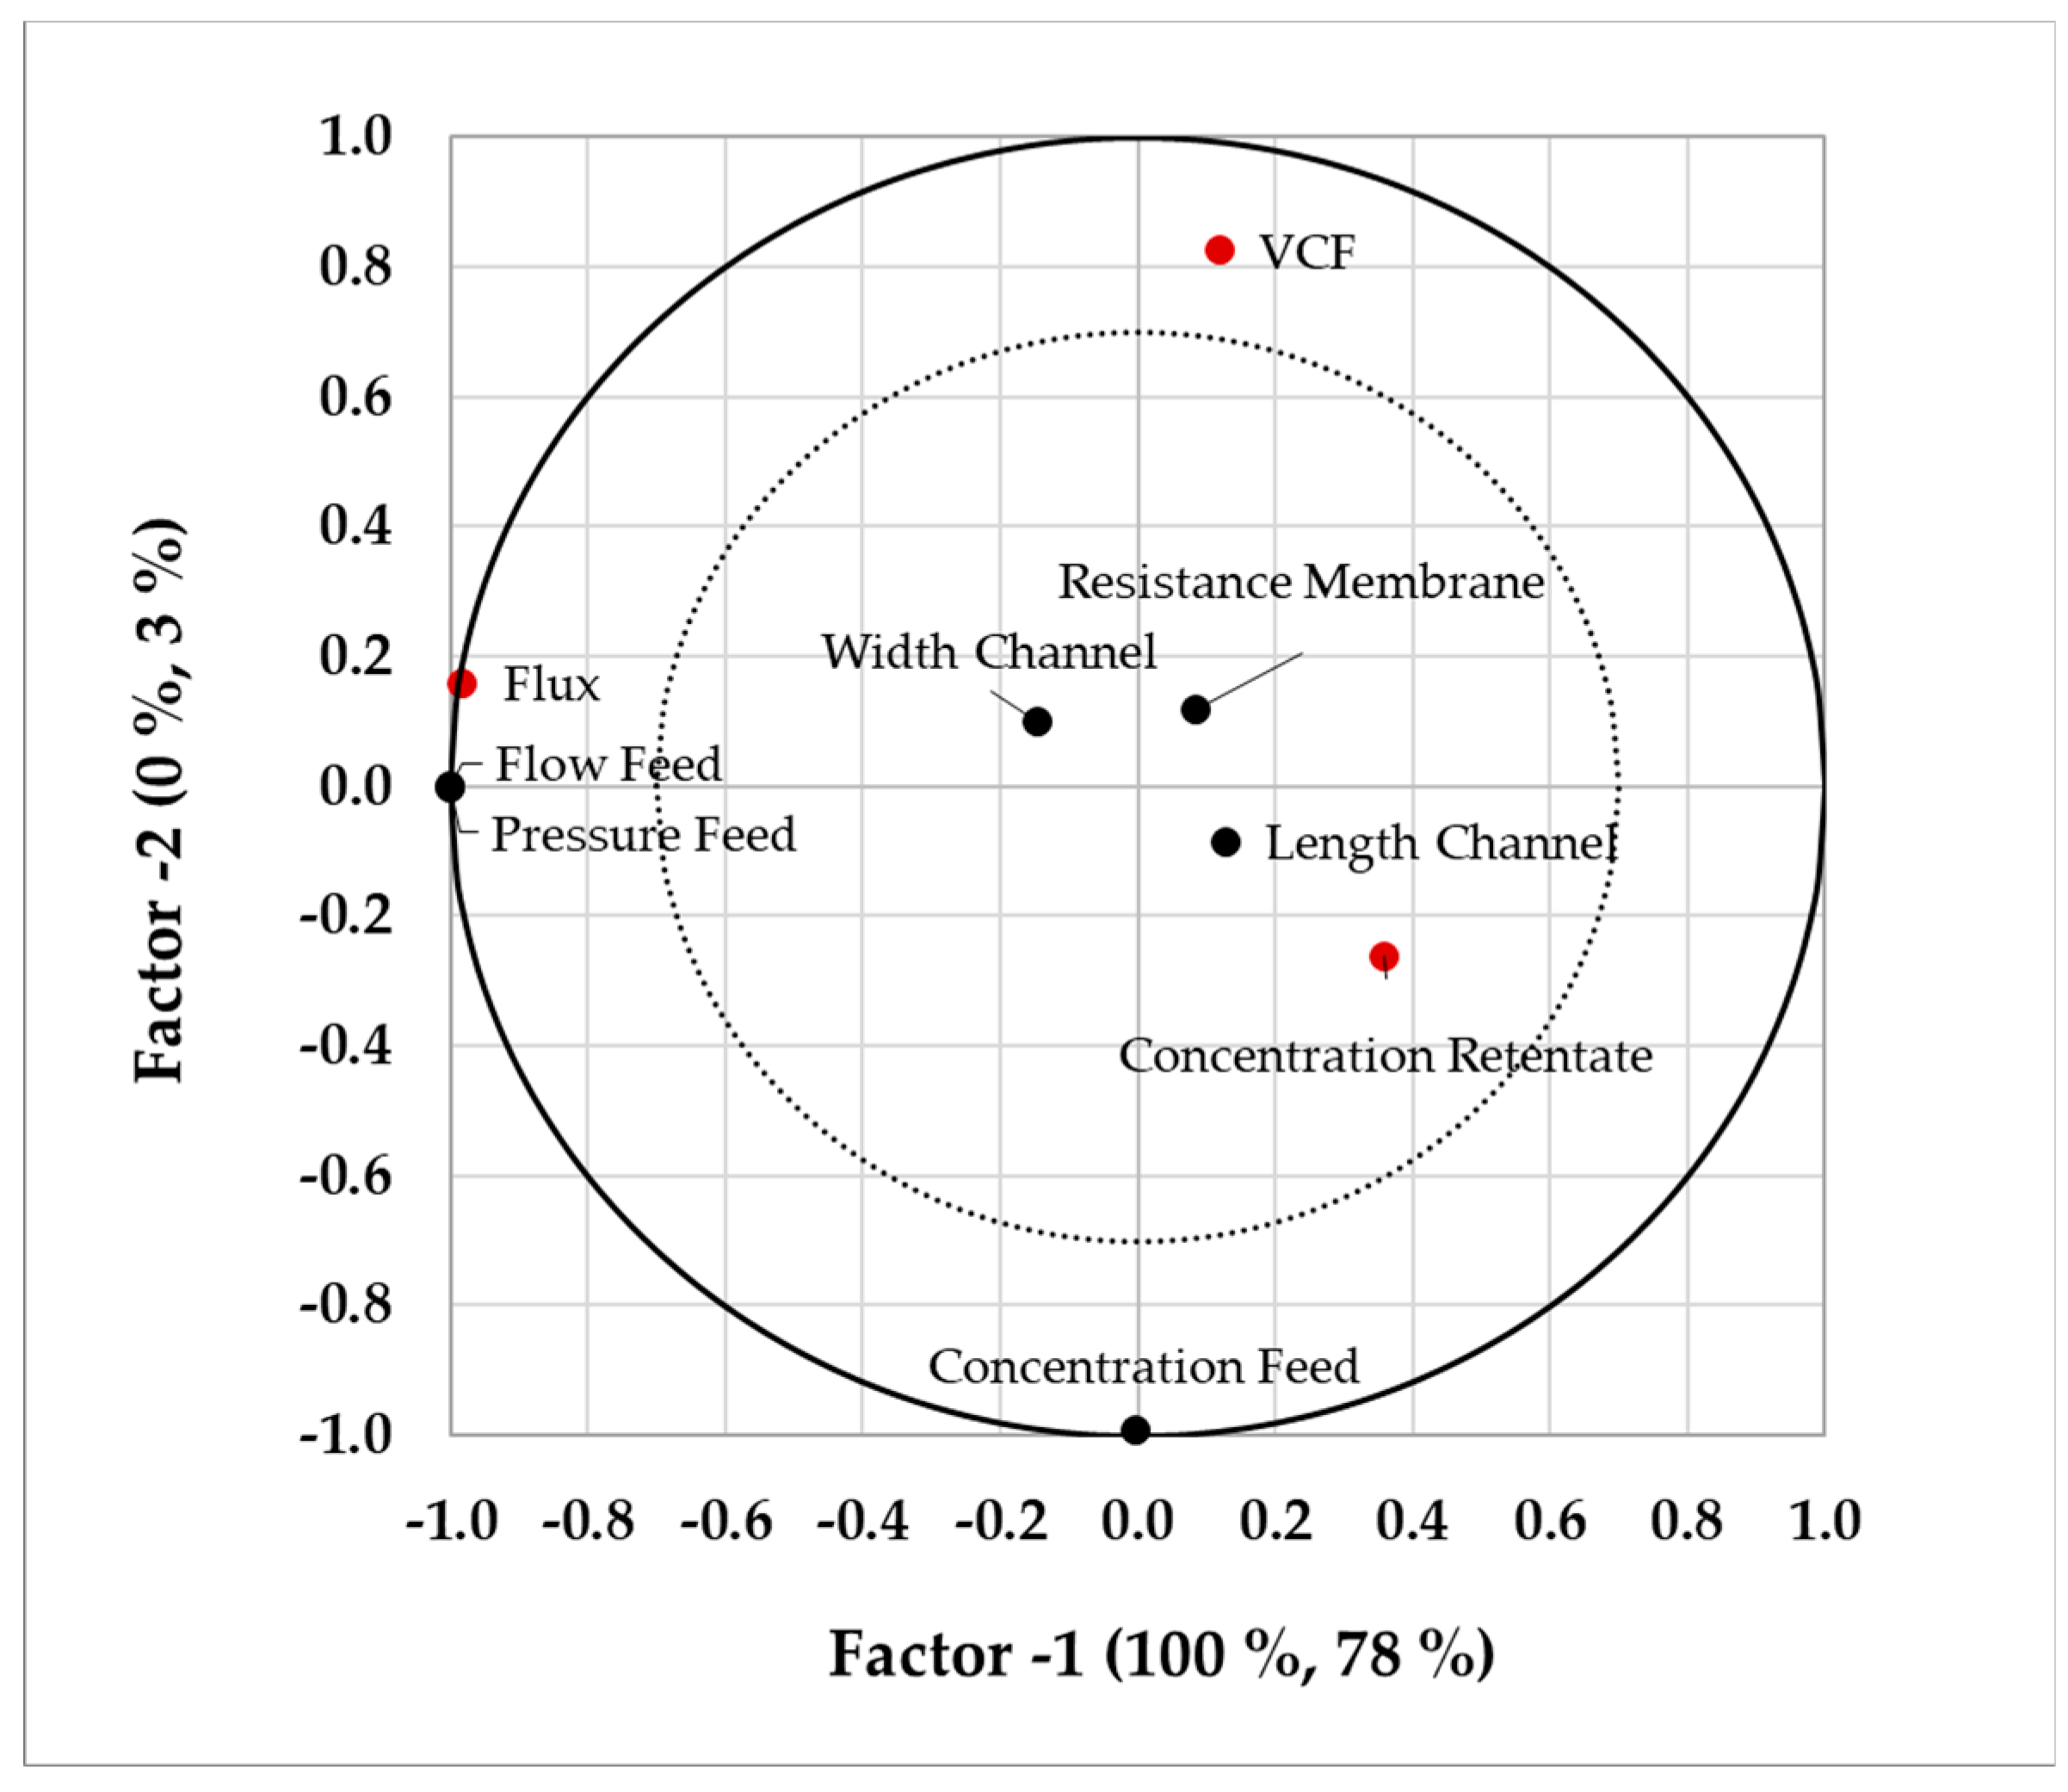
This last step is focused on the optimized operation point. For the performed simulation study, it has to be justified, that these studies are analyzed for the quality and performance attributes. In case of ultrafiltration, for example, concentration of the target protein and flux are target variables. This information, as well as the input parameters and boundaries, are fed into a statistical analysis tool. Partial least square (PLS) regression now helps to identify the correlations between input parameters and target values. Although PLS regression does not find causal relationships, it shows correlating effects. This helps to find critical process parameter and assesses the stability of the operation point.
With concluding these 4 steps, the model itself is verified and validated. Process development for the researched system, can be developed and optimized using the model. Model assisted process development was already performed for different unit operations: solid-liquid (phyto-) extraction [
27], aqueous two-phase extraction of monoclonal antibodies [
26], upstream fermentation of monoclonal antibodies [
29] and chromatographic separation [
30].
With this systematic approach, modelling can reduce experiments and accelerate the process design [
28,
31,
32]. Furthermore, the optimal process parameters for a chosen design can be determined. The used model describes the mass transfer through the channel with a mass balance in which flux through the membrane results in lower velocity of the retentate stream. Furthermore, mass transfer through the membrane is described by using a Boundary Layer Model (BLM). With this model development of pressure, concentration, and flux can be visualized for the optical non-transparent device. With this visualization a process design of ultrafiltration modules becomes more reasonable and in a subsequent step the SPTFF module can be designed a priori. Additionally, the results of the experimental setup are compared to a commercial Cadence™ Single-Pass Tangential-Flow-Filtration Modular Kit.
3. Material & Methods
3.1. Filtration Setup
For experimental work 30 kDa T01 cassettes (Pall, Waltham, MA, USA) with an area of 100 cm2 per cassette and a screen channel were used. Each single membrane and membrane stacks were inserted into membrane holders, with 1/8″ in and outlets. In addition to the stage-separated setup, the results were compared to a Cadence™ SPTFF Modular Kit (Pall, Waltham, MA, USA). For pumping a Quattroflow QF 150 (Almatec, Duisburg, Germany) was used. For both setups 1/8″ tubing was used.
3.2. Media
Each experiment was performed with 5 L of an 80 g/L BSA solution. The value 80 g/L was chosen, assuming the given setup reaches a VCF of at around 2 and therefore a final concentration of 150 g/L is achievable. The protein was dissolved in a 10 mM KPi buffer at a pH value of 7. For clean water resistance tests (CWRT), purified water was acquired with the Sartorius arium® 157 pro (Sartorius®, Gottingen, Germany).
3.3. Analytics
For inline measurements of the divided setup five pressure transmitters AP016 (Autosen, Essen, Germany) were used. In case of the modular kit two of the same kind were applied. The weight development of feed, retentate and all permeate streams were measured with PCE-TB 6 scales (PCE Deutschland GmbH, Meschede, Germany).
3.4. Dataset for Modelling
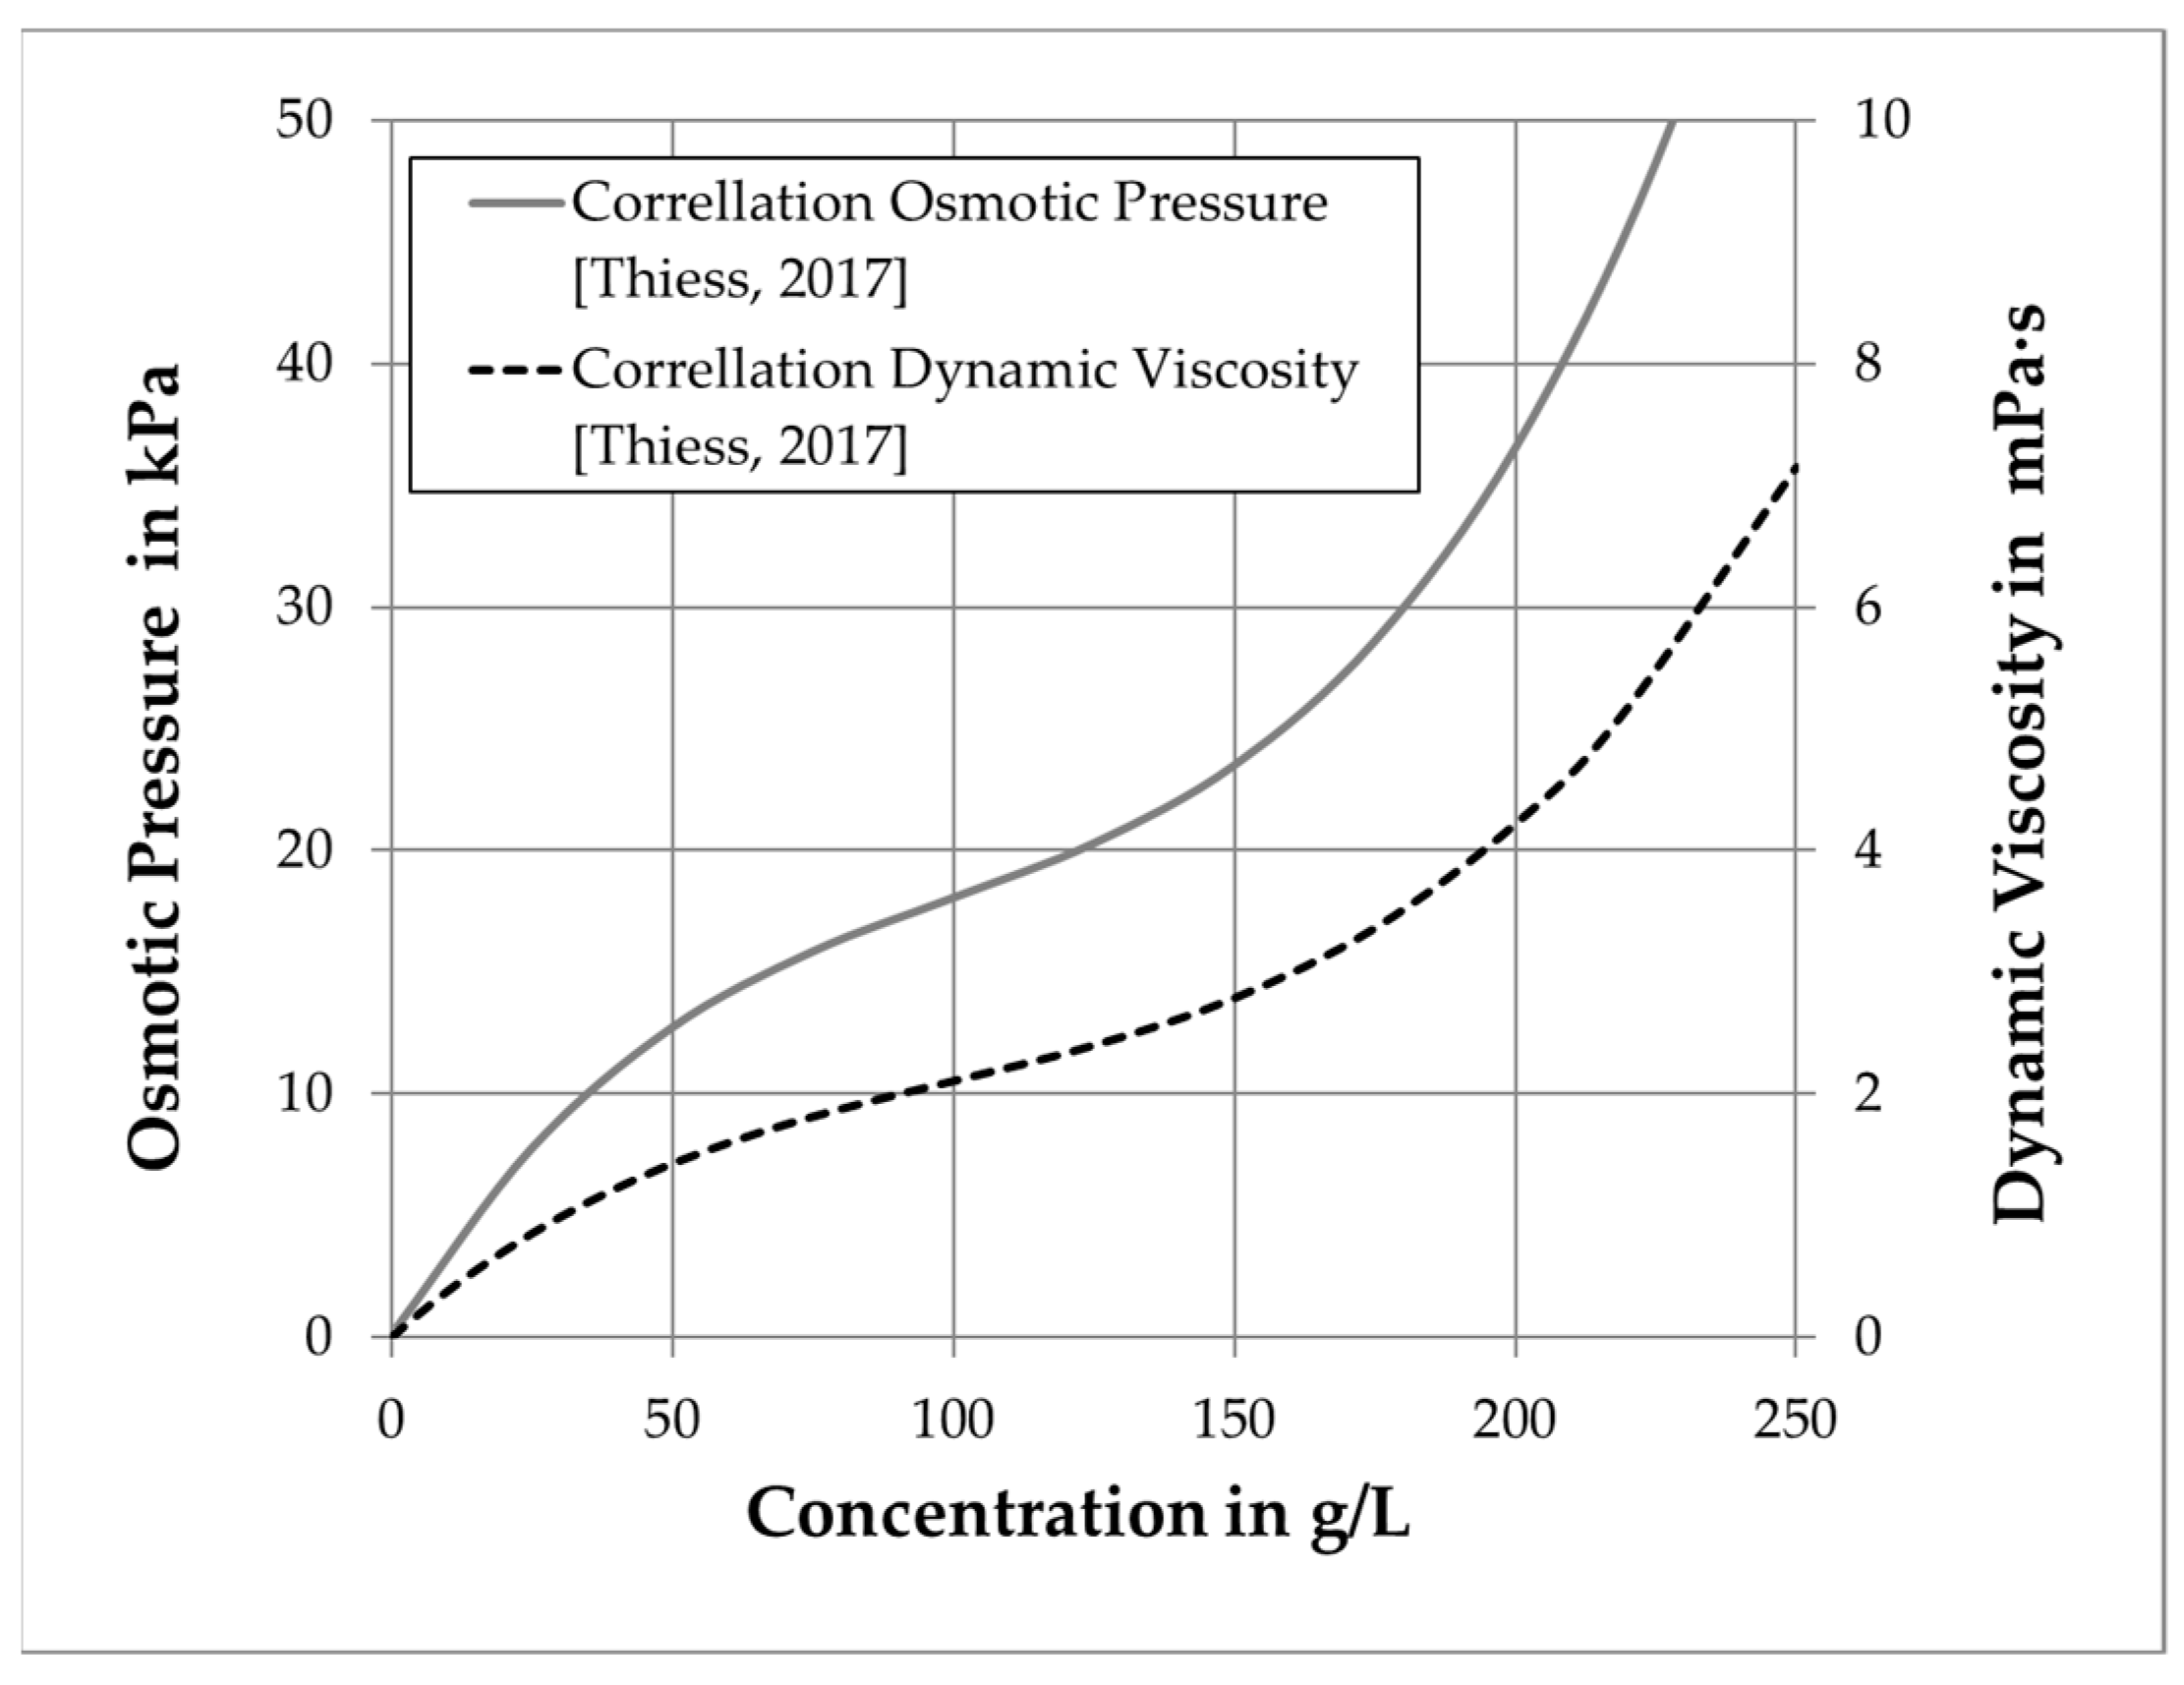
All module related parameters, like geometries, resistances, and drag factors were measured experimentally. Solution properties of the BSA were based on the correlations from [
8].
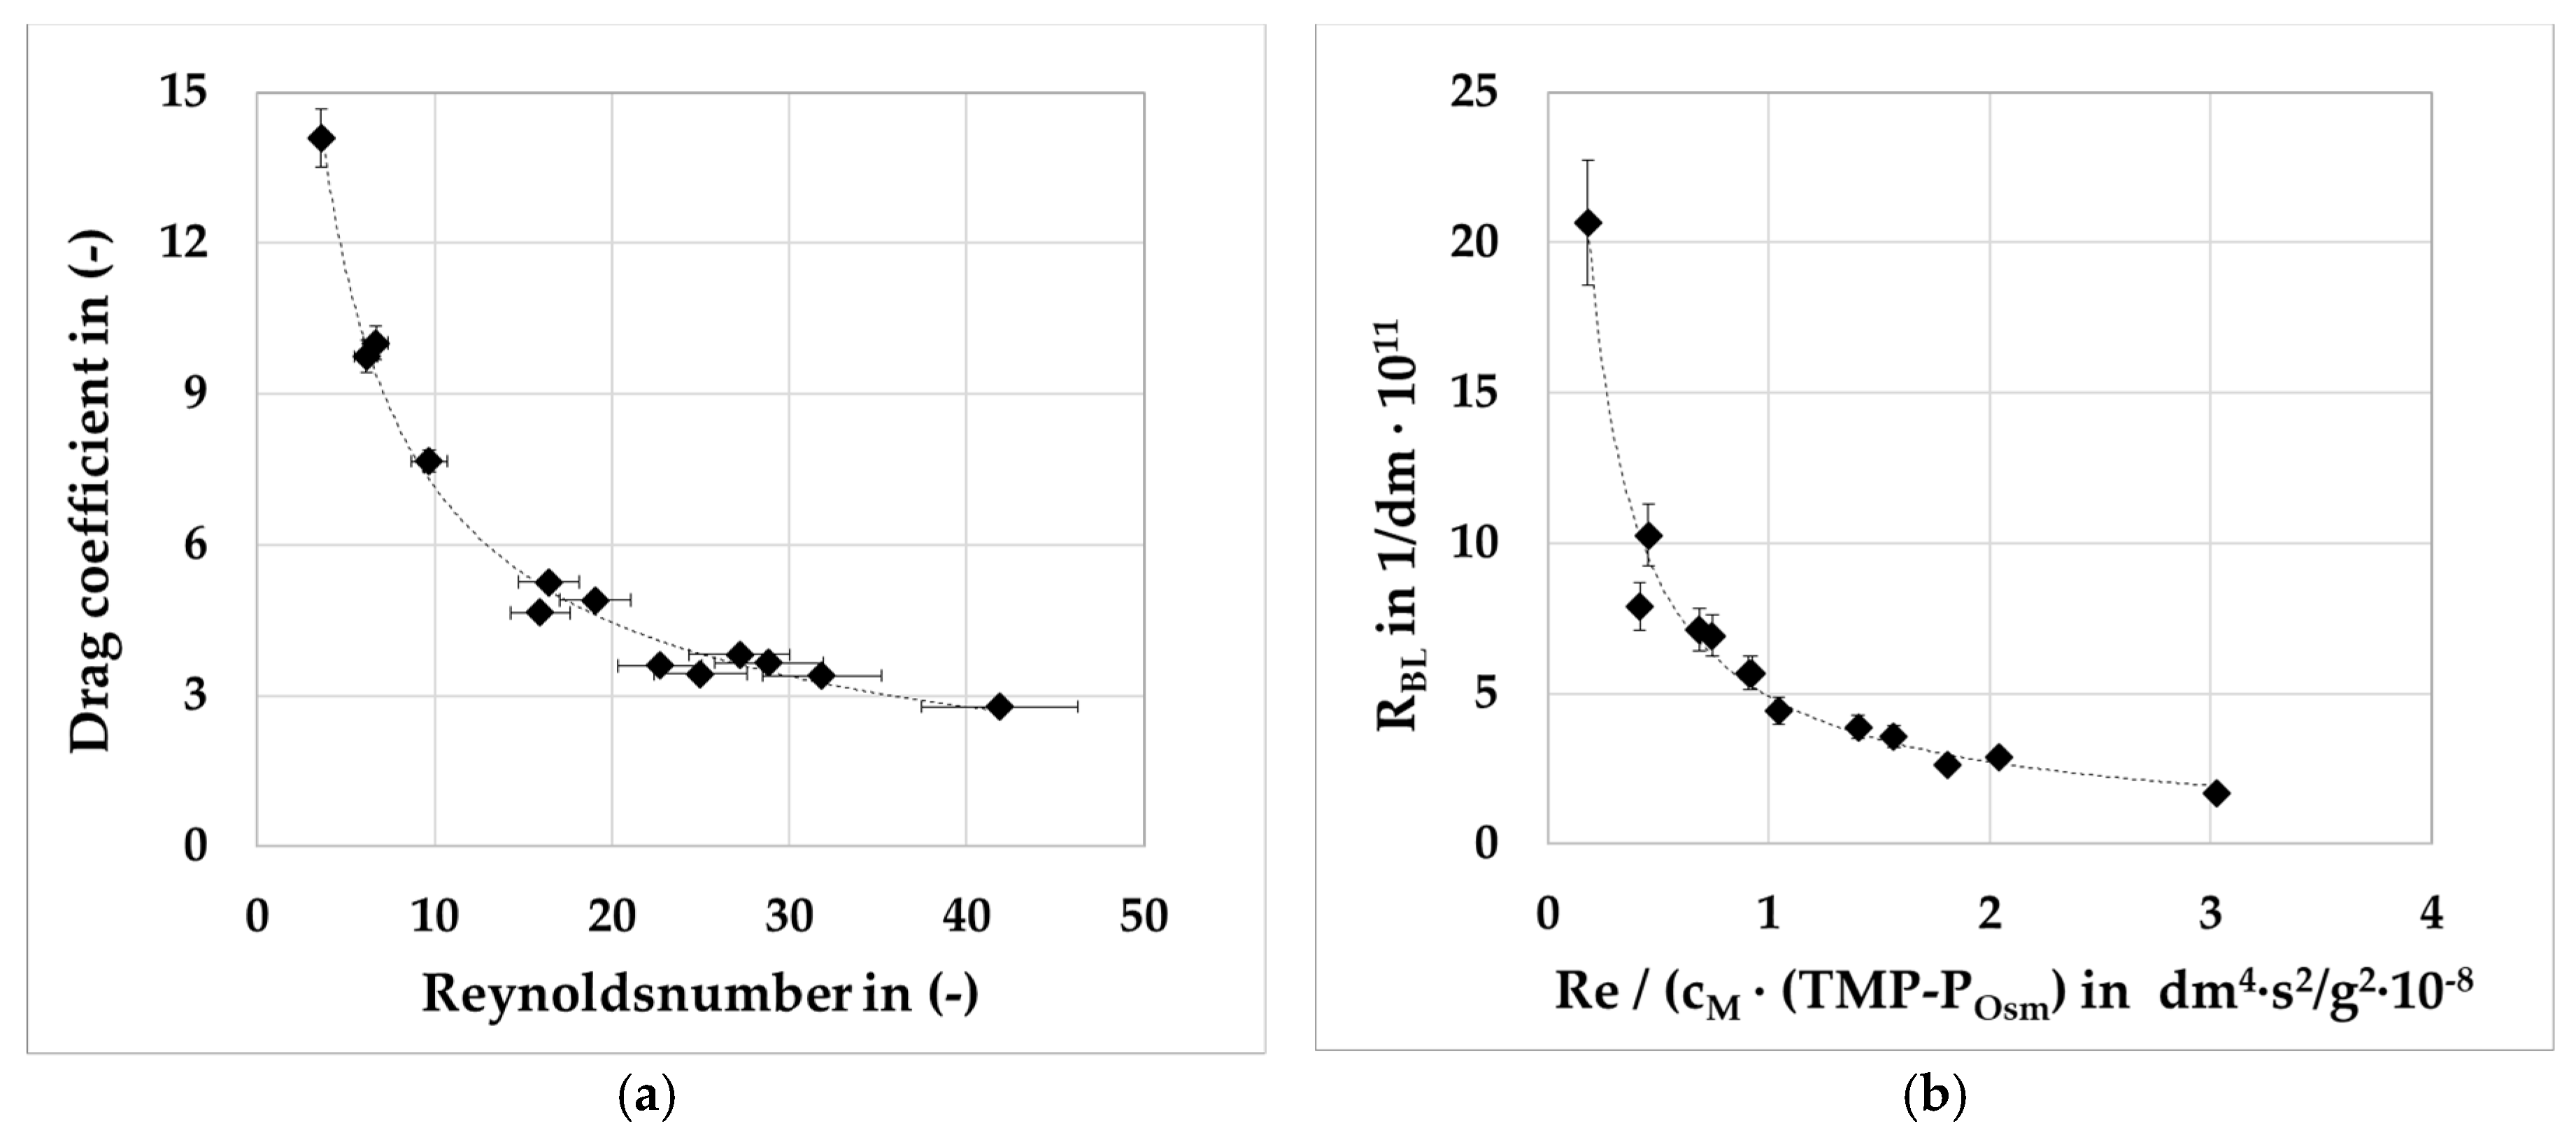
At first, a single cassette had to be measured regarding its geometrical data (Area, hydraulic diameter). Furthermore, its intrinsic membrane resistance (R
Mem) and drag coefficient (c
d) were determined via clean water resistance tests (CWRTs) [
1]. In the following step the 80 g/L BSA solution were filtrated at several transmembrane pressures and flowrates using retentate valves. With information of these experiments R
BL can be determined. The model was built in Aspen Custom Modeler™ (Aspen Tech, Bedford, MA, USA), statistical analysis was performed with JMP (SAS Institute, Cary, NC, USA) and the PLS with Unscrambler
® X (Camo Analytics, Oslo, Norway).
3.5. Design of Experiments
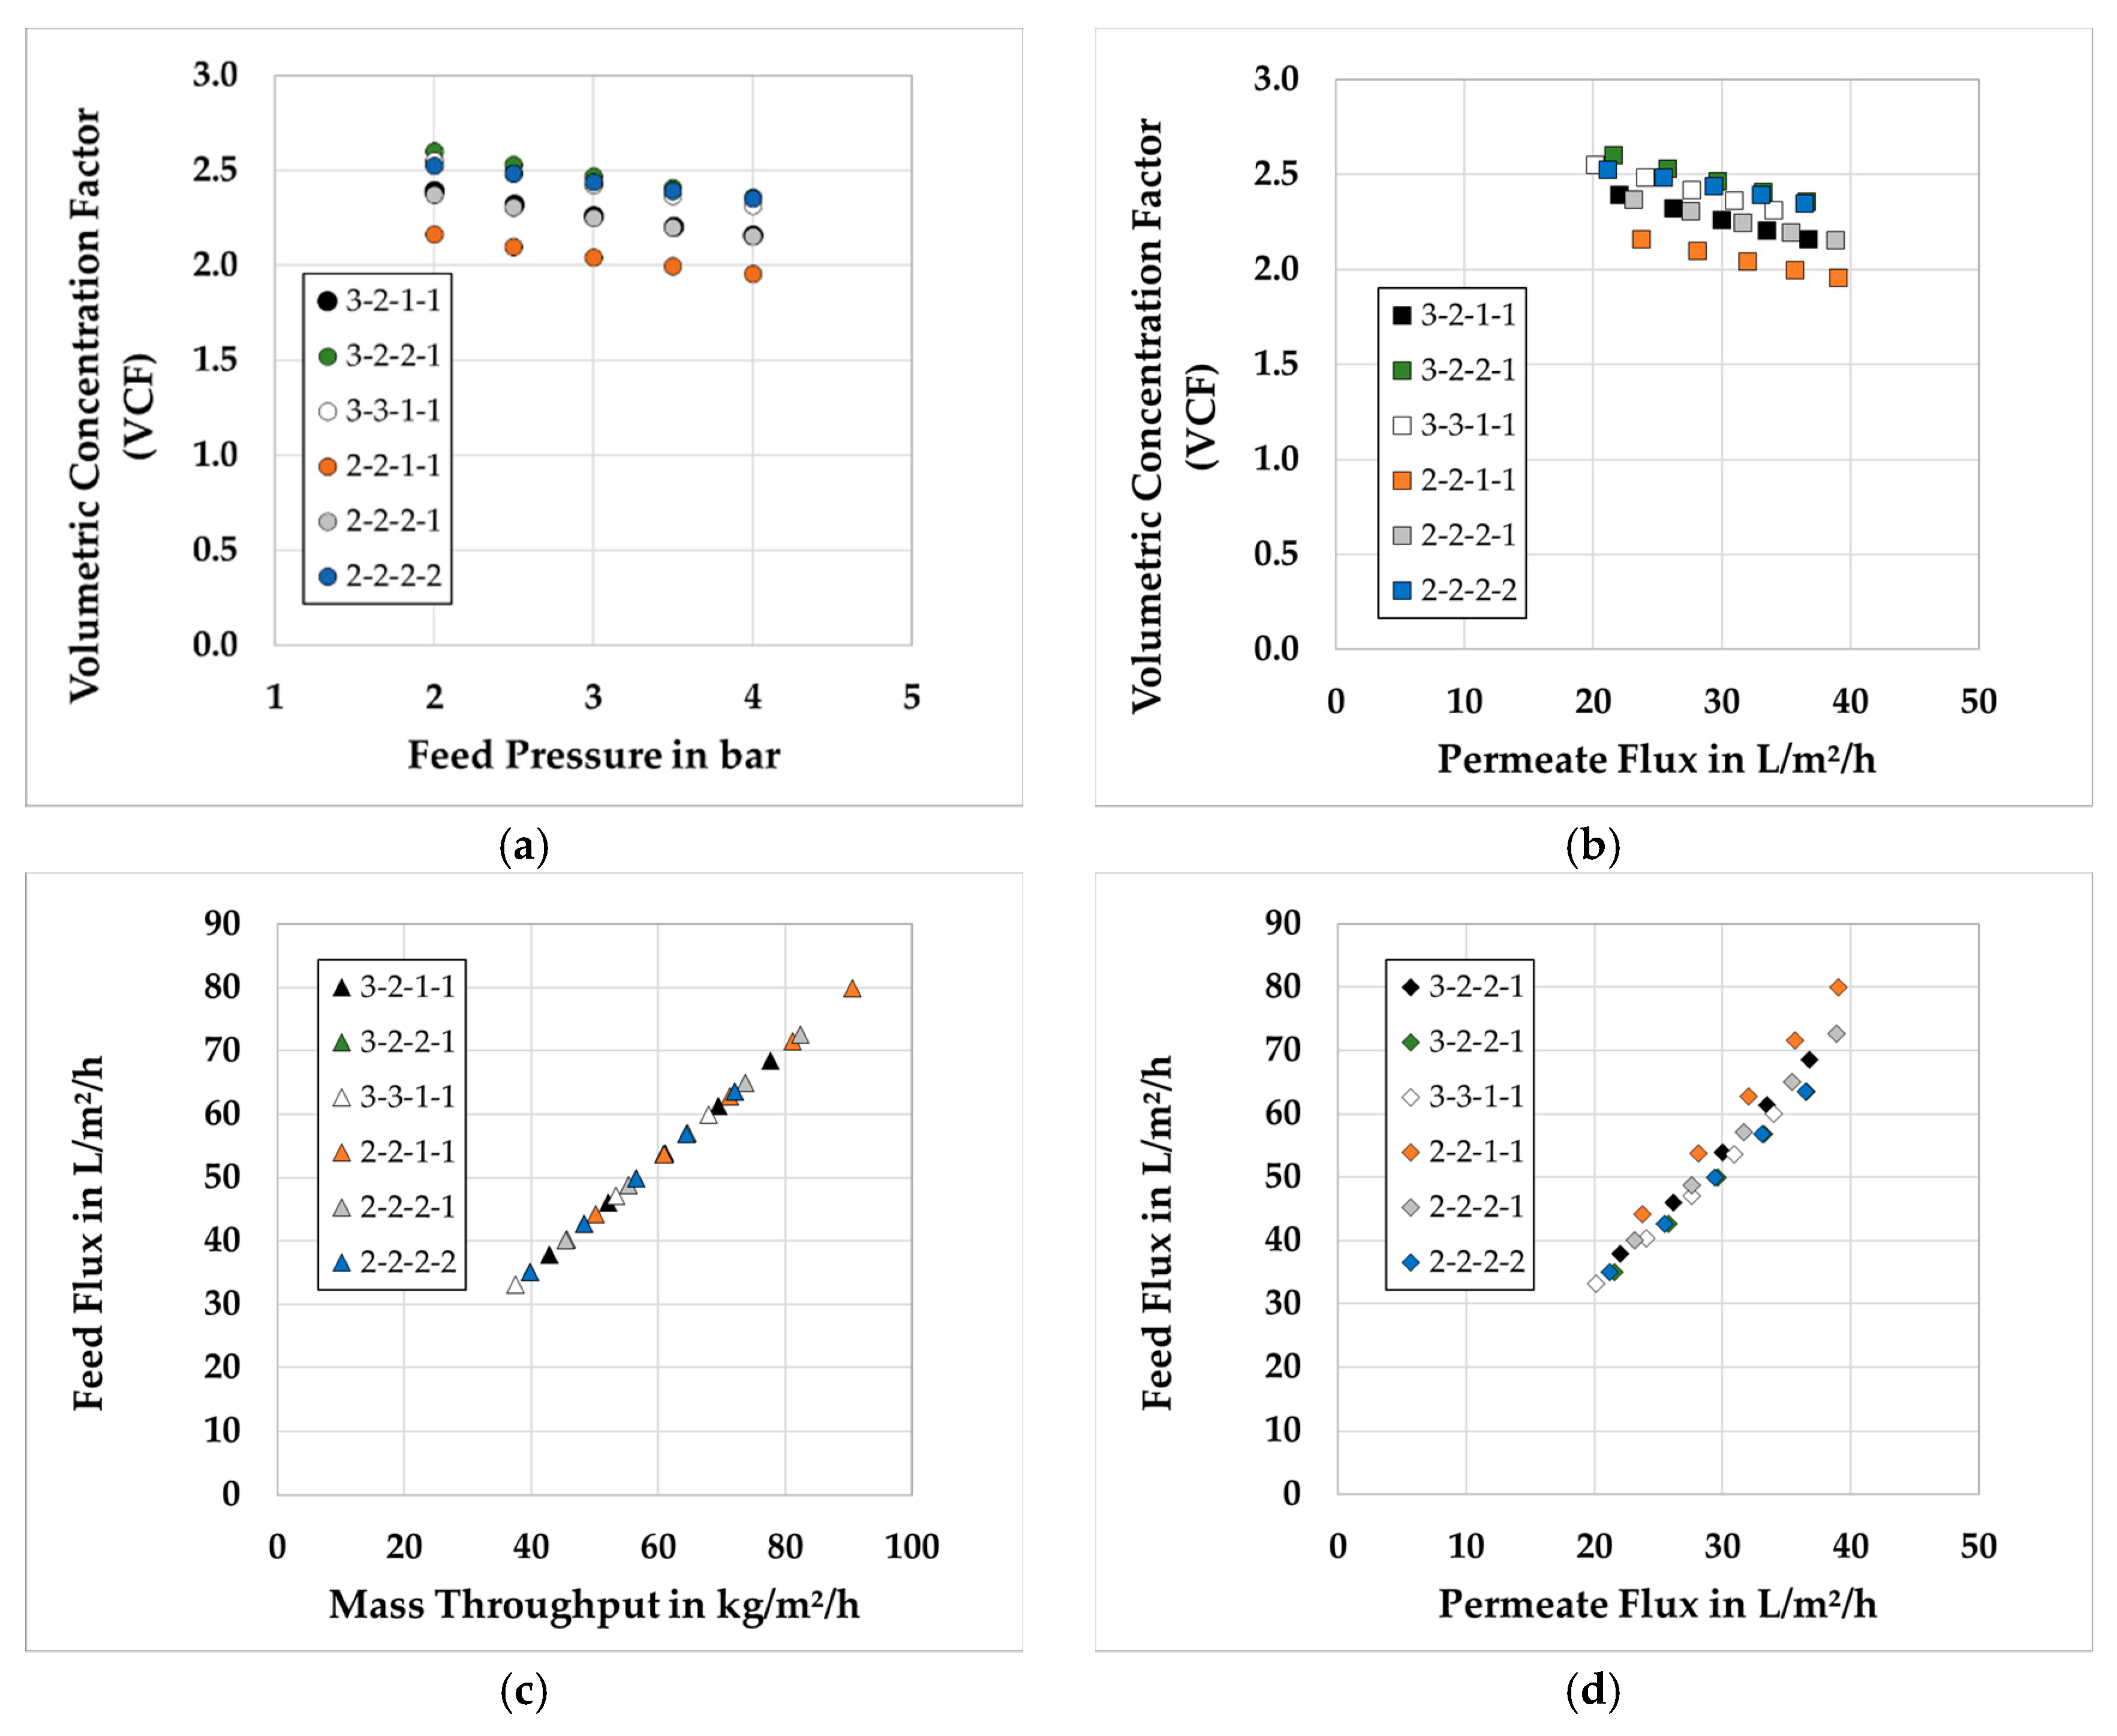
Ultrafiltration setups, like the SPTFF, have several process parameters. On the one hand, there are the geometrical properties (area per cassette, screen geometries) predetermined by the supplier and chosen setup and on the other hand, there are feed flow, feed pressure and temperature. While the type of the cassettes was not varied during this study, the setup of the SPTFF is changeable. Due to temperature sensitivity of the target protein, it is not rational to alter the temperature. In addition, in a laboratory setup feed flow and feed pressure affect each other, which reduces the process parameter to one active parameter. In case of this work feed pressure was chosen. The upper limit was 4 bar, given by the supplier. The lower limit on the other hand, is based on a minimal throughput of around 50 mL/min for the commercial 4-in-series module of Pall and equals 2 bar. For validation of the SPTFF filtration model the center point was performed three times under the same conditions. Each experiment had a duration of 60 min and samples were taken from the retentate in 5 min steps. After each experiment the membranes were cleaned with 0.2 M NaOH and stored in 0.1 M NaOH.
5. Conclusions
This study for modelling a continuous ultrafiltration step showed the possibility to develop a versatile process design and optimization tool for high concentrated protein solutions. By separating the general model into different sub models and divide the membrane model into geometry depending and solution depending properties, accurate predictive simulations can be performed. Like in the previous study [
1] accurate predictions for the VCF are reached with less than 5% divergence to experimental values. It has been shown that for a system without a retentate valve the performance can be increased by adding a second membrane to stage 3 and reducing the feed pressure to 2 bar. In case of the Cadence
® SPTFF Kit a fixed reduction of the cross-sectional area in the end of the module makes an insertion of an additional membrane negligible. As it gets obvious that the TMP should be as low as possible, from a production point of view a compromise between throughput and VCF has to be found. By performing the PLS regression the dependencies are presented and the model is verified.
In order to transfer this approach to diafiltration, the parameter and dependencies for solution-based properties have to be investigated. On the one hand, the development of density and viscosity with concentration can variate and on the other hand RBL and POsm can be altered, too.
As it is presented in this study, it is possible to predict filtration behavior of a complex setup based on single cassette performances with a small amount of experiments. Furthermore, all necessary experiments can be performed with a single cassette and are transferable to complex setups. This enables a process design a priori and reduces possible experimental effort, if the configuration of different stages is changeable.


