Article

Sustainable Design and Engineering: A Relationship Analysis between Digital Destructive and Non-Destructive Testing Process for Lightweight Concrete

1
Department of Civil Engineering, Pakistan Institute of Engineering & Technology, Multan 66000, Pakistan
2
Department of Mechanical Engineering, École de Technologie Supérieure, ÉTS, Montreal, Montréal, QC H3 C 1 K3, Canada
3
Bayreuth Centre for Ecology and Environmental Research, University of Bayreuth, 95440 Bayreuth, Germany
*
Author to whom correspondence should be addressed.
Processes 2019, 7(11), 791; https://doi.org/10.3390/pr7110791
Submission received: 8 July 2019 / Revised: 14 September 2019 / Accepted: 15 October 2019 / Published: 1 November 2019

Abstract

:
The development of sustainable lightweight materials is a promising field solution in this era. The production of sustainable materials by replacing coarse aggregates with some lightweight alternative provides a good quality construction material. In this study, rocky coarse aggregates were replaced by an ultra-lightweight material (i.e., expanded polystyrene beads) to produce an equivalent rock-solid mass of concrete. Using an M15 grade of concrete composition, expanded polystyrene (EPS) beads were added in place of aggregates in amounts ranging from 5% to 40% at a water–cement (w/c) ratio of 0.60. The specimen size as per American Society for Testing and Materials (ASTM) specification was 150 mm in diameter and 300 mm in length. Furthermore, statistical analysis for the relationship study for destructive testing (DT) (i.e., compressive test machine) and non-destructive testing (NDT) (i.e., rebound hammer and ultrasonic pulse velocity (UPV)) has been performed at developed specimens under 7- and 28-day curing conditions. In the end, the results showed that NDT predicts higher compressive strength than that of DT with the addition of EPS beads up to 20% aggregate replacement, after that it is vice versa for up to 40% aggregate replacement. This study will not only help in the production of sustainable lightweight materials, but especially concrete block production can also be performed at a large scale as a sustainable engineering solution.

1. Introduction

Lightweight material production is destined to become a dominant building material in the new era [1]. The basic constituents of concrete are cement, fine aggregate (sand), coarse aggregate, and water [2,3]. Concrete is extremely hard and rigid, and its thermal as well as natural qualities are not very high [4]. With the passage of time, concrete demand in the construction industry has increased. Currently, a large quantity of concrete is employed all over the globe for creating structures like dams, bridges, and multi-story edifices [5]. The density of traditional concrete (regular weight concrete) is 2400 kg/m3 and commonly used for regular routine construction works [6]. Because of the employment of standard concrete, the self-weight of structures is very high, and to resist this load, additional precautions need to be adopted for safe and correct construction [7]. Generally, additional reinforcement has to be provided in structures to resist a load of regular-weight concrete because of long spans, etc. [8].
In multi-story buildings and alfa structures, there is a great amount of self-weight involved that increases the overall load of the structures. Hence, to scale back the self-load of the building, lightweight concrete tends to be used as its self-weight is less compared to traditional-weight concrete [9,10,11,12]. In frame structure construction, bricks and concrete blocks are used as panel walls as the self-weight of the bricks and traditional-weight concrete blocks are so high. Hence, that issue will also increase the overall self-weight of the structure [10]. The expansion of lightweight concrete (LWC) as a structural fabric has become identified as much lower than it was in the Roman regime. However, the creation of light-weight aggregates started out on a larger scale as a result of critical situations. In fact, it is noted within the literature that the earliest sensible use of light-weight concrete declined at that point, once the American Emergency Fleet Corporation designed light-weight concrete ships [13]. The fabrication of light-weight aggregate concretes has been increasing and currently includes every kind of concrete: from no-fines concrete in terms of denseness, especially for block fabrication with densities from 300 to 1200 kg/m3, to structural concrete with densities from 1000 to 2000 kg/m3 and compressive strengths from 1 to 100 MPa [14]. Another study shows that LWC has an oven-dry density ranging from 300–2000 kg/m3 [15].
Lightweight concretes exhibit ideal aspects like lesser density, greater specific strength, superior thermal insulation, and superior energy absorption, which can be obtained by exchanging standard aggregates fully or partially with lightweight aggregates [16,17]. The density of lightweight concrete made with EPS beads ranges from 1700–2100 kg/m3 [3]. Lightweight aggregates are largely categorized into binary groups: natural (pumice, diatomite, volcanic cinders, etc.) and artificial (perlite, clay, sintered fly ash, expanded shale, etc.) [18]. Expanded polystyrene beads (EPS-beads) are a variety of synthetic ultra-lightweight aggregates with solidity of only 10–30 kg/m3 [19,20]. EPS-beads are very light-weight and their thermal and other physical properties are very good [21,22]. A lot of researchers experimentally and analytically study the behavior of EPS-beads lightweight concrete and also their thermal and other important parameters [23]. Lightweight EPS-beads-based concrete has been found to be suitable for lightweight sandwich wall panels [24]. The resistance and durability of the concrete are supposed to be the main essential characteristics that are needed in concrete [25]. While observing efficiency for energy absorption, these EPS-based buffering materials show similar behavior like concrete developed with flexible aggregates [26]. The compressive strength of concrete at the age of 28 days is also used to distinguish the mechanical properties of concrete [27]. Two sorts of tests are used to analyze the mechanical properties of concrete: destructive and non-destructive tests [28]. The results from destructive testing are very helpful to judge the real picture of specimen parameters. On the other hand, non-destructive testing is very helpful to know about the characteristics of both new and old structure elements without breaking the elements [29]. However, the results obtained from this type of testing are not very accurate or helpful to analyze the exact picture of structural elements [30]. With the help of non-destructive techniques, the in-situ strength of concrete can be measured in an easy and rapid manner [31]. Various countries have shown interest in the application of non-destructive testing (NDT) in civil engineering, particularly in predicting concrete compression strength without damaging the structure [32,33]. Once the structures are tested, their lifespan is foreseen, and therefore plans for their preservation become less difficult and cost-effective [34,35]. The destructive test, compressive strength test, non-destructive test, ultrasonic pulse velocity test, and rebound hammer test were performed on standard cylinder specimens to explore their mechanical properties.
In this experimental work, the following parameters like compressive strength, density, % age replacement of rocky coarse aggregates with EPS-beads, curing period, dynamic modulus of elasticity, pulse velocity, concrete quality, and rebound number have been studied. The paper presents a comparison between two different approaches and types of analysis after experimental tests in order to characterize an ultra-lightweight material with the addition of EPS-beads. Both destructive and non-destructive tests were performed on a standard specimen. In the end, a relationship between these parameters through a statistical regression model will be developed and a graphical representation will be plotted to understand the range utilization for produced lightweight concrete as well.

2. Materials and Methods

2.1. Materials

The basic material involved in the preparation of EPS-beads lightweight concrete involves cement, fine aggregate, coarse aggregate, and EPS beads.

2.1.1. Cement

Ordinary Portland Cement Grade 53 of Type-1 according to ASTM C-150 provisions [36] has been used. The chemical and physical properties of cement are shown in Table 1 and Table 2.

2.1.2. Fine Aggregate

The extreme size of the fine aggregate is 4.75 mm. The physical properties are shown in Table 3 and grain size distribution (sieve) analysis shown in Figure 1.

2.1.3. Coarse Aggregate

A well-graded crushed coarse aggregate maximum size of 20 mm is used for EPS-beads lightweight concrete specimens casting, and their physical properties are shown in Table 4. Also, these aggregates contain both calcareous and siliceous content. The grain size distribution (sieve) analysis is shown in Figure 2.

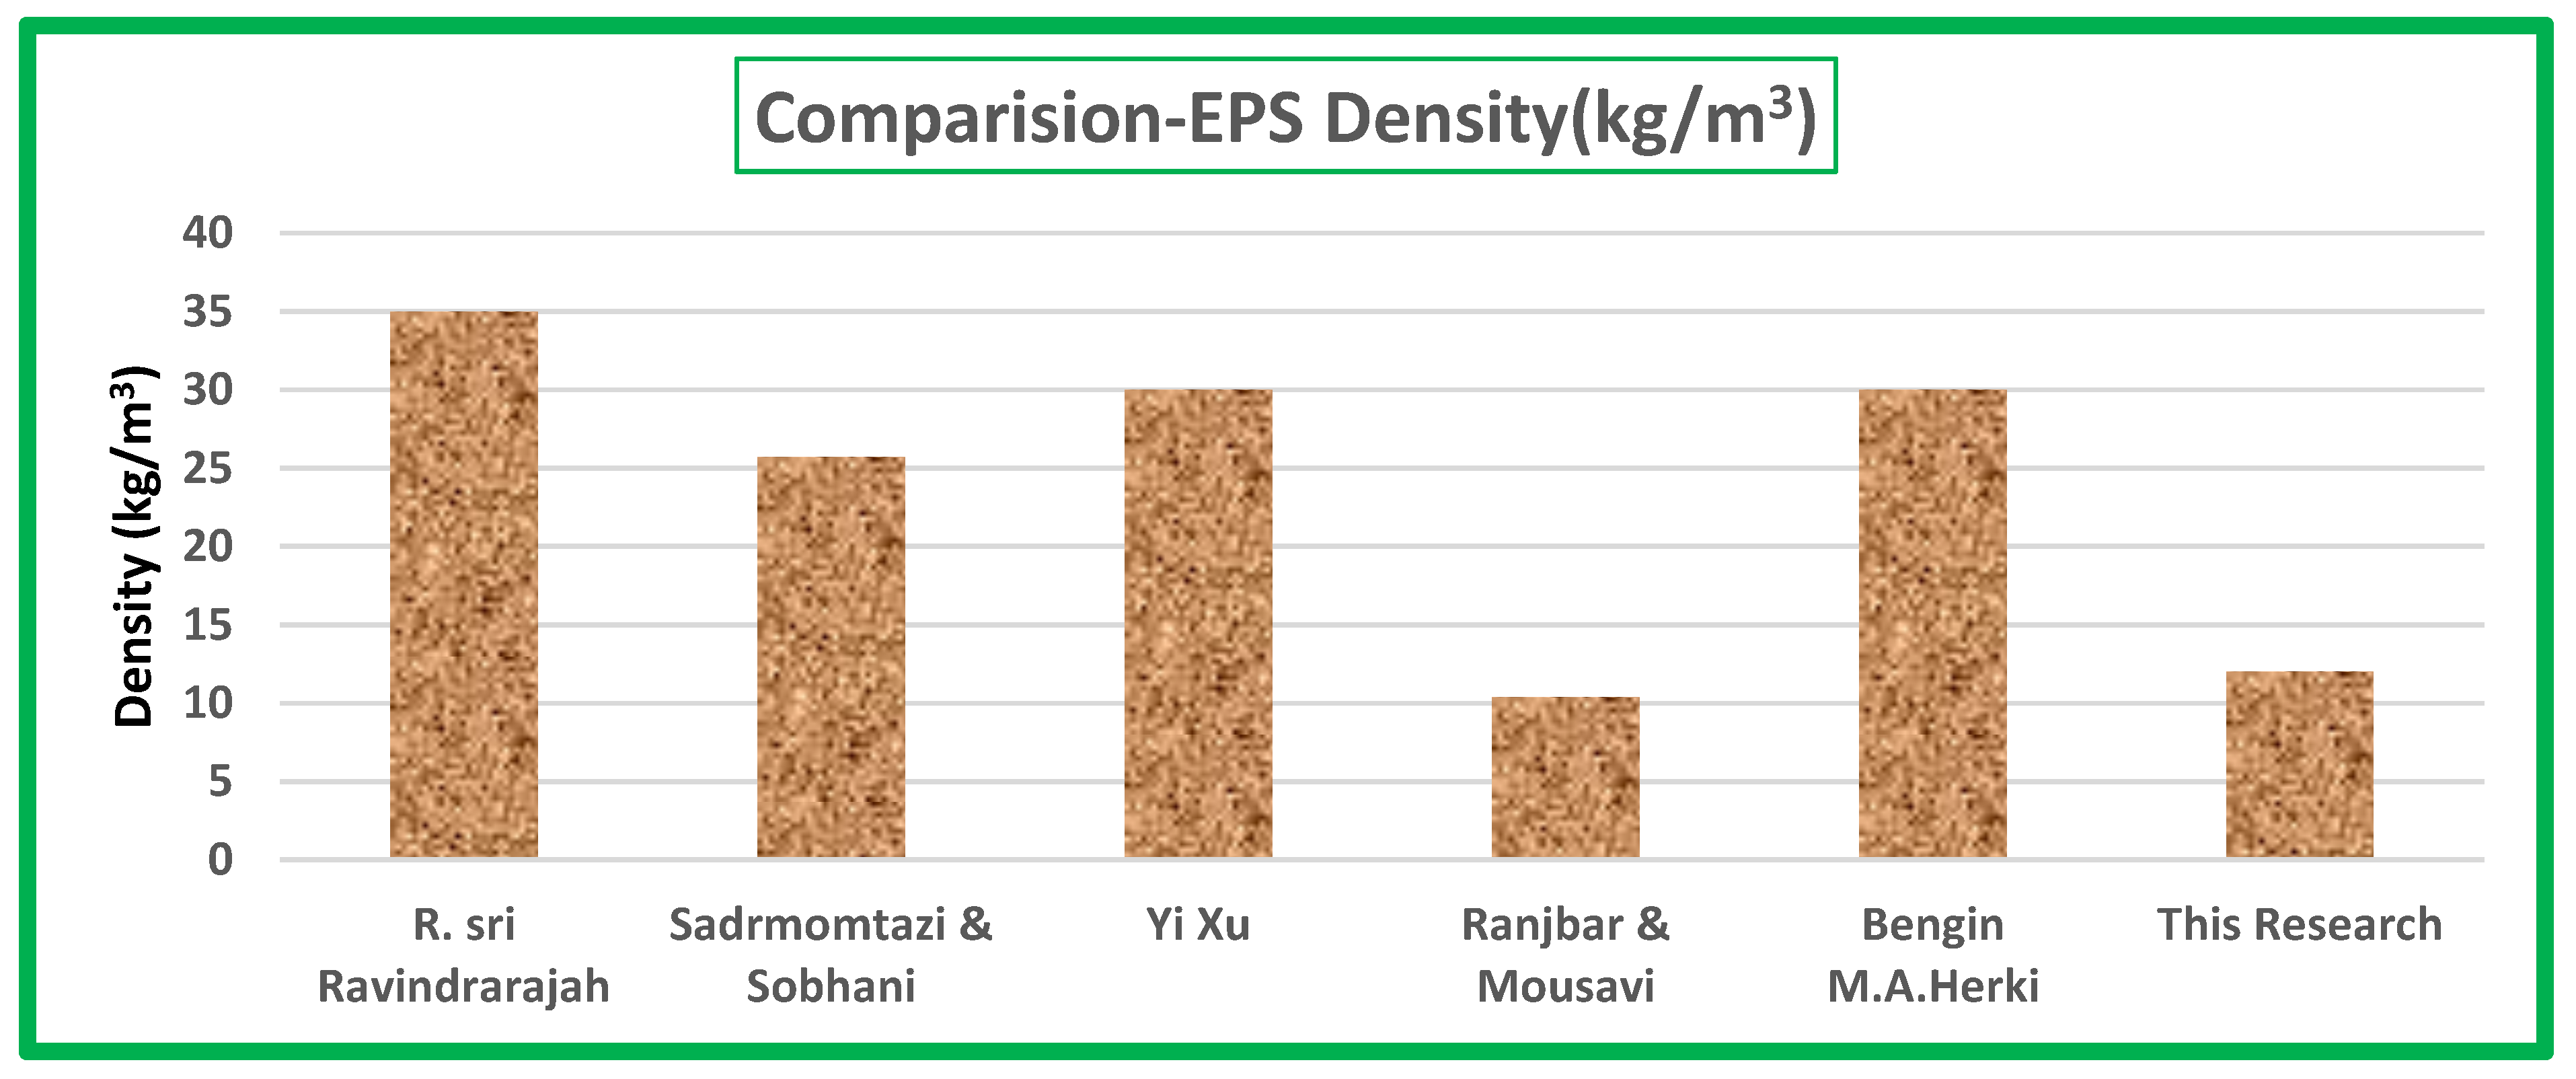
2.1.4. Expanded Polystyrene Beads

Polystyrene is also known as polyvinyl resin. Structurally, it is an extended organic compound chain, with a phenyl collection connected to each different carbon atom. Styrene is made by a radical vinyl chemical action from the compound polyvinyl resin [37]. Expandable polystyrene (EPS) meantime is styrene in raw beads being steam-heated, inflicting it to expand [38]. EPS-beads are easily available in the market in the form of spherical beads shown in Figure 3. Styrene has been used principally in cold states to form concrete blocks for residential functions [5]. On the other hand, polystyrene beads have demerits that constrain the applying and promotion of EPS-beads concrete: they are very lightweight which may cause separation in commixture [39]. On the other hand, the merit is that they are hydrophobic [40] because on behalf of this merit it can be easily used in concrete production. Due to its water absorption criteria, it can be easily used without adding extra water to the concrete. EPS-beads are produced in three key steps of pre-expansion, aging and molding [23]. Some physical characteristics of expanded polystyrene beads are shown in Table 5 according to ASTM C-578 [41]. Expanded polystyrene beads (EPS) are spherical in shape and according to ASTM C-578 classification, Type XI beads with a density of 12 kg/m3 have been used in this study.

2.2. Batching, Mixing and Preparation of Test Specimens

The primary part of any research is related to its mix proportions that are to be adopted during research work, because the mix proportion also indicates the belongings of concrete that are also explored after casting and curing of concrete specimens. The main aim of this paper is to study an effective and reliable mix proportion that is economical to adopt and also fulfills the basic mechanical properties of any concrete [42]. In this study, the rocky coarse aggregate is to be replaced by a volume of EPS-beads and a total of six specimens have been prepared for a Mix ID-1 i.e., three for 7 days curing and three for 28 days curing testing. Also, both destructive and non-destructive tests have been applied to these six specimens according to their curing period. A total of 54 specimens were prepared. The quantity mix proportion of an EPS-beads lightweight concrete is given in Table 6.
After the decision of mix proportion, the next step is batching or mixing of EPS-beads lightweight concrete to get a uniform or homogenous concrete. The weight of EPS beads is very light. Due to this, the EPS-beads lightweight concrete is prone to segregation. Ingredients were mixed following the following instructions: primarily, the EPS-beads were wetted at first with a district of the blending water. Moreover, cement, sand and therefore the residual water were intercalary and mixed for 3 min at slow speed. Now, crushed stone was intercalary and mixed for 3–5 min more till a consistent concrete was developed. This step procedure has been counseled by the appropriate learning [40,43]. The standard specimen is 150 mm in diameter and 300 mm in length and has been cast in moulds, grade concrete (1:2:4), and w/c ratio is 0.60 has been kept in this research but the ratio of % age replacement of rocky coarse aggregates varies. Compaction was done by hand with the help of the tamping rod. After casting, the concrete cylinders were to be demolded after 24 h. Then for curing purposes, the specimens were put into a water bath. After curing, the specimen was taken out of the bath water and rested in room temperature at 23 ± 2 °C to completely dry the specimens.

2.3. Testing Methodology

After the successful completion of the curing period, the next step was to apply the standard tests to analyze the true picture of each mix proportion specimen. Three major test procedures have been focused on in this study i.e., Ultrasonic pulse velocity test, Rebound Hammer Test and Compressive Strength Test.

2.3.1. Ultrasonic Pulse Velocity Test

A non-destructive test was executed on concrete to analyze its behavior and to determine its mechanical characteristics. It is straightforward to use, and outcomes were hastily attained on-site [44,45,46,47,48,49,50]. The basic principle of UPV is that the pulse wave is produced due to the electro-acoustical transducer. This pulse wave moves through the concrete and the time that the pulse wave takes to travel the sample is to be measured. With the help of this time, the longitudinal or pulse velocity is measured. Two transducers are used, one is a transmitter and the other is receiver [51]. The formal diagram of UPV [52] according to ASTM C-597 is shown in Figure 4. Ultrasonic Pulse velocity test equipment of brand MATEST (Italy) with a measuring range (0–3000 µs—accuracy +/−0.1 µs) and two 55 kHz probes with connection cables, based on ASTM C597 standard, were used in this study as shown in Figure 4.
The pulse velocity and dynamic modulus of elasticity are to be calculated by Equations (1) and (2) that are listed in ASTM C-597.
V = L T .
where
  • L = Travel Path Length (m), T = transit (µs), V = Pulse velocity (km/s)
    V = E d ( 1 µ ) ρ ( 1 + µ ) ( 1 2 µ )
  • µ = Poisson Ratio
  • V = pulse velocity (m/s)
  • ρ =Density of concrete (kg/m3)
  • Ed = Dynamic modulus of elasticity (GPa)
The frequency of the transducer pair is 55 kHz. The Poisson’s ratio was considered as 0.28 for this experimental study [53]. Also, the coupling agent was used for better results and with the help of the coupling agent, the firm contact was developed between the transducer and concrete surface. The transducer ranges lie in between 20–150 kHz. Transducers with a frequency of 50 kHz to 60 kHz are appropriate for most common applications. Basically, the pulse velocity shows the concrete quality that also shows the presence of voids and homogeneity of concrete [54]. According to Jones, the lesser limit of pulse velocity (V) for virtuous quality concrete is between 4.1 and 4.7 km/s [55]. In this research, pulse velocity (V) and Dynamic modulus of elasticity (Ed) were estimated for every concrete specimen and also specimen testing is shown in Figure 4. After curing, initially non-destructive testing was performed followed by destructive testing.

2.3.2. Rebound Hammer Test

Many non-destructive test techniques have been developed and used to conclude the compressive strength of concrete. However, in all of these techniques, the rebound hammer test is usually used to conclude the compressive strength of concrete [31]. Basically, this is a surface rigidity test and it also works on the principle of elastic mass that impinges into a hardened surface [54]. In 1948, Schmidt established the Schmidt rebound hammer check. This device is collectively used attributable to a hardened steel hammer compact on the concrete by a spring. [56]. This test is conducted on concrete specimens with rebound hammer–aluminum framed for brand MATEST (Italy) having a spring impact energy of 0.225 m·kg (2.207 Joule or Nm). Ten rebound readings were to be taken on a test area of each cylinder and the average of these readings was taken. In this study, the rebound hammer was applied to the cylinder in a vertically downward direction. The test was applied according to ASTM-C805. The operational diagram is shown [57] in Figure 5.

2.3.3. Compressive Strength Test

After the successful complaint of non-destructive testing, the compressive strength test was conducted on every specimen at 7 and 28 days shown in Figure 6 according to ASTM C-39 [58]. A compressive strength test was applied with the compression test machine of brand MATEST (Italy) and was conducted respectively in accordance with the ASTM Standard ASTM C39. Compressive strengths were calculated for cylindrical specimens of 110 mm (4.334 in.) diameter and 220 mm (8.668 in.) height. Automatic compression machines with 2000 kN capacity were used for compression test having a rate loading rate of 5 kN/s (1.124 kips/s) fixed for these specimens.

3. Results and Discussion

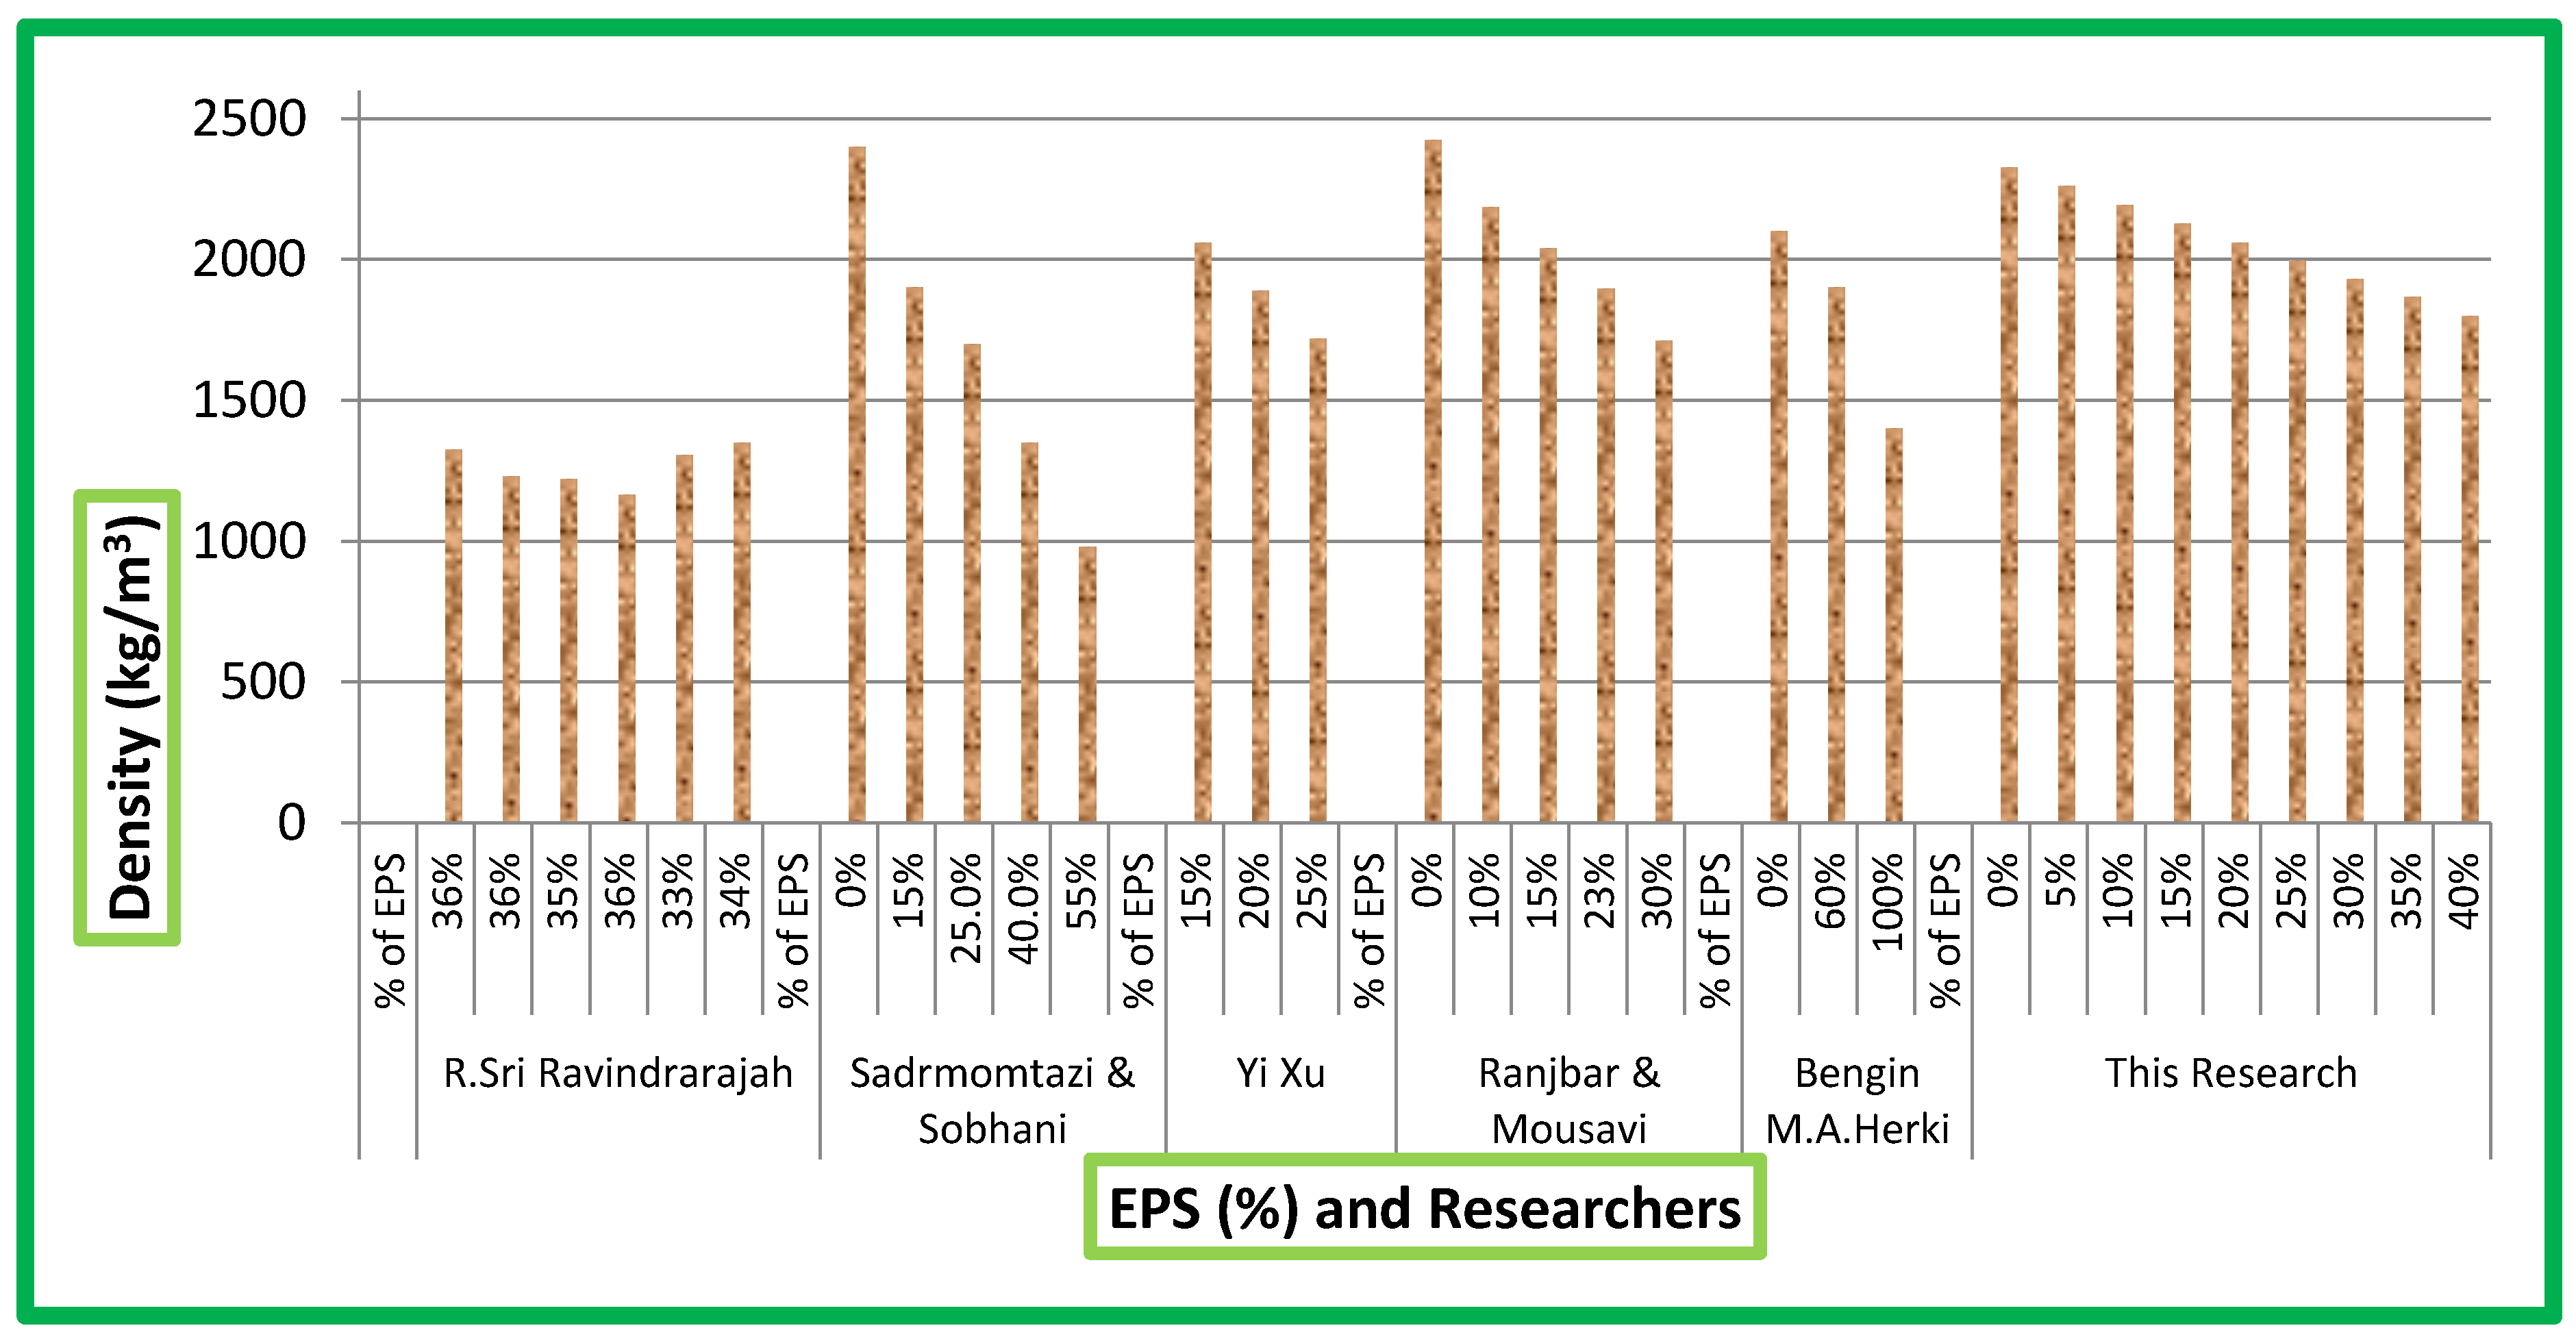
3.1. Effect of EPS Beads on Density

In this research, the coarse aggregate was replaced by beads at an interval of 5% by volume. The EPS beads are an expanded agent that can reduce the density of concrete and make them lightweight concrete. The effect of EPS beads on density and cylinder weight are shown in Figure 7.
In this study, the maximum and the minimum density is 2330 kg/m3 and 1800 kg/m3 at 0% and 40% replacement of aggregates with beads. This figure also represents the direct relationship between % beads and density also weight. The maximum weight of the cylinder at 0% replacement is 12.9 kg and the minimum is 10.1 kg at 40% beads replacement. Also, the EPS-beads lightweight concrete density varies from 1800–2200 kg/m3. Percentage weight reduction is shown in Figure 8.
It can also be seen that approximately 22% of the dead load is reduced after using 40% beads. At the same time, a lot of saving occurs due to the usage of EPS-beads lightweight concrete because the value of the dead load is directly proportional to the number of beads. When the quantity of beads varies, the specimen dead load is reduced. Furthermore, a comparison of the density of the developed EPS-beads concrete with already conducted research is shown in Figure 9 and Figure 10.
Figure 10 indicates the EPS-beads concrete density of different previous research that clearly indicates that the density of concrete is dependent on the dosage of EPS-beads.
As the EPS-beads’ content increases directly, the concrete density decreases. That occurs because the density of EPS-beads is much less than that of natural rocky coarse aggregate [2]. The density variations also occur due to the variations in the entrapped air content against the different EPS-beads’ dosage contents. Density is also changed as the w/c ratio varies [59]. As the thermal insulation properties of EPS-beads’ concrete increases, at the same time, a lot of dead load saving is achieved and also the density decreases [6]. In our research, approximately 22% of dead load saving is achieved at 40% beads content. As the EPS-beads’ content increases, the amount of entrapped air voids entering the concrete increases and the density decreases [60,61].

3.2. Effect of EPS Beads on U.P.Velocity

In this research, non-destructive testing is also conducted on concrete specimens. Basically, velocity tells us about the homogeneity and concrete quality. The concrete quality is very noted parameter in every construction. Figure 11 shows the UPV values at different % beads replacement.
The higher the percentage replacement of beads, the lower the pulse velocity obtained. The Figure 11 represents the pulse velocity values at 7- and 28-day curing periods. Due to the curing age affect the pulse velocity values is also affected similarly, the curing period is large the pulse velocity value is large. Based on concrete quality criteria, all the concrete specimens are truly homogenous and their quality is good. The higher value of pulse velocity is 4.47 km/s at 28 days of curing and at 7 days the velocity is 4.22 km/; an approximately 6% higher value of pulse velocity is obtained at 28 days curing compared to 7 days curing. As the percentage replacement increases, the percentage difference is reduced between 7- and 28-day pulse values. At 40% replacement, the difference is only 4.9%. To compare the performance of the developed EPS concrete with already conducted research based on UPV, a comparison is shown in Figure 12. A similar trend can be seen in all cases shown in Figure 12.
According to Bogas et al. [62], lightweight concrete fc’ and UPV values decreased as the volume of lightweight aggregate increased. On the other hand, this strategy is quite the opposite of normal-weight concrete, because the volume of normal aggregate increases the fc’ and UPV are increased in NWC. The main reason for the similar trend reported by earlier researchers is that lightweight concrete has a greater impact on elasticity than on density, leading to a reduction of velocity values. Bogas et al. used a lightweight aggregate of different types for the preparation of lightweight concrete, but in our research, a normal rocky coarse aggregate is replaced with expanded polystyrene beads that also the effective parameter of velocity results.
According to Jones et al. [55], if the concrete has a large air-filled void, then its transit time will be longer and due to the longer transit time, the velocity values are high. Due to this, in the present research, the velocity values are high because due to the increasing volume of EPS-beads the entrapped air voids increased, which also decreased the strength and velocity values. An investigation into the engineering properties of concrete reported that as a consequence of the cement–water hydration as a consequence of the cement–water hydration process over curing time, the physical and chemical changes will occur in the concrete and will increase the strength and density and, as a result, will increase the UPV values of concrete [2,60].

3.3. % Beads vs. Compressive Strength

At every percentage replacement, destructive compressive strength is applied, and their values are noted. Table 7 shows the compressive strength values at 7- and 28-days curing.
At each mix proportion, the value of compressive strength is higher at 28 days. The maximum value of EPS-beads lightweight concrete is 18.09 MPa at 5% replacement. The value of compressive strength varies from 8–18 MPa. The percentage difference between 7- and 28-days strength at 5% replacement is only 12%. It means that EPS-beads lightweight concrete gains almost 85% strength at 7 days of curing. Figure 13 shows the strength at 7 and 28 days.
The lowest value is obtained at 40% replacement, because the density of EPS-beads lightweight concrete is lower at 40% replacement. Figure 14 shows the relationship between density and compressive strength.
As percentage replacement is increased, the dead load reduction is increased. However, the compressive strength of concrete is decreased. The link between density and compressive strength is directly related. In fact, at lower density, the compressive strength is only 8.21 MPa at 28 days. In this study, the density ranges from 1800–2330 kg/m3 and the compressive strength ranges from 8–21 MPa. To compare the performance of the developed EPS concrete with already conducted research based on compressive strength, the comparison is shown in Figure 15. A similar trend can be seen in the graph shown. Figure 15 indicates the comparative analysis of compressive strength of this study with previous research studies that also show a similar trend of strength; as the dosage of EPS-beads is increased, the strength of concrete is decreased. The lower strength of EPS-beads lightweight concrete with respect to reference concrete (0% EPS-beads) may be due to the following factors:
(1)
The first factor may be the lack of a natural coarse aggregate in the concrete because the concrete mixes containing coarse aggregate showed a variation in strength and density.
(2)
The replacement of natural aggregates with EPS-beads and the resulting increase in the surface area of fine particles, which can lead to the weakening of interfacial transition zones (ITZ) between the aggregates and the cement paste.
(3)
It is observed that full compaction was difficult to achieve with the EPS-beads concrete mixes. Due to this entrapped air content and voids are increased as the volume of EPS-beads (%) is increased. Due to compaction reasons, strength is decreased.
As the adhesion between EPS-beads and the cement paste is decreased, the strength decreases as well. A similar trend has been noticed in previous research work. The strength of LWAC depends on the strengths of the lightweight aggregate used and the hardened cement paste, as well as the bonding of the aggregate/cement paste in the ITZ [2,60,62].

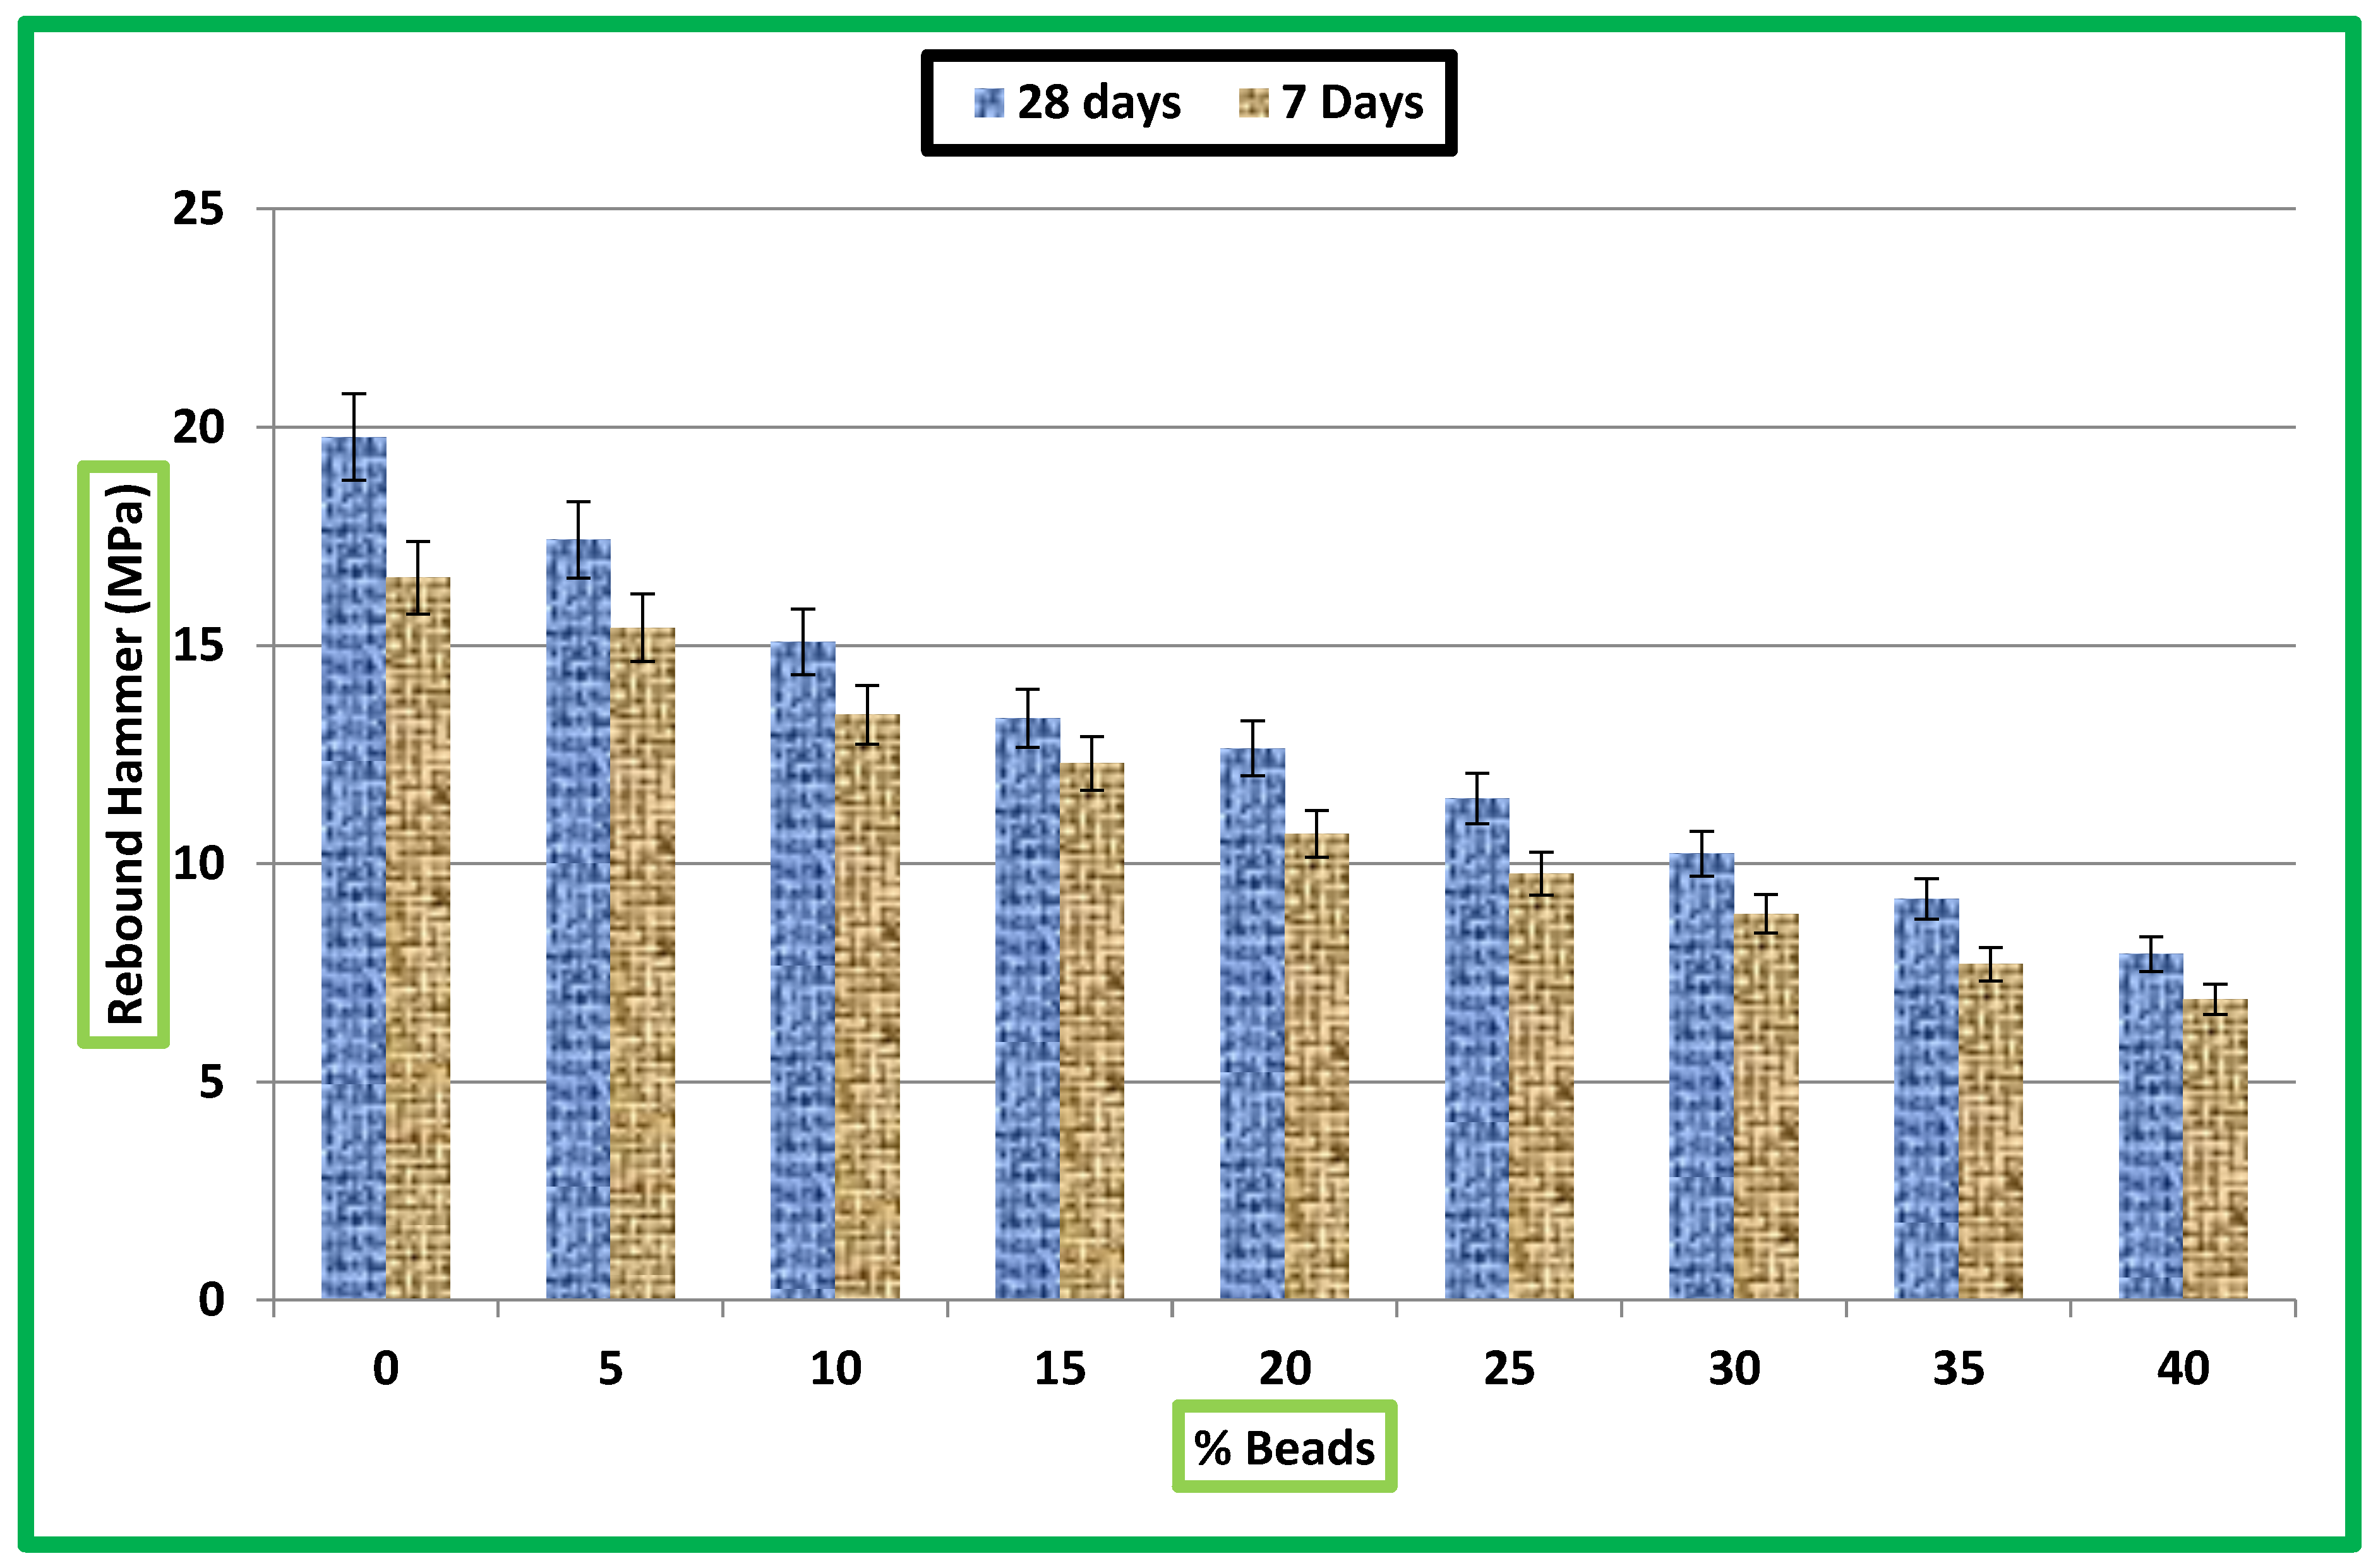
3.4. By Rebound Hammer

In this research study, non-destructive analysis was applied. In addition, the Rebound hammer test was also applied to every cylinder and similarly the percentage beads and strength analysis were conducted. Table 8 shows the strength values by non-destructive analysis.
Table 8 contains 28 days and 7 days of compressive strength that range from 7–20 MPa. Also, the density effect is like the previous effect, but the values obtained from the non-destructive analysis are slightly more littered than destructive testing. Figure 16 and Figure 17 show the rebound hammer strength at 7 and 28 days and the density and rebound strength relation.

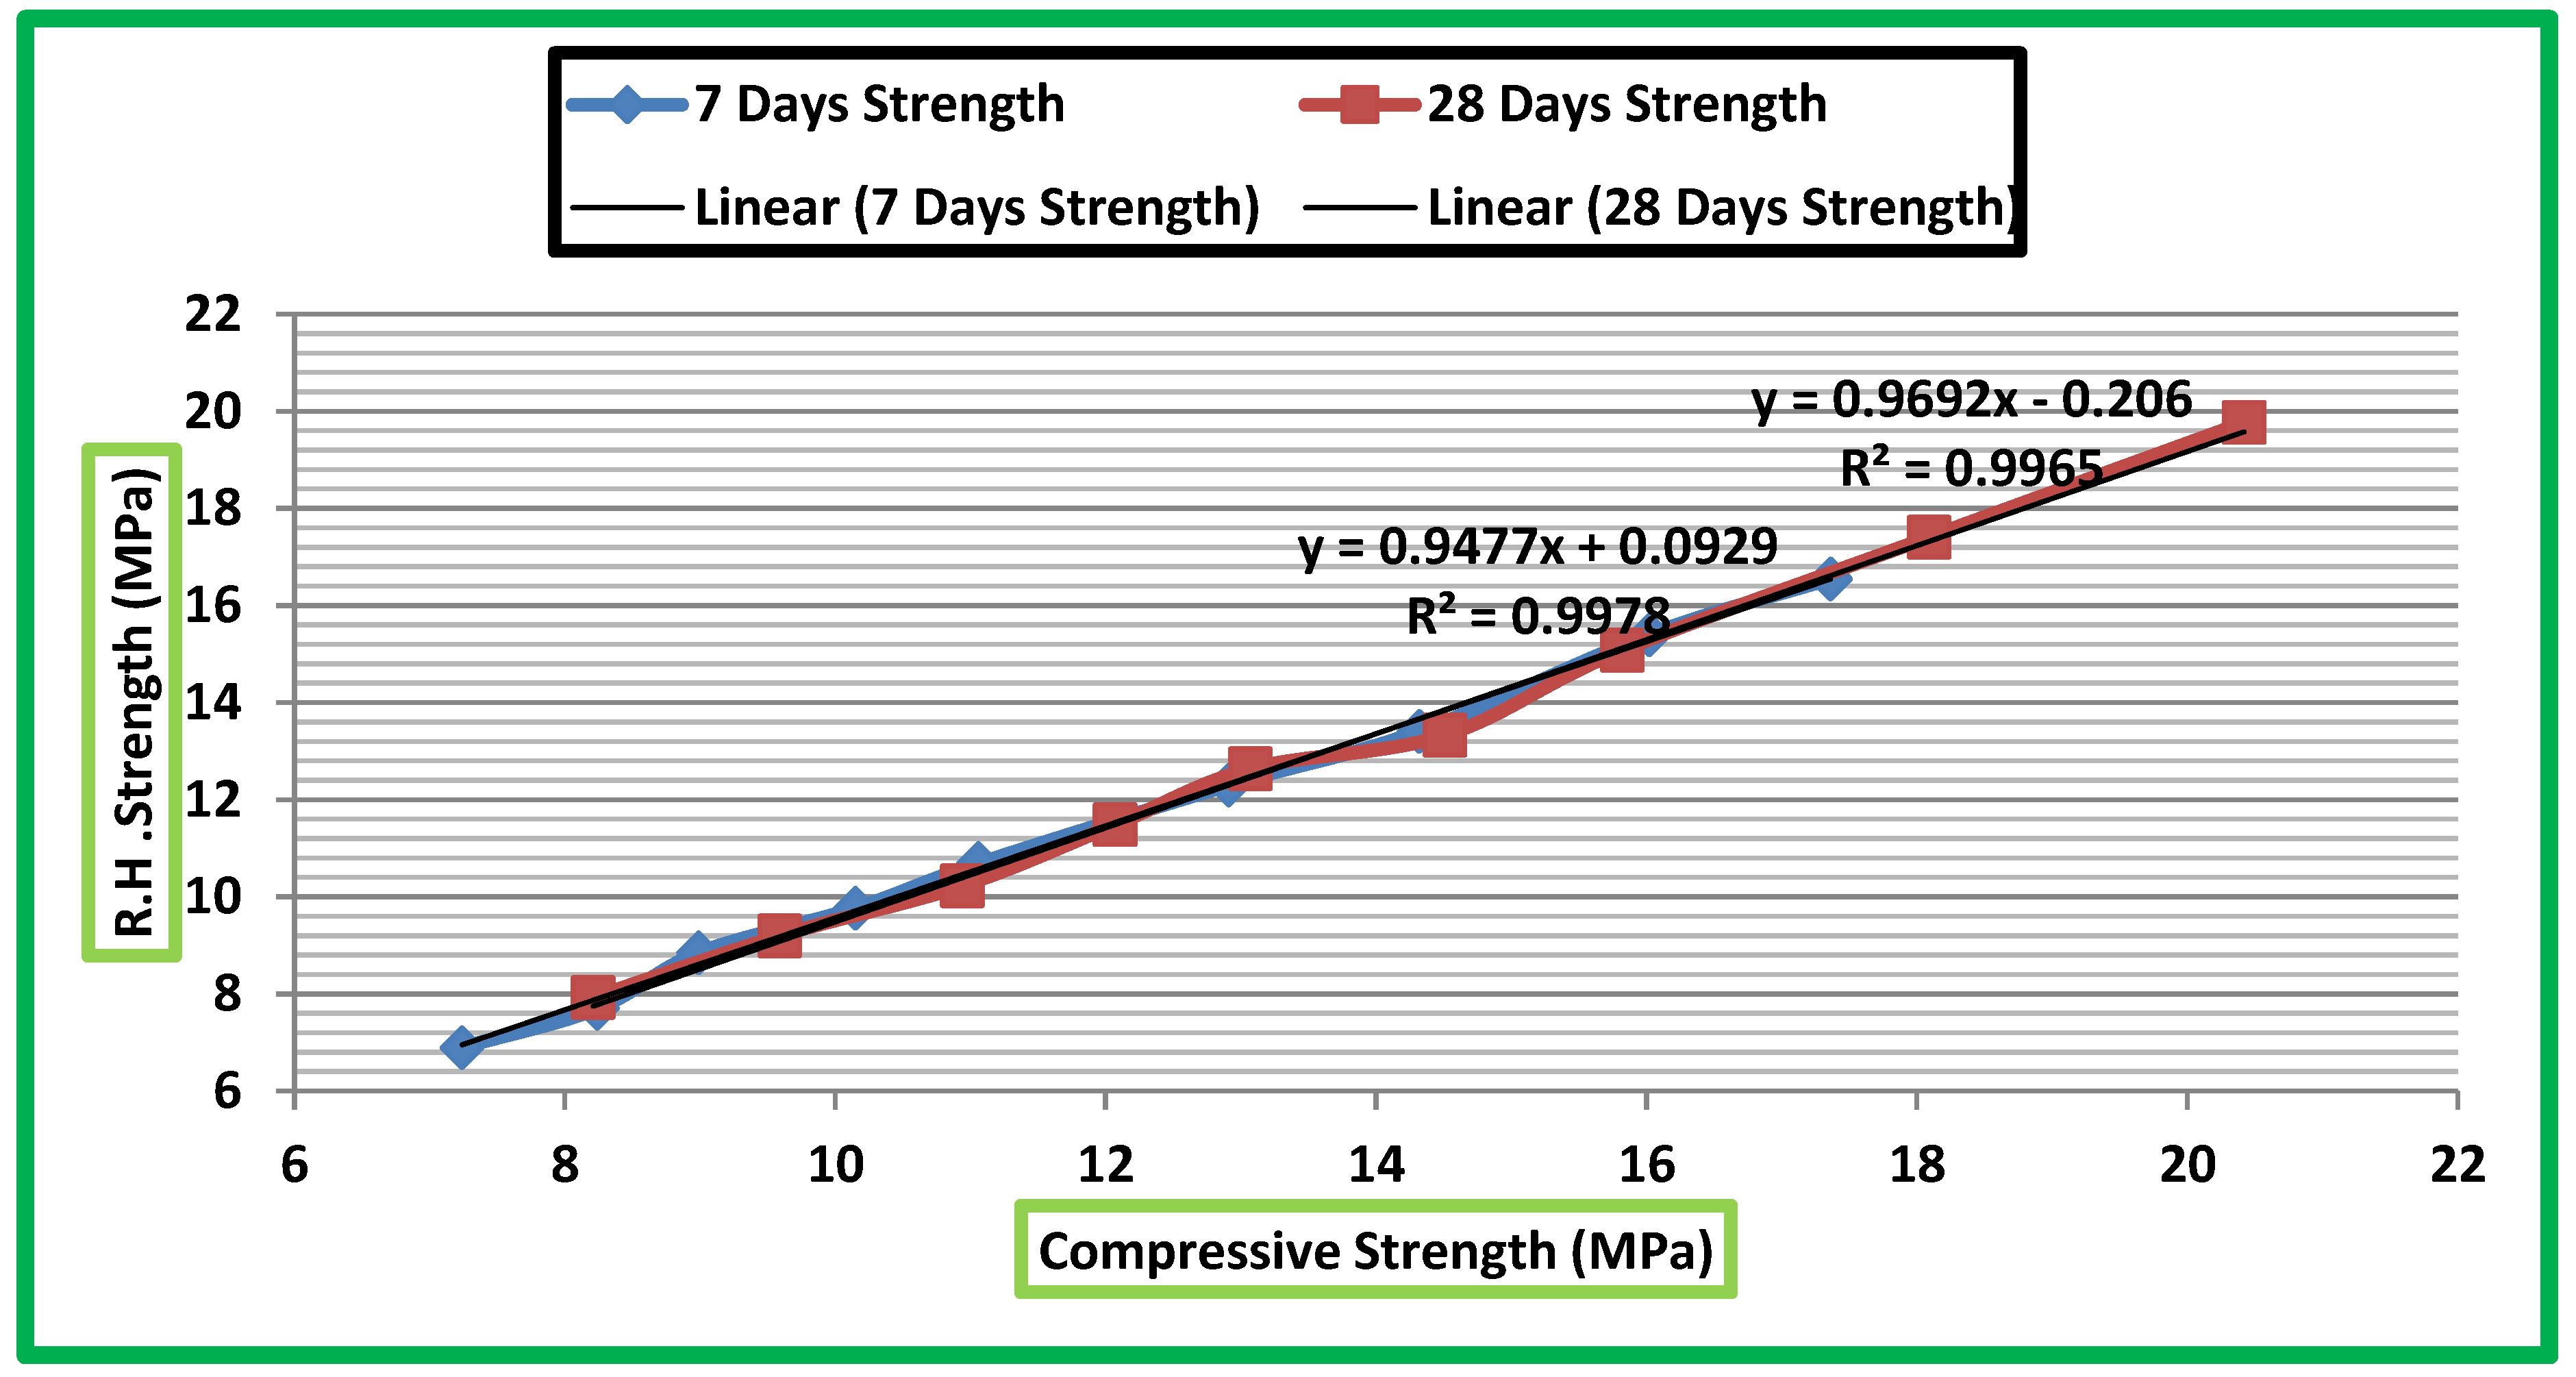
3.5. Analysis of Destructive and Non-Destructive Values

Compressive strength values from destructive and non-destructive methods have been taken and their difference is shown in Table 9.
Table 9 represents the difference between strength values. The maximum strength difference that occurs at 7 days strength is −6.35% at 10% replacement. Also, at 28-days strength, the replacement is 15% and the difference is −8.13%. Along with all these values, non-destructive strength values are less than the destructive strength. Figure 18 shows the percentage age difference.
Regression analysis is also a plot between destructive strength and non-destructive strength. Basically, the analysis shows a linear relationship between strengths. The analysis is shown in Figure 19.
The main R-square value for 7 days’ strength is 99% and similarly for 28 days is also 99%. The R-values show that the relationship between destructive and non-destructive techniques is very good and acceptable. Overall, the linear curve is formed.

3.6. Pulse Velocity vs. Compressive Strength

In the pulse velocity test, the dynamic modulus of elasticity is very important. In addition, the velocity across strength is a very important phenomenon. The pulse velocity also indicates the relation with concrete specimen strength. Figure 20 shows the link between destructive cylinder strength and pulse velocity.
The value of velocity varies from 2.68–4.22 km/s for 7 days of curing strength. However, for 28-days curing, the value varies from 2.82–4.47 km/s. Basically, the direct relationship occurs between pulse velocity and strength. Higher value velocity is obtained at a higher strength cylinder, and lower velocity is obtained at a lower strength cylinder. Inversely, it indicates that less replacement of EPS-beads results in greater strength. Conversely, the higher strength gives higher velocity values.

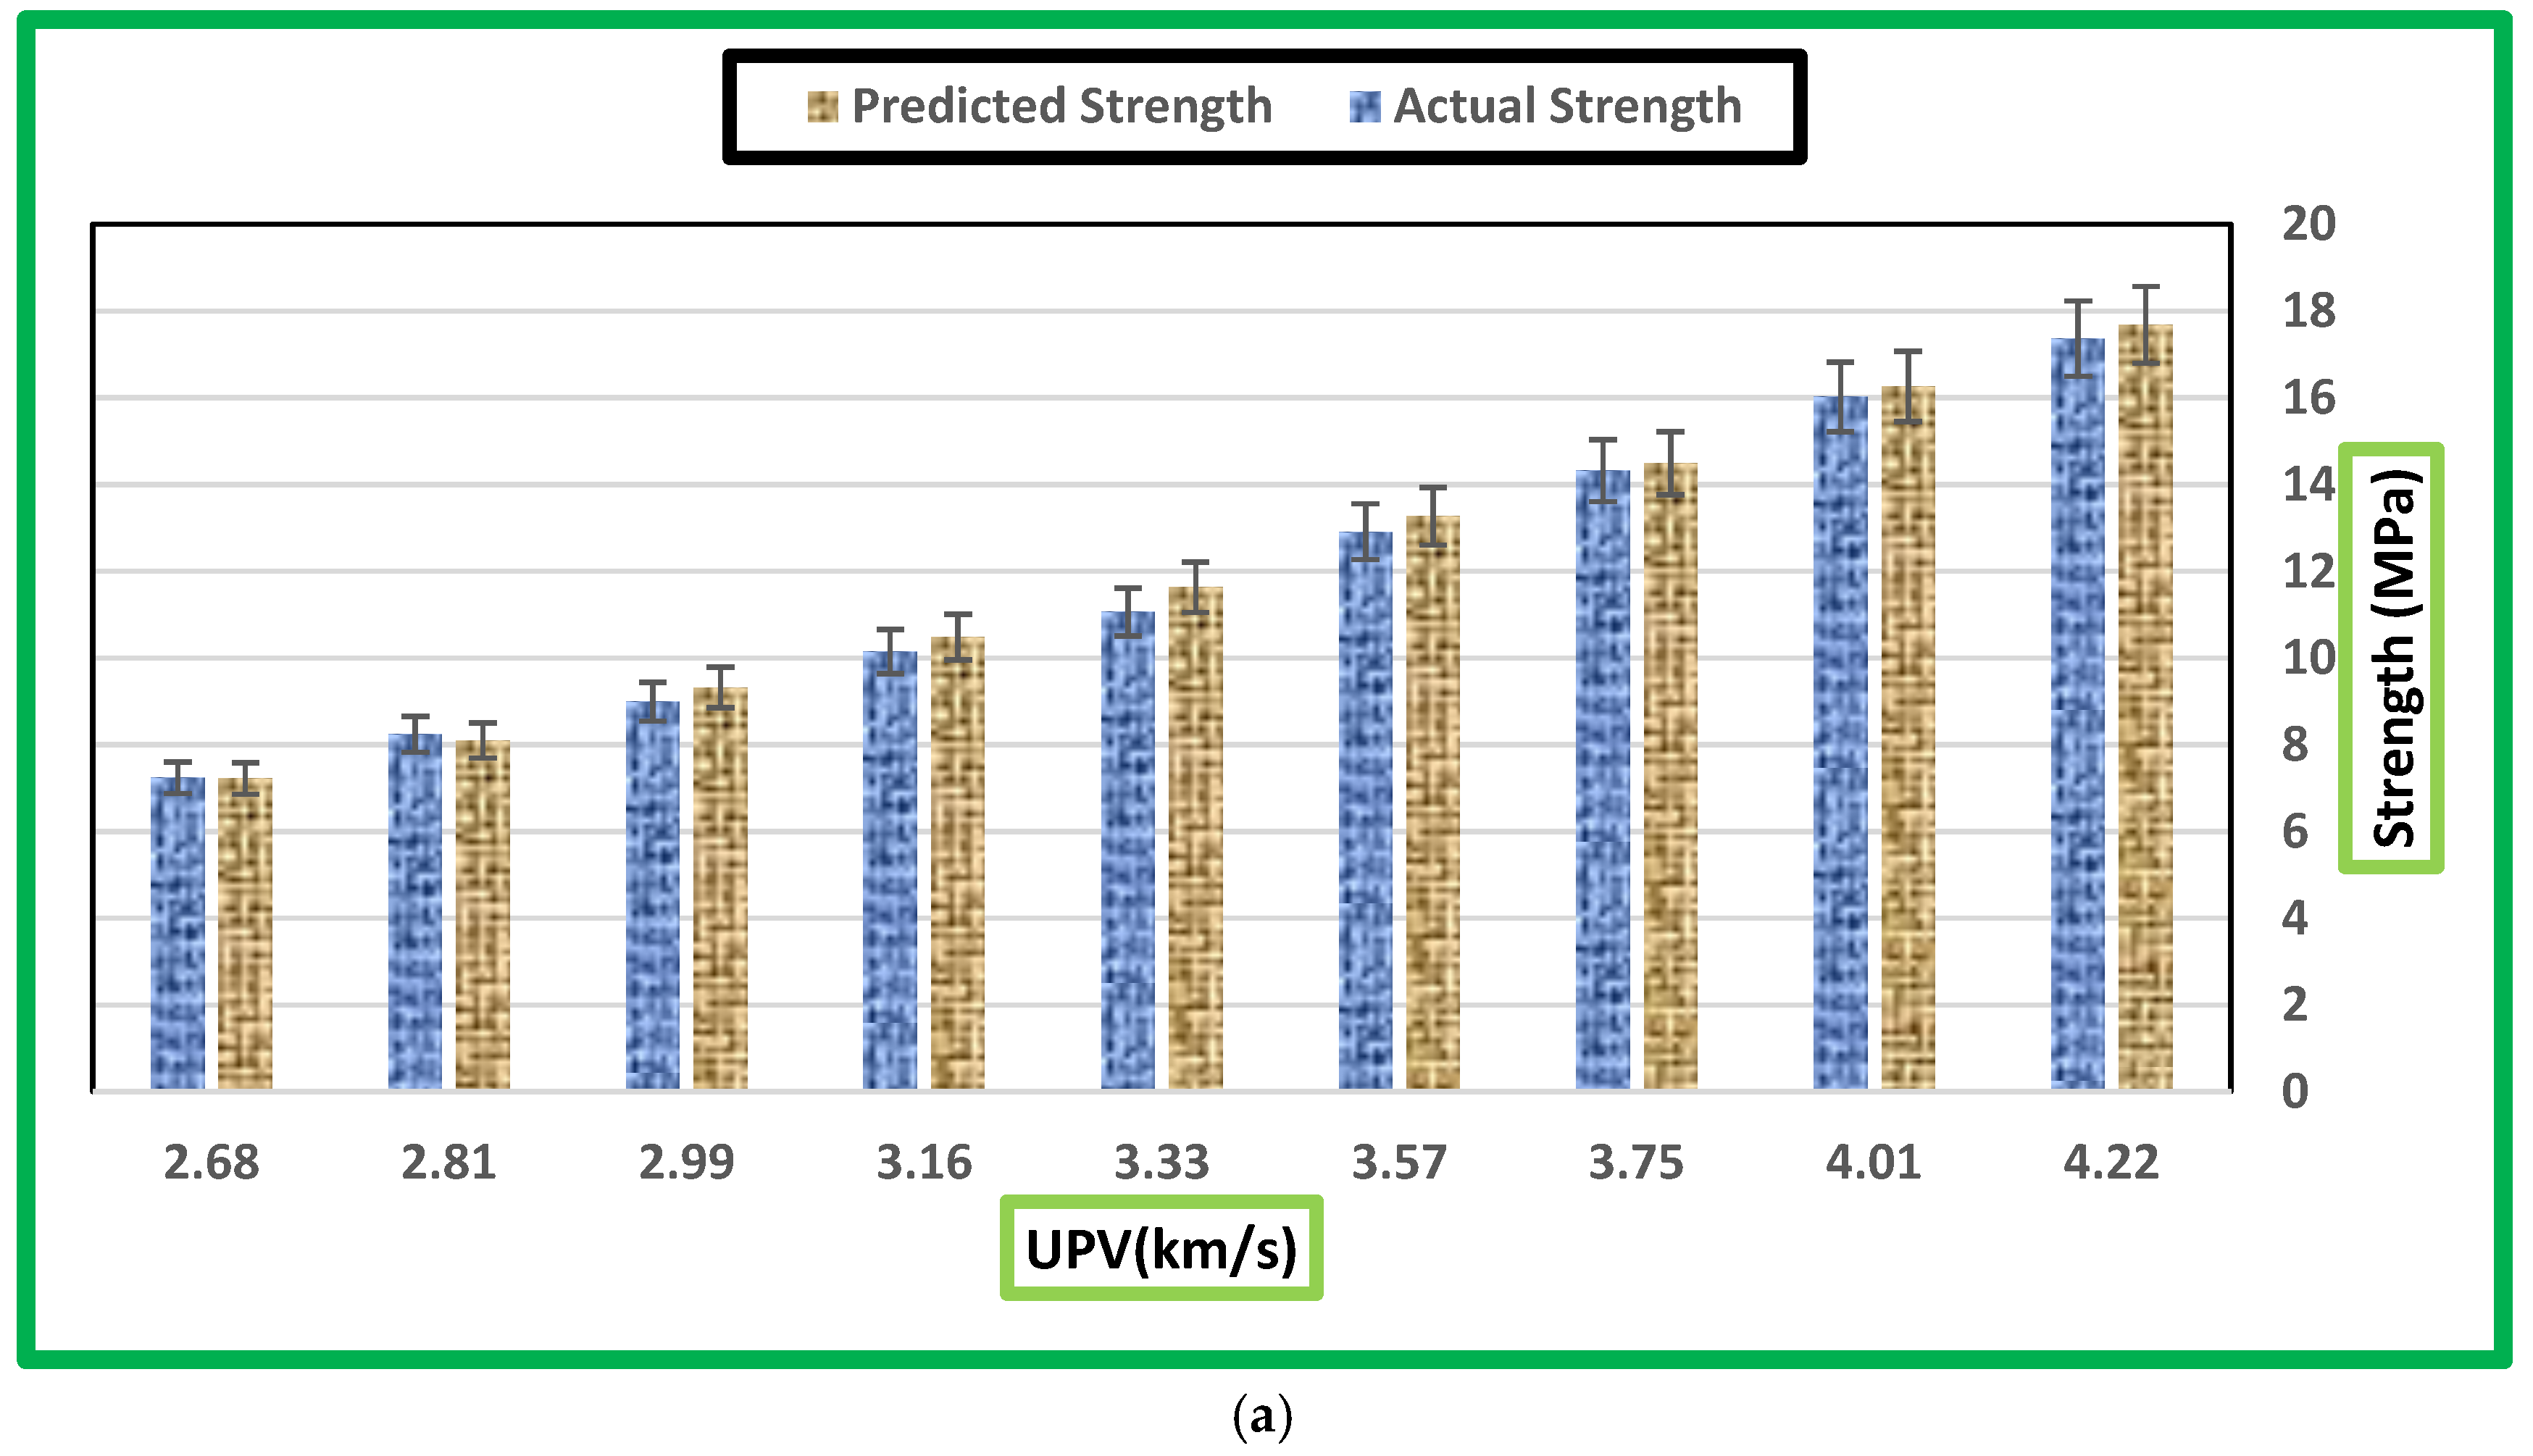
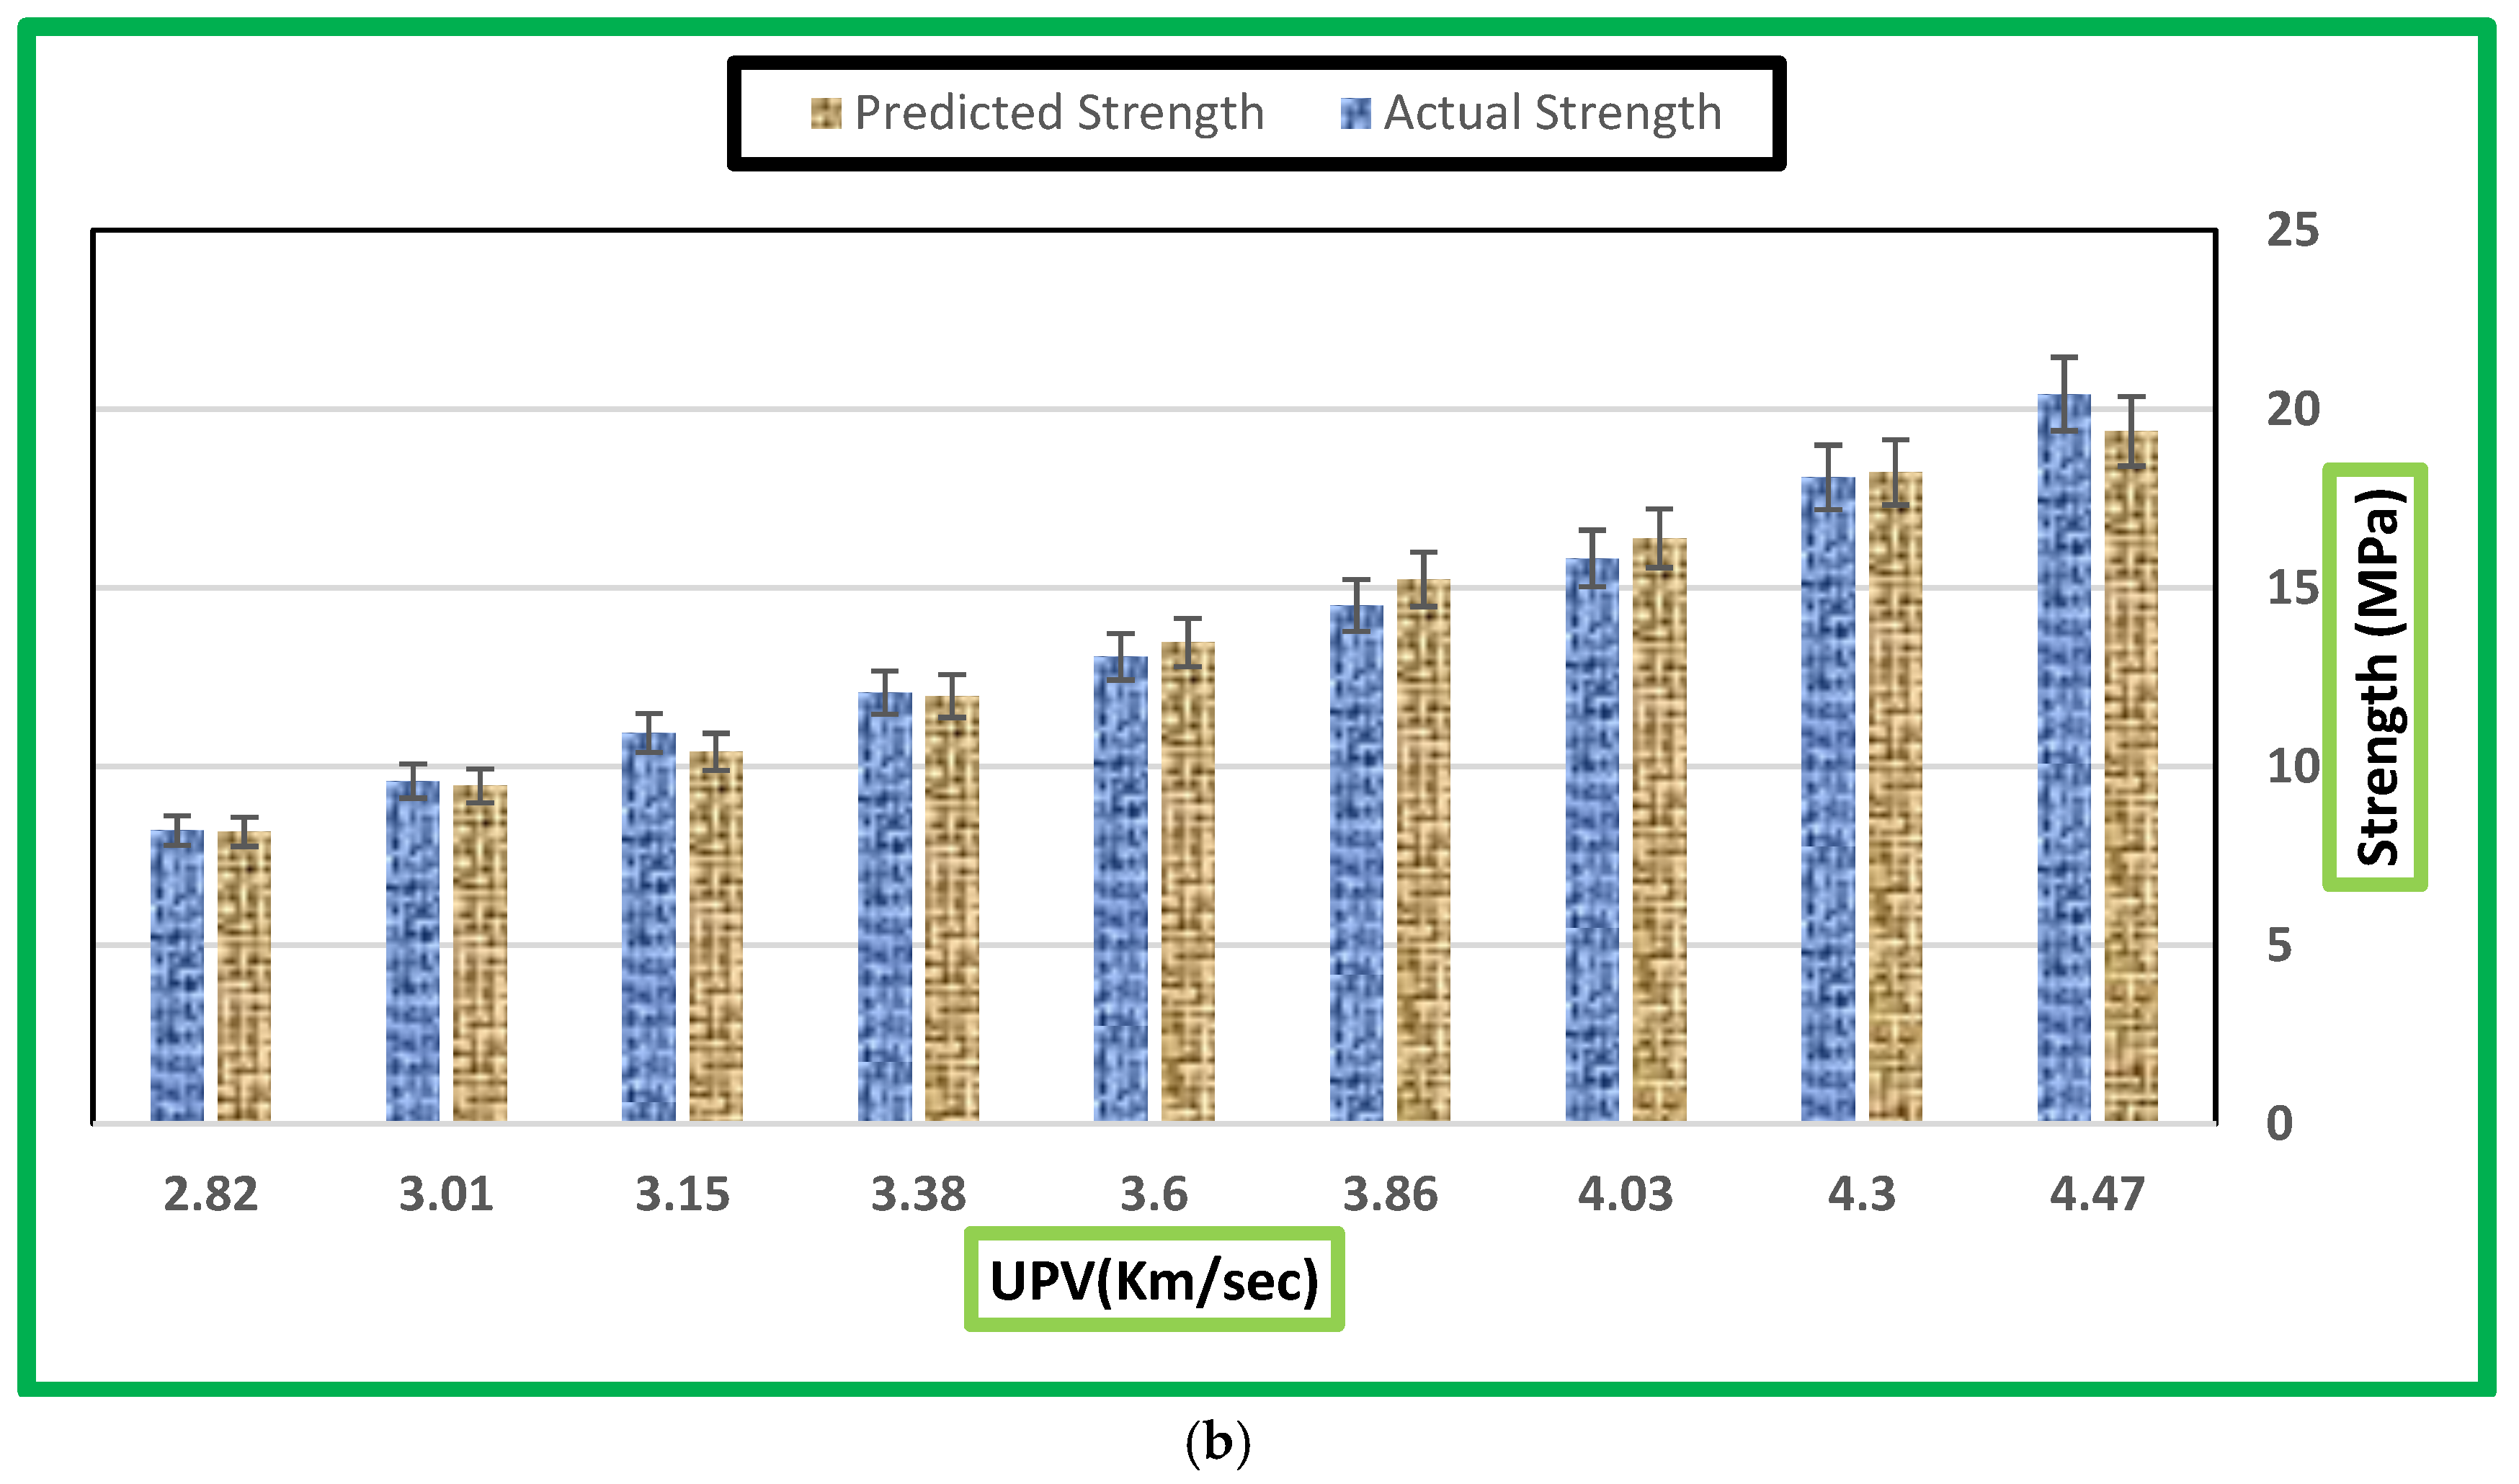
3.7. Predicted Strength from UPV Results by Regression Analysis

The velocity results are also used to find out the results of concrete specimen strength with the help of analysis like Regression analysis [15]. In this exploratory study, the regression analysis is also applied as shown in Figure 21 between destructive values of strength and ultrasonic pulse velocity values. Equation (3) represents the regression eq’s that are given below and is based on a linear relationship found in this case study:
y = 6.7977 x − 11.002
  • x = Avg Pulse velocity (km/s)
  • y = Compressive strength of concrete cylinder (MPa)
The value of R-Square is 98%. This indicates that the results obtained from this equation are approximately equal to destructive test strength results. The predicted results for 7 and 28 days are shown in Table 10 and Table 11.
This table also indicates the predicted compressive strength of concrete cylinders. Now focus on Table 10, it indicates that the experimental values are near to theoretical values that are obtained from the regression analysis. In 7 days of analysis, most values are greater than experimental values, but that is also helpful to judge the concrete strength because the highest percentage difference is found on a 20% replacement that is 5.15%. Similarly, all other values are close to each other. At 10%, 35% and 40%, the actual and predicted values are very close to each other.
Similarly, the 28 days strength also indicates a closer relationship between actual and predicted values. At 5% and 40% replacement of beads, the difference is only 0.77% and −0.49 which means that it is very close to the actual value. In 28 days of analysis, most values are greater than experimental values, but that is also helpful to judge the concrete strength because the highest percentage difference is only −5.09% derived. Figure 22a,b also shows the strength variation at 7- and 28-days curing.
The strength obtained theoretically varies from 7–18 MPa at 7 days. On the other hand, the range varies from 8–19.5 MPa at 28 days. All of these values lie in the range of tentative strength values.

3.8. Effect of Beads vs. Dynamic Modulus of Elasticity

Dynamic modulus of elasticity basically originates out via pulse waves; the formula is given above. It can also be found by putting the values of density and pulse velocity and poisons ratio [3,30]. Figure 23 shows the relation between percentage beads replacement and Ed at 7 and 28 days.
The figure indicates the direct relationship between the percentage of beads and Ed. The highest value is obtained at 0% that is approximately 36 GPa at 28 days curing. It means that the curing age effect also occurs, and it also affects the Ed values. However, percentage replacement is also an important parameter in this research. Similarly, as the percentage beads increases, the dynamic modulus decreases, Ed.

3.9. Effect of UPV vs. Ed

The main parameter that is obtained from the velocity values is the dynamic modulus of elasticity [3], which leads towards the true relation between velocity and Ed [30].
Figure 24 shows the relation between these two parameters. In this figure, a direct relation is formed between these two parameters i.e., the higher the velocity value, the higher the Ed values is. Nevertheless, remember the curing period also effects these parameters, because on 7 days of curing, the velocity is 4.22 km/s and Ed are 32 GPa; however, on 28 days curing, the velocity is 4.47 km/s and the Ed is 36 GPa.

4. Conclusions

In this research, the development and application of lightweight concrete has been studied with the help of destructive and non-destructive testing techniques. Removal of useless weight has been tested via changing rocky coarse aggregates with EPS-beads (i.e., ranging from 5%–40% replacement). The simplest output is that at 5% substitution of aggregates, about 5% useless load is reduced by means of the general weight of the concrete specimen. At 40% alternative, approximately 22% load is reduced because of density concepts. However, it is far seen that density and compressive strength are directly proportional to each other. At 40% alternative, 28 days’ compressive strength is around 8.5 MPa and the density is 1800 kg/m3. The relation between percentage beads and compressive strength is inverse. The rebound hammer test suggests a reasonably linear courting with destructive strength. The value of R-square is 99% for 28 days and 7 days strength. That represents a totally secure linear courting among rebound hammer and destruction strength test values. Percentage beads replacement essentially as the share substitute has increased the ultrasonic pulse velocity. The regression analysis provides a relationship between velocity and destructive strength values. The equation developed for relationship analysis is y = 6.7977 X − 11.002. The R-Square value is 98% and with the help of this equation, the unforeseen compressive strength value is predicted by taking UPV results under non-destructive conditions. The influence of percentage alternative can be predicted for the compressive strength values. However, it is concluded that EPSB-25 to EPSB-40 mix concrete design can be used for concrete block production i.e., it can serve only for a lightweight partition wall concept and not taking a load. It saves a lot of cost in tall building construction. In the frame structure, such type of block can be recommended to use instead of bricks for partition purposes. The impact of percentage alternative is likewise identified on Ed values as a percentage beads increase contributes to Ed values reduction. Furthermore, if EPS-beads serve as a replacement to coarse aggregate for the development of construction material, it will contribute to the application of the circular economy concept as it is one of the major sources of cost-saving for a major coarse aggregate replacement.

Author Contributions

Conceptualization, M.A.Q. and S.A.R.S.; Methodology, M.A.Q., M.F. and H.A.; Software, M.A.Q. and S.A.R.S.; Formal Analysis, M.A.Q.; H.A. and M.F.; Investigation, M.A.Q., M.T. (Muhammad Taufiq), W.K. and M.T. (Muhammad Tayyab); Resources, M.A.Q., M.T. (Muhammad Taufiq), W.K and M.T. (Muhammad Tayyab); Data Curation, M.A.Q., M.T. (Muhammad Taufiq), W.K. and M. Tayyab.; Writing-Original Draft Preparation, M.A.Q. and S.A.R.S.; Writing-Review and Editing, M.F., G.S. and M.W.; Supervision, M.F., S.A.R.S. and H.A.

Funding

This research received no external funding.

Conflicts of Interest

The authors declare no conflict of interest.

References

  1. Schackow, A.; Effting, C.; Folgueras, M.V.; Güths, S.; Mendes, G.A. Mechanical and thermal properties of lightweight concretes with vermiculite and EPS using air-entraining agent. Constr. Build. Mater. 2014, 57, 190–197. [Google Scholar] [CrossRef]
  2. Herki, B. Combined Effects of Densified Polystyrene and Unprocessed Fly Ash on Concrete Engineering Properties. Buildings 2017, 7, 77. [Google Scholar] [CrossRef]
  3. Kaplan, G.; Yaprak, H.; Memiş, S.; Alnkaa, A. Artificial Neural Network Estimation of the Effect of Varying Curing Conditions and Cement Type on Hardened Concrete Properties. Buildings 2019, 9, 10. [Google Scholar] [CrossRef]
  4. Kuhail, Z.; Shihada, S. Mechanical properties of polystyrene-lightweight concrete. IUG J. Nat. Stud. 2015, 11, 93–114. [Google Scholar]
  5. Ismail, I.; Saim, A.A.; Saleh, A.L. Properties of Hardened Concrete Bricks Containing Expanded Polystyrene Beads; Universiti Teknologi Malaysia: Johor, Malaysia, 2003. [Google Scholar]
  6. Xu, Y.; Jiang, L.; Xu, J.; Li, Y. Mechanical properties of expanded polystyrene lightweight aggregate concrete and brick. Constr. Build. Mater. 2012, 27, 32–38. [Google Scholar] [CrossRef]
  7. Ghahari, S.; Mohammadi, A.; Ramezanianpour, A. Performance assessment of natural pozzolan roller compacted concrete pavements. Case Stud. Constr. Mater. 2017, 7, 82–90. [Google Scholar] [CrossRef]
  8. Yasar, E.; Duran Atis, C.; Kilic, A.; Gulsen, H. Strength properties of lightweight concrete made with basaltic pumice and fly ash. Mater. Lett. 2003, 57, 2267–2270. [Google Scholar] [CrossRef]
  9. Alshihri, M.M.; Azmy, A.M.; El-Bisy, M.S. Neural networks for predicting compressive strength of structural light weight concrete. Constr. Build. Mater. 2009, 23, 2214–2219. [Google Scholar] [CrossRef]
  10. Babu, D.S.; Babu, K.G.; Tiong-Huan, W. Effect of polystyrene aggregate size on strength and moisture migration characteristics of lightweight concrete. Cem. Concr. Compos. 2006, 28, 520–527. [Google Scholar] [CrossRef]
  11. Chen, B.; Liu, J. Contribution of hybrid fibers on the properties of the high-strength lightweight concrete having good workability. Cem. Concr. Res. 2005, 35, 913–917. [Google Scholar] [CrossRef]
  12. Chia, K.S.; Zhang, M.-H. Water permeability and chloride penetrability of high-strength lightweight aggregate concrete. Cem. Concr. Res. 2002, 32, 639–645. [Google Scholar] [CrossRef]
  13. Kitouni, S.; Houari, H. Lightweight concrete with Algerian limestone dust. Part. II: Study on 50% and 100% replacement to normal aggregate at timely age. Cerâmica 2015, 61, 462–468. [Google Scholar]
  14. Tanyildizi, H. Statistical analysis for mechanical properties of polypropylene fiber reinforced lightweight concrete containing silica fume exposed to high temperature. Mater. Des. 2009, 30, 3252–3258. [Google Scholar] [CrossRef]
  15. Mohammed, J.H.; Hamad, A.J. Materials, properties and application review of Lightweight concrete. Tech. Rev. Fac. Eng. Univ. Zulia 2014, 37, 10–15. [Google Scholar]
  16. Ferrándiz-Mas, V.; García-Alcocel, E. Durability of expanded polystyrene mortars. Constr. Build. Mater. 2013, 46, 175–182. [Google Scholar] [CrossRef] [Green Version]
  17. Sayadi, A.A.; Tapia, J.V.; Neitzert, T.R.; Clifton, G.C. Effects of expanded polystyrene (EPS) particles on fire resistance, thermal conductivity and compressive strength of foamed concrete. Constr. Build. Mater. 2016, 112, 716–724. [Google Scholar] [CrossRef]
  18. Ayse, K.; Filiz, K. Properties of concrete containing waste expanded polystyrene and natural resin. Constr. Build. Mater. 2016, 105, 572–578. [Google Scholar]
  19. Miled, K.; Le Roy, R.; Sab, K.; Boulay, C. Compressive behavior of an idealized EPS lightweight concrete: Size effects and failure mode. Mech. Mater. 2004, 36, 1031–1046. [Google Scholar] [CrossRef]
  20. Liu, N.; Chen, B. Experimental study of the influence of EPS particle size on the mechanical properties of EPS lightweight concrete. Constr. Build. Mater. 2014, 68, 227–232. [Google Scholar] [CrossRef]
  21. Ferrándiz-Mas, V.; Bond, T.; Garcia-Alcocel, E.; Cheeseman, C.R. Lightweight mortars containing expanded polystyrene and paper sludge ash. Constr. Build. Mater. 2014, 61, 285–292. [Google Scholar] [CrossRef] [Green Version]
  22. Tang, W.; Lo, Y.; Nadeem, A. Mechanical and drying shrinkage properties of structural-graded polystyrene aggregate concrete. Cem. Concr. Compos. 2008, 30, 403–409. [Google Scholar] [CrossRef]
  23. Vakhshouri, B.; Nejadi, S. Review on the mixture design and mechanical properties of the lightweight concrete containing expanded polystyrene beads. Aust. J. Struct. Eng. 2018, 19, 1–23. [Google Scholar] [CrossRef]
  24. Lakshmikandhan, K.N.; Harshavardhan, B.S.; Prabakar, J.; Saibabu, S. Investigation on Wall Panel Sandwiched With Lightweight Concrete. In IOP Conference Series: Materials Science and Engineering; IOP Publishing: Bristol, UK, 2017. [Google Scholar]
  25. Ghahari, S.; Ramezanianpour, A.M.; Ramezanianpour, A.A.; Esmaeili, M. An accelerated test method of simultaneous carbonation and chloride ion ingress: Durability of silica fume concrete in severe environments. Adv. Mater. Sci. Eng. 2016, 2016. [Google Scholar] [CrossRef]
  26. Hu, J.; Ren, J.; Wu, D. Dynamic Mechanical Properties of EPS Concrete Under Impact Loading. J. Shanghai Jiaotong Univ. Sci. 2019, 24, 94–100. [Google Scholar] [CrossRef]
  27. Khademi, F.; Akbari, M.; Jamal, S.M. Predictia Rezistentei La Compresiune A Betonului Prin Testare Upv (Ultrasonic Pulse Velocity) Si Modelare Cu Retele Neuronale Artificiale/Prediction of Concrete Compressive Strength Using Ultrasonic Pulse Velocity Test. and Artificial Neural Network Modeling. Rev. Romana Mater. 2016, 46, 343. [Google Scholar]
  28. Dahiru, D. Relationship between ultrasonic pulse velocity test result and concrete cube strength. ATBU J. Environ. Technol. 2016, 9, 13–25. [Google Scholar]
  29. Pavlik, V. Corrosion of hardened cement paste by acetic and nitric acids part I: Calculation of corrosion depth. Cem. Concr. Res. 1994, 24, 551–562. [Google Scholar] [CrossRef]
  30. Shetty, M. Concrete Technology; S. Chand & Company LTD.: Ram Nagar, New Delhi, 2005; pp. 420–453. [Google Scholar]
  31. Sanchez, K.; Tarranza, N. Reliability of rebound hammer test in concrete compressive strength estimation. Int. J. Adv. Agric. Environ. Eng. IJAAEE 2014, 1, 198–202. [Google Scholar]
  32. Adenot, F.; Buil, M. Modelling of the corrosion of the cement paste by deionized water. Cem. Concr. Res. 1992, 22, 489–496. [Google Scholar] [CrossRef]
  33. Revie, R.W. Corrosion and Corrosion Control: An Introduction to Corrosion Science and Engineering; John Wiley & Sons: Hoboken, NJ, USA, 2008. [Google Scholar]
  34. Azreen, M.; Pauzi, I.M.; Nasharuddin, I.; Haniza, M.M.; Akasyah, J.; Karsono, A.D.; Yen Lei, V. Prediction of concrete compression strength using ultrasonic pulse velocity. In AIP Conference Proceedings; AIP Publishing: College Park, MD, USA, 2016. [Google Scholar]
  35. Bertolini, L.; Elsener, B.; Pedeferri, P.; Redaelli, E.; Polder, R. Corrosion of Steel in Concrete; Wiley Online Library: Weinheim, Germany, 2013. [Google Scholar]
  36. American Society for Testing and Materials. ASTM C150-07 Standard Specification for Portland Cement; American Society for Testing and Materials: West Conshohocken, PA, USA, 2007. [Google Scholar]
  37. Demirboga, R.; Kan, A. Thermal conductivity and shrinkage properties of modified waste polystyrene aggregate concretes. Constr. Build. Mater. 2012, 35, 730–734. [Google Scholar] [CrossRef]
  38. Choi, N.; Ohama, Y. Development and testing of polystyrene mortars using waste EPS solution-based binders. Constr. Build. Mater. 2004, 18, 235–241. [Google Scholar] [CrossRef]
  39. Allahverdi, A.; Azimi, S.A.; Alibabaie, M. Development of multi-strength grade green lightweight reactive powder concrete using expanded polystyrene beads. Constr. Build. Mater. 2018, 172, 457–467. [Google Scholar] [CrossRef]
  40. Chen, B.; Liu, J. Properties of lightweight expanded polystyrene concrete reinforced with steel fiber. Cem. Concr. Res. 2004, 34, 1259–1263. [Google Scholar] [CrossRef]
  41. American Society for Testing and Materials. ASTM 578–C06 Standard Specification for Rigid, Cellular Polystyrene Thermal Insulation; American Society for Testing and Materials: West Conshohocken, PA, USA, 2006. [Google Scholar]
  42. Altun, F.; Kişi, Ö.; Aydin, K. Predicting the compressive strength of steel fiber added lightweight concrete using neural network. Comput. Mater. Sci. 2008, 42, 259–265. [Google Scholar] [CrossRef]
  43. Babu, K.G.; Babu, D.S. Behaviour of lightweight expanded polystyrene concrete containing silica fume. Cem. Concr. Res. 2003, 33, 755–762. [Google Scholar] [CrossRef]
  44. Ravindrarajah, R.S. Strength evaluation of high-strength concrete by ultrasonic pulse velocity method. NDT E Int. 1997, 4, 261. [Google Scholar]
  45. Galan, A. Estimate of concrete strength by ultrasonic pulse velocity and damping constant. J. Proc. 1967, 64, 678–684. [Google Scholar]
  46. Solis-Carcaño, R.; Moreno, E.I. Evaluation of concrete made with crushed limestone aggregate based on ultrasonic pulse velocity. Constr. Build. Mater. 2008, 22, 1225–1231. [Google Scholar] [CrossRef]
  47. Davis, A.; Ansari, F.; Gaynor, R.D.; Lozen, K.M.; Rowe, T.J.; Caratin, H.; Heidbrink, F.D.; Malhotra, V.M.; Simons, B.P.; Carino, N.J.; et al. Nondestructive Test Methods for Evaluation of Concrete in Structures; American Concrete Institute (ACI): Farmington Hills, MI, USA, 1998. [Google Scholar]
  48. Sansalone, M.J.; Streett, W.B. Impact-Echo. Nondestructive Evaluation of Concrete and Masonry; Bullbrier Press: Jersey Shore, PA, USA, 1997. [Google Scholar]
  49. Price, W.F.; Hynes, J. In-situ strength testing of high strength concrete. Mag. Concr. Res. 1996, 48, 189–197. [Google Scholar] [CrossRef]
  50. Nazarian, S.; Baker, M.; Crain, K. Assessing quality of concrete with wave propagation techniques. Mater. J. 1997, 94, 296–305. [Google Scholar]
  51. Al-Nu’man, B.S.; Aziz, B.R.; Abdulla, S.A.; Khaleel, S.E. Compressive Strength Formula for Concrete using Ultrasonic Pulse Velocity. Int. J. Eng. Trends Technol. IJETT 2015, 26, 8–13. [Google Scholar]
  52. American Society for Testing and Materials. ASTM C597, Standard Test Method for Pulse Velocity through Concrete; American Society for Testing and Materials: West Conshohocken, PA, USA, 2009. [Google Scholar]
  53. Al-Amawee, A.H.; Salman, M.M. The Ratio between Static and Dynamic Modulusof Elasticity in Normal and High. Strength Concrete. J. Eng. Sustain. Dev. 2006, 10, 163–174. [Google Scholar]
  54. I.E.A.E-T.C.S. No. 17. Guidebook on Non-Destructive Testing of Concrete Structures; Int. Atomic Energy Agency: Vienna, Austria, 2002. [Google Scholar]
  55. Jones, R.; Fącąoaru, I. Recommendations for testing concrete by the ultrasonic pulse method. Matér. Constr. 1969, 2, 275–284. [Google Scholar] [CrossRef]
  56. Liu, J.-C.; Sue, M.-L.; Kou, C.-H. Estimating the strength of concrete using surface rebound value and design parameters of concrete material. Tamkang J. Sci. Eng. 2009, 12, 1–7. [Google Scholar]
  57. Sannidha, V. Health Monitoring Of Structures. Master’s Thesis, College of Engineering, Visakhapatham, India, 2008. [Google Scholar]
  58. American Society for Testing and Materials. ASTM C 39-96 Standard Test. Method for Compressive Strength of Cylindrical Concrete Specimens; Annual Book of ASTM Standards; American Society for Testing and Materials: West Conshohocken, PA, USA, 1996. [Google Scholar]
  59. Ravindrarajah, R.S.; Tuck, A. Properties of hardened concrete containing treated expanded polystyrene beads. Cem. Concr. Compos. 1994, 16, 273–277. [Google Scholar] [CrossRef]
  60. Sadrmomtazi, A.; Sobhani, J.; Mirgozar, M.A.; Najimi, M. Properties of multi-strength grade EPS concrete containing silica fume and rice husk ash. Constr. Build. Mater. 2012, 35, 211–219. [Google Scholar] [CrossRef]
  61. Ranjbar, M.M.; Mousavi, S.Y. Strength and durability assessment of self-compacted lightweight concrete containing expanded polystyrene. Mater. Struct. 2015, 48, 1001–1011. [Google Scholar] [CrossRef]
  62. Bogas, J.A.; Gomes, M.G.; Gomes, A. Compressive strength evaluation of structural lightweight concrete by non-destructive ultrasonic pulse velocity method. Ultrasonics 2013, 53, 962–972. [Google Scholar] [CrossRef]
Figure 1. Grain size distribution (sieve) analysis of fine aggregate.
Processes 07 00791 g001
Figure 2. Grain size distribution (sieve) analysis of coarse aggregate.
Processes 07 00791 g002
Figure 3. Expanded polystyrene beads.
Processes 07 00791 g003
Figure 4. Ultrasonic Pulse Velocity Test: (a) UPV formal diagram, (b) Specimen testing.
Processes 07 00791 g004
Figure 5. (a) Operational diagram of Schmitt Rebound Hammer; (b) Sample Testing.
Processes 07 00791 g005
Figure 6. (a) Compressive strength test machine; (b) Cracked cylinder; (c) Interface of cracked cylinder.
Processes 07 00791 g006
Figure 7. Beads vs. Density (Weight).
Processes 07 00791 g007
Figure 8. Weight (Dead Load) reduction w.r.t percentage beads in addition.
Processes 07 00791 g008
Figure 9. Comparative analysis of EPS-beads density of this study with Ravindrarajah, R. Sri [59], Sadrmomtazi, A., et al. [60], Xu, Yi, et al. [6], Ranjbar, M.M., and Mousavi, S.Y. [61], and Herki, B. [2].
Processes 07 00791 g009
Figure 10. Comparative analysis of EPS-beads Dosage vs. EPS beads concrete Density of this study with Ravindrarajah, R. Sri. [59], Sadrmomtazi, A., et al. [60], Xu, Yi, et al. [6], Ranjbar, M. M., and Mousavi, S. Y. [61] and Herki, B. [2].
Processes 07 00791 g010
Figure 11. % Beads addition vs. UPV (km/s)
Processes 07 00791 g011
Figure 12. Comparative analysis of UPV of this study with Ravindrarajah, R. Sri [59], and Herki, B. [2].
Processes 07 00791 g012
Figure 13. The compressive strength of EPS-beads lightweight concrete.
Processes 07 00791 g013
Figure 14. The relationship between density and compressive strength.
Processes 07 00791 g014
Figure 15. Comparative analysis of the compressive strength of this study with Ravindrarajah, R. Sri and A. J. Tuck [59], Sadrmomtazi, A., et al. [60], Xu, Yi, et al. [6], Ranjbar, M.M., and Mousavi, S.Y. [61] and Herki, B. [2].
Processes 07 00791 g015
Figure 16. Rebound hammer-based compressive strength (MPa) at 7 and 28 days.
Processes 07 00791 g016
Figure 17. The relationship between density and rebound hammer strength (MPa).
Processes 07 00791 g017
Figure 18. Strength difference vs. percentage beads replacement.
Processes 07 00791 g018
Figure 19. Regression analysis for rebound hammer-based compressive strength (MPa).
Processes 07 00791 g019
Figure 20. The relationship between velocity (UPV) and destructive strength (MPa).
Processes 07 00791 g020
Figure 21. Regression analysis for UPV-based compressive strength (MPa).
Processes 07 00791 g021
Figure 22. (a). Strength variations at 7 days. (b). Strength variation at 28 days.
Processes 07 00791 g022aProcesses 07 00791 g022b
Figure 23. Relationship between percentage beads and Ed at 7 and 28 days.
Processes 07 00791 g023
Figure 24. Effect of UPV values on Ed values.
Processes 07 00791 g024
Table 1. Chemical properties of ordinary Portland Cement.
LOISiO2Al2O3Fe2O3CaOMgOSO3K2ONa2O
3.4120.164.403.6863.302.912.610.940.21
Table 2. Physical properties of ordinary Portland Cement.
PropertyResultStandard
Normal Consistency (%)30ASTM C-187
Fineness%95ASTM C 184
Initial Setting Time(mints)145ASTM C-191
Final Setting Time(mints)220ASTM C-191
Soundness(mm)1ASTM C-189
Table 3. Physical properties of fine aggregate.
PropertyResultStandard
Fineness Modulus2.23ASTM C-136
Bulk Density (kg/m3)1527ASTM C-29
Table 4. Physical properties of coarse aggregate.
Physical Properties
PropertyResultStandards
Bulk Density (kg/m3)1487ASTM C-29
Aggregate Impact value (%)20.45BS812: Part 3
Aggregate Crushing Value (%)26.50BS812: Part 3
Los Angeles abrasion (%)32ASTM: C131
Water Absorption (%)4.9ASTM C-127
Table 5. Physical characteristics of EPS-beads according to ASTM C-578.
Physical PropertyUnitClassification
Type XIType IType VIIIType XIIType XType IIType IVType IXType VIType VIIType V
Density, minkg/m31215181921222629293548
Compressive Resistance at Yield, minKPa356990104104104173173276414690
Flexural Strength, minKPa70173208276276276345345414517690
Water Absorption by Total Immersion, maxvolume%4430.30.330.320.30.30.3
Table 6. Quantity mix proportion of an expanded polystyrene beads concrete.
Mix IDEPSB-0EPSB-5EPSB-10EPSB-15EPSB-20EPSB-25EPSB-30EPSB-35EPSB-40
W/C Ratio0.600.600.600.600.600.600.600.600.60 Processes 07 00791 i001
Repl. of Beads (%)0510152025303540 Processes 07 00791 i002
Cement (kg/m3)320320320320320320320320320 Processes 07 00791 i003
Fine Agg. (kg/m)680680680680680680680680680 Processes 07 00791 i004
Coarse Agg. kg/m3)13261259119211261059995926862795 Processes 07 00791 i005
EPS Beads (kg/m3)00.531.071.62.142.673.213.744.27 Processes 07 00791 i006
Water (kg/m3)192192192192192192192192192 Processes 07 00791 i007
Table 7. Destructive compressive strength (MPa).
Mix IDBeadsDensityCompressive StrengthCompressive Strength
Unit(%)(kg/m3)7 Days (MPa)28 Days (MPa)
EPSB-00232617.3620.42
EPSB-55226016.0218.09
EPSB-1010219414.3215.82
EPSB-1515212812.9114.51
EPSB-2020206011.0613.07
EPSB-2525199710.1512.07
EPSB-303019308.9910.94
EPSB-353518668.249.59
EPSB-404018007.248.21
Table 8. Rebound hammer strength.
Mix IDBeadsDensityCompressive StrengthCompressive Strength
Unit(%)(kg/m3)7 Days (MPa)28 Days (MPa)
EPSB-00232616.5519.77
EPSB-55226015.417.41
EPSB-1010219413.4115.08
EPSB-1515212812.313.33
EPSB-2020206010.6912.64
EPSB-252519979.7711.49
EPSB-303019308.8510.23
EPSB-353518667.79.2
EPSB-404018006.97.93
Table 9. Strength difference b/w destructive and non-destructive testing.
Mix IDBeadsDensity% Difference% Difference
Unit(%)(kg/m3)7 Days28 Days
EPSB-002326−4.67−3.18
EPSB-552260−3.87−3.75
EPSB-10102194−6.35−4.67
EPSB-15152128−4.72−8.13
EPSB-20202060−3.34−3.28
EPSB-25251997−3.74−4.80
EPSB-30301930−1.55−6.48
EPSB-35351866−6.55−4.06
EPSB-40401800−4.69−3.41
Table 10. Difference between destructive strength and UPV predicted strength at 7 days.
Mix IDBeadsAvg Velocity 7 daysPredicted StrengthDestructive (C.S)Difference
Units(%)km/s7 Days (MPa)7 Days (MPa)%
EPSB-004.2217.6817.361.84
EPSB-554.0116.2616.021.5
EPSB-10103.7514.4914.321.19
EPSB-15153.5713.2712.912.79
EPSB-20203.3311.6311.065.15
EPSB-25253.1610.4810.153.25
EPSB-30302.999.328.993.67
EPSB-35352.818.18.24−1.7
EPSB-40402.687.227.24−0.28
Table 11. Difference between destructive strength and UPV predicted strength at 28 days.
Mix IDBeadsAvg Velocity 28 daysPredicted StrengthDestructive (C.S)Difference
Unit(%)km/s28 Days (MPa)28 Days (MPa)%
EPSB-004.4719.3820.42−5.09
EPSB-554.318.2318.090.77
EPSB-10104.0316.3915.823.6
EPSB-15153.8615.2414.515.03
EPSB-20203.613.4713.073.06
EPSB-25253.3811.9712.07−0.83
EPSB-30303.1510.4110.94−4.84
EPSB-35353.019.469.59−1.36
EPSB-40402.828.178.21−0.49

