Article

Pressure Drop and Cavitation Analysis on Sleeve Regulating Valve

1
Institute of Process Equipment, College of Energy Engineering, Zhejiang University, Hangzhou 310027, China
2
Hangzhou Special Equipment Inspection & Research Institute, Hangzhou 310051, China
3
Shanghai Power Equipment Research Institute CO., Ltd., Shanghai 200240, China
*
Author to whom correspondence should be addressed.
Processes 2019, 7(11), 829; https://doi.org/10.3390/pr7110829
Submission received: 15 October 2019 / Revised: 4 November 2019 / Accepted: 4 November 2019 / Published: 7 November 2019
(This article belongs to the Special Issue Smart Flow Control Processes in Micro Scale)

Abstract

:
The sleeve regulating valve is widely used in the pipeline systems of process industries to control fluid flow. When flowing through the sleeve regulating valve, the water is easy to reach cavitation because of the pressure drop in the partial region, which may cause serious damage to pipeline system. In this paper, the pressure drop and cavitation characteristics in the sleeve regulating valve for different pressure differences and valve core displacements are investigated using a multiphase cavitation model. The pressure drop, velocity and vapor volume distribution in the regulating valves are obtained and analyzed. The total vapor volumes are also predicted and compared. The results show that the decrease of the valve core displacement induces the enlargement of the vapor distribution region and the increase of the vapor density. The increase of the pressure difference induces a more serious cavitation. The pressure difference has a slight influence on the cavitation intensity and density in the regulating valve when the valve core displacement is 60 mm. With the decrease of the valve core displacement, the effects of the pressure difference on the cavitation intensity are enhanced. This work is of significance for the cavitation control of the sleeve regulating valves.

1. Introduction

The regulating valve is widely used in the pipeline system of process industries such as power engineering, chemical engineering and petrifaction. A regulating valve is opened with the movement upward of the valve core and the flow rate passing through the regulating valve is changed by adjusting the distance between a stationary valve seat and a movable valve core. For a regulating valve which conveys liquids such as water, cavitation is a serious and destructive problem during its operation because of the pressure drop owing to the variation of velocity. When the local pressure is lower than the corresponding saturated vapor pressure at the same temperature, bubbles can form and then grow until bursting. Longtime cavitation flow can not only induce the waste of energy, but also cause the failure of the piping system. Meanwhile, the lifetime of valves is reduced and noise can also be induced within cavitation flow. Thus, the investigation of cavitation inside the regulating valves is necessary.
In recent years, some meaningful research has been carried out focusing on the cavitation flow. For example, cavitation inside a venturi tube [1], a cone flow channel [2], and pumps [3,4,5,6,7] has been investigated using experimental or numerical methods, and the effects of fluctuating flow [2] and liquid temperature [3,7] or other variables such as nano particles [8] on cavitation distribution have been analyzed. Meanwhile, a variety of meaningful research focusing on the cavitation flow inside the valves has been carried out by experimental and numerical methods. Qian et al. [9] carried out a comprehensive review of cavitation in valves. Hassis [10] conducted the experiment study of the effects of cavitation in butterfly and Monovar valves. Herbertson et al. [11] proposed a novel approach for analyzing the mechanical heart valve cavitation. Gao et al. [12] investigated the cavitation near the orifice of hydraulic valves by numerical method and flow visualization experimental method. Jin et al. [13] also carried out the research on cavitation flow through a micro-orifice. Jia et al. [14] simulated the cavitation flowing through the cylinder valve port and conducted the flow visualization cavitation experiment of cylinder valve. Liu et al. [15] investigated the cavitation flow in the rotary valve of hydraulic power steering gear. Lu et al. [16] researched the acoustic characteristics of cavitation noise in a spool valve with U-notches. Li et al. [17] also researched the cavitation phenomenon of an electrohydraulic servo-valve. The numerical results show a good agreement with experimental observations. Kudzma et al. [18] studied the flow and cavitation in hydraulic lift valve by visualization experiments and acoustic tests. Qu et al. [19] studied the cavitation performance on a pressure-regulating valve with different openings by experiment and numerical simulation. Ulanicki et al. [20] proposed a methodology which is used to evaluate whether a pressure reducing valve is under cavitation. Deng et al. [21] researched the cavitation flow inside the spool valve with large pressure drop using numerical method. Ou et al. [22] simulated the cavitation flow in pressure relief valve with high pressure differentials for different valve openings, inlet pressure and outlet pressure. Yi et al. [23] investigated the interactions between the poppet vibration characteristics and cavitation property in relief valves with the unconfined poppet experimentally. Okita et al. [24] researched the mechanism of noise generation by cavitation in hydraulic relief valve by means of experiment and numerical simulation. Lu et al. [25] analyzed the vortex flow produced large vapor cavity in a u-shape notch spool valve. Jin et al. [26] researched the influence of the structural parameters for globe valves on hydrodynamic cavitation. Pressure loss is an important parameter to influence the cavitation. Some researches focusing on the pressure and energy loss in multi-stage Tesla valves were carried out by Qian et al. [27,28].
To reduce cavitation, there were different designs and methods in a number of published manuscripts. Tao et al. [29] researched the flow loss in a v-port ball valve by experimental and numerical method. Baran et al. [30] proposed a new method of controlling the butterfly valve which operated with cavitation. A position fuzzy controller was used to change the valve opening to suppress cavitation. Zhang et al. [31] proposed a novel approach of suppressing cavitation which induced the pressure back to the orifice to improve the pressure distribution of throttle valves. Shi et al. [32] proposed a modified throttle valve with a drainage device to suppress the cavitation and evaluate the influence of inlet and outlet pressure on the ability of the drainage device to suppress cavitation by experiments. There were also some designs of valve sleeves and perforated plates to suppress cavitation, which used multi-stage sleeves to reduce pressure gradually. For instance, Qian et al. [33] focused on the fluid flow through multi-stage perforated plates. Chern et al. [34] and Yaghoubi et al. [35] researched the influences of throttle sleeve stages on cavitation in a globe valve. Qi et al [36] studied the metrological performance of a swirlmeter affected by flow regulation with a sleeve valve. Furthermore, the parametric analysis on throttle sleeves inside valves were carried out by Qian et al. [37] and Hou et al. [38], respectively.
In this paper, a multiphase cavitation flow model is built to simulate the cavitation inside the sleeve regulating valve. The pressure, velocity and steam volume fraction distribution inside the regulating valves are analyzed and compared for different pressure difference and valve core displacements. The effects of the pressure difference on the flow and cavitation characteristics are revealed. This research is of significance to the cavitation control of the sleeve regulating valve.

2. Numerical Method

2.1. Mathematical Model

Since the actual flow inside the sleeve regulating valve is very complex, the standard k-ε turbulence model was chosen to simulate the turbulence for its advantages in dealing with high Reynolds numbers higher than 107. In the cavitation simulations, phase change occurs between the liquid phase and vapor phase. The simulations are conducted in steady state. The governing equations for the cavitation model used in this paper are based on a single-fluid approach, which regarded the mixture as one fluid. Thus, the mixture continuity and momentum equations are shown as
L t ρ m + ( ρ m v ) = 0
t ( ρ m v ) = p + [ ( μ m + μ t ) v ] + 1 3 [ ( μ m + μ t ) v ] ( ρ m v v )
Here the mixture density ρm and μm are defined as follows:
ρ m = α ρ v + ( 1 α ) ρ l
μ m = α μ m + ( 1 α ) μ l
where ρm, ρv, and ρl represent the mixture, vapor, and liquid densities, respectively; v is the mass average velocity vector; μm, μv and μl represent the mixture, vapor, and liquid dynamic viscosities, respectively, and μt is the turbulence viscosity; p is the pressure; α represents the vapor volume fraction.
The cavitation model employed here is based on the Rayleigh–Plesset equation and is developed by Schnerr and Sauer [39]. Although the compressibility of liquid is very important when bubbles break, the liquid density ρl is assumed as a constant and so are μl, ρv, and μv. Meanwhile, it is assumed that the bubbles remain spherical and there is no thermal conductivity with tube linked with the valves. The liquid–vapor mass transfer is governed by the vapor transport equation:
t ( α ρ v ) + ( α ρ v v v ) = R e R c
Here, Re and Rc are defined as follows:
R e = 3 α ρ v ( 1 α ) ρ l ρ m R b 2 ( p v p ) 3 ρ l , p v p ,
R c = 3 α ρ v ( 1 α ) ρ l ρ m R b 2 ( p p v ) 3 ρ l , p v p ,
where Re represents the mass rates of growth of vapor bubbles and Rc represents the mass rates of breaking of vapor bubbles; vv is the vapor phase velocity, pv is the saturation pressure of water, Rb is the bubble radius and is defined as follows:
R b = ( α 1 α 3 4 π 1 n ) 1 3
where n represents the bubble number density and is usually set as a constant, 1 × 10¹³.

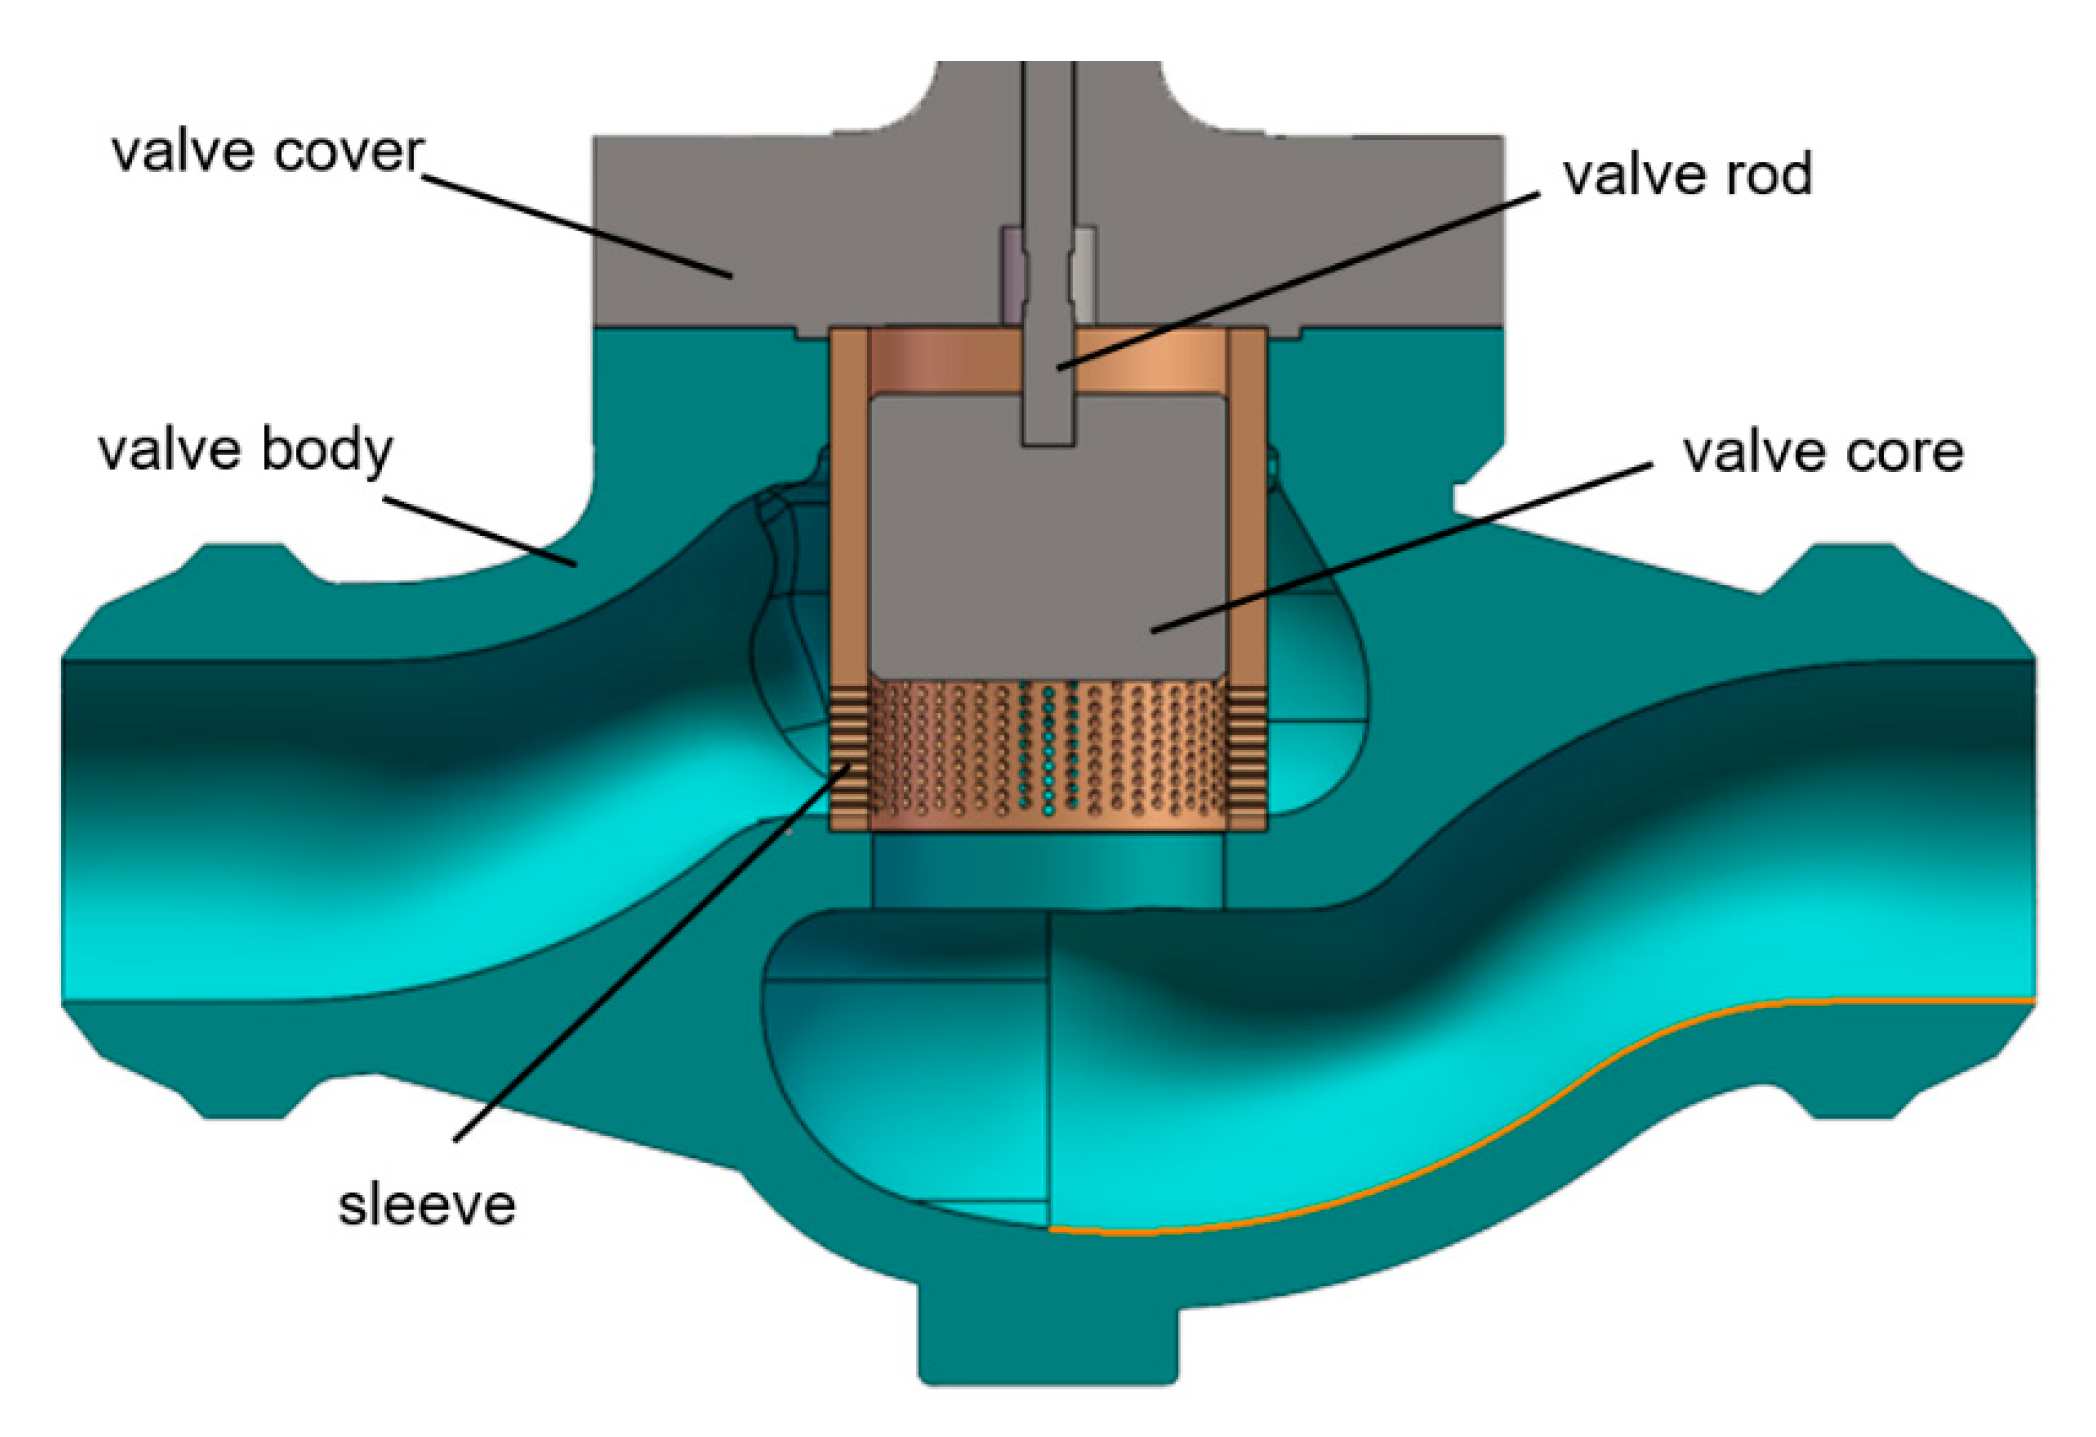
2.2. Geometrical Model

Figure 1 demonstrates the schematic structure of the studied sleeve regulating valve. The sleeve regulating valve is comprised of valve body, valve cover, valve core and the sleeve with orifices. When the valve is opening, the valve core is moved upward, driven by the valve rod and driving device. The inlet diameter is 130 mm and the orifice diameter in the sleeve is 4 mm. The maximum valve core displacement is 60 mm. Fully opened state and half opened state are adopted in this study.
To enable numerical analysis, some simplification is carried out. First, the sleeve regulating valve is assumed as an ideal valve, which means its cutting edge is a right angle exactly with the sharp edges, and the valve core matches the valve seat precisely. Secondly, to save computation time, a 3D axisymmetric geometric model is adopted by considering the symmetry structure. Also, since the cavitation region is partial and the heat transfer due to phase change is little, we take no account of the effects of gravity and heat transfer.

2.3. Mesh and Boundary Conditoms

Figure 2 shows the generated mesh of the sleeve regulating valve with the maximum valve core displacement of 60 mm. To enhance the accuracy of the simulation, the upstream pipe and the downstream pipe length are set as 600 mm which equals to five diameters. Since the flow channel inside the valve is complex, the flow channel is generated using a non-structure mesh partition and the mesh module in ANSYS Workbench 17.2 is employed to generated mesh.
The mesh independency check is carried out with the maximum valve core displacement. The outlet flow rate and the vapor fraction at the border of orifice are both taken as the judgement parameters with different grid numbers from 1,451,696 to 3,138,669. As is shown in Table 1, when the mesh number ranges between 2,407,840 and 3,138,669, the relative errors of the simulation are kept within 1%, so the mesh number 2,708,138 is chosen.
For the boundary conditions, the inlet condition of the sleeve regulating valve is set as the pressure inlet, and the outlet condition is set as pressure outlet condition of 2 MPa. To analyze the effects of the pressure difference on the flow and cavitation characteristics, the pressure inlet is varied from 10 MPa to 3 MPa and the pressure inlet is kept constant. The initial inlet vapor volume fraction is set as 0. The other faces except the symmetry face are set as wall with no slip condition. The wall function method is adopted in the near wall region by using the finite volume method and first order upwind scheme. Coupling pressure and velocity are based on SIMPLE. In addition, the main medium of the sleeve regulating valve is water at 200 °C. Incompressible liquid water is chosen as the liquid phase while water vapor is chosen as the vapor phase. In the simulation, ρl and ρv are set as 862.8 kg/m³ and 7.865 kg/m³, and μl and μv are set as 1.357 × 10⁻⁴ Pa·s and 1.565 × 10⁻⁵ Pa·s, respectively. The vaporization pressure of the liquid phase is set as 1.5 MPa which equals to the saturation vapor pressure of the water at 200 °C. Above operations are all carried out in Fluent 17.2.

3. Results and Discussion

To analyze the effects of the pressure difference on the flow and cavitation characteristics for different valve core displacements, the pressure difference ranges from 1 MPa to 8 MPa by setting the different pressure boundary conditions. In this study, the change of pressure difference is realized by changing the pressure inlet and keeping the outlet pressure as a constant of 2 MPa. The inlet pressure is varied from 3 MPa to 10 MPa. To analyze the effect of the valve openings, the full opening state with the valve core displacement of 60 mm and the half opening state with the valve core displacement of 30 mm are chosen as the analyzed model, respectively.

3.1. Comparsion between Full Opening State and Half Opening State

Figure 3 demonstrates the pressure and velocity distributions of the symmetry cross section inside the sleeve regulating valve with the valve core displacement of 60 mm and 30 mm. The inlet pressure is set as 8 MPa while the outlet pressure is set as 2 MPa.
Although the structure of the sleeve regulating valve is very complex, the pressure and velocity remain stable at the inlet and outlet. As is shown in Figure 3, the pressure for all valve core displacements are kept above 7.5 MPa at the inlet, while the pressure for all valve core displacements remain below 2.5 MPa at the outlet. Meanwhile, the velocity for the valve core displacement of 60 mm is kept above 20 m/s at the inlet while the velocity with the valve core displacement of 30 mm remains below 20 m/s. When the fluid flows through the sleeve which is the main throttling structure, the sudden pressure drop with the velocity increasing appear in the orifices of sleeve for both valve core displacements. Since the throttling cross sections for different valve core displacements are different, the pressure drops induced by the throttling sleeve are totally different. The pressure is decreased below 3.5 MPa for the valve core displacement of 60 mm, while the pressure behind the sleeve is below 2.5 MPa at the half opening state. Accordingly, the region with high velocity in the orifices of sleeve at the half opening state is bigger than these with the valve core displacement of 60 mm. Furthermore, at the outlet of orifices in the sleeve, the pressure is lower than 2 MPa when the valve core displacement is 30 mm. In the left side of the valve chamber, there is always a vortex at both opening states and the pressure for the vortex region is lower than 2 MPa.
Figure 4 describes the pressure and velocity variation along the horizontal direction with different valve core displacements. Some quantified comparisons can be carried out in Figure 4. Although the inlet pressure for two opening states is set as a constant of 8 MPa, the actual inlet pressure for two opening states is lower than 8 MPa slightly. Specifically, the actual inlet pressure for the full opening state is lower than the inlet pressure for half opening state. When the fluid flows through the sleeve, there is a slight pressure increase for two opening states, which is induced by sudden change of the flow cross section area. The pressure lower than 1.5 MPa can also be visualized at the outlet of orifices in the sleeve for the half opening state. At the center of the sleeve, there is a relative pressure rise for two opening states. The pressure rise for the full opening state is higher than pressure rise for the half opening state.
Considering the velocity variation along the horizontal direction, it can be seen that the average velocity at the inlet and outlet with the maximum valve core displacement of 60 mm is higher than the average velocity with the valve core displacement of 30 mm. However, the velocity rise when the fluid flows through the sleeve at the half opening state is higher than the velocity rise at the full opening state. It can be obtained that the energy consume with the valve core displacement of 30 mm is more than the energy consumed with the maximum valve core displacement.
Figure 5 depicts the vapor distributions inside the sleeve regulating valve. It can be seen that the decrease of the valve core displacement induces the enlargement of the vapor distribution region and the increase of the vapor density. The vapor is mainly concentrated in the edge of orifice inlet at the full opening state. When the valve core displacement is decreased from 60 mm to 30 mm, the vapor begins to appear in the orifice outlet and the sealing surface of the valve core.

3.2. Flow Field Analysis for Different Pressure Difference

Figure 6 demonstrates the pressure distribution of the valve symmetric cross section for different pressure differences with the valve core displacements of 60 mm and 30 mm. When the pressure difference is the lowest of 1 MPa, the pressure distributions for different valve core displacements are shown in Figure 6a,b. The pressure at the inlet and outlet remain stable above 3.5 MPa and below 2.5 MPa, respectively. The pressure drop appears suddenly behind the sleeve, which is the main throttling region. The difference of the pressure distributions induced by the valve core displacement is the region with high pressure at the center of the valve chamber. With the increase in pressure difference, the pressure at the orifice inlet of the sleeve is increased while the pressure drop when flowing through the sleeve is increased. The region with high pressure at the center of the sleeve is enlarged with the increase of the pressure difference while the value of pressure is increased. The outlet pressure for all pressure differences are kept below 2.5 MPa.
To further quantify the pressure variation for different pressure differences, the pressure variations along the horizontal direction for different pressure differences are shown in Figure 7. The actual pressure at the inlet for different pressure differences are all lower than the initial setting pressure and the difference between the actual pressure and setting pressure is increased with the increase of the pressure difference. There is a pressure rise slightly before the fluid flows through the sleeve and the pressure rise is increased with the increase of the pressure difference. In addition, when the fluid flows out of the valve chamber, there is also a pressure rise slightly because of the change of the flow channel structure. The pressure variation along the horizontal direction at the half opening state is similar to the pressure variation at the full opening state, except for the pressure lower than 1.5 MPa at the orifices outlet of the sleeve.
Figure 8 shows the velocity and streamlines distribution of the valve symmetric cross section for different pressure differences with the valve core displacements of 60 mm and 30 mm. It can be found that the inlet velocity is increased with the increase of the pressure difference. For instance, when the valve core displacement is 60 mm, the inlet velocity for the pressure difference of 2 MPa is lower than 20 m/s while the inlet velocity for the pressure difference of 5 MPa is higher than 20 m/s and lower than 30 m/s. The inlet velocity for the maximum pressure difference of 8 MPa is higher than 30 m/s. The velocity rise when flowing through the sleeve is increased while the velocity at the center of valve chamber is increased with the increase of pressure difference. There is no difference in the vortex in the left side of the valve chamber for different pressure difference. The outlet velocity is increased with the increase of the pressure difference.
Figure 9 demonstrates the velocity variation along the horizontal direction for different pressure differences. It can be seen that the velocity at the inlet and outlet when the pressure difference is 1 MPa it is the lowest, while the inlet and outlet velocity for the pressure difference of 8 MPa is the highest. With the increase of the pressure difference, the inlet and outlet velocity are increased. The above phenomenon indicates that the higher initial pressure brings a higher initial energy. The pressure rise in the orifices and the center of the sleeve indicate the same conclusion as the above analysis.
Figure 10 depicts the flow rate variation with the increase of the pressure difference. It can be seen that the mass flow rate is increased with the increase of the pressure difference for two opening states. Totally, the mass flow rates for the full opening state is higher than the flow rates for the half opening state, more than twice flow rates for the half opening state. For example, when the pressure difference is 4 MPa, the mass flow rate with the valve core displacement of 30 mm is 69.07 kg/s while the mass flow rate with the valve core displacement of 60 mm is 131.79 kg/s, which is more than twice 69.07 kg/s. The phenomenon indicates the flux characteristics curve of the studied sleeve regulating valve is convex when comparing with the linear flux characteristic. The increase velocity of the mass flow rate is increased first and then decreased. The increase velocity of the mass flow rate for the full opening state is higher than the increase velocity for the half opening state.

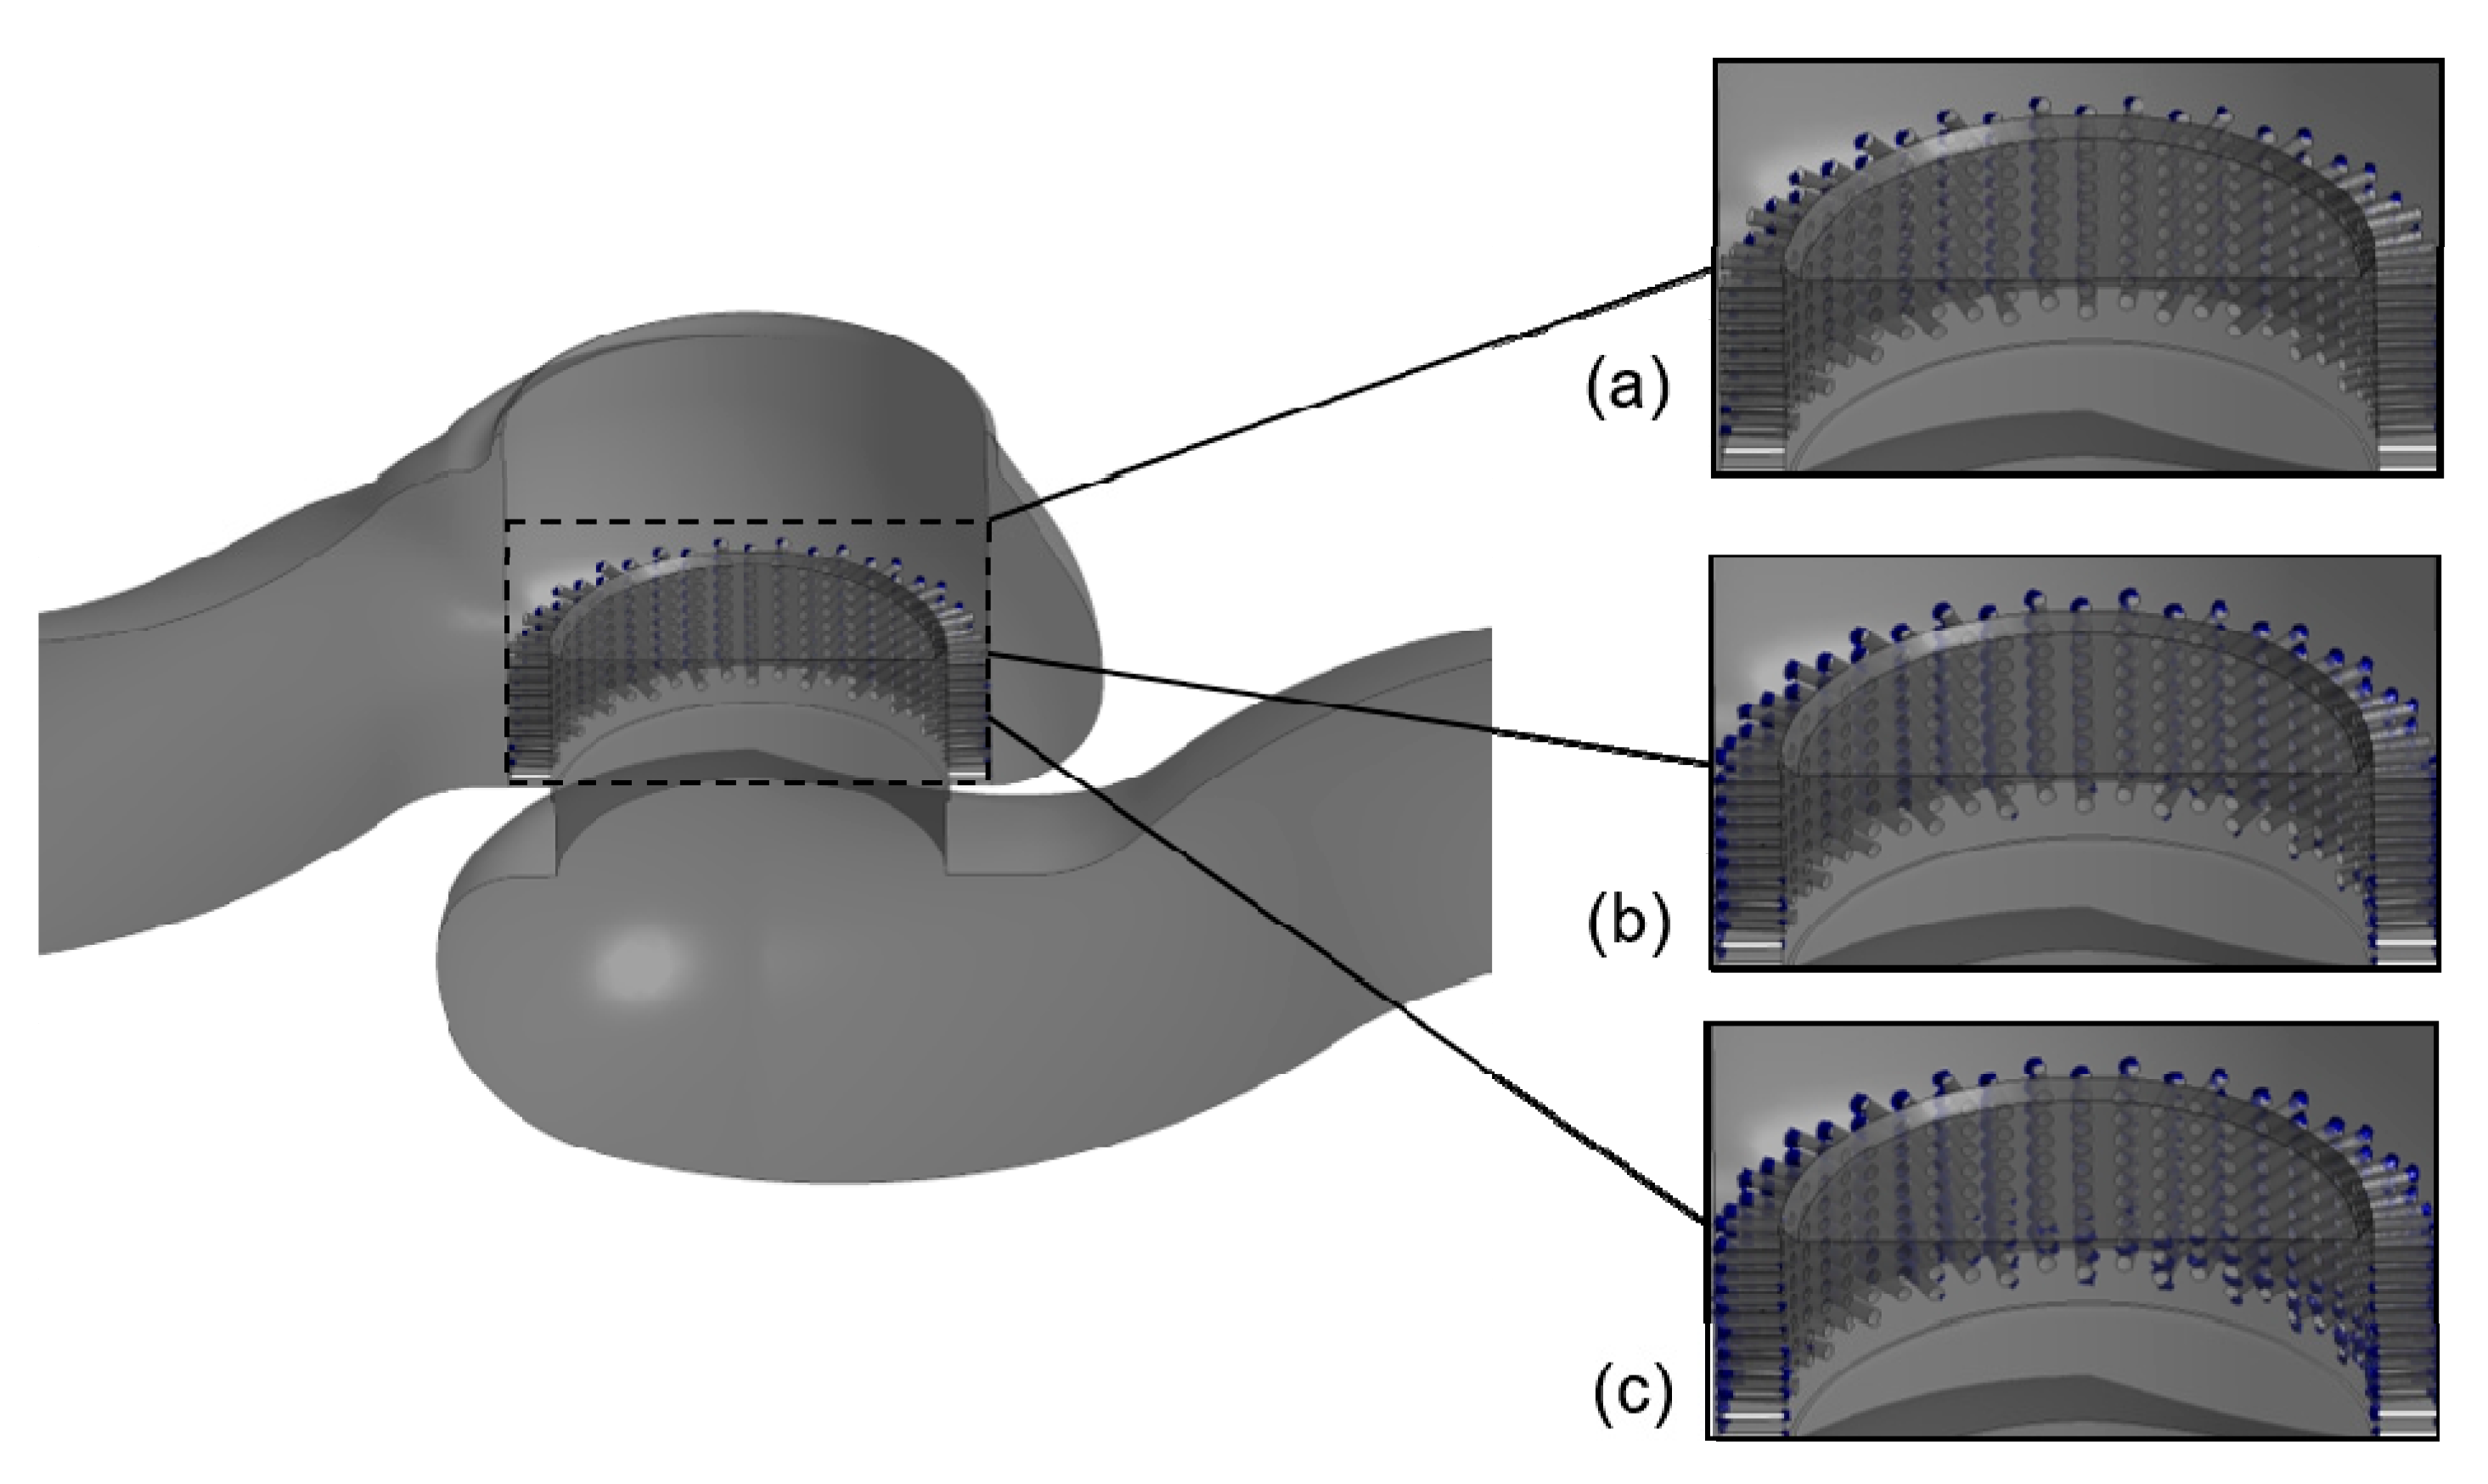
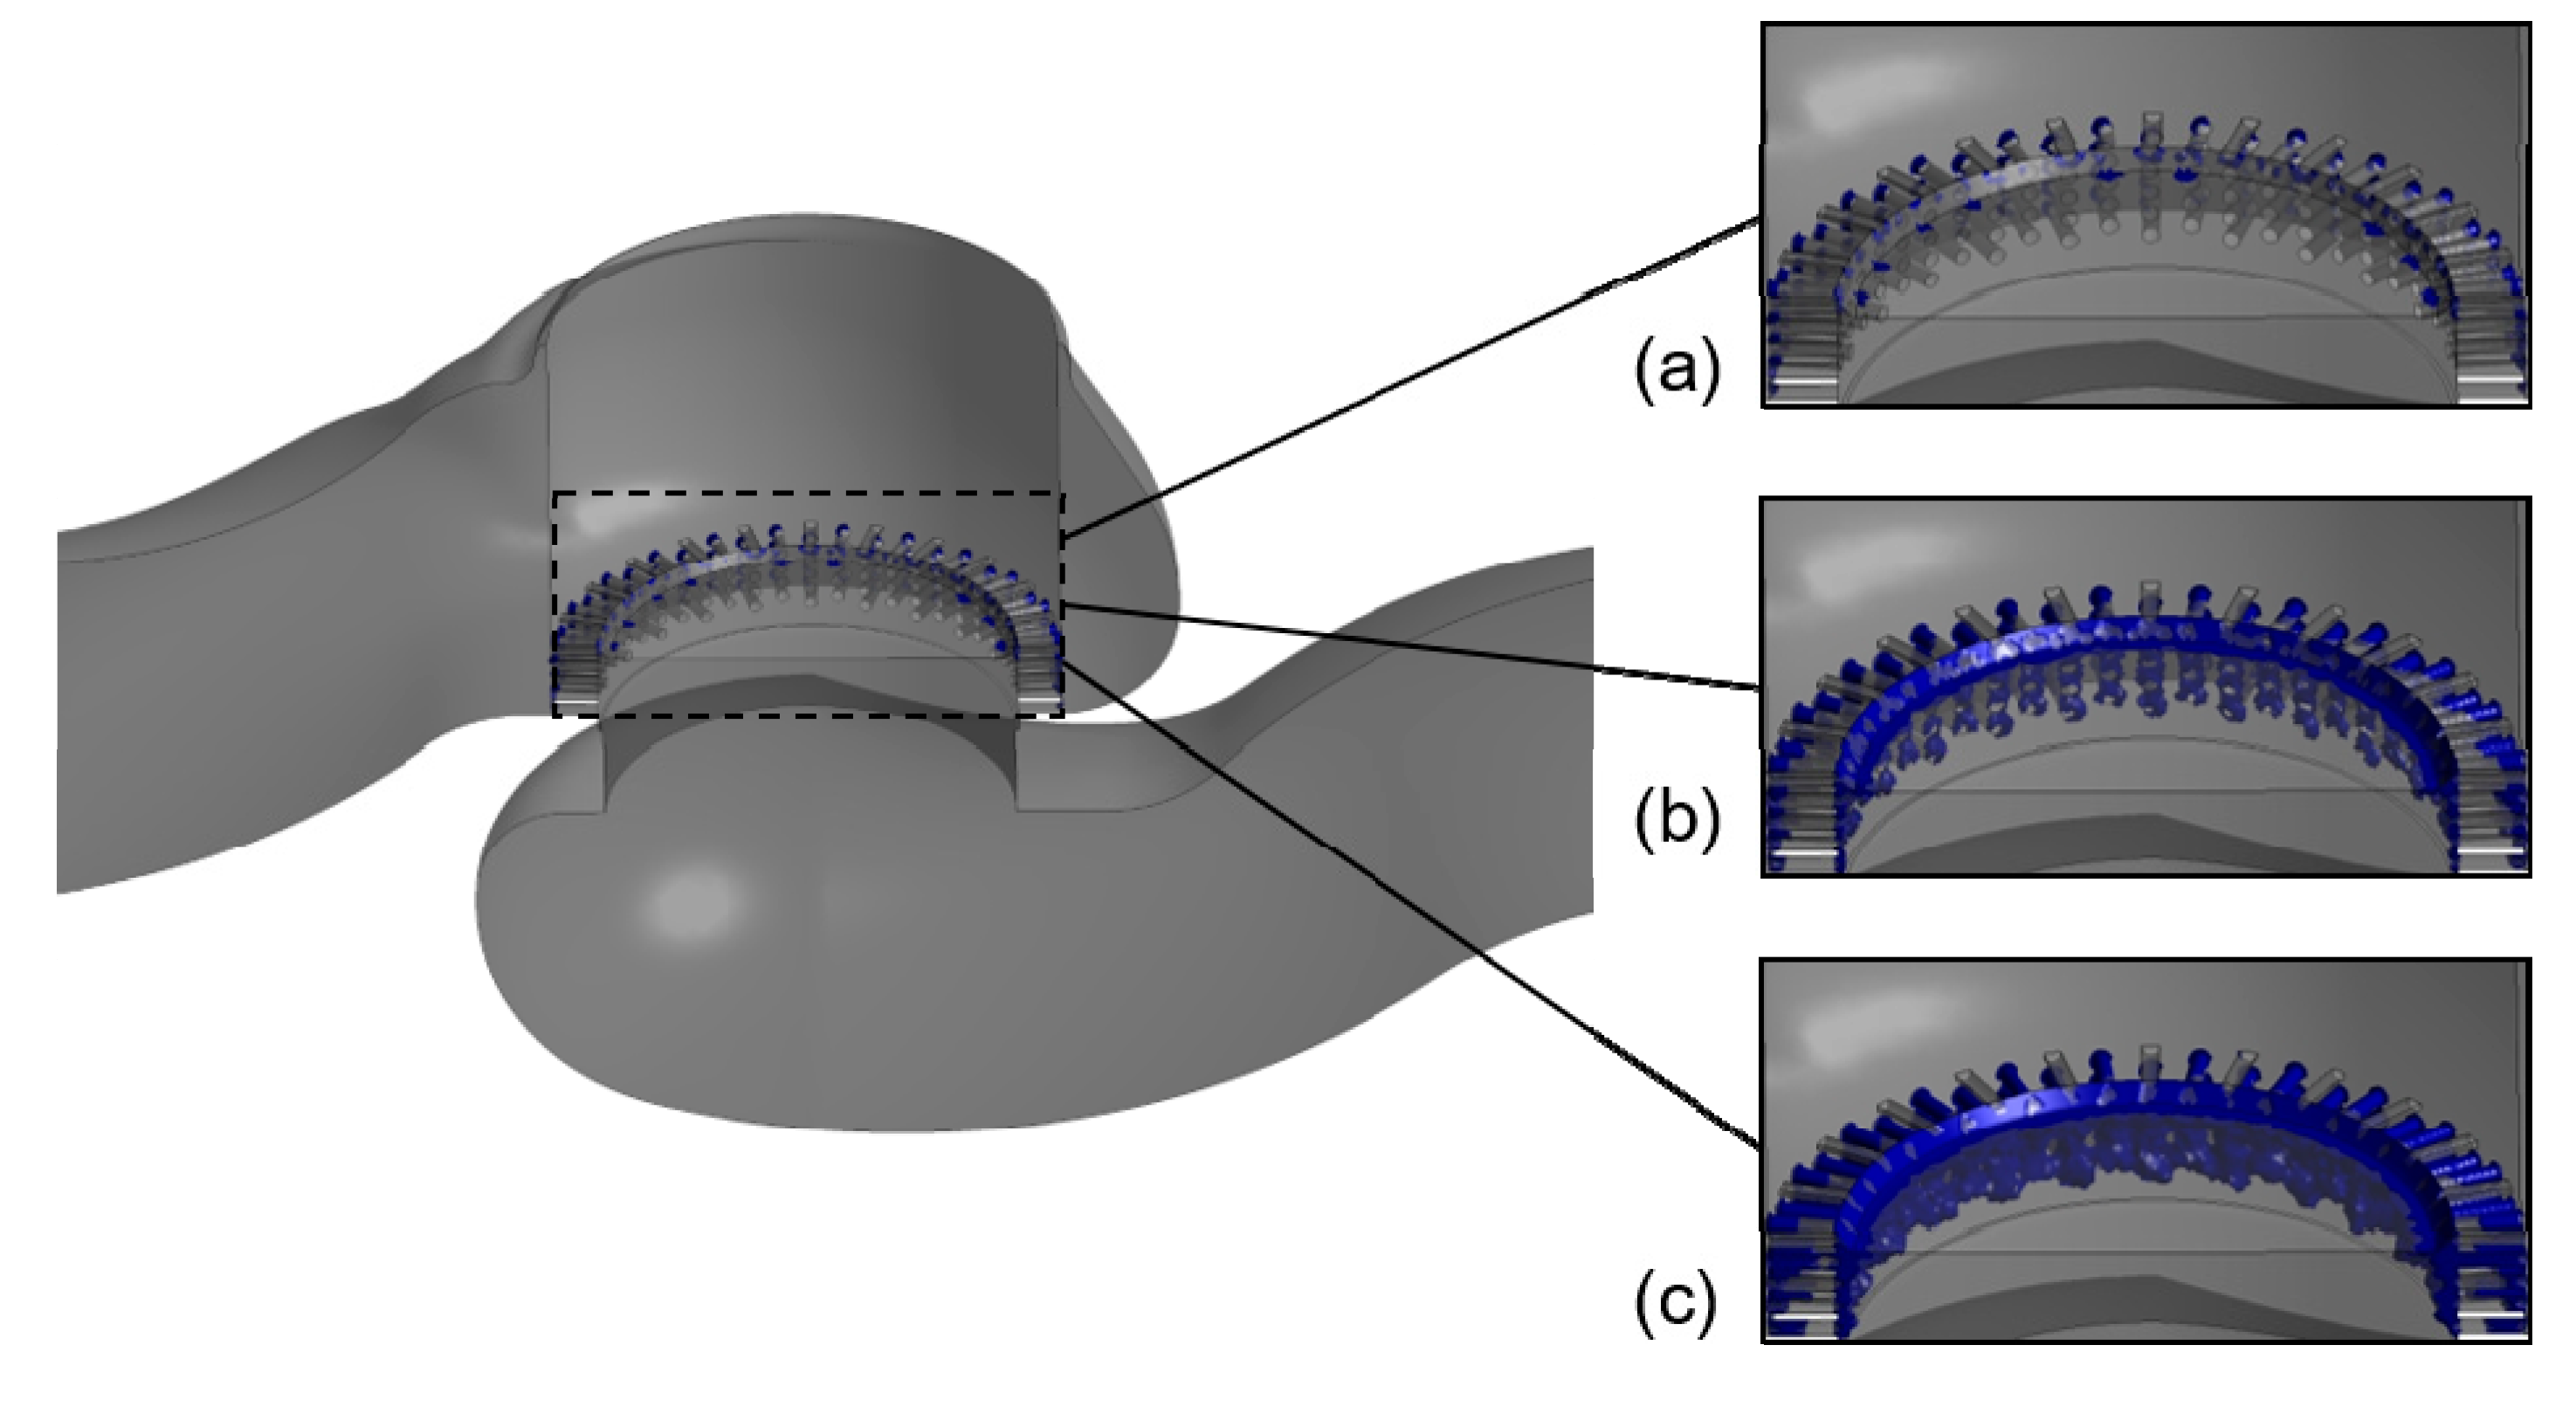
3.3. Cavitation Distribution Analysis for Difference Pressure Differences

Figure 11 demonstrates the vapor distributions inside the sleeve regulating valve for different pressure difference with the valve core displacement of 60 mm. In general, when cavitation causes severe valve damages, the vapor volume fraction of each computational cell, α, is higher than 0.5. Figure 11a–c depicts three-dimensional isosurfaces of αlarger than 0.5 in valves with the valve core displacement of 60 mm for different pressure differences.
For the pressure difference of 2 MPa, the vapor appears at the orifices inlet of the sleeve and the distribution region is very small. When the pressure difference is increased from 2 MPa to 5 MPa, the vapor is still concentrated at the orifice inlet of the sleeve but the distribution region is enlarged slightly. Furthermore, when the pressure difference is 8 MPa, the vapor begins to appear at the outlet of orifices in the sleeve and the distribution region is further enlarged. As a whole, the cavitation intensity and density are tiny when the valve core displacement is 60 mm and the pressure difference has a slight influence on the cavitation intensity and density inside the regulating valve.
When the valve core displacement is decreased from 60 mm to 30 mm, as is shown in Figure 12, the effect of the pressure difference on the cavitation intensity and density is enhanced. The vapor distribution region is still very small when the pressure difference is 2 MPa. However, when the pressure difference is increased from 2 MPa to 4 MPa, the cavitation distribution region is obviously enlarged and the vapor begins to appear on the sealing surface of the valve core. There is no doubt the increase of the pressure difference induces a more serious cavitation. Moreover, when the pressure difference reaches the maximum value of 8 MPa, the vapor almost fills the orifices in the valve and the total sealing surface is filled with vapor. Meanwhile, the vapor distribution region begins to extend downward along the surface of the valve chamber.
To further quantify the influence of the pressure difference on cavitation characteristics of the sleeve regulating valve, the total vapor volume is also calculated using the following equation:
V v = Ω α d V
where α denotes the vapor volume fraction in an element. The total vapor volume demonstrates the whole vapor caused by cavitation, so the total vapor volume can represent the intensity of the cavitation. The higher the total vapor volume is, the more intense the cavitation intensity is. The total vapor volume quantifies the cavitation intensity.
Figure 13 depicts the total vapor volume variation with the increase of the pressure difference when the valve core displacement is 60 mm and 30 mm. It can be found that the total vapor volumes for two opening state are increased with the increase of the pressure difference. However, the increase trends for two opening states are totally different. When the pressure difference is lower than 3 MPa, the total vapor volumes for two opening states are close to 0. The above phenomenon indicates that the cavitation intensity is still very low for both opening states when the pressure difference is lower than 3 MPa. The low-pressure difference induces the slight cavitation. When the pressure difference is higher than 3 MPa, the increase trend for the half opening state begins to be steep suddenly, while the increase trend for the half full opening state is still very gentle.
To estimate the probable occurrence of cavitation, the cavitation index σv is calculated and denoted as
σ v = p d p v p u p d
where pu is the inlet pressure, pd is the outlet pressure, and the lower the σv is, the higher is the potential. In general, when the σv is lower than 1.0, the cavitation will occur. When the σv is lower than 0.5, the cavitation phenomenon will be stable.
In this study, the inlet and outlet pressure are determined by the inlet and outlet boundary conditions. The saturation vapor pressure is set as a constant of 1.5 MPa. Therefore, the cavitation index for the valve at specified pressure conditions is certain. To further quantify the actual influence of the cavitation index on the actual cavitation intensity in the sleeve regulating valve, the total vapor volumes variation with the change of the cavitation index is shown in Figure 14. It can be seen that for different opening states, the actual effects of the cavitation index on the total vapor volumes are really different, and the lower the cavitation index is, the higher the difference is for different opening states. As the cavitation index is higher than 0.2, for both two opening state, the variation of the cavitation index has a small influence on the total vapor volume and cavitation intensity. When the cavitation index is lower than 0.2, the total vapor volume is increased with a steep trend at the half opening state, which indicates that a small variation of cavitation index induces a more drastic variation of the total vapor volume. When the valve core displacement is 60 mm, the variation trend of total vapor volume is gentler than the trend at the half opening state when the cavitation is lower than 0.2. As a whole, the relation between actual cavitation intensity and cavitation index is not simply linear and is changed with the change of valve core displacement. When the cavitation index is higher than 0.2, the cavitation index’s effects on cavitation intensity are small. As the cavitation index is lower than 0.2, the cavitation index’s effects on cavitation intensity are intense.

4. Conclusions

The cavitation occurring in a sleeve regulating valve for different pressure differences and valve core displacements has been numerically investigated in this study, and the effects of pressure difference and valve core displacement have been revealed using the proposed numerical model.
First, the flow streamlines, pressure distribution and vapor distribution for different opening state are obtained. A high-velocity and low-pressure region appear behind the valve sleeve because of the sudden decrease of the cross-section area. According to the predicted vapor distribution, the vapor is mainly concentrated in the edge of orifice inlet at the full opening state. The decrease of the valve core displacement induces the enlargement of the vapor distribution region and the increase of the vapor density.
Second, the pressure and flow streamlines for different pressure difference are analyzed. With the increase in pressure difference, the pressure at the orifice inlet of the sleeve is increased while the pressure drop when flowing through the sleeve is increased. The region with high pressure at the center of the sleeve is enlarged with the increase of the pressure difference, while the value of pressure is increased. The inlet velocity is increased with the increase of the pressure difference. The velocity rise when flowing through the sleeve is increased while the velocity at the center of valve chamber is increased with the increase of pressure difference.
Last, the cavitation distributions inside the sleeve regulating valve for different pressure differences are analyzed. It can be seen that the increase of the pressure difference induces a more serious cavitation. The pressure difference has a slight influence on the cavitation intensity and density inside the regulating valve when the valve core displacement is 60 mm. When the valve core displacement is decreased from 60 mm to 30 mm, the effects of the pressure difference on the cavitation intensity are enhanced. The relation between actual cavitation intensity and cavitation index is not simply linear and is changed with the change of valve core displacement. When the cavitation index is higher than 0.2, the cavitation index’s effects on cavitation intensity are small. As the cavitation index is lower than 0.2, the cavitation index’s effects on cavitation intensity are intense.

Author Contributions

Conceptualization, C.Q. and C.-H.J.; methodology, C.Q. and C.-H.J.; software, C.Q.; validation, C.-H.J., H.Z. and J.-Y.W.; formal analysis, C.Q.; investigation, H.Z.; resources, C.Q.; data curation, C.-H.J.; writing—original draft preparation, C.Q.; writing—review and editing, C.-H.J.; visualization, J.-Y.W.; supervision, Z.-J.J.; project administration, Z.-J.J.; funding acquisition, Z.-J.J.

Funding

This research was funded by the National Natural Science Foundation of China (NSFC), grant number 51875514; the Zhejiang Key Research & Development Project, grant number 2019C01025; and the Zhejiang Quality and Technical Supervision Research Project, grant number 20180117.

Conflicts of Interest

The authors declare no conflict of interest.

Nomenclature

ppressure (MPa)
pvsaturation pressure of water (MPa)
ttime (s)
vmass average velocity (m/s)
Vvtotal vapor volume (m3)
Rbbubble radius (m)
Rcrates of breaking of vapor bubbles
αvapor volume fraction
nbubble number density
ρmmixture density (kg/m³)
ρlliquid density (kg/m³)
ρvvapor density (kg/m³)
μmmixture dynamic viscosity (Pa·s)
μlliquid dynamic viscosity (Pa·s)
μvvapor dynamic viscosity (Pa·s)
μtturbulent viscosity (Pa·s)
vvvapor phase velocity (m/s)
Lvalve core displacement (mm)

References

  1. Long, X.; Zhang, Y.; Wang, J.; Xu, M.; Lyu, Q.; Ji, B. Experimental investigation of the global cavitation dynamic behavior in a venturi tube with special emphasis on the cavity length variation. Int. J. Multiph. Flow 2017, 89, 290–298. [Google Scholar] [CrossRef]
  2. Liu, H.; Cao, S.; Luo, X. Study on the effect of inlet fluctuation on cavitation in a cone flow channel. ASME J. Fluids Eng. 2015, 137, 051301. [Google Scholar]
  3. Kim, J.; Song, S.J. Measurement of temperature effects on cavitation in a turbopump inducer. ASME J. Fluids Eng. 2016, 138, 011304. [Google Scholar] [CrossRef]
  4. Xiao, L.; Long, X. Cavitating flow in annular jet pumps. Int. J. Multiph. Flow 2015, 71, 116–132. [Google Scholar] [CrossRef]
  5. Zhang, D.; Shi, W.; Pan, D.; Dubuisson, M. Numerical and experimental investigation of tip leakage vortex cavitation patterns and mechanisms in an axial flow pump. ASME J. Fluids Eng. 2015, 137, 121103. [Google Scholar] [CrossRef]
  6. Zhu, B.; Hongxun, C. Analysis of the staggered and fixed cavitation phenomenon observed in centrifugal pumps employing a gap drainage impeller. ASME J. Fluids Eng. 2016, 139, 031301. [Google Scholar] [CrossRef]
  7. Wang, C.; Hu, B.; Zhu, Y.; Luo, C.; Cheng, L. Numerical study on the gas-water two-phase flow in the self-priming process of self-priming centrifugal pump. Processes 2019, 7, 330. [Google Scholar] [CrossRef]
  8. Qian, J.; Chen, M.; Liu, X.; Jin, Z. A numerical investigation of flow of nanofluids through a micro Tesla valve. J. Zhejiang Univ. Sci. A 2019, 20, 50–60. [Google Scholar] [CrossRef]
  9. Qian, J.; Gao, Z.; Hou, C.; Jin, Z. A comprehensive review of cavitation in valves: Mechanical heart valves and control valves. Bio-Design Manuf. 2019, 2, 119–136. [Google Scholar] [CrossRef]
  10. Hassis, H. Noise caused by cavitating butterfly and monovar valve. J. Sound Vib. 1999, 225, 515–526. [Google Scholar] [CrossRef]
  11. Herbertson, L.H.; Reddy, V.; Manning, K.B.; Welz, J.P.; Deutsch, S. Wavelet transforms in the analysis of mechanical heart valve cavitation. J. Biomech. Eng. 2006, 128, 217–222. [Google Scholar] [CrossRef] [PubMed]
  12. Gao, H.; Lin, W.; Tsukiji, T. Investigation of cavitation near the orifice of hydraulic valves. Proc. Inst. Mech. Eng. Part G J. Aerosp. Eng. 2006, 220, 253–265. [Google Scholar] [CrossRef]
  13. Jin, Z.; Gao, Z.; Li, X.; Qian, J. Cavitation flow through a micro-orifice. Micromachines 2019, 10, 191. [Google Scholar] [CrossRef] [PubMed]
  14. Jia, W.H.; Yin, C.B. Numerical analysis and experiment research of cylinder valve port cavitating flow. In Proceedings of the Fourth International Conference on Experimental Mechanics, Singapore, 18–20 November 2009. [Google Scholar]
  15. Liu, Y.H.; Ji, X.W. Simulation of cavitation in rotary valve of hydraulic power steering gear. Sci. China 2009, 52, 3142–3148. [Google Scholar] [CrossRef]
  16. Lu, L.; Zou, J.; Fu, X. The acoustics of cavitation in spool valve with U-notches. Proc. Inst. Mech. Eng. Part G J. Aerosp. Eng. 2011, 226, 540–549. [Google Scholar] [CrossRef]
  17. Li, S.; Aung, N.Z.; Zhang, S.; Cao, J.; Xue, X. Experimental and numerical investigation of cavitation phenomenon in flapper-nozzle pilot stage of an electrohydraulic servo-valve. Comput. Fluids 2013, 88, 590–598. [Google Scholar] [CrossRef]
  18. Kudźma, Z.; Stosiak, M. Studies of flow and cavitation in hydraulic lift valve. Arch. Civil Mech. Eng. 2015, 15, 951–961. [Google Scholar] [CrossRef]
  19. Qu, W.S.; Tan, L.; Cao, S.L.; Xu, Y.; Huang, J.; Xu, Q.H. Experiment and numerical simulation of cavitation performance on a pressure-regulating valve with different openings. IOP Conf. Ser. Mater. Sci. Eng. 2015, 72, 042035. [Google Scholar] [CrossRef] [Green Version]
  20. Ulanicki, B.; Picinali, L.; Janus, T. Measurements and analysis of cavitation in a pressure reducing valve during operation—A Case Study. Procedia Eng. 2015, 119, 270–279. [Google Scholar] [CrossRef]
  21. Deng, J.; Pan, D.; Xie, F.; Shao, X. Numerical investigation of cavitation flow inside spool valve with large pressure drop. J. Phys. Conf. Ser. 2015, 656, 012067. [Google Scholar] [CrossRef] [Green Version]
  22. Ou, G.F.; Xu, J.; Li, W.Z.; Chen, B. Investigation on cavitation flow in pressure relief valve with high pressure differentials for coal liquefaction. Procedia Eng. 2015, 130, 125–134. [Google Scholar] [CrossRef]
  23. Yi, D.L.; Lu, L.; Zou, J.; Fu, X. Interactions between poppet vibration and cavitation in relief valve. Proc. Inst. Mech. Eng. Part C J. Mech. Eng. Sci. 2015, 229, 1447–1461. [Google Scholar] [CrossRef]
  24. Okita, K.; Miyamoto, Y.; Kataoka, T.; Takagi, S.; Kato, H. Mechanism of noise generation by cavitation in hydraulic relief valve. J. Phys. Conf. Ser. 2015, 656, 012104. [Google Scholar] [CrossRef] [Green Version]
  25. Lu, L.; Xie, S.; Yin, Y.; Ryu, S. Experimental and numerical analysis on the surge instability characteristics of the vortex flow produced large vapor cavity in u-shape notch valve. Int. J. Heat Mass Transfer. 2020, 146, 118882. [Google Scholar] [CrossRef]
  26. Jin, Z.; Gao, Z.; Qian, J.; Wu, Z.; Sunden, B. A parametric study of hydrodynamic cavitation inside globe valve. ASME J. Fluids Eng. 2018, 140, 031208. [Google Scholar] [CrossRef]
  27. Qian, J.; Chen, M.; Gao, Z.; Jin, Z. Mach number and energy loss analysis inside multi-stage Tesla valves for hydrogen decompression. Energy 2019, 179, 647–654. [Google Scholar] [CrossRef]
  28. Qian, J.; Wu, J.; Gao, Z.; Wu, A.; Jin, Z. Hydrogen decompression analysis by multi-stage Tesla valves for hydrogen fuel cell. Int. J. Hydrogen Energy 2019, 44, 13666–13674. [Google Scholar] [CrossRef]
  29. Tao, J.; Lin, Z.; Ma, C.; Ye, J.; Zhu, Z.; Li, Y.; Mao, W. An experimental and numerical study of regulating performance and flow loss in a v-port ball valve. ASME. J. Fluids Eng. 2020, 142, 021207. [Google Scholar] [CrossRef]
  30. Baran, G.; Catana, I.; Magheti, I.; Safta, C.A.; Savu, M. Controlling the cavitation phenomenon of evolution on a butterfly valve. IOP Conf. Ser. Earth Environ. Sci. 2010, 12, 012100. [Google Scholar] [CrossRef]
  31. Zhang, Z.; Cao, S.; Luo, X.; Shi, W. New approach of suppressing cavitation in water hydraulic components. Proc. Inst. Mech. Eng. Part C J. Mech. Eng. Sci. 2016, 231, 4022–4034. [Google Scholar]
  32. Shi, W.; Cao, S.; Luo, X.; Zhang, Z.; Zhu, Y. Experimental research on the cavitation suppression in the water hydraulic throttle valve. J. Press. Vessel Technol. 2017, 139, 051302. [Google Scholar]
  33. Chern, M.J.; Hsu, P.H.; Cheng, Y.J.; Tseng, P.Y.; Hu, C.M. Numerical study on cavitation occurrence in globe valve. J. Energy Eng. 2013, 139, 25–34. [Google Scholar] [CrossRef]
  34. Qian, J.; Hou, C.; Wu, J.; Gao, Z.; Jin, Z. Aerodynamics analysis of superheated steam flow through multi-stage perforated plates. Int. J. Heat Mass Transfer 2019, 141, 48–57. [Google Scholar] [CrossRef]
  35. Yaghoubi, H.; Madani, S.A.H.; Alizadeh, M. Numerical study on cavitation in a globe control valve with different numbers of anti-cavitation trims. J. Cent. South Univ. 2018, 25, 2677–2687. [Google Scholar] [CrossRef]
  36. Liu, Q.; Ye, J.; Zhang, G.; Lin, Z.; Xu, H.; Jin, H.; Zhu, Z. Study on the metrological performance of a swirlmeter affected by flow regulation with a regulating valve. Flow Meas. Instrum. 2019, 67, 83–94. [Google Scholar] [CrossRef]
  37. Qian, J.; Wei, L.; Jin, Z.; Wang, J.; Zhang, H. CFD analysis on the dynamic flow characteristics of the pilot-control globe valve. Energy Convers. Manag. 2014, 87, 220–226. [Google Scholar] [CrossRef]
  38. Hou, C.; Qian, J.; Chen, F.; Jiang, W.; Jin, Z. Parametric analysis on throttling components of multi-stage high pressure reducing valve. Appl. Therm. Eng. 2018, 128, 1238–1248. [Google Scholar] [CrossRef]
  39. Schnerr, G.; Sauer, J. Physical and numerical modeling of unsteady cavitation dynamics. In Proceedings of the 4th International Conference on Multiphase Flow, New Orleans, LA, USA, 27 May–1 June 2001. [Google Scholar]
Figure 1. Schematic structure of the studied sleeve regulating valve.
Processes 07 00829 g001
Figure 2. Mesh of the sleeve regulating valve with maximum valve core displacement of 60 mm (a) overall view; (b) mesh in the sleeve.
Processes 07 00829 g002
Figure 3. Pressure and velocity contours inside the sleeve regulating valve with valve core displacement of 60 mm and 30 mm (a) pressure, 60 mm; (b) pressure, 30 mm; (c) velocity, 60 mm; (d) velocity, 30 mm.
Processes 07 00829 g003
Figure 4. Pressure and velocity variation along the horizontal direction for different valve core displacements (a) pressure; (b) velocity.
Processes 07 00829 g004
Figure 5. Vapor distributions inside the sleeve regulating valve for different valve core displacements (a) 60 mm; (b) 30 mm.
Processes 07 00829 g005
Figure 6. Pressure contours inside the sleeve regulating valve with valve core displacement of 60 mm and 30 mm (MPa) (a) 2 MPa, 60 mm; (b) 2 MPa, 30 mm; (c) 5 MPa, 60 mm; (d) 5 MPa, 30 mm; (e) 8 MPa, 60 mm; (f) 8 MPa, 30 mm.
Processes 07 00829 g006
Figure 7. Pressure variation along the horizontal direction for different pressure differences (a) L = 60 mm; (b) L = 30 mm.
Processes 07 00829 g007
Figure 8. Velocity contours inside the sleeve regulating valve with valve core displacement of 60 mm and 30 mm (m/s) (a) 2 MPa, 60 mm; (b) 2 MPa, 30 mm; (c) 5 MPa, 60 mm; (d) 5 MPa, 30 mm; (e) 8 MPa, 60 mm; (f) 8 MPa, 30 mm.
Processes 07 00829 g008
Figure 9. Velocity variation along the horizontal direction for different pressure differences (a) L = 60 mm; (b) L = 30 mm.
Processes 07 00829 g009
Figure 10. Flow rate variation with the increase of pressure difference for different openings.
Processes 07 00829 g010
Figure 11. Vapor distributions inside the sleeve regulating valve for different pressure difference with the valve core displacement of 60 mm (a) 2 MPa; (b) 5 MPa; (c) 8 MPa.
Processes 07 00829 g011
Figure 12. Vapor distributions inside the sleeve regulating valve for different pressure difference with the valve core displacement of 30 mm (a) 2 MPa; (b) 5 MPa; (c) 8 MPa.
Processes 07 00829 g012
Figure 13. Total vapor volumes inside the valve for different pressure differences with the valve core displacement of 60 mm and 30 mm.
Processes 07 00829 g013
Figure 14. Total vapor volumes inside the valve for different cavitation index with the valve core displacement of 60 mm and 30 mm.
Processes 07 00829 g014
Table 1. Mesh independency check of various meshes.
GridsFlow Rate (kg/s)Volume Fraction
1,451,696162.720.1296
1,705,067162.140.2272
2,055,352168.310.2676
2,407,840167.740.2829
2,708,138167.370.2585
3,138,669167.010. 2323

