1. Introduction
The petrochemical industry is one of the important energy-based industries for the development of the national economy [
1]. While ethylene is the foundation of the chemical industry, its production level usually represents the level of development of a country’s petrochemical industry [
2]. It can be seen that the ethylene industry has an extremely important position in the petrochemical industry.
In ethylene industry, the ethylene cracking furnace is the key equipment to produce ethylene. As the core component of the ethylene cracking furnace, the safe and stable operation of the cracking furnace tubes is the key factor to ensure the ethylene yield [
3]. However, in the ethylene production process, carburizing and coking always inevitably occur in the cracking furnace tubes [
4,
5]. The presence of carburization and coking will greatly shorten the service life of the ethylene cracking furnace tubes, reduce the yield of ethylene, and affect the production efficiency and economic benefits of ethylene.
For the cause of coking formation, a lot of research was carried out as early as the 1950s. In 1988, the three coking principles of catalytic coking, condensation coking, and free radical coking were proposed by Albright [
6], which are currently widely recognized as the principle of coking [
7,
8]. At present, the purpose of reducing the coking rate and inhibiting coking is to improve the material and structure of furnace tubes, the cracking material, and cracking process conditions [
9]. In the ethylene production process, if the coke deposition on the inner wall of the cracking furnace tube reaches a certain level, it is necessary to use a mixture of steam and air for decoking to ensure the normal operation of the ethylene production [
8]. However, the premise of decoking treatment is to accurately diagnose the coking degree of each cracking furnace tube in the current period. Therefore, the research on the diagnosis method of the coking degree of cracking furnace tubes has important practical significance.
Considering the performed literature review, there are essentially four ways of diagnosing the coking degree of the ethylene cracking furnace tube: performing a coking mechanism model [
10,
11], using an artificial intelligent algorithm [
12,
13], diagnosing the failure of the cracking furnace using infrared thermal imaging technology [
14,
15], and using the empirical knowledge to diagnose the problem [
16]. However, coking is an extremely complex physico–chemical reaction that occurs during pyrolysis, and some parameters of the mechanism model are difficult to obtain accurately in actual production, therefore, the accuracy of the mechanism model can not be assured. In the application of artificial intelligence algorithms, models generated by artificial neural networks (ANN) and support vector machines (SVM) have a “black box” syndrome [
17,
18,
19], and the difficulty in dealing with qualitative information, which limited its applications in practice. In addition, the “black box” model has higher requirements on the sample. If the change of influencing factors exceeds a certain range in practical application, the reliability of the “black box” model will obviously decline. In the application of infrared thermal imaging technology, due to the high equipment cost of infrared thermal imaging technology, installation, operation, and maintenance are difficult, and it has not been widely used in actual production. Moreover, the actual production experience shows that the application of empirical knowledge to diagnose the coking of the furnace tube has great defects in real-time and reliability.
In order to overcome the shortcomings of the above existing coking diagnosis methods in many aspects, it is necessary to build a coking diagnosis system with a clear physical meaning for each network layer, and the ability to generate interpretable diagnostic IF–THEN rules, which is very important for improving the accuracy and interpretability of the coking diagnosis of cracking furnace tubes. In view of the previous research and cognition, an adaptive neural fuzzy inference system (ANFIS) is a good solution to achieve the above goals. Moreover, by searching a large number of literatures related to coking of cracking furnace tubes, ANFIS has not been effectively applied in the diagnosis of coking of cracking furnace tubes in the ethylene industry, which will become a good experimental and application practice.
ANFIS is a fuzzy inference system structure that combines fuzzy logic and neural network organically [
20]. ANFIS can not only use the learning mechanism of neural networks to automatically extract the optimal membership relationship and fuzzy rules between input and output variables from the training data, but also the combination of fuzzy logic and neural network makes the structure and parameters of each layer of the neural network have a clear physical meaning [
21]. Therefore, compared with traditional machine learning and neural network algorithms, ANFIS is widely employed for solving engineering problems because of its advantages of being easy to understand, with strong interpretability and low requirements on training samples [
22].
A key issue in the application of the ANFIS system is the setting of system structure parameters. The quality of the multivariable system parameters will directly affect the overall performance of the system. For multivariable optimization, Karaboga [
23] proposed a novel intelligent clustering optimization algorithm, artificial bee colony (ABC), in 2005. The ABC algorithm can quickly find the global optimal solution in honey sourcing (set of parameter solutions) through the cooperation among three different bee species, and can avoid the problem of the local optimal solution in the search process, to a large extent. Furthermore, compared with the traditional multi-parameter optimization methods, the ABC algorithm has faster convergence speed and better optimization performance [
24].
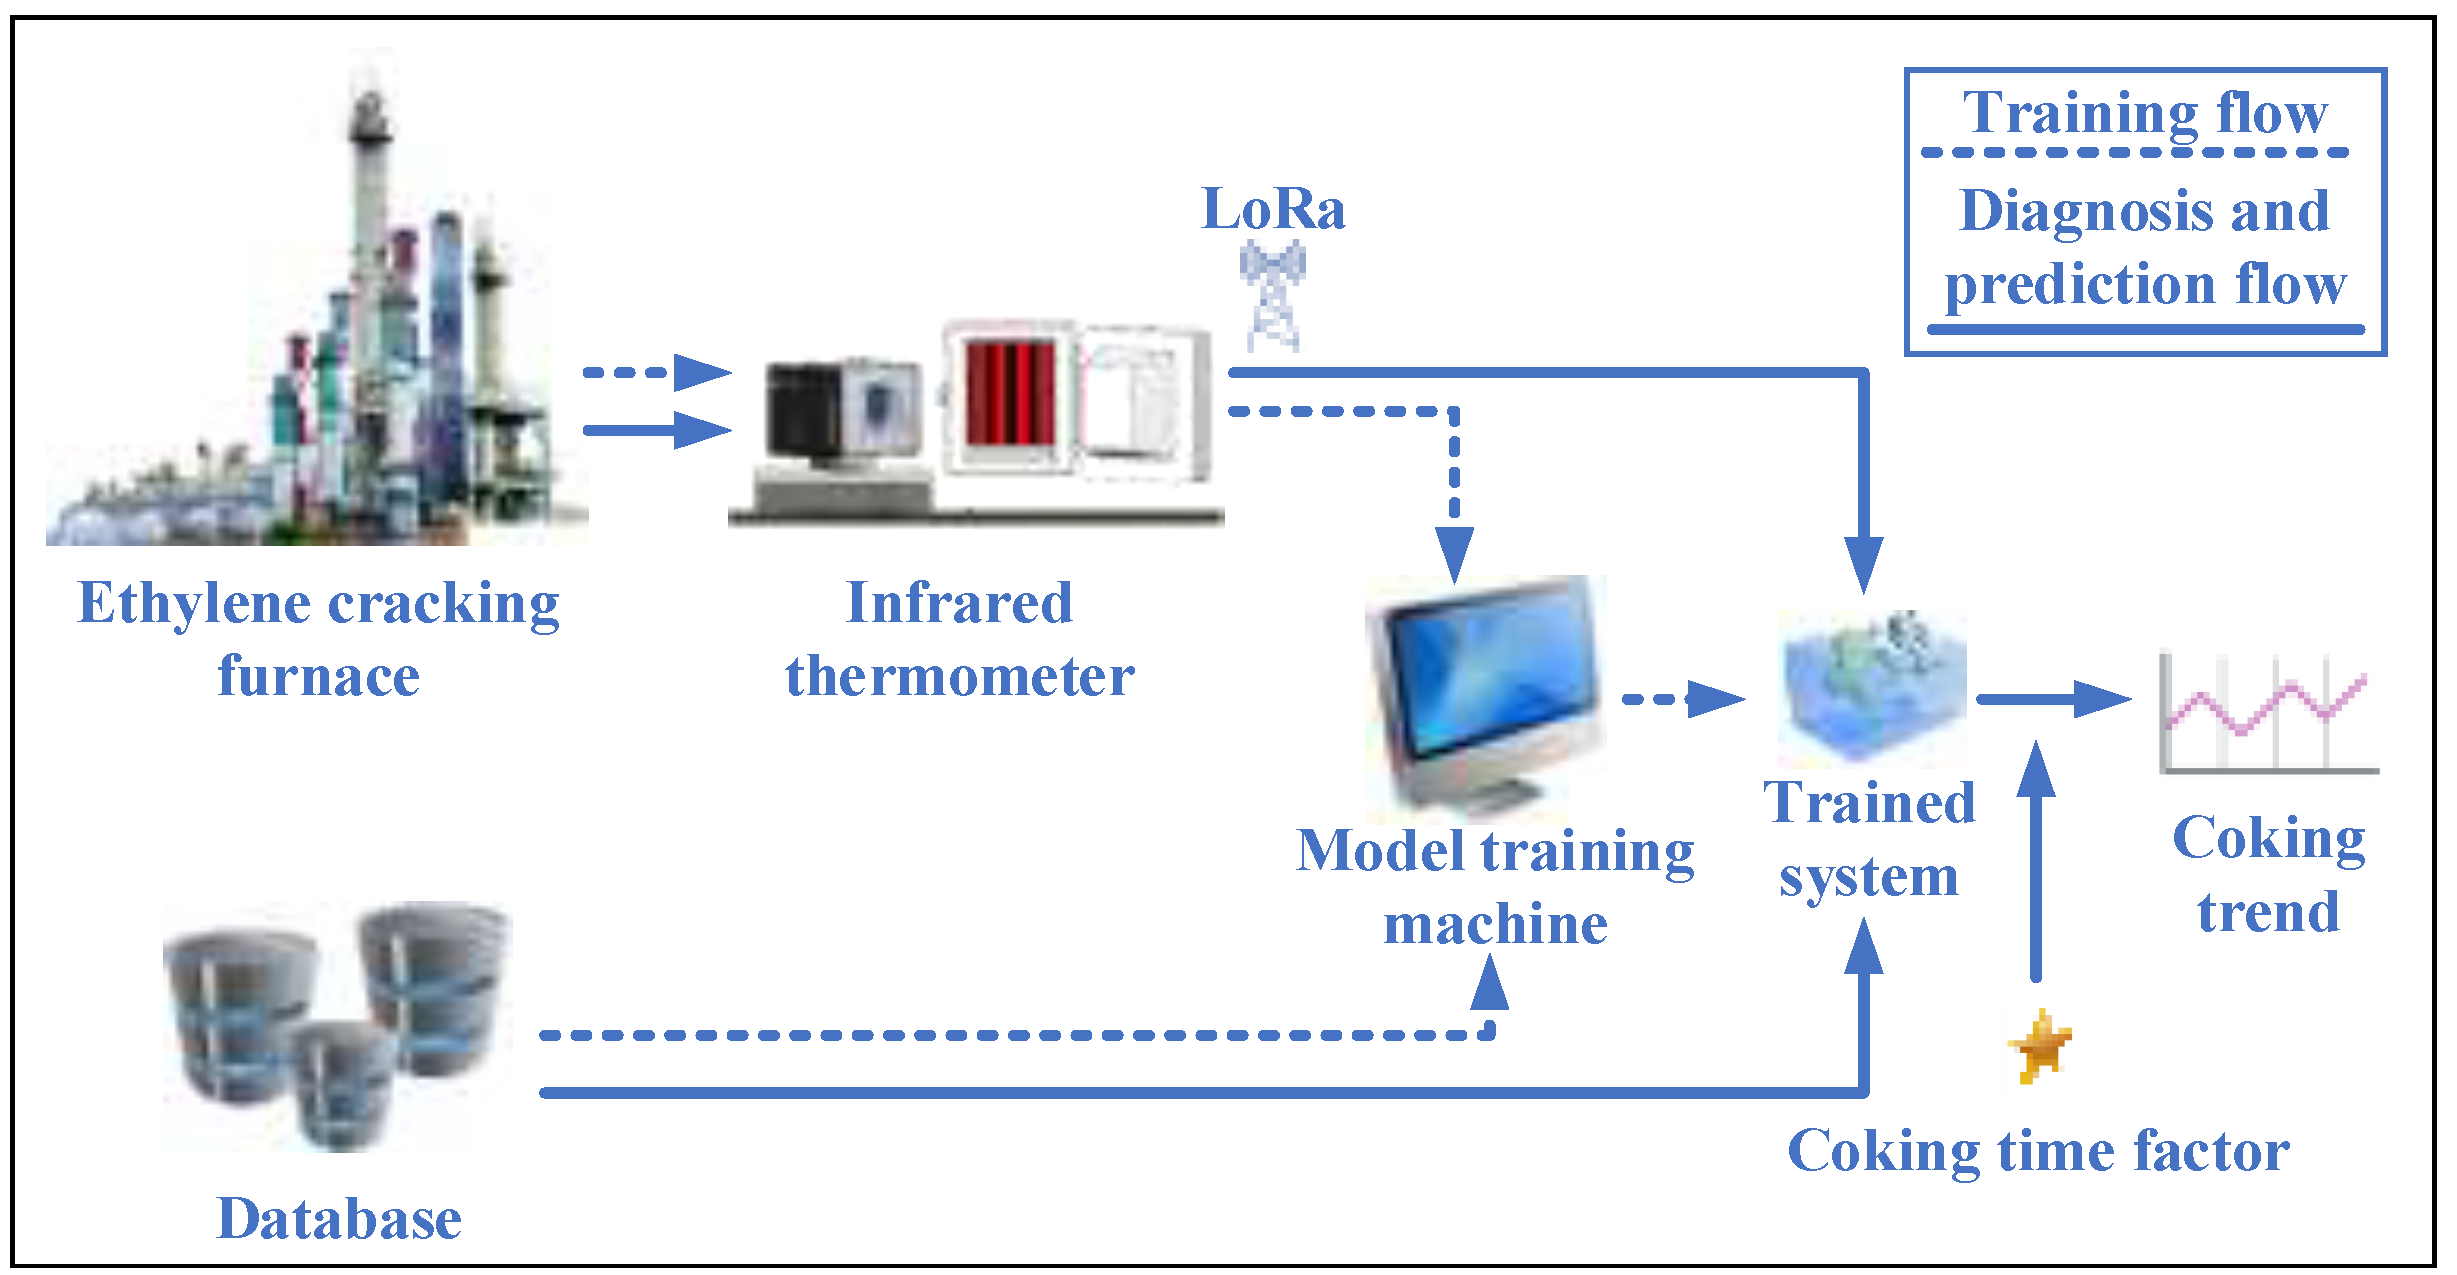
Based on the above research, a fusion-diagnosis and prediction method for the coking degree of cracking furnace tubes based on the artificial bee colony algorithm and adaptive fuzzy neural network is proposed in this paper, which also introduces a coking-time factor (CTF), named ABC-ANFIS-CTF. This method mainly has the following three contributions:
(1) A coking diagnosis and inference system based on ANFIS is proposed, and an adjacent processing function layer is added after the output layer of the system, which can make the system output of the quantified coking degree of the cracking furnace tube more accurately.
(2) The ABC algorithm is used to optimize the structural parameters of the ANFIS-based coking diagnosis and inference system, which effectively improves the training efficiency of the system and the accuracy of coking diagnosis.
(3) A coking-time factor is introduced, to predict the development trend of the coking degree during the operation period of the furnace tube, which provides a reliable basis for early warning and efficiency protection of the furnace tube.
The remainder of this paper is organized as follows:
Section 2 provides the framework of the coking diagnosis and inference system of the cracking furnace tube.
Section 3 introduces the specific principles and implementation steps of ABC-ANFIS-CTF method in detail.
Section 4 presents a verification of the proposed model based on real data and comparisons with other models. Finally, the conclusions of the study are drawn in
Section 5.
3. ABC-ANFIS-CTF
The realization of the coking diagnosis and prediction method named ABC-ANFIS-CTF is mainly divided into three stages: the first is the construction of the coking diagnosis and inference system based on ANFIS, the second is the optimization of the system structure parameters based on ABC algorithm, and the third is the prediction of the development trend of the coking degree based on the coking-time factor.
3.1. Construction of the ANFIS-Based System
ANFIS mainly consists of Mamdani type and T-S (Takagi-Sugeno) type [
26]. The difference between the two types is that the output of Mamdani type is fuzzy value, and the output of T-S type is a linear combination of input variables. In this paper, by analyzing the correlation between the TMT, absolute pressure ratio, COT, and coking degree of the furnace tube, a T-S type ANFIS coking diagnosis and inference system with multiple input and single output is adopted. Its system structure is shown in
Figure 4.
It can be seen from
Figure 4 that the ANFIS-based coking diagnosis and inference system structure is divided into six layers, and the specific meaning of each layer is described as follows:
Input layer. The total number of nodes in this layer is , and each node is directly connected to the input variable . The input variables of this system are TMT, absolute pressure ratio and COT.
Fuzzy layer. Each node in this layer represents a fuzzy set, and the number of fuzzy values in the fuzzy set represents the number of fuzzy segmentation of input variables. The function of this layer is to calculate the membership degree of each input variable relative to each fuzzy value in the fuzzy set according to different membership function
, such as gaussmf, gbellmf, trimf, and trapezium, etc., which is obtained by Equation (4).
where
n is the dimension of the input variable, and
is the fuzzy segmentation number of the input variable.
The total number of nodes in this layer is:
Rule layer. Each node in this layer represents a fuzzy rule, and the applicability of each fuzzy rule is the product of membership degree input by each node. The total number of nodes in this layer is
. The output of this layer is shown as below:
Normalized layer. The function of this layer is to normalize the output fuzzy rules of the last layer. The output of this layer is:
Computing layer. This layer is used to realize the joint calculation of neural network and fuzzy rules.
is the weight corresponding to input variables in neural network. The total number of nodes in this layer is the same as that in the previous layer, and the output is:
Output layer. This layer is the system output layer of ANFIS, which is used to output the coking diagnosis results corresponding to the input variables. The output formula is as follows:
In the actual production, the coking degree of the furnace tube is usually quantified into several grades, so this coking diagnosis system is added an adjacent processing function layer
after the output layer, in order to make the output result more accurately represent the coking degree of the furnace tube, and its expression is:
where
represents different quantization grades of the coking degree of the furnace tube.
3.2. Optimization of System Structure Parameters
The ABC algorithm is an optimization method to simulate honey collecting behavior of bees in nature. In the ABC algorithm, bee species are divided into three types: employed bees, onlookers, and scouts [
27]. The space for bees to collect nectar is called honey source or food source, which means the set of possible solutions to the parameters that need to be adjusted. The amount of nectar at each honey source represents the fitness or yield of different solutions.
In the initial state, the number of employed bees and onlookers accounts for half of the total number of bees, and honey source
generates
initial solutions randomly from Equation (11).
where
is the
rth honey source,
is the position of the honey source,
,
Dim is the dimension of the honey source,
and
are the upper and lower bounds of the space searched by the bee colony for honey, respectively.
The fitness or yield of each honey source is calculated by the following formula:
where
represents the objective function value of each honey source.
In the search process of the optimal solution of honey source, the employed bees first collect and memorize the amount of nectar at each honey source position, then onlookers obtain the honey source information from the employed bees and select a honey source by judging the amount of nectar. The probability of the honey source being selected is given by Equation (13).
Finally, it also needs to update the memory position of the selected honey source. The formula for position update is as follows:
where
is a random number in [−1,1].
If the honey source of a certain position is exhausted or the position is no longer updated, the employed bee at the current honey source will become a scout bee, and a new honey source will be generated according to Equation (11).
The maximum round of the bee colony searching for honey source is called the number of foraging cycles. If the number of searching is greater than the number of foraging cycles, the ABC algorithm will output the honey source with the highest yield, and the bee colony will finish the searching process.
Based on the above theories, the method of structural parameter optimization of the coking diagnosis and inference system using the ABC algorithm is described as follows:
In the traditional way, the structural parameters of ANFIS are artificially determined, which are arbitrary and irrational. As a result, the explosion of fuzzy rules and the disaster of network dimension can easily be caused in the process of network training [
28], and the training time of network can be greatly affected. However, using the ABC algorithm to optimize the structural parameters of ANFIS can largely solve various problems caused by the above way.
Therefore, the optimization strategy proposed in this paper is to take the three structural parameters involved in the coking diagnosis and inference system, including the membership function type, the fuzzy segmentation number and the training iteration number of the network, as the honey source of the ABC algorithm, and set a reasonable honey source search range. Then, the ABC algorithm is used to find the optimal solution for the structural parameters within the search range. The structure of the honey source in this optimization strategy is shown in
Figure 5.
For the bee colony search, root mean square error
Ermse is selected as the objective function value to calculate the yield of honey source, and the
Ermse is calculated from the true value and the predicted value output by the coking diagnosis and inference system with different honey source. The expression of the
Ermse is shown in Equation (15).
where
N is the dimension of the input training sample, and
is the
rth honey source.
To sum up, the algorithm of structural parameter optimization strategy of the coking diagnosis and inference system based on the ABC algorithm is described as Algorithm 1.
| Algorithm 1. ABC Algorithm Optimization Strategy Algorithm |
| Input: honey source, Xs |
| Output: best parameters of the system, xr |
| 1. Initialize the number of bees NP |
| 2. Initialize the space of the nectar source SN |
| 3. Initialize the max step of the search maxCycle |
| 4. best_source_fit = fit(x1) |
| 5. While r ≤ maxCycle do |
| 6. Calculate the objective function value f(xr) of the system output corresponding |
| to the honey source xr |
| 7. Calculate the yield of the nectar source fit(xr) on the basis of the value of the |
| objective function f(xr) |
| 8. If best_source_fit < fit(xr) do |
| 9. best_source_fit = fit(xr) |
| 10. best_source = xr |
| 11. End if |
| 12. End while |
| 13. Return best_source |
3.3. Prediction of the Development Trend of Coking Degree
During ethylene production, the operating cycle of the cracking furnace tube is usually 60–80 d [
29]. However, in the actual production, the rate of coke formation of each cracking furnace tube is not the same due to differences in the material of the tube, the residence time of the cracking raw material in the tube and hydrocarbon partial pressure etc., so that the operating cycle of the furnace tube is different from the normal operating cycle. If there is failure to achieve timely decoking in the event of a change in operating cycle, it will severely affect the service life of the cracking furnace tube and normal cracking production.
In order to predict the development trend of the coking degree of the furnace tube during the operation, this paper proposes a method for predicting the development trend of the coking degree of the tube in combination with a coking-time factor
. The coking-time factor is defined as follows:
where
TMT(
t),
KAPR(
t), and
COT(
t) are the real-time change trend of the tube metal temperature, absolute pressure ratio, and coil outlet temperature with respect to running time
t during ethylene production, respectively. Their expressions are shown as below:
In Equations (17)–(19), a, b, c, n, m, and z are all constant coefficients, and their values are determined by the actual operation of the cracking furnace tube.
Therefore, the steps to predict the development trend of the coking degree of the furnace tube in combination with the coking-time factor are described as follows:
Firstly, the coking-time factor is calculated according to the historical data of the TMT, absolute pressure ratio, and COT of the cracking furnace tube before the predicted time.
Secondly, the time value in the time period that needs to be predicted is substituted into the coking-time factor to calculate the predicted values of TMT, absolute pressure ratio and COT.
Thirdly, the predictive value of each variable is input into the trained coking diagnosis and inference system, and the corresponding diagnosis result of coking degree is output.
Finally, the curve of the coking degree with respect to the time change is drawn according to the diagnosis result, so as to realize the prediction of development trend of the coking degree of the furnace tube. The algorithm is described as Algorithm 2.
| Algorithm 2. Development trend prediction algorithm for coking degree of cracking furnace tube |
| Input: period of predicted days, t − t + n |
| Output: predicted degree of coking, V |
| 1. Calculate the coking-time factor Φ(t) from historical data |
| 2. For each day in [t, t + n] do |
| 3. Calculate the corresponding TMT, KAPR and COT for each day |
| 4. Input the TMT, KAPR and COT value into the trained coking diagnosis system |
| 5. Output the coking diagnosis result V of each day |
| 6. End for |
| 7. Plot the development trend of coking degree over time |
| 8. Obtain the development trend of coking degree |
4. Experiment and Analysis
The experimental data in this paper were actually collected from the #1 ethylene cracking unit of the super-large petrochemical enterprise. The cracking unit has 11 USC cracking furnaces, numbered H-110 to H-120. Each cracking furnace has eight observation windows and 48 U-shaped furnace tubes, and 12 furnace tubes can be observed in each observation window. In order to verify the effectiveness of the proposed method, three experiments were carried out and the experimental results were analyzed.
4.1. Optimization of System Structure Parameters
In the actual production process, the cracking materials used for the differently numbered cracking furnaces are not exactly the same. If the cracking furnaces are grouped according to the difference of cracking materials, H-110 to H-113, H-119, and H-120 cracking furnaces can be divided into one group, H-114 to H-117 cracking furnaces can be divided into one group, and the H-118 cracking furnaces is divided into a separate group. In order to facilitate the implementation of the experiment, the furnace tubes of H-114 and H-115 cracking furnaces were randomly selected as the experimental data collection objects. The data set for training, testing, and optimizing the structural parameters of the coking diagnostic reasoning system based on ANFIS were collected during the complete operation cycle of H-114 and H-115 cracking furnaces, and the collection frequency was daily.
In this experiment, the operating cycle of the H-114 and H-115 cracking furnace tubes was 65 days and 73 days respectively. Sample data for training and verification of the coking diagnosis and inference system were collected in H-114 cracking furnace, and sample data for testing were collected in H-115 cracking furnace. The experimental data is shown in
Table 1.
In actual production, the cracking technician usually divides the coking degree of the furnace tube into
v1,
v2,
v3, and
v4 four grades, which respectively represent normal, light coking, moderate coking, and serious coking. During the operation cycle of the furnace tube, there are often some differences and regularities in the proportion of samples with different degrees of coking. In general, the proportion of light coking samples is the largest, while the proportion of moderate coking and serious coking samples is small. Accordingly, the sample structure of each degree of coking in the experimental data shown in
Table 1 is shown in
Table 2.
Then, the experiment based on the ABC algorithm for system structural parameter optimization can be carried out. The steps of the experiment are described as follows:
First, set the search range of the honey source in the ABC algorithm. It can be seen from the composition of the honey source described in
Section 3.2 that the honey source includes three parameters: the membership function type, the fuzzy segmentation number, and the training iteration number of the network. By analyzing the system requirements, the selection range of these three parameters is set as follows:
The selection range of membership function types includes gaussmf, gbellmf, trimf, trapezium, dsigmoid, and psigmoid.
The selection range of fuzzy segmentation number of the input variables of the TMT, absolute pressure ratio and COT is set as [
2,
5].
The selection range of the training iteration number of the network is set as [100,2000].
Next, set the maximum number of foraging cycles and the number of employed bees and onlookers. In this experiment, the maximum number of foraging cycles was set as 100, and the number of employed bees and onlookers was set as 10, respectively.
Finally, the bee colony begins to search for the best source of honey. In the process of honey-source search, the change curve of the yield represented by honey-source is shown in
Figure 6. The honey source corresponding to the maximum yield found during the foraging cycle is the optimal solution of the structural parameters. The results of the optimal solution are shown in
Table 3.
4.2. Training and Verification of the Coking Diagnosis and Inference System
The training process of the coking diagnosis and inference system is as follows: firstly, the optimal honey source searched by the ABC algorithm is set as the structural parameters of the system. Then the training set from the experimental data described in
Section 4.1 is input into the system for training. In the training process, the change curve of the training error output by the system is shown in
Figure 7. As can be seen from
Figure 7, when the number of trainings reaches 1200, the change rate of the training error curve tends to zero, which indicates that the training effect of the system tends to be optimal, and also proves that the results of the network training iterations in the optimal solution set searched by the ABC algorithm meet the requirements of the system.
Finally, input the verification set to verify the trained system. Through verification, the comparison result between the real value and the predicted value of the system output is shown in
Figure 8, and the comparison result between the real value and the predicted value processed by the adjacent processing function layer is shown in
Figure 9. After adjacent processing, the accuracy of coking diagnosis and inference system reaches 99.57%, which is completely in line with the applicable accuracy range of actual production.
In order to verify the superiority of the proposed method in coking diagnosis, this paper also made a comparison experiment with radical basis function (RBF) neural network algorithm, support vector machine (SVM) algorithm, k-nearest neighbor (KNN) algorithm, and back propagation neural network (BPNN) on the accuracy of coking diagnosis, and the comparison results are shown in
Figure 10.
Figure 10a–d shows the comparison between the output results of each algorithm and the real results under four different coking degrees. The pink bar represents the number of original samples in the verification set, and the other color bar represents the number of samples with the coking degree output by each algorithm.
It can be seen from
Figure 10 that using the above five kinds of methods to diagnose the tube of different coking degrees, only the ABC-ANFIS-CTF method proposed in this paper can achieve a high accuracy of diagnosis, while the other four algorithms have certain errors in the diagnosis results of the different degrees of coking, which will affect the accurate judgment of the running status of the furnace tube in actual production.
In order to further prove the generalization performance of the proposed method in coking diagnosis, the test sets were used again to conduct comparative experiments on the above five methods, and the experimental results are shown in
Figure 11.
The experimental results of
Figure 11 show that the coking diagnostic method proposed in this paper still has the best performance in the diagnosis of different degrees of coking of the furnace tube.
Accordingly, it can be concluded that the accuracy of the proposed ABC-ANFIS-CTF method in coking diagnosis of cracking furnace tubes is improved to a certain extent compared with other traditional neural networks and classification algorithms.
4.3. Prediction of the Development Trend of Coking Degree
In this experiment, two furnace tubes in the H-115 cracking furnace were randomly selected as experimental objects, which were named as a tube and b tube respectively. The experimental data is TMT, absolute pressure ratio, COT, and marked coking degree data in the operation cycle of the two furnace tubes. The objective of the experiment is to predict the development trend of coking degree of the two furnace tubes at different operating moments according to the coking-time factor, and the predicted time interval is in days.
The specific experimental methods are as follows: first, the 20th and 40th day of the operation cycle of the furnace tube are selected as the starting points of the prediction, which are named as prediction point 1 and prediction point 2, respectively. Then, the coking-time factors corresponding to the two different prediction points are calculated. Finally, the development trends of the coking degree of the furnace tube within 10 days after the prediction points are predicted by combining the coking-time factor. Taking the above two furnace tubes as an example, the prediction curves of the development trend of the coking degree obtained by the above experimental method are shown in
Figure 12 and
Figure 13.
It can be seen from
Figure 12 and
Figure 13 that the predicted development trend of coking degree is basically similar to the real development trend, and the predicted development trend will change in advance of the real trend change in the later stage of the operation cycle of the furnace tube. This situation can play a role of coking forewarning for actual production. Therefore, it is of great practical significance to predict the development trend of the coking degree of the cracking furnace tube by combining the coking-time factor.


