Article

Quality Properties and Pyrolysis Characteristics of Cassava Rhizome Pellets Produced by Alternating between Pelletizing and Torrefaction

by
Nitipong Soponpongpipat
*,
Paisan Comsawang
and
Suwat Nanetoe
Department of Mechanical Engineering, Faculty of Engineering and Industrial Technology, Silpakorn University, Nakhon Pathom 73000, Thailand
*
Author to whom correspondence should be addressed.
Processes 2019, 7(12), 930; https://doi.org/10.3390/pr7120930
Submission received: 6 November 2019 / Revised: 3 December 2019 / Accepted: 4 December 2019 / Published: 6 December 2019
(This article belongs to the Special Issue Biomass Processing and Conversion Systems)

Abstract

:
This work investigated quality properties of pellets of raw cassava rhizome (P-RC), pellets of pelletized cassava rhizome followed by torrefaction (T-CP), and pellets of torrefied cassava rhizome followed by pelletizing (P-TC). Torrefaction was conducted at temperatures of 230, 250, and 280 °C for 30 min. Pyrolysis characteristics of T-CP and P-TC at torrefied temperatures of 230 and 250 °C were studied using thermogravimetric analysis. It was found that at the similar torrefied temperature, P-TC had a higher bulk density, energy density, and pellet durability than that of T-CP and P-RC while T-CP had a higher HHV and moisture absorption than P-TC and P-RC. The bulk density of P-TC was 1.13–1.19 and 1.33–1.52 times higher than that of P-RC and T-CP, respectively. The HHV of T-CP was 1.07 and 1.29 times higher than P-TC and P-RC, respectively. The energy density of P-TC was 1.24–1.56 and 1.20–1.41 times higher than that of P-RC and T-CP. In terms of Pellet Fuel Institute (PFI) standard, the durability index of P-RC, P-TC, and T-CP at torrefied temperatures of 230 and 250 °C was acceptable. However, dramatically low and unacceptable durability index was found in case of T-CP at torrefied temperature of 280 °C. The moisture absorption of P-TC was lower than that of P-RC and T-CP. Finally, T-CP had a lower pyrolysis temperature and had a much lower solid yield than that of P-TC. Variation of pyrolysis characteristics indicated the difference in chemical composition between T-CP and P-TC.

Graphical Abstract

1. Introduction

Nowadays, pelletizing is known as a process for biomass properties improvement [1]. Biomass pellets has higher bulk density and energy density while lower moisture content than that of untreated biomass [2,3,4,5,6,7]. Nevertheless, biomass pellets have many drawbacks as same as untreated biomass such as high water absorption, biodegradation, and high volatile content. To eliminate these disadvantages, biomass torrefaction is conducted. In comparison with untreated biomass and biomass pellets, torrefied biomass has lower moisture and volatile content while higher value of higher heating value (HHV) [8,9,10,11,12,13,14]. Its hydrophobic characteristic is also improved [15,16,17,18]. However, bulk density and energy density decrease after torrefaction. Therefore, applying both pelletizing and torrefaction to biomass is the most suitable way to improve biomass properties. They can be applied to biomass in two pathways: Torrefaction and subsequently pelletizing, and pelletizing and subsequently torrefaction [19].
For the first pathway, biomass is torrefied before loaded to hammer mill for size reduction. Finally, the torrefied biomass particle is pelletized. Compared to untreated biomass pellets, pellets of torrefied biomass followed by pelletizing had lower moisture content [20,21] and moisture uptake [17,22,23] while higher HHV [19,20]. Studies on pelletizing of torrefied biomass by means of single pellet press with constant maximum force were conducted. The pellets produced by the first pathway had a lower density compared to untreated biomass pellets. The increase of torrefaction temperature decreased their density [17,23]. On the contrary, the studies on pelletizing using rotary pellet mill indicated that pellets of this pathway were comparable to the untreated biomass pellets in bulk density [21] and the higher density was reported [19]. The energy required for pelletizing of torrefied biomass was higher than that of untreated biomass [21].
For the second pathway, biomass was reduced in its size. Later, the biomass particle was pelletized. Finally, biomass pellets were torrefied and cooled. Compared to the untreated biomass pellets, the pellets of pelletized biomass followed by torrefaction had lower moisture content, pellet density, energy density, and durability while higher HHV [24,25,26]. In addition, comparison between the pellets produced by the first and second pathway was conducted at torrefied temperature of 260 °C for 15 min [19]. Pellets of the second pathway had higher HHV and stability in water but had lower density and durability. In terms of energy efficiency, the second pathway was more efficient than the first pathway.
Although properties of pellets produced from both pathways had been studied, the study on properties comparison in wide range of torrefied temperature is insufficient. Moreover, there is no certainty of evidence on thermal degradation characteristic of both pellets when they are undergoing pyrolysis. This investigation is necessary for utilization of both pellets. In this work, the pellets of torrefied cassava rhizome followed by pelletizing (P-TC), the pellets of pelletized cassava rhizome followed by torrefaction (T-CP), and the pellets of raw cassava rhizome (P-RC) were produced. Properties comparison of T-CP, P-TC, and P-RC was conducted. Finally, the thermogravimetric analysis of T-CP and P-TC in case of pyrolysis was investigated.

2. Experimental Procedure and Analysis

2.1. Raw Materials

Cassava rhizome (Manihot esculenta species) was gathered from Ratchaburi Province. It was ground into the particle size of 5 mm. Prior to pelletizing and torrefaction, the ground cassava rhizome was dried in a hot air oven to control its moisture content at 8 ± 2 %(wb). After drying, it was left to cool at room temperature in desiccators and kept in airtight plastic containers.

2.2. Pellets of Raw Cassava Rhizome (P-RC)

Prepared cassava rhizome was pelletized using flat die pellet mill (KL200B) with rotating speed of 278 rpm. Outside diameter and thickness of flat die were 199.5 and 27 mm, respectively. There were 116 holes on each die, and each die hole had a diameter of 6.5 mm. Water was added into prepared cassava rhizome to control its moisture content at 12 ± 2 %(wb). Prepared cassava rhizome was allowed to pass the die hole only once to produce P-RC. After pelletizing, P-RC was allowed to cool for 24 h. Finally, fines on P-RC surface was removed by air blower and P-RC was kept in airtight plastic bags. P-RC was divided into two parts. One was used for properties analysis and the other was for T-CP preparation.

2.3. Pellets of Torrefied Cassava Rhizome Followed by Pelletizing (P-TC)

Prepared cassava rhizome was torrefied in fixed bed torrefaction reactor. In heating period, the heating rate was controlled at 20 °C/min. Torrefied temperatures were 230, 250, and 280 °C. It was found from preliminary test of pelletizing condition that it was impossible to pelletize torrefied cassava rhizome of which residence time longer than 30 min. To avoid the use of additional binder and its effect on properties of produced pellets, the residence time for torrefaction was controlled at 30 min. After torrefaction, torrefied cassava rhizome was pelletized in flat die pellet mill. Pelletizing of terrified cassava rhizome was controlled at the similar condition of P-RC production.

2.4. Pellets of Pelletized Cassava Rhizome Followed by Torrefaction (T-CP)

To produce T-CP, the P-RC was torrefied at the temperatures of 230, 250, and 280 °C and residence time of 30 min.

2.5. Properties of P-RC, P-TC, and T-CP

The bulk density was determined in accordance with ASTM E873. The bulk density (ρbulk) can be calculated by dividing the mass of pellet bulk (m) with its volume (V), as shown in the following equation:
ρ b u l k = m V
The higher heating value (HHV) of pellet sample was measured using bomb calorimeter according to ASTM D5865-07. The sample was dried and pulverized to pass 250-µm sieve. Later, one gram of sample was placed into the sample holder. To prepare the bomb, water of 1.0 mL was added into bomb and the sample holder was placed inside the bomb. Then, oxygen was charged into the bomb until consistent pressure of 2 MPa was reached. To measure the combustion heat, 2000 mL of water at 23.0 °C (2.0 °C below the room temperature) was filled into the bucket. After placing the bomb in the bucket, it was placed in the insulation jacket. The stirrer was started for 5 min to attain equilibrium. The temperature of water in the bucket was recorded at 1-min intervals for 5 min. After that, the bomb was ignited. Because of the rapid rise in temperature, the water temperature was recorded at 0.5 min and 1 min after firing. The water temperature was recorded at 1-min intervals until the constant temperature was observed for 5 min. To determine the correction factors, the bomb lid was opened and the length of unburnt ignition wire was recorded. Finally, the interior of the bomb was washed with distilled water containing the titration indicator. Washing water was titrated with standard sodium carbonate solution.
To measure the moisture absorption, the pellet sample was dried into hot air oven at temperature of 105 ± 1 °C for 24 h. Then, it was placed in humidity chamber for 5 h. The temperature and relative humidity inside the chamber were kept at 30 °C and 90%. Mass of pellet sample was weighted by a digital balance with a readability of 0.01 g every 10 min for the first hour and every 30 min until the test was over.
The durability index of pellet sample was measured in accordance with PFI standard [27]. Pellet sample of 500 g was filled into the testing box of 305 × 140 × 305 mm. One metal blade with 230 mm in length was installed inside the box. When the box rotated with rotating speed of 50 rpm for 10 min, this blade hit the pellet sample. Later, fines generated during box rotation were separated from pellet sample by 1/8-inch sieve. The mass of the residual pellet sample (mresidual) was weighted. Since the initial mass of pellet sample (minitial) was identified, the pellet durability index (PDI) of sample can be calculated by the following equation:
P D I = 100 × m r e s i d u a l m i n i t i a l

2.6. Pyrolysis Characteristics

Pyrolysis characteristics of P-TC and T-CP were observed using thermogravimetric analyzer. Sample mass of 10 mg was distributed in an open pan. The temperature was varied from 30 °C to 800 °C with heating rate of 20 °C/min. Nitrogen with flow rate of 100 mL/min was used to generate inert atmosphere during pyrolysis.

3. Result and Discussion
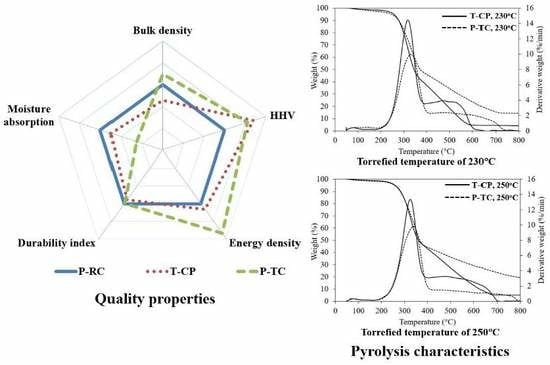
3.1. Bulk Density

Properties of P-RC, P-TC, and T-CP were summarized as shown in Table 1. At the torrefaction temperatures of 230, 250, and 280 °C, the bulk density of P-TC was 777.28 ± 20.15, 762.43 ± 3.69, and 739.69 ± 5.76 kg/m3, respectively while the bulk density of T-CP was 583.26 ± 38.97, 559.68 ± 15.98, and 486.30 ± 17.98 kg/m3, respectively. The bulk density of P-RC was 653.56 ± 17.90 kg/m3. Because of short residence time, the slight decrease in bulk density was found both in P-TC and T-CP when the torrefied temperature was increased (Figure 1). The bulk density of P-TC was 1.13–1.19 and 1.33–1.52 times higher than that of P-RC and T-CP, respectively. By average, bulk density of P-TC was 1.41 and 1.16 times higher than T-CP and P-RC, respectively (Figure 2). The bulk density of P-TC was the highest while bulk density of T-CP was significantly lower than that of P-RC. This result is in agreement with the previous work [19,24]. The difference in bulk density between P-TC and P-RC can be explained by brittleness and friction coefficient of materials. The brittleness of raw cassava rhizome was less than that of its torrefied char [28,29]. When torrefied cassava rhizome was fed into rotary pellet mill, it was ground again before moving into die holes resulting in smaller particle size than that of raw cassava rhizome. The decrease in particle size of torrefied one caused the increase of its surface area. In addition, torrefied char had higher friction coefficient than that of raw biomass [20,23]. When torrefied char particle moved into die holes, large friction force was generated due to motion resistance between surface area of torrefied char and wall of die hole. To overcome this friction, the torrefied char in die hole was compressed with high pressure and temperature resulting in high density in pellets. In contrast, the surface area and friction coefficient of raw cassava rhizome were less than that of its torrefied char. Lower friction, pressure, and heat were generated resulting in lower of pellet density. To confirm this explanation, the specific energy consumption (SEC) for pelletizing of raw cassava rhizome and its torrefied char were recorded and shown in Table 2. It has been known that high friction in die holes caused high torque to drive the pellet mill. As electrical motor was used as mill driver, the higher specific electrical energy consumption was found when the higher torque was needed. From Table 2, the SEC of raw cassava rhizome was lower than that of torrefied char. This result indicated that higher torque was needed for torrefied char pelletizing, in other words, higher friction was generated. Therefore, P-TC had a higher bulk density compared to P-RC because torrefied char (material for P-TC production) had higher brittleness and friction coefficient than that of raw cassava rhizome (material for P-RC production). In case of T-CP, mass loss from thermal decomposition of hemicellulose, partial cellulose and lignin generated numerous of small void inside pellets. These voids caused T-CP had a lower bulk density compared to P-TC and P-RC.

3.2. Higher Heating Value

At the torrefied temperatures of 230, 250, and 280 °C, the HHV of P-TC was 17.56 ± 0.57, 19.24 ± 1.16, and 22.31 ± 0.92 MJ/kg, while HHV of T-CP was 18.63 ± 1.20, 20.54 ± 1.13, and 23.83 ± 0.99 MJ/kg, respectively. The HHV of P-RC was 16.25 ± 0.45 MJ/kg (Figure 3). The HHV of P-RC was the lowest, while the HHV of P-TC was slightly lower than that of T-CP at the same torrefied temperature. The HHV of P-TC was 1.08–1.37 times higher than that of P-RC and 0.94 times lower than that of T-CP (Figure 4). By average, the HHV of T-CP was higher than P-TC and P-RC for 1.06 and 1.29 times, respectively. According to the previous work [30], the HHV of raw cassava rhizome before being pelletized was 17.3 MJ/kg which was slightly different from that of P-RC, while torrefied char of cassava rhizome (at torrefied temperature of 280 °C and resident time of 20 min) had the HHV of 21.87 MJ/kg which was insignificantly different from the HHV of P-TC (at the same torrefied temperature and resident time of 30 min). It can be seen that pelletizing had no effect on the change in HHV of cassava rhizome and its torrefied char. This result can be explained by considering the biomass temperature in a die of pellet mill and the onset temperature of biomass degradation. The die temperature at a stable operation of pelletizing was about 90 °C [31] while the torrefaction onset temperature was in range of 200–300 °C [9]. The die temperature was insufficient to generate thermal degradation of biomass, but only enough to allow lignin and hemicelluloses to exceed their glass transition temperature and flow into voids between adjacent particles resulting in binding of biomass particle. Thus, torrefaction did not take place and there was no change in HHV during pelletizing.
Although pelletizing process did not affect the change in HHV, it caused a HHV difference between P-TC and T-CP. In present work, the HHV of T-CP was slightly higher than that of P-TC at the same torrefied temperature. To explain this result, relationship between mass loading and degradation reaction onset temperature was considered. The mass loading was defined as mass of biomass per unit volume of reactor. The reaction onset temperature decreased when mass loading was increased [32]. As xylan loading decreased for 2.96 times from 14.5 mg/0.15 mL to 4.9 mg/0.15 mL, the reaction onset temperature slightly increased from 210 °C to 220 °C. (Many works used xylan as representative of hemicellulose in studies on thermal degradation [9,32]). In present work, the bulk density of P-RC was 653.56 kg/m3 while the one of chopped cassava rhizome was 254 kg/m3 which was 2.57 times lower. When both chopped cassava rhizome and P-RC were torrefied in the same reactor, the mass loading of P-RC was higher than that of the other one. Therefore, the reaction onset temperature of P-RC was slightly lower. It was known that the decomposition degree and the HHV of biomass were higher when the reaction onset temperature was lower. Thus the HHV of torrefied P-RC was slightly higher than that of torrefied char of chopped cassava rhizome. Since T-CP was produced by torrefaction of P-RC while P-TC was produced by pelletizing of torrefied cassava rhizome, the HHV of T-CP was slightly higher than that of P-TC.

3.3. Energy Density and Durability Index

At torrefied temperatures of 230, 250, and 280 °C, the energy density of T-CP was 10.92, 11.50, and 11.77 GJ/m3, respectively, while that of P-TC was 13.13, 14.97, and 16.55 GJ/m3, respectively. The energy density of P-RC was 10.62 GJ/m3 (Figure 5). The energy density of P-TC was highest, while energy density of T-CP was slightly higher than that of P-RC. The energy density of P-TC was 1.24–1.56 and 1.20–1.41 times higher than that of P-RC and T-CP, respectively (Figure 6). The energy density was generally used to evaluate logistic cost of fuel. The higher energy density led to a lower logistic cost. The result indicated that P-TC was the most suitable form in terms of logistic. Although energy density of T-CP was comparable to P-RC, T-CP might be more suitable than P-RC due to the higher HHV of T-CP.
Beside energy density, the durability index was also a major criterion for consideration. It represented quantity of fines generated during transportation. The high durability index means low amount of fines was generated. The durability index of P-RC was 98.09 ± 1.02%. At torrefied temperatures of 230, 250, and 280 °C, the durability index of P-TC was 97.85 ± 0.61, 97.79 ± 0.48, and 97.24 ± 0.91%, respectively, while the one of T-CP was 96.81 ± 0.36, 96.29 ± 0.32, and 90.96 ± 0.82%, respectively (Figure 7). According to the Pellet Fuel Institute (PFI) standard [27], the acceptable value of durability index was in range of 95.0%–96.5%. In terms of this standard, P-RC, P-TC, and T-CP at torrefied temperatures of 230 and 250 °C was acceptable. However, dramatically low and unacceptable durability index was found in the case of T-CP, 280 °C. The high durability index was found for P-RC and P-TC because the natural binder melted and infused into space around particle during pelletizing. Since the amount of natural binder in torrefied cassava rhizome was lower than that in raw cassava rhizome, P-TC had a lower durability index than P-RC. It was noted that poor durability index was reported for the torrefied temperature of 300 °C and residence time of 16.5 min [21]. Thus, P-TC had a good durability index only in a narrow range of torrefied time and temperature. In case of T-CP, its inter-particle bonding was destroyed during torrefaction due to thermal degradation of natural binder. The severe destruction from effect of torrefaction temperature was found in T-CP, 280 °C. Therefore, the large amount of fines was released when T-CP was broken, resulting low durability index. When consideration was done using both energy density and durability index, it was clear that P-TC was the most suitable form for logistics. T-CP was also suitable when it was produced with suitable torrefied time and temperature (30 min and less than 250 °C).

3.4. Moisture Absorption

The moisture absorption of P-TC was lower than that of P-RC and T-CP, while T-CP at torrefied temperatures of 230 and 250 °C was comparable to P-RC (Figure 8). This result is in good agreement with previous wok [19]. Many cracks were clearly seen on outer surface of T-CP (Figure 9). Water vapor passed through these cracks resulting in higher moisture absorption of T-CP compared to P-RC during 0–90 min of testing. After this period, moisture absorption of T-CP at torrefied temperature of 280 °C was lower than that of P-RC because torrefaction with high temperature decreased the saturated moisture content, in other words, increased hydrophobicity. For T-CP of torrefied temperatures of 230 and 250 °C, moisture absorption was the highest values of the entire test because of the slight increase of hydrophobicity after torrefaction. The moisture absorption of P-TC was the lowest due to their close outer surface. Therefore, the moisture absorption depended on number of cracks on the outer surface of those pellets and its hydrophobicity. In summary, the P-TC was the suitable form in terms of storage while T-CP was likely akin to P-RC.

3.5. Pyrolysis Characteristics

Pyrolysis process composed of two steps for both T-CP and P-TC (Figure 10). At the torrefied temperature of 230 °C, the first step of T-CP and P-TC was specified at the temperature range of 168.74 °C to 406.61 °C and 199.80 °C to 409.89 °C, respectively. DTGmax of this step was 12.13%/min for T-CP and 8.36%/min for P-TC. The last step of T-CP and P-TC existed during 418.33 °C to 631.92 °C and 418.23 °C to 748.37 °C, respectively. T-CP has a lower solid yield (4.34%) compared to that of P-TC (14.30%). The similar trend was found at torrefied temperature of 250 °C (Figure 10b). According to the previous reports, the hemicellulose and cellulose was decomposed at the temperatures range of 200–380 °C and 250–380 °C, respectively [33] while the lignin was decomposed during the temperature range of 200–650 °C [34]. At the first steps of both T-CP and P-TC, hemicellulose and cellulose content was decomposed. The lower peak temperature and higher DTGmax of T-CP compared to P-TC indicated the difference in their chemical composition, in other words, there was a difference in decomposition mechanism during torrefaction. As a results, the hemicellulose and cellulose content of T-CP had lower thermal stability than that of P-TC. The higher DTGmax of T-CP in the first step indicated higher reactivity than that of P-TC. Moreover, the lower in peak temperature of T-CP compared to P-TC at the second step confirmed the variation of their lignin content during torrefaction. To determine the kinetic parameters, the two-step separate kinetic scheme and the differential–form method of ABS with fii) = [1 − αi(T)] were used. The separation temperature (Tsp) and all parameters were shown in Table 3. For the first step of decomposition, the activation energy and pre-exponential factor of both T-CP and P-TC were in range of 80.6–87.8 kJ/mol and 4.3 × 10⁶–2.7 × 10⁷ min−1, respectively. The values of the second step were in range of 43.6–80.8 kJ/mol and 3.5 × 101–4.7 × 10⁴ min−1, respectively. Urych [35] reported that the activation energy and pre-exponential factor of coal pyrolysis were in range of 143.6–161.4 kJ/mol and 2.5 × 10⁹–5.5 × 10¹⁰ min−1, respectively. These values of coal were higher than those of T-CP and P-TC. In summary, the pyrolysis variation between T-CP and P-TC was resulted from the difference in their chemical composition. T-CP had lower thermal stability and higher reactivity than that of P-TC.

4. Conclusions

In this work, comparison of T-CP, P-TC, and P-RC properties was conducted. Pyrolysis characteristics of T-CP and P-TC were also investigated. At the similar temperature, P-TC had a higher bulk density, energy density, and pellet durability than that of T-CP and P-RC while T-CP had a higher HHV and moisture absorption than P-TC and P-RC. In terms of storage and logistic, P-TC was better than T-CP and P-RC. T-CP had a lower pyrolysis temperature and a quite lower solid yield than those of P-TC. Variation of pyrolysis characteristics indicated differences in chemical composition between T-CP and P-TC. This point led to characteristic differences when they were used in a real application including combustion and gasification. Further study on this point is necessary before reaching to a conclusion which pathway is more effective.

Author Contributions

Conceptualization, N.S. and P.C.; Methodology, N.S., P.C. and S.N.; Software, N.S.; Validation, N.S., P.C. and S.N.; Formal Analysis, N.S.; Investigation, N.S., P.C. and S.N.; Resources, N.S., P.C. and S.N.; Data Curation, N.S., P.C. and S.N.; Writing—Original Draft Preparation, N.S., P.C. and S.N.; Writing—Review and Editing, N.S., P.C. and S.N.; Visualization, N.S. and P.C.; Supervision, P.C. and S.N.; Project Administration, N.S., P.C. and S.N.; Funding Acquisition, P.C. and S.N.

Funding

This research was funded by Silpakorn University Research, Innovation and Creative Fund, grant number RD59M2-17.

Acknowledgments

The authors gratefully acknowledge Silpakorn University Research, Innovation and Creative Fund and Department of Mechanical Engineering, Faculty of Engineering and Industrial Technology, Silpakorn University, Sanam Chandra Palace Campus for all supports.

Conflicts of Interest

The authors declare no conflict of interest.

References

  1. Crawford, N.C.; Ray, A.E.; Yancey, N.A.; Nagle, N. Evaluating the pelletization of “pure” and blended lignocellulosic biomass feedstocks. Fuel Process. Technol. 2015, 140, 46–56. [Google Scholar] [CrossRef] [Green Version]
  2. Soleimani, M.; Tabil, X.L.; Grewal, R.; Tabil, L.G. Carbohydrates as binders in biomass densification for biochemical and thermochemical processes. Fuel 2017, 193, 134–141. [Google Scholar] [CrossRef]
  3. Rhén, C.; Öhman, M.; Gref, R.; Wästerlund, I. Effect of raw material composition in woody biomass pellets on combustion characteristics. Biomass Bioenergy 2007, 31, 66–72. [Google Scholar] [CrossRef]
  4. Theerarattananoon, K.; Xu, F.; Wilson, J.; Ballard, R.; Mckinney, L.; Staggenborg, S.; Vadlani, P.; Pei, Z.J.; Wang, D. Physical properties of pellets made from sorghum stalk, corn stover, wheat straw, and big bluestem. Ind. Crop. Prod. 2011, 33, 325–332. [Google Scholar] [CrossRef]
  5. Zamorano, M.; Popov, V.; Rodríguez, M.L.; García-Maraver, A. A comparative study of quality properties of pelletized agricultural and forestry lopping residues. Renew. Energy 2011, 36, 3133–3140. [Google Scholar] [CrossRef]
  6. Gil, M.V.; Oulego, P.; Casal, M.D.; Pevida, C.; Pis, J.J.; Rubiera, F. Mechanical durability and combustion characteristics of pellets from biomass blends. Bioresour. Technol. 2010, 101, 8859–8867. [Google Scholar] [CrossRef] [PubMed] [Green Version]
  7. Nilsson, D.; Bernesson, S.; Hansson, P.-A. Pellet production from agricultural raw materials—A systems study. Biomass Bioenergy 2011, 35, 679–689. [Google Scholar] [CrossRef]
  8. Rudolfsson, M.; Borén, E.; Pommer, L.; Nordin, A.; Lestander, T.A. Combined effects of torrefaction and pelletization parameters on the quality of pellets produced from torrefied biomass. Appl. Energy 2017, 191, 414–424. [Google Scholar] [CrossRef]
  9. Prins, M.J.; Ptasinski, K.J.; Janssen, F.J.J.G. Torrefaction of wood: Part 2. Analysis of products. J. Anal. Appl. Pyrolysis 2006, 77, 35–40. [Google Scholar] [CrossRef]
  10. Chen, W.-H.; Hsu, H.-C.; Lu, K.-M.; Lee, W.-J.; Lin, T.-C. Thermal pretreatment of wood (Lauan) block by torrefaction and its influence on the properties of the biomass. Energy 2011, 36, 3012–3021. [Google Scholar] [CrossRef]
  11. Wang, G.; Luo, Y.; Deng, J.; Kuang, J.; Zhang, Y. Pretreatment of biomass by torrefaction. Chin. Sci. Bull. 2011, 56, 1442–1448. [Google Scholar] [CrossRef] [Green Version]
  12. Wannapeera, J.; Fungtammasan, B.; Worasuwannarak, N. Effects of temperature and holding time during torrefaction on the pyrolysis behaviors of woody biomass. J. Anal. Appl. Pyrolysis 2011, 92, 99–105. [Google Scholar] [CrossRef]
  13. Medic, D.; Darr, M.; Shah, A.; Potter, B.; Zimmerman, J. Effects of torrefaction process parameters on biomass feedstock upgrading. Fuel 2012, 91, 147–154. [Google Scholar] [CrossRef]
  14. Bridgeman, T.G.; Jones, J.M.; Shield, I.; Williams, P.T. Torrefaction of reed canary grass, wheat straw and willow to enhance solid fuel qualities and combustion properties. Fuel 2008, 87, 844–856. [Google Scholar] [CrossRef]
  15. Martín-Lara, M.A.; Ronda, A.; Zamora, M.C.; Calero, M. Torrefaction of olive tree pruning: Effect of operating conditions on solid product properties. Fuel 2017, 202, 109–117. [Google Scholar] [CrossRef]
  16. Bach, Q.-V.; Chen, W.-H.; Lin, S.-C.; Sheen, H.-K.; Chang, J.-S. Wet torrefaction of microalga Chlorella vulgaris ESP-31 with microwave-assisted heating. Energy Convers. Manag. 2017, 141, 163–170. [Google Scholar] [CrossRef]
  17. Li, H.; Liu, X.; Legros, R.; Bi, X.T.; Jim Lim, C.; Sokhansanj, S. Pelletization of torrefied sawdust and properties of torrefied pellets. Appl. Energy 2012, 93, 680–685. [Google Scholar] [CrossRef]
  18. Shankar Tumuluru, J.; Sokhansanj, S.; Hess, J.R.; Wright, C.T.; Boardman, R.D. A review on biomass torrefaction process and product properties for energy applications. Ind. Biotechnol. 2011, 7, 384–401. [Google Scholar] [CrossRef] [Green Version]
  19. Ghiasi, B.; Kumar, L.; Furubayashi, T.; Lim, C.J.; Bi, X.; Kim, C.S.; Sokhansanj, S. Densified biocoal from woodchips: Is it better to do torrefaction before or after densification? Appl. Energy 2014, 134, 133–142. [Google Scholar] [CrossRef]
  20. Lam, P.S.; Sokhansanj, S.; Bi, X.; Lim, C.J.; Melin, S. Energy Input and Quality of Pellets Made from Steam-Explode Douglas Fir (Pseudotsuga menziesii). Energy Fuel 2011, 25, 1521–1528. [Google Scholar] [CrossRef]
  21. Larsson, S.H.; Rudolfsson, M.; Nordwaeger, M.; Olofsson, I.; Samuelsson, R. Effects of moisture content, torrefaction temperature, and die temperature in pilot scale pelletizing of torrefied Norway spruce. Appl. Energy 2013, 102, 827–832. [Google Scholar] [CrossRef]
  22. Stelte, W.; Clemons, C.; Holm, J.K.; Sanadi, A.R.; Ahrenfeldt, J.; Shang, L.; Henriksen, U.B. Pelletizing properties of torrefied spruce. Biomass Bioenergy 2011, 35, 4690–4698. [Google Scholar] [CrossRef] [Green Version]
  23. Stelte, W.; Nielsen, N.P.K.; Hansen, H.O.; Dahl, J.; Shang, L.; Sanadi, A.R. Pelletizing properties of torrefied wheat straw. Biomass Bioenergy 2013, 49, 214–221. [Google Scholar] [CrossRef]
  24. Peng, J.; Wang, J.; Bi, X.T.; Lim, C.J.; Sokhansanj, S.; Peng, H.; Jia, D. Effects of thermal treatment on energy density and hardness of torrefied wood pellets. Fuel Process. Technol. 2015, 129, 168–173. [Google Scholar] [CrossRef]
  25. Shang, L.; Nielsen, N.P.K.; Dahl, J.; Stelte, W.; Ahrenfeldt, J.; Holm, J.K.; Thomsen, T.; Henriksen, U.B. Quality effects caused by torrefaction of pellets made from Scots pine. Fuel Process. Technol. 2012, 101, 23–28. [Google Scholar] [CrossRef]
  26. Chen, W.-H.; Zhuang, Y.-Q.; Liu, S.-H.; Juang, T.-T.; Tsai, C.-M. Product characteristics from the torrefaction of oil palm fiber pellets in inert and oxidative atmospheres. Bioresour. Technol. 2016, 199, 367–374. [Google Scholar] [CrossRef] [PubMed]
  27. PFI-Standard-Specification-November-2011.pdf n.d. Available online: https://www.pelletheat.org/assets/docs/pfi-standard-specification-november-2011.pdf (accessed on 6 December 2019).
  28. Bridgeman, T.G.; Jones, J.M.; Williams, A.; Waldron, D.J. An investigation of the grindability of two torrefied energy crops. Fuel 2010, 89, 3911–3918. [Google Scholar] [CrossRef] [Green Version]
  29. Angles, M.N.; Ferrando, F.; Farriol, X.; Salvado, J. Suitability of steam exploded residual softwood for the production of binderless panel. Effect of the pre-treatment severity and lignin addition. Biomass Bioenergy 2001, 21, 211–224. [Google Scholar] [CrossRef]
  30. Soponpongpipat, N.; Sittikul, D.; Comsawang, P. Prediction model of higher heating value of torrefied biomass based on the kinetics of biomass decomposition. J. Energy Inst. 2016, 89, 425–435. [Google Scholar] [CrossRef]
  31. Serrano, C.; Monedero, E.; Lapuerta, M.; Portero, H. Effect of moisture content, particle size, and pine addition on quality parameters of barley straw pellets. Fuel Process. Technol. 2011, 92, 699–706. [Google Scholar] [CrossRef]
  32. Mok, W.S.L.; Antal, M.J.; Szabo, P.; Varhegyi, G.; Zelei, B. Formation of charcoal from biomass in a sealed reactor. Ind. Eng. Chem. Res. 1992, 31, 1162–1166. [Google Scholar] [CrossRef]
  33. Slopiecka, K.; Bartocci, P.; Fantozzi, F. Thermogravimetric analysis and kinetic study of poplar wood. Appl. Energy 2012, 97, 491–497. [Google Scholar] [CrossRef]
  34. Fierro, V.; Torné-Fernández, V.; Montané, D.; Celzard, A. Study of the decomposition of kraft lignin impregnated with orthophosphoric acid. Thermochim. Acta 2005, 433, 142–148. [Google Scholar] [CrossRef]
  35. Urych, B. Determination of kinetic parameters of coal pyrolysis to simulate the process of underground coal gasification (UCG). J. Sustain. Min. 2014, 13, 3–9. [Google Scholar] [CrossRef] [Green Version]
Figure 1. The bulk density of P-RC, P-TC, and T-CP at various torrefied temperatures.
Processes 07 00930 g001
Figure 2. The bulk density ratio of P-RC, P-TC, and T-CP.
Processes 07 00930 g002
Figure 3. The higher heating value of P-RC, P-TC, and T-CP at various torrefied temperatures.
Processes 07 00930 g003
Figure 4. The HHV ratio of P-RC, P-TC, and T-CP.
Processes 07 00930 g004
Figure 5. The energy density of P-RC, P-TC, and T-CP at various torrefied temperatures.
Processes 07 00930 g005
Figure 6. The energy density ratio of P-RC, P-TC, and T-CP.
Processes 07 00930 g006
Figure 7. The durability index of P-RC, P-TC, and T-CP at various torrefied temperatures.
Processes 07 00930 g007
Figure 8. Variation of the moisture absorption of P-RC, P-TC, and T-CP.
Processes 07 00930 g008
Figure 9. Outer surface of P-RC, P-TC, and T-CP.
Processes 07 00930 g009
Figure 10. Pyrolysis process of P-TC and T-C. (a) Torrefied temperature of 230 °C. (b) Torrefied temperature of 250 °C.
Processes 07 00930 g010
Table 1. Properties of pellets of raw cassava rhizome (P-RC), pelletizing (P-TC), and torrefaction (T-CP).
P-RCP-TCT-CP
230 °C250 °C280 °C230 °C250 °C280 °C
Bulk density (kg/m3)653.56 ±17.9777.28 ±20.15762.43 ±3.69739.69 ± 5.76583.26 ± 38.97559.68 ± 15.98486.3 ± 17.98
Higher heating value (HHV) (MJ/kg)16.25 ± 0.4517.56 ± 0.5719.24 ± 1.1622.31 ± 0.9218.63 ± 1.220.54 ± 1.1323.83 ± 0.99
Energy density (GJ/m3)10.6213.1314.9716.5510.9211.5011.77
Durability index (%)98.09 ± 1.0297.85 ± 0.6197.79 ± 0.4897.24 ± 0.9196.81 ± 0.3696.29 ± 0.3290.96 ± 0.82
Char yield (%)-72.8965.0252.9683.1073.6255.45
Maximum moisture absorption (%)4.49 ± 0.102.82 ± 0.412.38 ± 0.191.95 ± 0.604.64 ± 0.154.41 ± 0.333.73 ± 0.24
Table 2. Specific energy consumption (SEC) for pelletizing of raw cassava rhizome and its torrefied char.
Raw Cassava RhizomeTorrefied Char
230 °C250 °C280 °C
SEC for pelletizing (kW-h/kg)0.120.350.350.4
Table 3. Pyrolysis kinetic parameters of P-TC and T-CP.
Step 1 Step 2
ItemE (kJ/mol)A (min−1)r2TspE (kJ/mol)A (min-1)r2
T-CP,23087.82.6 × 1070.971339080.84.7 × 1040.8318
P-TC,23081.86.5 × 1060.964240052.32.1 × 1020.7046
T-CP,25080.64.9 × 1060.978340052.22.4 × 1020.8076
P-TC,25080.74.3 × 1060.975041043.63.5 × 1010.7807

