Abstract
Capillary imbibition in unsaturated rocks is important for the exploitation of tight reservoirs, such as oil and gas reservoirs. However, the physical properties of natural rocks tend to be relatively uneven, mainly in the heterogeneity of material composition and pore space. Reservoir heterogeneity is an important factor affecting the exploitation of oil fields and other reservoirs, which can be evaluated by the pore structure tortuosity fractal dimension DT of rock. The greater the value of DT, the stronger the heterogeneity of sandstone. Two types of sandstone with high and low permeability were selected to study the effect of heterogeneity on the imbibition behavior by using high-resolution X-ray imaging and neutron radiography. Quantitative results of the wetting front position for each specimen were extracted from the neutron images. The wetting front advanced linearly with the power index of time t1/(2DT). Different values of DT were selected to estimate and discuss the effect of the heterogeneity on sorptivity. A modified L-W equation was employed to predict the sorptivity. Comparing with the experimental results, the heterogeneity plays a significant role in determining the sorptivity. The modified model provides a reference for the prediction of the sorptivity of the same types of sandstones studied in this paper.
1. Introduction
Natural rock in reservoirs, such as underground aquifers, oil, and natural gas reservoirs etc., contain a large number of microporous structures, whose physical properties tend to be relatively uneven, and are mainly manifested by the heterogeneity of the rock material composition and pore space. The imbibition of water in the pore structure has great significance for oil and gas exploitation [1,2], geothermal reservoirs [3], and the utilization of groundwater resources [4,5]. Moreover, reservoir heterogeneity is one of the important factors affecting the exploitation of oil, gas, and other reservoirs. Due to the diversity and complexity of the pore structure, it is difficult to visually describe the effect of heterogeneity on the spontaneous imbibition behavior within rock. The exploitation of nondestructive testing technology, such as high-resolution X-ray imaging (HRXI) and neutron radiography (NR), provides an effective means for the study of imbibition behavior within rock. HRXI can be used to accurately characterize the pore structure of rocks [6,7]. NR demonstrates unique advantages [8] to quantitatively analyze the distribution and movement of water owing to the strong attenuation of neutron rays by hydrogen, and its relative insensitivity to the gas phase and mineral composition (e.g., quartz and clay) [9]. The movement and distribution of water within the natural and engineered materials, such as rocks [6,8,10,11,12] and concrete [13,14,15,16], have been studied by using NR. In their studies, specimens were considered as homogeneous; the relationship between the wetting front and the square root of time is linear (i.e., obey Lucas–Washburn (L-W) equation).
However, studies have shown that the imbibition behavior in some porous media (such as fibrous textile [17], knitted fabrics [18], paper [19,20], Berea sandstone [21], chalk [22], building materials [23], bentonite clay [24], disordered medium [25]) does not obey the classical L-W equation. Laugblin and Davis [17] modified the L-W equation to explain these phenomena by introducing an imbibition time exponent α. The time exponent α of these porous media, whose imbibition behavior does not obey the L-W equation, were always less than 0.50 [17,18,19,20,21,22,23,24,25]. Recently, Cai et al. [26,27] established a fractal capillary model based on the fractal properties of curved capillaries (such as tortuosity fractal dimension DT), which further develop the L-W equation. In their model, the relationship between the wetting front and t1/(2DT) was linear. It means that only when DT = 1 does the imbibition behavior obey the L-W equation (i.e., α = 0.50); DT is an important parameter defining the water imbibition behavior. Moreover, there is a great relationship between the DT and the pore topography of the arrangement of the pore structure of the medium. Different microstructures will lead to different topologies and different curved streamlines. The DT of a tortuosity capillary represents the heterogeneity of the actual porous medium, and the larger the dimension, the stronger the heterogeneity of the medium [27]. The spontaneous imbibition could be significantly affected by the heterogeneity due to its impact on the pore topography and tortuosity.
Recently, more and more studies have been conducted on the water flow or imbibition characteristics of the heterogeneity porous media. Muljadi et al. [28] studied the effect of pore-scale heterogeneity on non-Darcy flow behavior. Hyman et al. [29] investigated the effects of heterogeneity on water flow due to changes in pore geometry and topology in randomly generated three-dimensional porous media. Patel et al. [30] established a mathematical model of the imbibition phenomenon in heterogeneous porous media during the secondary oil recovery process. Shi et al. [31] studied the numerical simulation of a full CO2 core flooding and imbibition cycle performed on a heterogeneous Tako sandstone core. Krevor et al. [32] reported the impact of natural capillary heterogeneity in a sandstone rock on CO2 saturation buildup and trapping. However, very few studies have investigated the effect of the heterogeneity on the spontaneous imbibition of porous media. Cai et al. [33] is one of the few who have their work established a mathematical model to study the effect of heterogeneity on the spontaneous imbibition of porous media.
In this paper, two types of sandstones (high and low-permeability sandstone) were selected to study the effect of heterogeneity on spontaneous imbibition behavior. Compared with high-permeability sandstone, the pore size in low-permeability sandstone is more complex; its distribution mainly ranges from micron to submicron. The clay minerals in these pores may interact with water, causing expansion to block pore structure, thereby reducing pore connectivity. These phenomena increase the complexity of the pore structure and the heterogeneity of the rock, resulting in a high tortuosity of the flow path during imbibition. The characterization and monitoring of the pore structure and spontaneous imbibition behavior of sandstone specimens take place by HRXI and NR techniques, respectively. Based on the analyses of the neutron images, the locations of the wetting front were extracted to estimate the value of DT and sorptivity. A modified L-W equation proposed by Cai et al. [33] was used to predict the sorptivity of two kinds of sandstone specimens and compare it with experimental results. Moreover, the influence of the clay mineral composition on sorptivity was discussed.
2. Materials and Methods
2.1. Sandstone Specimens and Mineral Composition
Two kinds of sandstone specimens (fine and silty sandstone) were prepared to study the imbibition of water, which were named as W1 and S1. The fine sandstone (W1) and silty sandstone (S1) were collected from Rong county of Sichuan Province and Wuding County of Yunnan Province in China, respectively. Specimens W1 and S1 were 50 mm in height and 25 mm in diameter, as shown in Figure 1. The mineral compositions of specimens W1 and S1 were measured by using X-ray diffraction (XRD). The results of XRD were listed in Table 1, which proved that the tested specimens are very suitable for studying water imbibition by neutron imaging, because they are basically composed of quartz and have less influence on neutron beams. The porosity of the fine and silty sandstone is 19.50% and 15.20%, respectively, which was measured by mercury intrusion porosimetry (MIP). The permeability of two specimens was 141 mD and 4.10 mD measured by using the chemically equilibrated water. Before the experiment, the sandstone specimens were oven dried at 105 °C [12], and the lateral sides of the specimens were covered with aluminum foil tape, which can prevent water evaporation and flow along the surface [6].
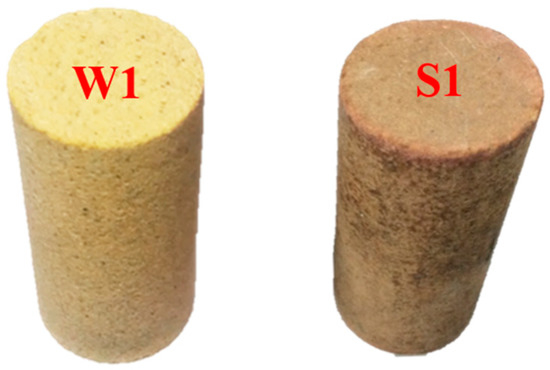
Figure 1.
Specimens investigated in the imbibition experiments. W1 is a fine sandstone, and S1 is a silty sandstone.

Table 1.
Mineral compositions of the fine sandstone (W1) and silty sandstone (S1).
2.2. Sandstone Pore Structure Characterization
Pore structures of two kinds of sandstone specimens are complicated. A nanoVoxel-4000 HRXI equipment was used to accurately characterize the pore structure. This equipment provides a maximum resolution of 0.50 μm, which was supplied by SanYing Precision Instruments Co, Ltd., Tianjin, China. Cylindrical specimens with diameters of 1.80 mm and 1.50 mm were drilled from fine and silty sandstone for Compute Tomography (CT) scanning, respectively. Three-dimension image analysis software, Avizo, was used to reconstruct the pore structures of specimens. A cube with voxels of 600 × 600 × 600 was selected from the fine and silty sandstones as a volume of interest (VOI) (see Figure 2a,b), respectively. Figure 2c,d shows the two-dimension slices of the fine and silty sandstones. Pore volumes were separated from the VOI to calculate the three-dimensional fractal dimension and tortuosity. To obtain optimal thresholds for the segmentation of pores in the two kinds of specimens, the Avizo Auto Thresholding module was used to calculate the recommended thresholds. The three-dimension volumetric porosities of pore structures were calculated using the Avizo quantification module based on the recommended thresholds, as listed in Table 2. The corresponding porosity at thresholds of 1695 and 54 is basically the same as the measured porosity of MIP. Therefore, 1695 and 54 were selected to segment the pore volume of fine sandstone and silty sandstone, respectively. Figure 2e,f shows the segmented pore volumes of the two kinds of specimens.
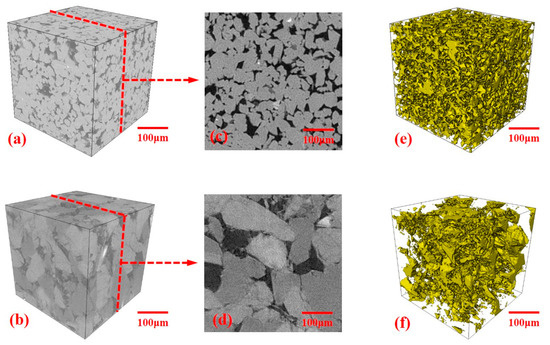
Figure 2.
Segmentation and reconstruction of the specimens W1 and S1: (a–b) The volume of interest (VOI) of 600 × 600 × 600 voxels selected from the two specimens; (c–d) Two-dimensional CT slice of the two specimens; (e–f) Three-dimensional segmented pore volumes of the two specimens.
Table 2.
The evolution of porosity of two kinds of sandstone specimens based on the CT images with different thresholds.
2.3. Setup of Neutron Radiography and Experimental procedure
The imbibition of water imbibition in specimens W1 and S1 were imaged using the cold neutron radiography facility (CNRF), which was installed at the end of the neutron catheter hall C1 catheter in the China Mianyang Research Reactor (CMRR). The CMRR is an advanced pool-type research reactor that has 20 MW of power, six horizontal tubes, 21 vertical tubes, and a D-T accelerator neutron source, established by the Institute of Nuclear Physics and Chemistry (INPC) of the China Academy of Engineering Physics (CAEP) [34]. The most probable neutron wavelength and the maximum neutron flux is 2.7 Å and 8.0 × 10⁶ n/cm2/s for CNRF at an imaging position with L/D = 400 (L is the collimator tube length; D is the aperture diameter). The imaging system is equipped with an Andori KonL CCD camera (2048 × 2048 pixel) and a 6LiF/ZnS scintillator screen (50-μm/100-μm thickness). The field of view can be chosen from 50 mm × 50 mm to 200 mm × 200 mm depending on different commercial lenses, and the digital imaging resolution is better than 5.0 lp/mm. Figure 3 illustrates the schematic of the neutron imaging facility. More detailed information of the neutron imaging facility has been reported in Hang et al. [34]. The experimental process was described as follows: (i) obtain one dark-current image (shutter closed, no neutron illumination), which is denoted as I(DF), and one flat-field image (open shutter, without specimen), which is denoted as I(OB) [35]; (ii) fix specimen W1 or S1 on the specimen holder respectively (see Figure 3), the distance of the specimen was 10 mm away from the scintillator screen; (iii) take one image of the dried specimen, denoted as I(Dry); and (iv) keep the shutter open and slowly lift the container until the bottom of specimen was in contact with the water surface—this moment is defined as the baseline (zero) time [12]. An NR image of specimens W1 and S1 was acquired every 4.23 and 12.69 s, respectively, and was denoted as I(Wet). A total 455 and 600 images were obtained during water imbibition in W1 and S1, respectively. A total of 151 images for W1 and 150 images for S1 were selected from these images for further analysis of the sorptivity of sandstone specimens.
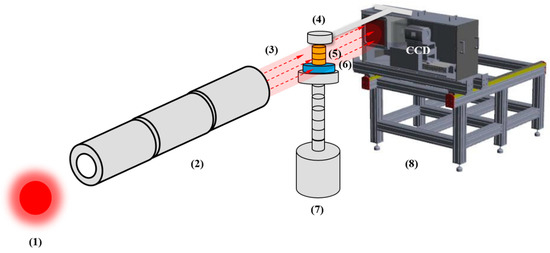
Figure 3.
Schematic of experimental arrangement for monitoring water imbibition by neutron radiography: (1) Neutron source; (2) Collimator; (3) Neutron beam; (4) Specimen holder; (5) Specimen; (6) Aluminum container; (7) Lifting platform; and (8) Imaging system [34].
2.4. Neutron Image Processing
All the raw neutron images were imported into the ImageJ software [36,37] to process. The two-dimensional distribution of net water in the tested specimen can be obtained using the following steps based on Equation (1)
(i) The normalized images of the dry and wet sandstone, denoted as Inor-d and Inor-w, were obtained by removing the background noise and beam heterogeneities in the detector by using Equation (1).
where fk is a rescaling factor that is used to correct for fluctuations in the neutron flux, which was taken as unity in this work, because all the images were collected at the same power of the neutron beam [8].
(ii) The net-water images Inet-w were obtained by removing the effect of the dry sandstone specimen and the aluminum foil tape on the neutron intensity by using Equation (2) [6,8].
The selected net-water images of W1 and S1 were shown in Figure 4 and the time interval can be found on the images.
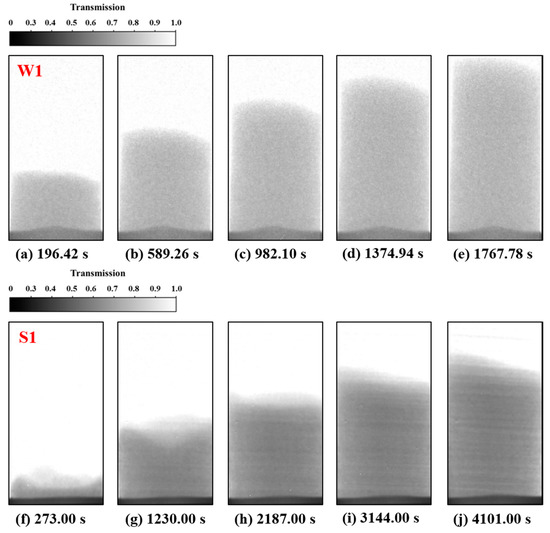
Figure 4.
Selected net water transmission images of water imbibition in the tested specimens: (a–e) Typical sequential images of water imbibition in fine sandstone (W1) at various time points; (f–j) Typical sequential images of water imbibition in silty sandstone (S1). Darker areas denote higher moisture content.
2.5. Spontaneous Imbibition Model
The phenomenon of water spontaneous imbibition in porous media has been studied since the beginning of the 20th century. Lucas [38] and Washburn [39] derived the L-W equation based on the Hagen–Poiseuille equation, which lays the foundation for the study of water imbibition in porous media. Handy [40], Benavente et al. [41], Li and Horne [22], and Huber [42] further improved the L-W equation. Recently, Cai et al. [33] introduced the fractal scaling law for characterizing the convolutedness property of tortuous capillary to describe the capillary imbibition in porous media. The imbibition height of the capillary imbibition in porous media Lsm (mm) can be expressed as:
where f(λ) is the probability density function of the capillary diameter, which is defined as . D2 is the two-dimensional fractal dimension [43]. λ (μm) is the capillary diameter. λmax (μm) and λmin (μm) are the maximum and minimum capillary diameter, respectively. μ (Ns/m2) is the viscosity of water, σ (N/m) is the air–water surface tension, and θ (°) is the water–solid contact angle. DT is the fractal dimension for the capillary tortuosity, and it lies in 1 < DT < 2 and 1 < DT < 3 in two and three-dimensional spaces, respectively. β is defined as λmin/λmax, and generally it has a value of β ≤ 10−2 in porous media [27,44,45]. Cm (mm/s1/(2DT)) is the sorptivity. Comparing Equation (3) with the modified L-W equation reported by Laugblin and Davis [17], the imbibition time exponent α can be defined as a function of the tortuosity fractal dimension DT (i.e., α = 1/(2DT)). The value of DT of some porous media, whose imbibition behavior does not obey the classic L-W equation, can be obtained as listed in Table 3.
Table 3.
Time exponent α and tortuosity fractal dimension DT from different imbibition experiments.
According to Equation (3), the sorptivity Cm can be expressed as:
The value of λmax (μm) can be calculated by using the expression as follows [46]:
where τ is the tortuosity of pore structure, K (mD) is the permeability, and φ is the porosity. Equation (4) was employed to predict the sorptivity of specimens W1 and S1.
3. Results and Discussion
3.1. Wetting Front Evolution and Tortuosity Fractal Dimension Estimation
Spontaneous imbibition behavior occurs when water enters a gas-saturated porous medium under the action of capillary force. This phenomenon appears as a migration of the wetting front alone the imbibition direction on a macro scale, and can be simplified as a one-dimensional problem [6]. Figure 4 shows the imbibition process of water in specimens W1 and S1. In order to study the imbibition process of water and monitor the moving of the wetting front in two kinds of specimens, the vertical monitoring lines L1 and L2 were determined on the net-water neutron image of specimens W1 and S1, as shown in Figure 5. The vertical monitoring line was located at the center of the net-water image of the specimen to avoid the effects of boundary effects. Quantitative results of the wetting-front position for each monitoring line were obtained from the neutron images. The height of wetting front Lsm versus the imbibition time t was plotted in Figure 6. During the imbibition process, the wetting front height of specimen S1 suddenly decreased at 5808 s (see the blue box in Figure 6). The main cause was the specimen S1 sliding down slightly at 5808 s due to the loosening of tape. Thus, the data after 5808 s of the S1 is invalid, and will be ignored in future analysis. The imbibition rate of water in specimen W1 was significantly faster than that in specimens S1. Possible causes of these phenomena are: (i) the permeability of specimen W1 (141 mD) is much larger than that of specimen S1 (4.41 mD); (ii) the specimen S1 is low-permeability sandstone; its pore structure is more complicated than W1, which mainly ranges from micron to submicron. Water needs to overcome greater capillary pressure during the imbibition. In the studies of Kang et al. [8], Cheng et al. [12], and Zhao et al. [6] the height of the water wetting front increases linearly with the square root of time. However, these studies did not consider the effect of the tortuosity fractal dimension DT of tortuous capillary tubes on the spontaneous imbibition. Logarithmically processing is on both the left and right sides of Equation (2). The double-logarithmic plots of Lsm versus t were plotted in Figure 7. According to Equation (3), the linear regression analysis of the experimental data can estimate DT. The estimated results are listed in Table 4. The first data point of the two data sets were lower than the best-fit lines, which may be caused by the bottom of the specimen possibly not being perfectly aligned with the water surface, resulting in partial contact at an early stage, and the bottom of the specimens were slightly immersed in water [12]. The results clearly show that DT for both specimens W1 and S1 are larger than 1.0; i.e., specimens W1 and S1 have heterogeneity, and the heterogeneity for W1 is stronger than for S1. Ma et al. [21] suggested the values of DT for Berea sandstone is 2.94, which is consistent with our results. The values of DT for building materials reported by Karoglou et al. [23] range from 1.02 to 1.25. EI Abd et al. [47] studied the imbibition process of fired clay and white siliceous brick specimens within initial and advanced periods, and the DT of them range from 0.81 to 1.61. Similar results also occur in the imbibition process of other types of porous media (e.g., fibrous textile [17], knitted fabrics [18], paper [19,20], chalk [22], bentonite clay [24], disordered medium [25]), and the DT of them ranges from 1.0 to 2.38. The heterogeneity of porous media and the randomness of pore size is the main cause of these results [24]. It means that DT has a major influence on the spontaneous imbibition behavior of rock (i.e., sandstone). Simplifying the rock into a homogeneous porous medium (i.e., DT = 1.0) cannot accurately study its imbibition behavior.
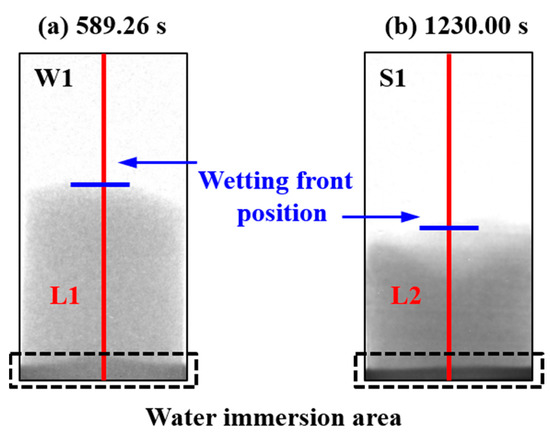
Figure 5.
Schematic of the method for measuring the wetting front in the specimens: (a) Location of monitoring line L1 and typical transmission image of net water imbibition in W1 at 589.26 s; (b) Location of monitoring line L2 and typical transmission image of net water imbibition in S1 at 1230.00 s.
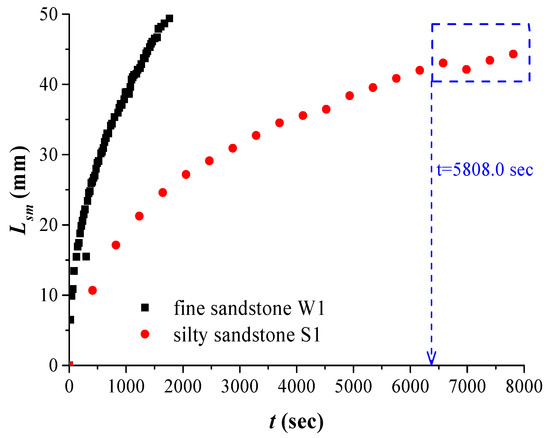
Figure 6.
The height of wetting front Lsm versus the imbibition time t for two kinds of specimens.
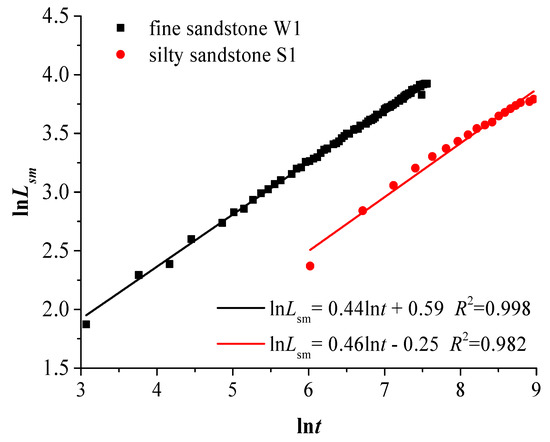
Figure 7.
The double-logarithmic plots of Lsm versus t for two kinds of specimens.
Table 4.
Sorptivity (Cm) and goodness-of-fit (R2) parameters of the fine sandstone (W1) and silty sandstone (S1).
3.2. Effect of Heterogeneity on Water Sorptivity
The sorptivity of rock, including Berea sandstone, silty sandstone, coarse-grained sandstone, and limestone, has been analyzed by researchers through linear regression [6,11,12,48]. Sandstone specimens in these studies were simplified to a homogeneous porous medium (i.e., DT = 1.0). However, in this work, the influence of DT on the water sorptivity is considered. The height of wetting front Lsm versus the power index of time t1/(2DT) was plotted in Figure 8. According to Equation (3), the linear regression analysis of the experimental data can estimate the sorptivity. The estimated results are listed in Table 5. The sorptivities of the two specimens increased with the increase of the permeability, which was consistent with the results of Cheng et al. [12]. Moreover, the sorptivity of Berea sandstone (42 mD) was 1.17 mm/s0.50 in the report of Kang et al. [8], which is larger than the sorptivity of S1 (4.10 mD) and less than the sorptivity of W1 (141 mD). This result is consistent with the law obtained in our study that the sorptivity increased with the increase of the permeability. These sorptivity results of specimens W1 and S1 are much smaller than those reported sorptivities (3.77~4.55 mm/s0.50) for a Berea sandstone matrix (~200–500 mD) [12]. One possible cause of this phenomenon is that the permeabilities of those Berea sandstones are much larger than those of specimens W1 and S1. However, the sorptivity of the Berea sandstone (50 mD) was 2.90 mm/s0.50 [12], which is larger than that of specimen W1 (141 mD). The main cause of this phenomenon is that the fracture can significantly increase imbibition in unsaturated sandstone. When considering the influence of DT, the water sorptivity of the sandstone specimen (W1 or S1) is ~1.47 times larger than that of the sorptivity obtained without considering the influence of the DT. Moreover, the sorptivity of silty sandstone is 0.5643 mm/s0.50 in the report of Zhao et al. [6], which is basically consistent with our study. It means that the heterogeneity (i.e., DT) plays an important role in estimating the sorptivity.
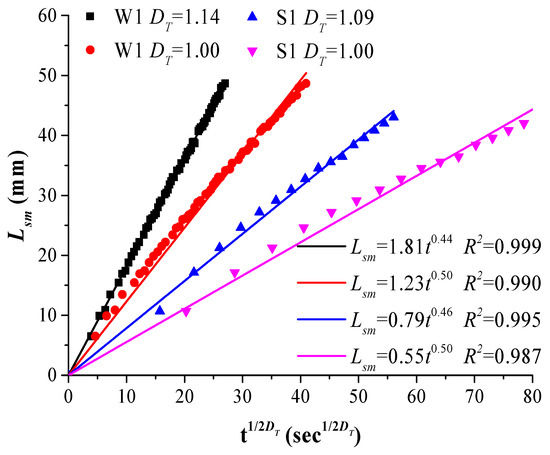
Figure 8.
Plots of Lsm versus t1/2DT for two kinds of specimens.
Table 5.
Sorptivity (Cm) and goodness-of-fit (R2) parameters of the fine sandstone (W1) and silty sandstone (S1).
To further analyze the effect of heterogeneity on the sorptivity, Equation (4) was used to predict the sorptivity of two types of sandstone specimens. The parameters used to calculate the sorptivity of two specimens are listed in Table 6. The three-dimensional fractal dimension D3 and the tortuosity of the pore structure τ of the two specimens is calculated by the Avizo fractal dimension module and the Avizo centroid path tortuosity module based on the pore structure data of VOI after segmentation (see Figure 2e,f), respectively. The values of D3 for specimens W1 and S1 is 2.45 and 2.40, respectively. The difference between the values of the two and three-dimensional fractal dimensions is 1.0 [49]; thus, the values of the two-dimensional fractal dimension D2 for the two specimens are equal to 1.45 and 1.40, respectively. The values of λmax (μm) of specimens W1 and S1 can be calculated by using Equation (5) [46] and are equal to 13.33 μm and 0.87 μm, respectively. We can assume that β is equal to 0.01 for tested sandstone specimens, which is in accordance with the β ≦ 10−2 in porous media [27,44,45]. The predicted sorptivity of specimen W1 is 1.85 mm/s0.44, which is 1.02 times larger than that estimated by linear regression (1.81 mm/s0.44). When DT = 1.0, the predicted sorptivity of specimens W1 and S1 is 2.35 mm/s0.50, which is 2.10 times larger than the linear regression value. It means that the specimen W1 has heterogeneity, which has an important influence on the determination of the sorptivity of specimen W1. Then, we modified Equation (4) and obtained Equation (6) to predict the sorptivity of the same type of sandstone specimen W1.
Table 6.
Parameters used to predict the sorptivity of two specimens.
The predicted sorptivity of specimen S1 is 0.46 mm/s0.46 (for DT = 1.09) and 0.61 mm/s0.50 (for DT = 1.0). The error between the value of the predicted and linear regression is 41.77% (for DT = 1.09) and 10.91% (for DT = 1.0). The experimental measurements overestimate the fractal dimension of the tortuosity, and specimen S1 can be approximated as homogeneous. Equation (4) can be used to predict the sorptivity of the same type of sandstone specimen S1. The predicted sorptivity of specimen W1 (for DT = 1.14) and S1 (for DT = 1.0) are larger than that obtained by the linear regression value; possible causes are: (i) clay minerals, such as illite and kaolinite, in sandstone specimens W1 and S1 may block the seepage channel after water swelling and lead to a decrease of pore connectivity and increase the tortuosity of flow [12]; (ii) the shrinkage, closure, and elimination of pore throats lead to poor pore connectivity in silty sandstone [6,50,51]. The results show that the heterogeneity has an important influence on the water sorptivity. Moreover, the tortuosity, maximum pore sizes, pore fractal dimension, and clay mineral composition further determine the sorptivity of sandstone during water imbibition. Equation (6) provides a reference for the prediction of the sorptivity of the same type of fine sandstone studied in this paper.
4. Conclusions
In this study, the dynamics of water imbibition in two kinds of sandstone specimens with different permeabilities were monitored successfully by NR. The wetting front position of the sandstone specimens during the imbibition process was extracted based on the neutron images. The wetting front movement speed increases with the increase of permeability. The effect of the tortuosity fractal dimension DT of tortuous capillary tubes on the spontaneous imbibition was considered. Linear regression analysis found that the DT values for both specimens, W1 and S1, are larger than 1.0, i.e., specimens W1 and S1 are heterogeneous, and the heterogeneity for W1 is stronger than that for S1. The experimental results show that the wetting front advanced linearly with the power index of time t1/2DT. The sorptivity of specimens W1 and S1 were estimated by the linear regression of the experimental data. The sorptivities of two specimens increased with the increase of the permeability. The modified L-W equation considers that DT was employed to predict the sorptivity of sandstone specimens W1 and S1. By comparing the experimental and model prediction results, we found that the heterogeneity, pore microstructure (e.g., the tortuosity, maximum pore sizes, and pore fractal dimension), and clay mineral composition (e.g., vermiculite, illite, and kaolinite) play a significant role in determining the sorptivity. A modified sorptivity prediction model provides a reference for the prediction of the sorptivity of the same type of sandstone studied in this paper.
Author Contributions
Conceptualization, Y.Z. and Y.W.; Methodology, Y.Z. and Y.W., Software, P.L.; Investigation, Y.W.; Writing—original draft preparation, Y.W.; Writing—review and editing, Y.Z. and Y.W.
Funding
This research is supported by the National Key R&D Program of China (2016YFC0600708), National Natural Science Foundation of China (No. 51874312, 51861145403), Open Project Program of State Key Laboratory of Water Resource Protection and Utilization in Coal Mining (SHJT-16-30.17), Yue Qi Distinguished Scholar Project of China University of Mining & Technology (Beijing), Fundamental Research Funds for the Central Universities.
Acknowledgments
The Institute of Nuclear Physics and Chemistry of China Academy of Engineering Physics are gratefully acknowledged for their support of this work and for providing access to the neutron imaging facility. The authors are very grateful to the authors of all the references.
Conflicts of Interest
The authors declare no conflict of interest.
References
- Karpyn, Z.T.; Halleck, P.M.; Grader, A.S. An experimental study of spontaneous imbibition in fractured sandstone with contrasting sedimentary layers. J. Pet. Sci. Eng. 2009, 67, 48–56. [Google Scholar] [CrossRef]
- Li, K.; Horne, R. Characterization of Spontaneous Water Imbibition into Gas-Saturated Rocks. SPE J. 2001, 6, 1–12. [Google Scholar] [CrossRef]
- Bingham, P.; Polsky, Y.; Anovitz, L.; Carmichael, J.; Bilheux, H.; Jacobsen, D. Neutron radiography of fluid flow for geothermal energy research. Phys. Procedia 2015, 69, 464–471. [Google Scholar] [CrossRef][Green Version]
- Daniel, T.B.; Harihar, R.; David, D.; Hari, S.V. Hydraulic fracturing fluid migration in the subsurface: A review and expanded modeling results. Water Resour. Res. 2015, 51, 7159–7188. [Google Scholar]
- Cnudde, V.; Dierick, M.; Vlassenbroeck, J.; Masschaele, B.; Lehmann, E.; Jacobs, P.; Van Hoorebeke, L. High-speed neutron radiography for monitoring the water absorption by capillarity in porous materials. Nucl. Instrum. Methods Phys. Res. Sect. B Beam Interact. Mater. Atoms. 2008, 266, 155–163. [Google Scholar] [CrossRef]
- Zhao, Y.; Xue, S.; Han, S.; Chen, Z.; Liu, S.; Elsworth, D.; He, L.; Cai, J.; Liu, Y.; Chen, D. Effects of microstructure on water imbibition in sandstones using X-ray computed tomography and neutron radiography. J. Geophys. Res. Solid Earth 2017, 122, 4963–4981. [Google Scholar] [CrossRef]
- Kim, F.H.; Penumadu, D.; Hussey, D.S. Water distribution variation in partially saturated granular materials using neutron imaging. J. Geotech. Geoenviron. Eng. 2012, 138, 147–154. [Google Scholar] [CrossRef]
- Kang, M.; Perfect, E.; Cheng, C.L.; Bilheux, H.Z.; Gragg, M.; Wright, D.M.; Horita, J.; Warren, J.M. Diffusivity and Sorpvity of Berea Sandstone Determined using Neutron Radiography. Vadose Zone J. 2013, 12, 1712–1717. [Google Scholar] [CrossRef]
- de Beer, F.C.; Middleton, M.F. Neutron radiography imaging, porosity and permeability in porous rocks. S. Afr. J. Geol. 2006, 109, 541–550. [Google Scholar] [CrossRef]
- Dewanckele, J.; De Kock, T.; Fronteau, G.; Derluyn, H.; Vontobel, P.; Dierick, M. Neutron radiography and X-ray computed tomography for quantifying weathering and water uptake processes inside porous limestone used as building material. Mater. Charact. 2013, 88, 86–99. [Google Scholar] [CrossRef]
- Hassanein, R.; Meyer, H.O.; Carminati, A.; Estermann, M.; Lehmann, E.; Vontobel, P. Investigation of water imbibition in porous stone by thermal neutron radiography. J. Phys. D Appl. Phys. 2006, 39, 4284–4291. [Google Scholar] [CrossRef]
- Cheng, C.L.; Perfect, E.; Donnelly, B.; Bilheux, H.Z.; Tremsin, A.S.; Mckay, L.D.; Distefano, V.H.; Cai, J.C.; Santodonato, L.J. Rapid imbibition of water in fractures within unsaturated sedimentary rock. Adv. Water Resour. 2015, 77, 82–89. [Google Scholar] [CrossRef]
- Zhang, P.; Wittmann, F.H.; Zhao, T.; Lehmann, E.H. Neutron imaging of water penetration into cracked steel reinforced concrete. Phys. B Condens. Matter 2010, 405, 1866–1871. [Google Scholar] [CrossRef]
- Zhang, P.; Wittmann, F.H.; Zhao, T.J.; Lehmann, E.H.; Tian, L.; Vontobel, P. Observation and quantification of water penetration into Strain Hardening Cement-based Composites (SHCC) with multiple cracks by means of neutron radiography. Nucl. Instrum. Methods Phys. Res. A 2010, 620, 414–420. [Google Scholar] [CrossRef]
- Zhang, P.; Wittmann, F.H.; Zhao, T.; Lehmann, E. Observation of Water Penetration of water into uncracked and cracked steel Reinforced Concrete Elements by Means of Neutron Radiography. J. Qingdao Technol. Univ. 2009, 29, 10–16. [Google Scholar]
- Zhang, P.; Wittmann, F.H.; Zhao, T.; Lehmann, E.H.; Vontobel, P. Neutron radiography, a powerful method to determine time-dependent moisture distributions in concrete. Nucl. Eng. Des. 2011, 241, 4758–4766. [Google Scholar] [CrossRef]
- Laughlin, R.D.; Davies, J.E. Some Aspects of Capillary Absorption in Fibrous Textile Wicking. Text. Res. J. 1961, 31, 904–910. [Google Scholar] [CrossRef]
- Zhuang, Q.; Harlock, S.C.; Brook, D.B. Longitudinal wicking of weft knitted fabrics part II: Wicking mechanism of knitted fabrics used in undergarments for outdoor activities. J. Text. Inst. 2002, 93, 97–106. [Google Scholar] [CrossRef]
- Lam, C.H.; Horváth, V.K. Pipe network model for scaling of dynamic interfaces in porous media. Phys. Rev. Lett. 2000, 85, 1238–1241. [Google Scholar] [CrossRef]
- Balankin, A.S.; Paredes, R.G.; Susarrey, O.; Morales, D.; Vacio, F.C. Kinetic roughening and pinning of two coupled interfaces in disordered media. Phys. Rev. Lett. 2006, 96, 1–4. [Google Scholar] [CrossRef]
- Ma, S.; Morrow, R.N.; Zhang, X. Generalized scaling of spontaneous imbibition data for strongly water-wet systems. J. Pet. Sci. Eng. 1997, 4105, 165–178. [Google Scholar]
- Li, K.; Horne, R.N. An Analytical Scaling Method for Spontaneous Imbibition in Gas-Water-Rock Systems. SPE J. 2004, 9, 322–329. [Google Scholar] [CrossRef]
- Karoglou, M.; Moropoulou, A.; Giakoumaki, A.; Krokida, M.K. Capillary rise kinetics of some building materials. J. Colloid Interface Sci. 2005, 284, 260–264. [Google Scholar] [CrossRef] [PubMed]
- Brú, A.; Pastor, J.M. Experimental characterization of hydration and pinning in bentonite clay, a swelling, heterogeneous, porous medium. Geoderma 2006, 134, 295–305. [Google Scholar] [CrossRef]
- Dubé, M.; Rost, M.; Elder, K.R.; Alava, M.; Majaniemi, S.; Ala-Nissila, T. Liquid conservation and nonlocal interface dynamics in imbibition. Phys. Rev. Lett. 1999, 83, 1628–1631. [Google Scholar] [CrossRef]
- Cai, J.; Yu, B.; Mei, M.; Luo, L. Capillary rise in a single tortuous capillary. Chin. Phys. Lett. 2010, 27, 1–4. [Google Scholar]
- Cai, J.; Yu, B.; Zou, M.; Luo, L. Fractal characterization of spontaneous co-current imbibition in porous media. Energy Fuels 2010, 24, 1860–1867. [Google Scholar] [CrossRef]
- Muljadi, B.P.; Blunt, M.J.; Raeini, A.Q.; Bijeljic, B. The impact of porous media heterogeneity on non-Darcy flow behaviour from pore-scale simulation. Adv. Water Resour. 2016, 95, 329–340. [Google Scholar] [CrossRef]
- Hyman, J.D.; Winter, C.L. Heterogeneities of flow in stochastically generated porous media Heterogeneities of flow in stochastically generated porous media. Phys. Rev. E 2012, 86, 056701. [Google Scholar] [CrossRef]
- Patel, K.R.; Mehta, M.N.; Patel, T.R. A mathematical model of imbibition phenomenon in heterogeneous porous media during secondary oil recovery process. Appl. Math. Model. 2013, 37, 2933–2942. [Google Scholar] [CrossRef]
- Shi, J.; Xue, Z.; Durucan, S. International Journal of Greenhouse Gas Control Supercritical CO2 core flooding and imbibition in Tako sandstone-Influence of sub-core scale heterogeneity. Int. J. Greenh. Gas Control 2011, 5, 75–87. [Google Scholar] [CrossRef]
- Krevor, S.C.M.; Pini, R.; Li, B.; Benson, S.M. Capillary heterogeneity trapping of CO2 in a sandstone rock at reservoir conditions. Geophys. Res. Lett. 2011, 38, 1–5. [Google Scholar] [CrossRef]
- Cai, J.; Yu, B. A Discussion of the Effect of Tortuosity on the Capillary Imbibition in Porous Media. Transp. Porous Media 2011, 89, 251–263. [Google Scholar] [CrossRef]
- Li, H.; Wang, S.; Cao, C.; Huo, H.; Tang, B. Neutron Imaging Development at China Academy of Engineering Physics (CAEP). Phys. Procedia 2017, 88, 154–161. [Google Scholar] [CrossRef]
- Cheng, C.L.; Kang, M.; Perfect, E.; Voisin, S.; Horita, J.; Bilheux, H.Z.; Warren, J.M.; Jacobson, D.L.; Hussey, D.S. Average Soil Water Retention Curves Measured by Neutron Radiography. Soil Sci. Soc. Am. J. 2011, 76, 1184–1191. [Google Scholar] [CrossRef]
- Schneider, C.A.; Rasband, W.S.; Eliceiri, K.W. NIH Image to ImageJ: 25 years of image analysis. Nat. Methods 2012, 9, 671–675. [Google Scholar] [CrossRef] [PubMed]
- Abràmofff, M.D.; Magalhães, P.J.; Ram, S.J. Image processing with ImageJ Part II. Biophotonics Int. 2005, 11, 36–43. [Google Scholar]
- Lucas, R. Rate of capillary ascension of liquids. Kolloid Z 1918, 23, 15–22. [Google Scholar] [CrossRef]
- Washburn, E.W. The dynamics of capillary flow. Phys. Rev. 1921, 17, 273–283. [Google Scholar] [CrossRef]
- Handy, L.L. Determination of Effective Capillary Pressures for Porous Media from Imbibition Data. AIME 1960, 219, 75–80. [Google Scholar]
- Benavente, D.; Lock, P.; Ángeles, M.; Del, G. Predicting the Capillary Imbibition of Porous Rocks from Microstructure. Trans. Porous Media 2002, 49, 59–76. [Google Scholar] [CrossRef]
- Huber, P.; Gr, S. Rheology of liquids in nanopores: A study on the capillary rise of water, n-Hexadecane and n-Tetracosane in mesoporous silica. Eur. Phys. J. Spec. Top. 2007, 105, 101–105. [Google Scholar] [CrossRef]
- Yu, B. Analysis of Flow in Fractal Porous Media. Appl. Mech. Rev. 2008, 61, 050801. [Google Scholar] [CrossRef]
- Yu, B.; Li, J. Some fractal characters of porous media. Fractals 2001, 9, 365–372. [Google Scholar] [CrossRef]
- Feng, Y.; Yu, B.; Zou, M.; Zhang, D. A generalized model for the effective thermal conductivity of porous media based on self-similarity. J. Phys. D: Appl. Phys. 2004, 37, 3030–3040. [Google Scholar] [CrossRef]
- Cai, J.; Yu, B. Prediction of maximum pore size of porous media based on fractal geometry. Fractals 2010, 18, 417–423. [Google Scholar] [CrossRef]
- EI Abd, A.E.-G.; Milczarek, J.J. Neutron radiography study of water absorption in porous building materials: Anomalous diffusion analysis. J. Phys. D Appl. Phys. 2004, 37, 2305–2313. [Google Scholar] [CrossRef]
- Hammecker, C.; Jeannette, D. Modelling the capillary imbibition kinetics in sedimentary rocks: Role of petrographical features. Transp. Porous Media 1994, 17, 285–303. [Google Scholar] [CrossRef]
- Gibson, J.R.; Lin, H.; Bruns, M.A. A comparison of fractal analytical methods on 2- and 3-dimensional computed tomographic scans of soil aggregates. Geoderma 2006, 134, 335–348. [Google Scholar] [CrossRef]
- Benavente, D.; Pla, C.; Cueto, N.; Benavente, D.; Pla, C.; Cueto, N.; Galvañ, S.; Martínez-Martínez, J.; García-del-Cura, M.A.; Ordóñez, S. Predicting water permeability in sedimentary rocks from capillary imbibition and pore structure. Eng. Geol. 2015, 195, 301–311. [Google Scholar] [CrossRef]
- Doyen, P.M. Permeability, conductivity, and pore geometry of sandstone. J. Geophys. Res. 1988, 93, 7729–7740. [Google Scholar] [CrossRef]


© 2019 by the authors. Licensee MDPI, Basel, Switzerland. This article is an open access article distributed under the terms and conditions of the Creative Commons Attribution (CC BY) license (http://creativecommons.org/licenses/by/4.0/).