Enhancement Study of Ice Storage Performance in Circular Tank with Finned Tube


Abstract
:1. Introduction
2. Experimental and Numerical Methods
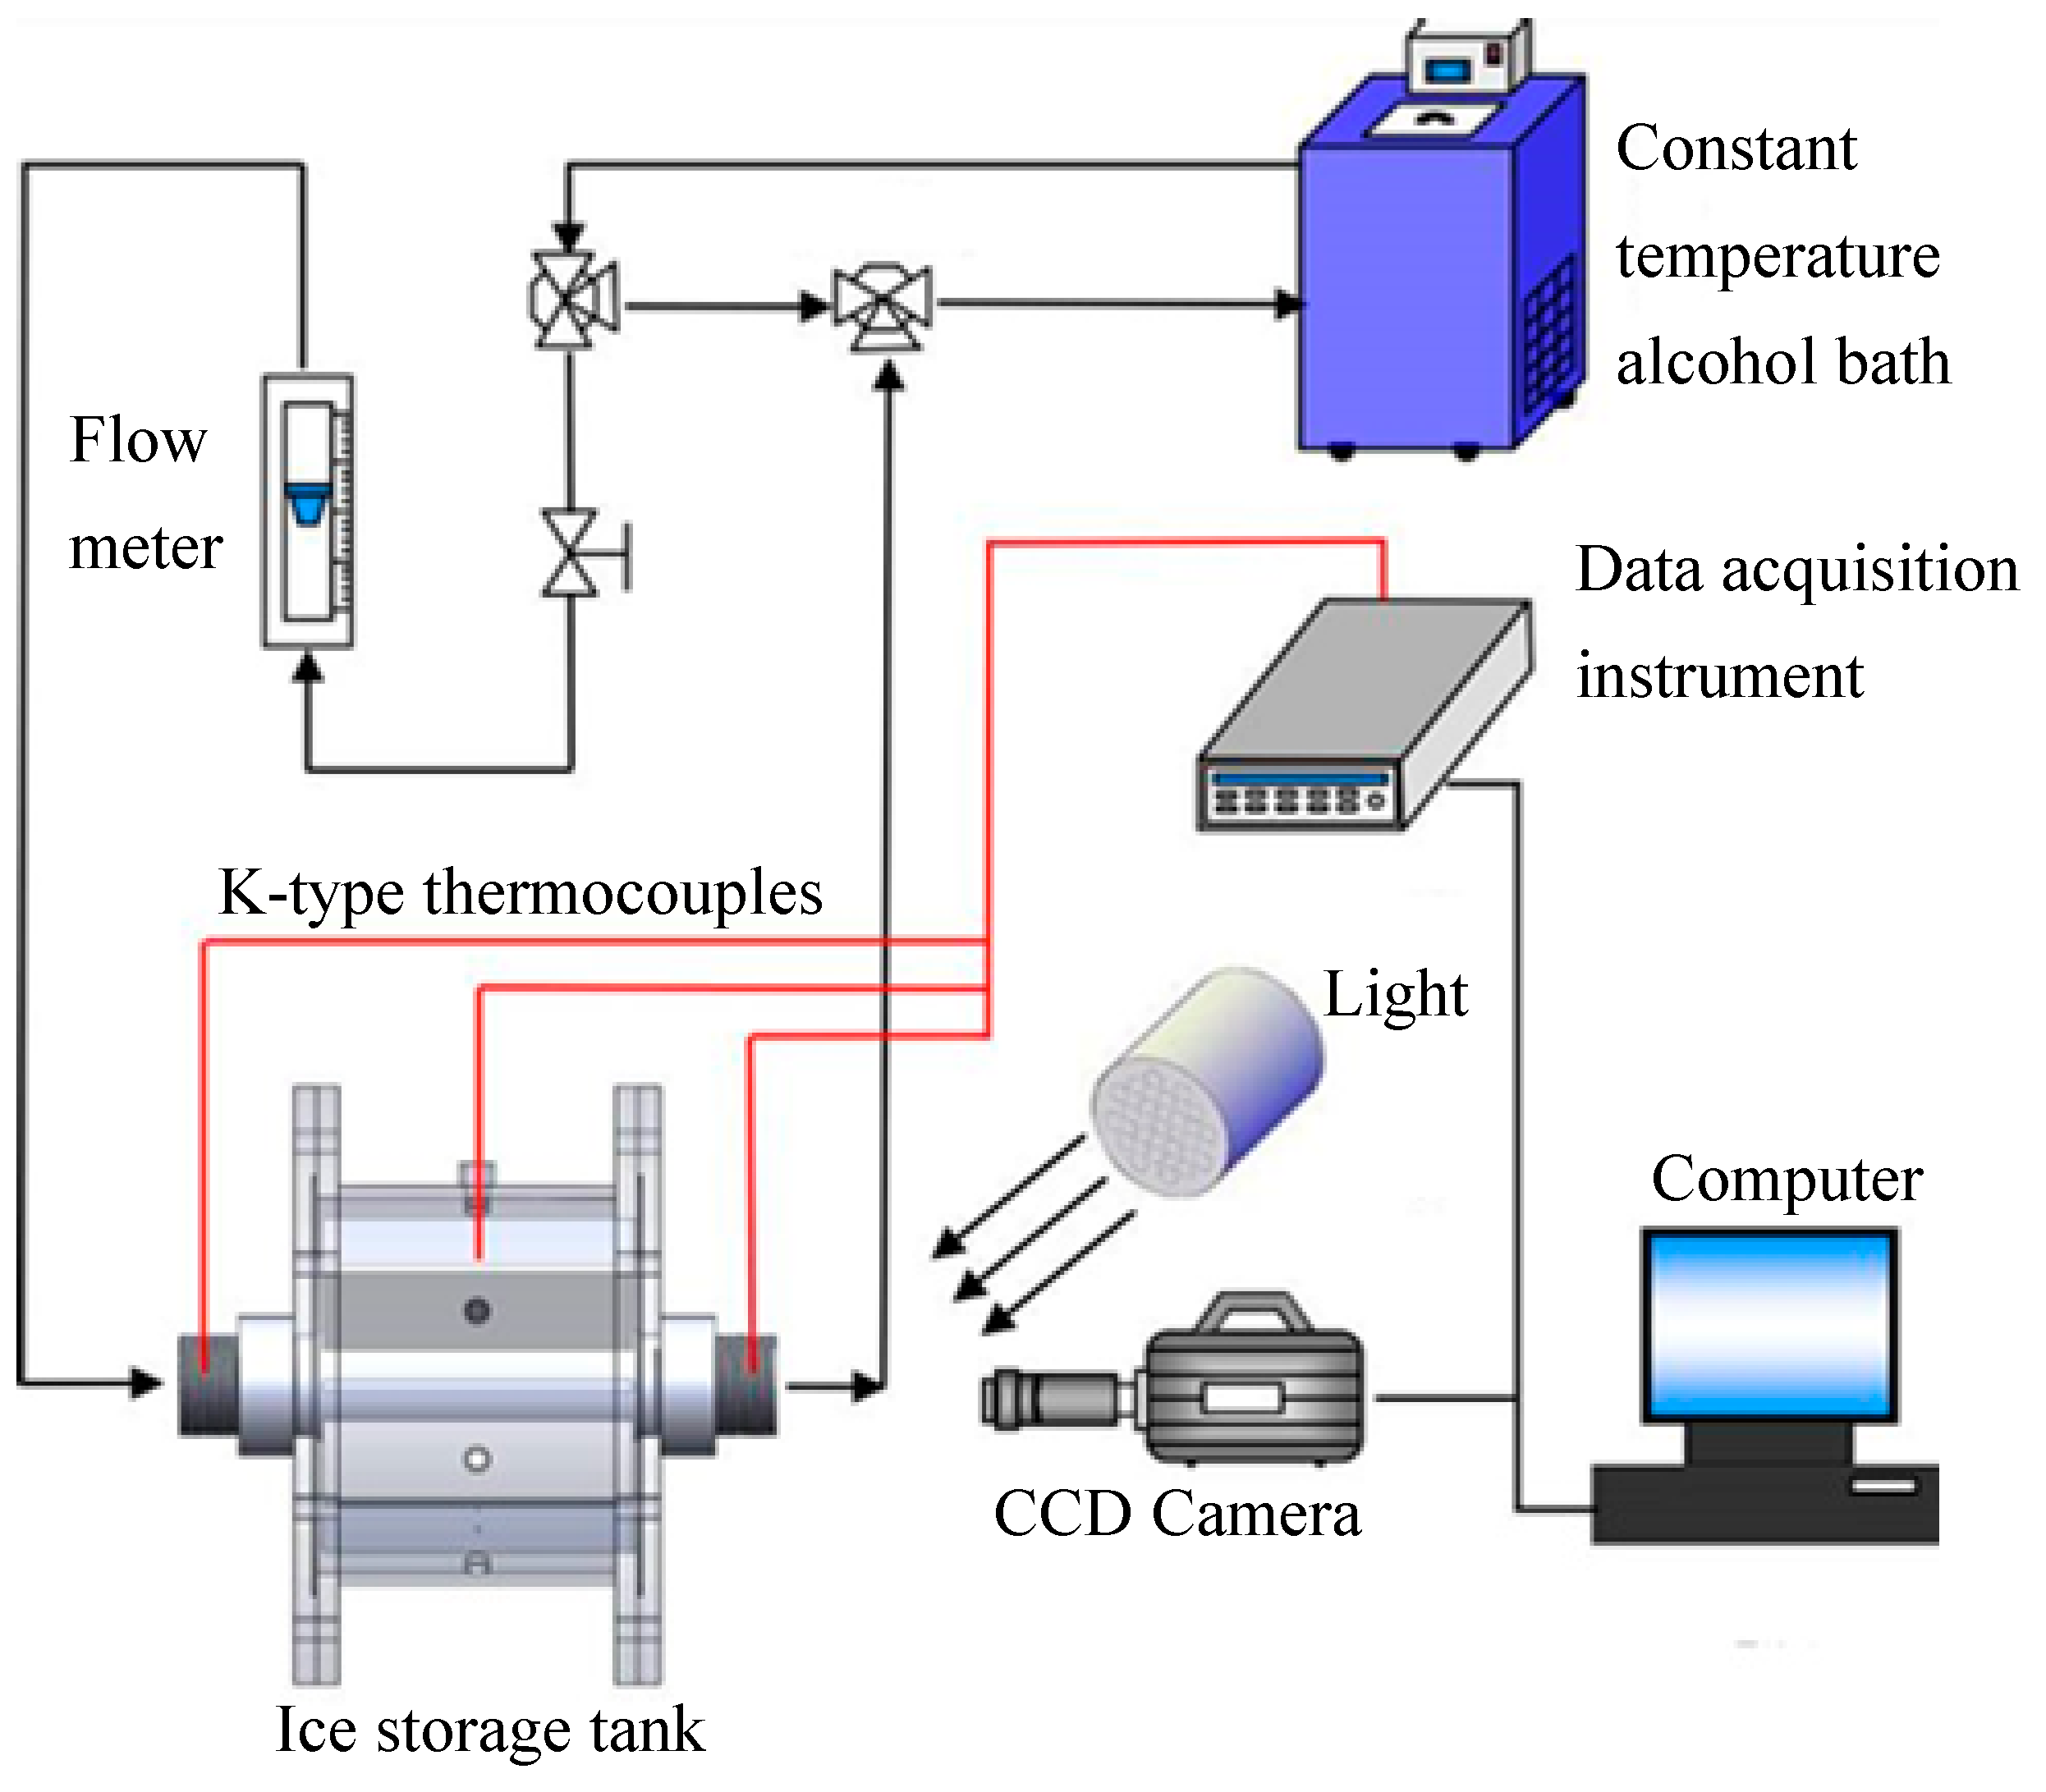
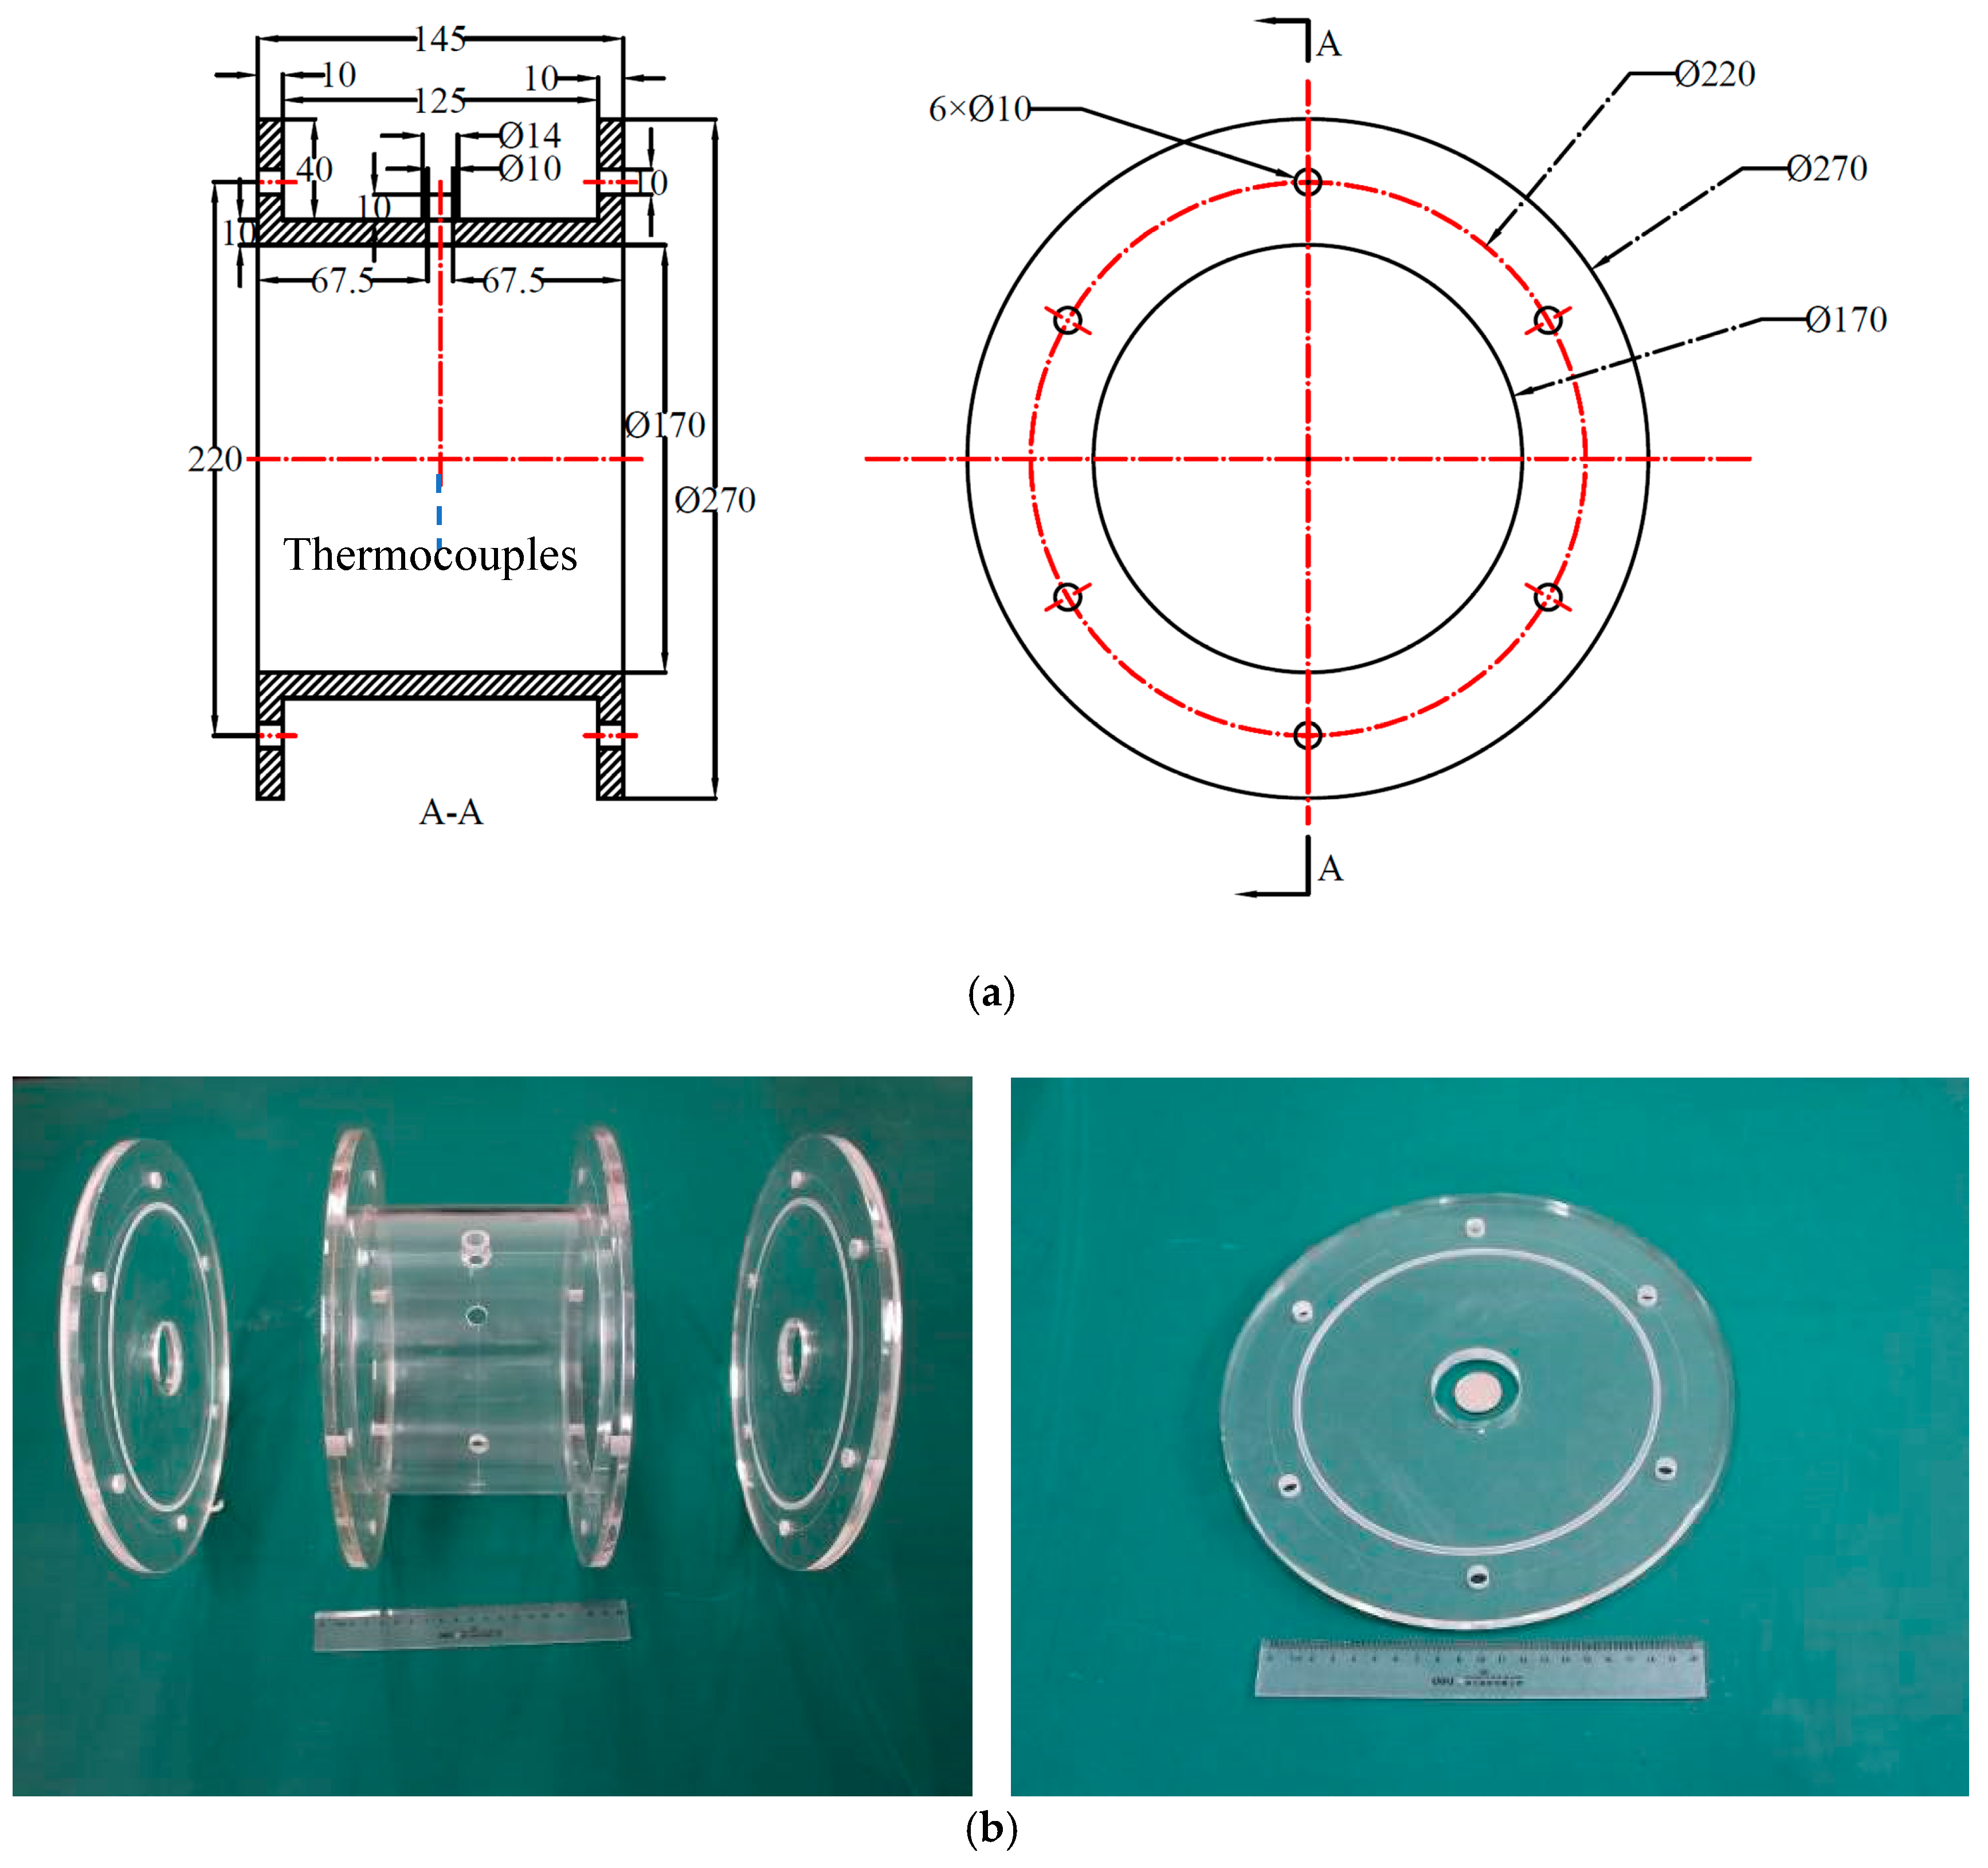
2.1. Ice Storage Performance Test System
2.2. Numerical Methods
- Water is isotropic in both liquid and solid state, and the physical parameters of water are constant, except density;
- For the tube with fins, which is also isotropic, the values of the physical parameters are common;
- The effects of the volume and the supercooling during freezing are neglected, and the phase transition temperature is fixed;
- There is only laminar flow inside the tank;
- The fluid and solid are in local heat balance.
3. Results and Discussion
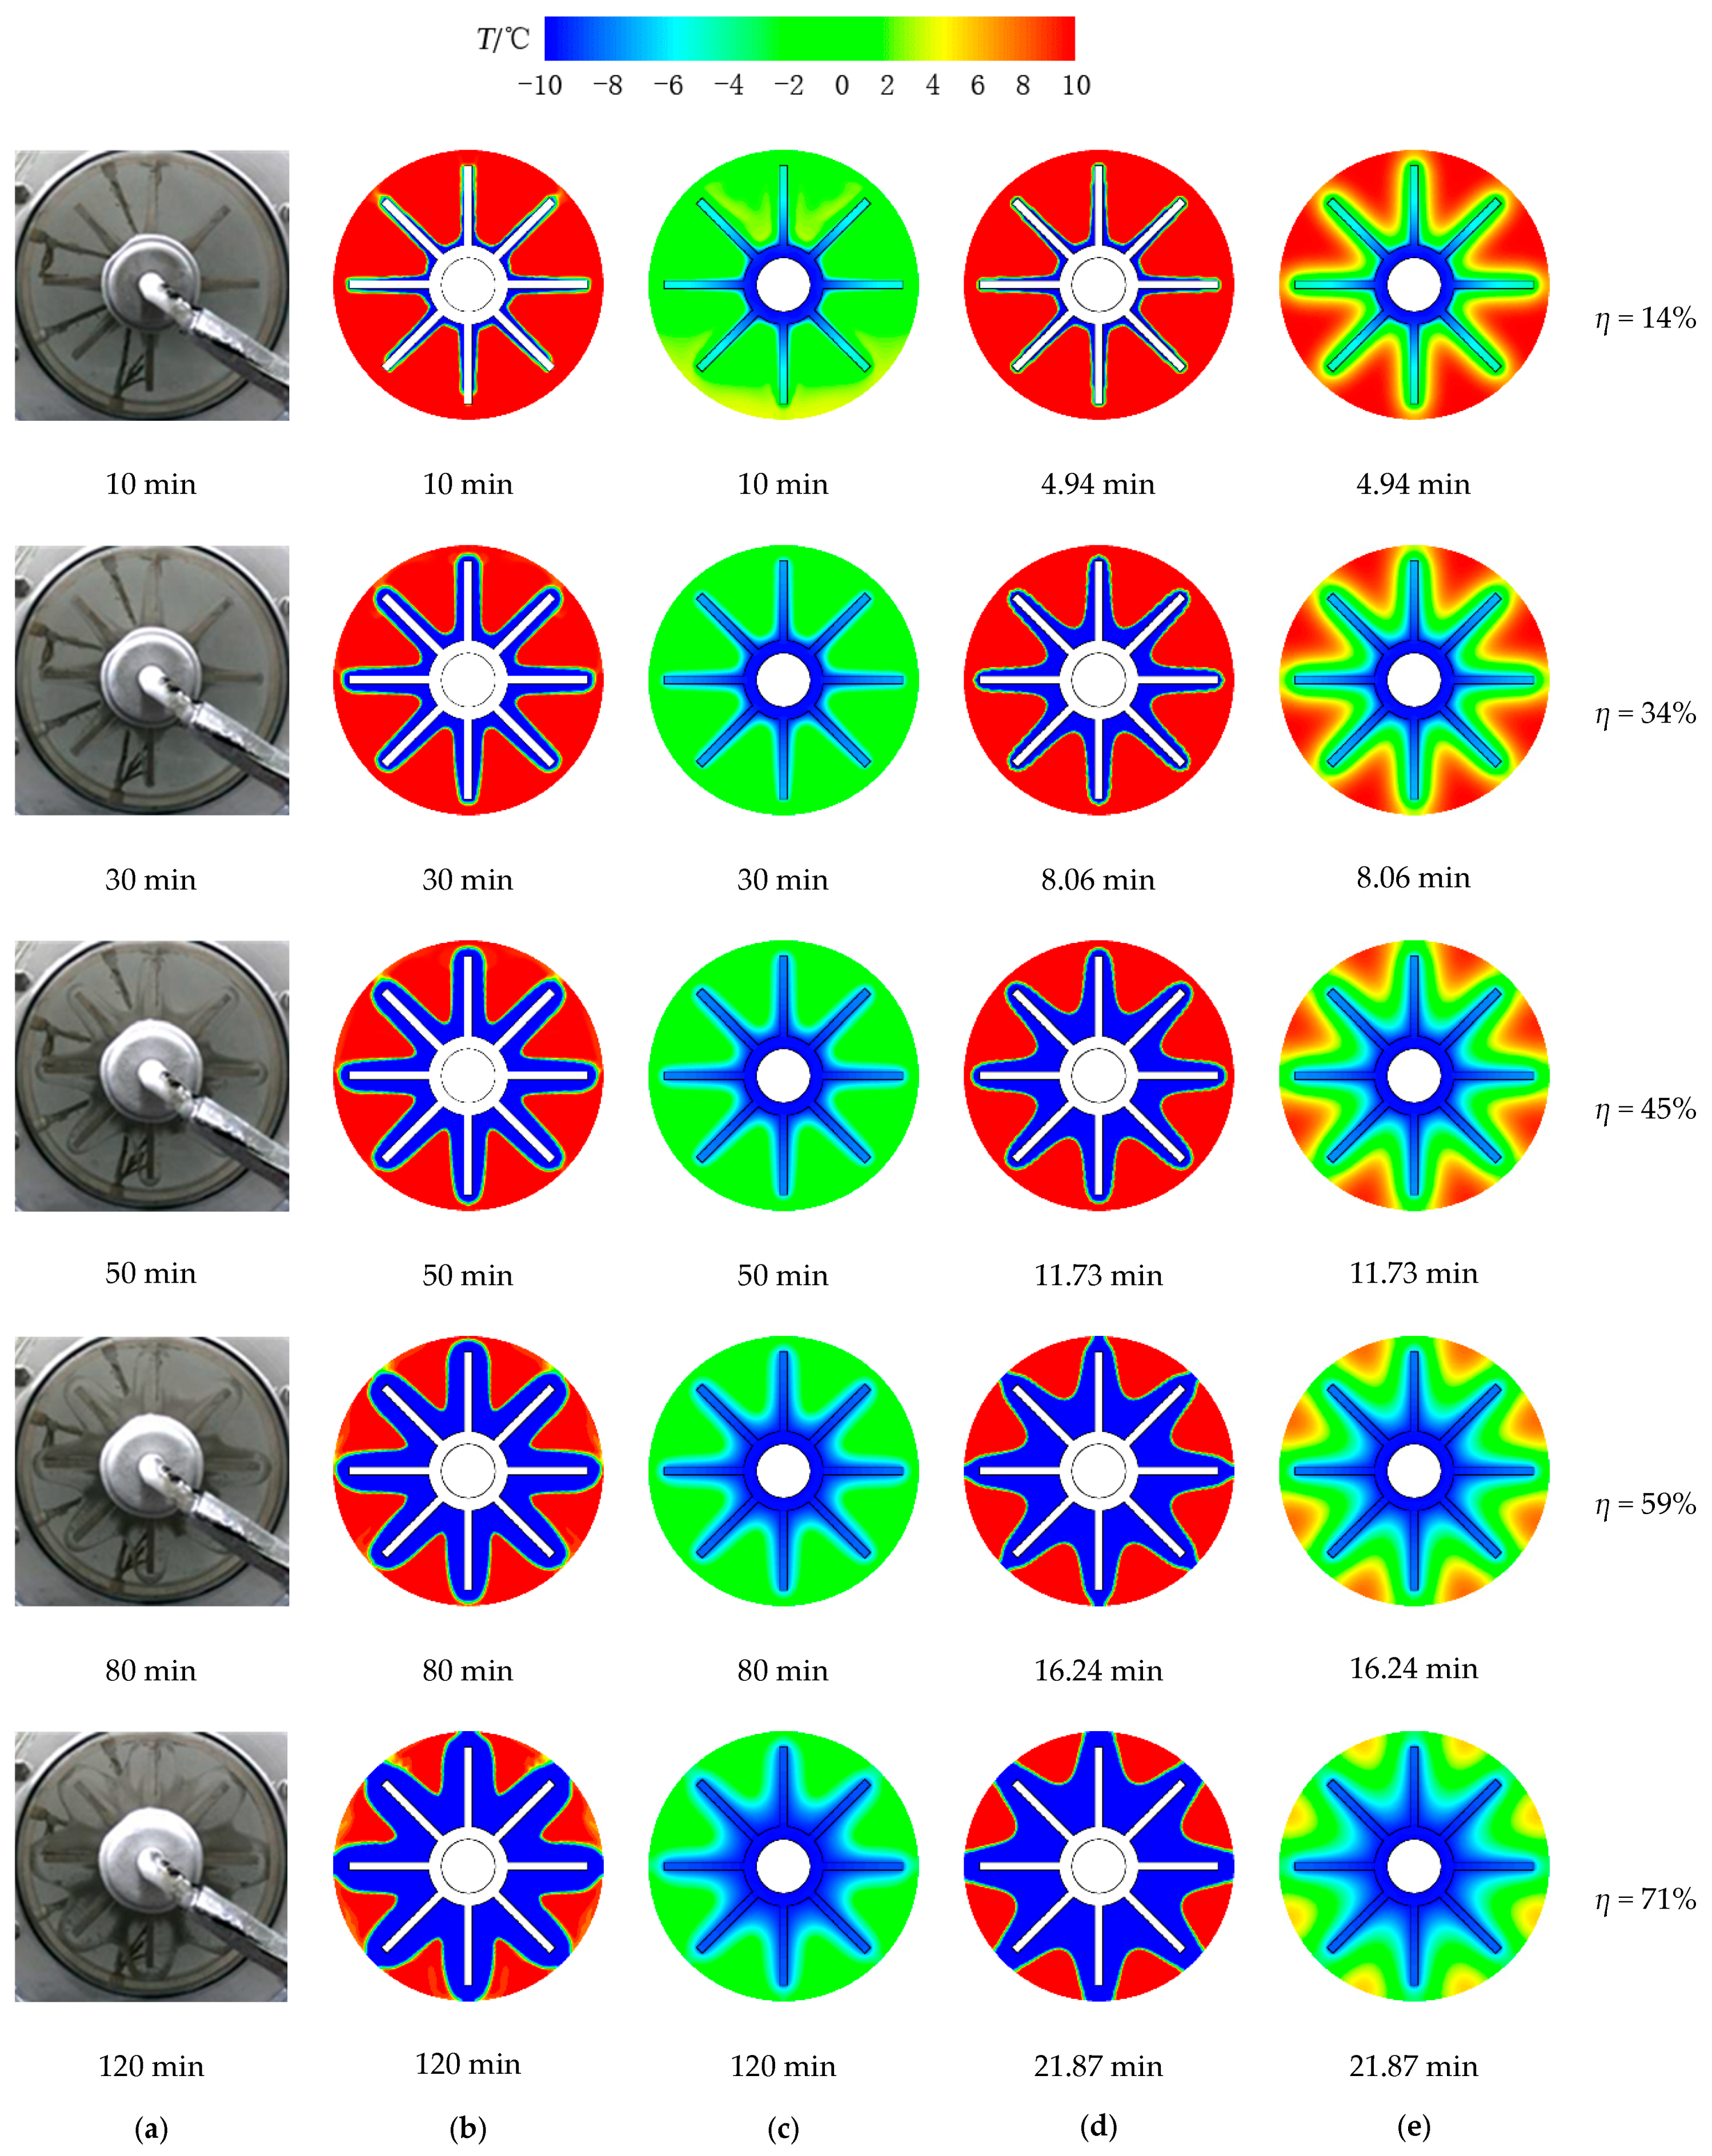
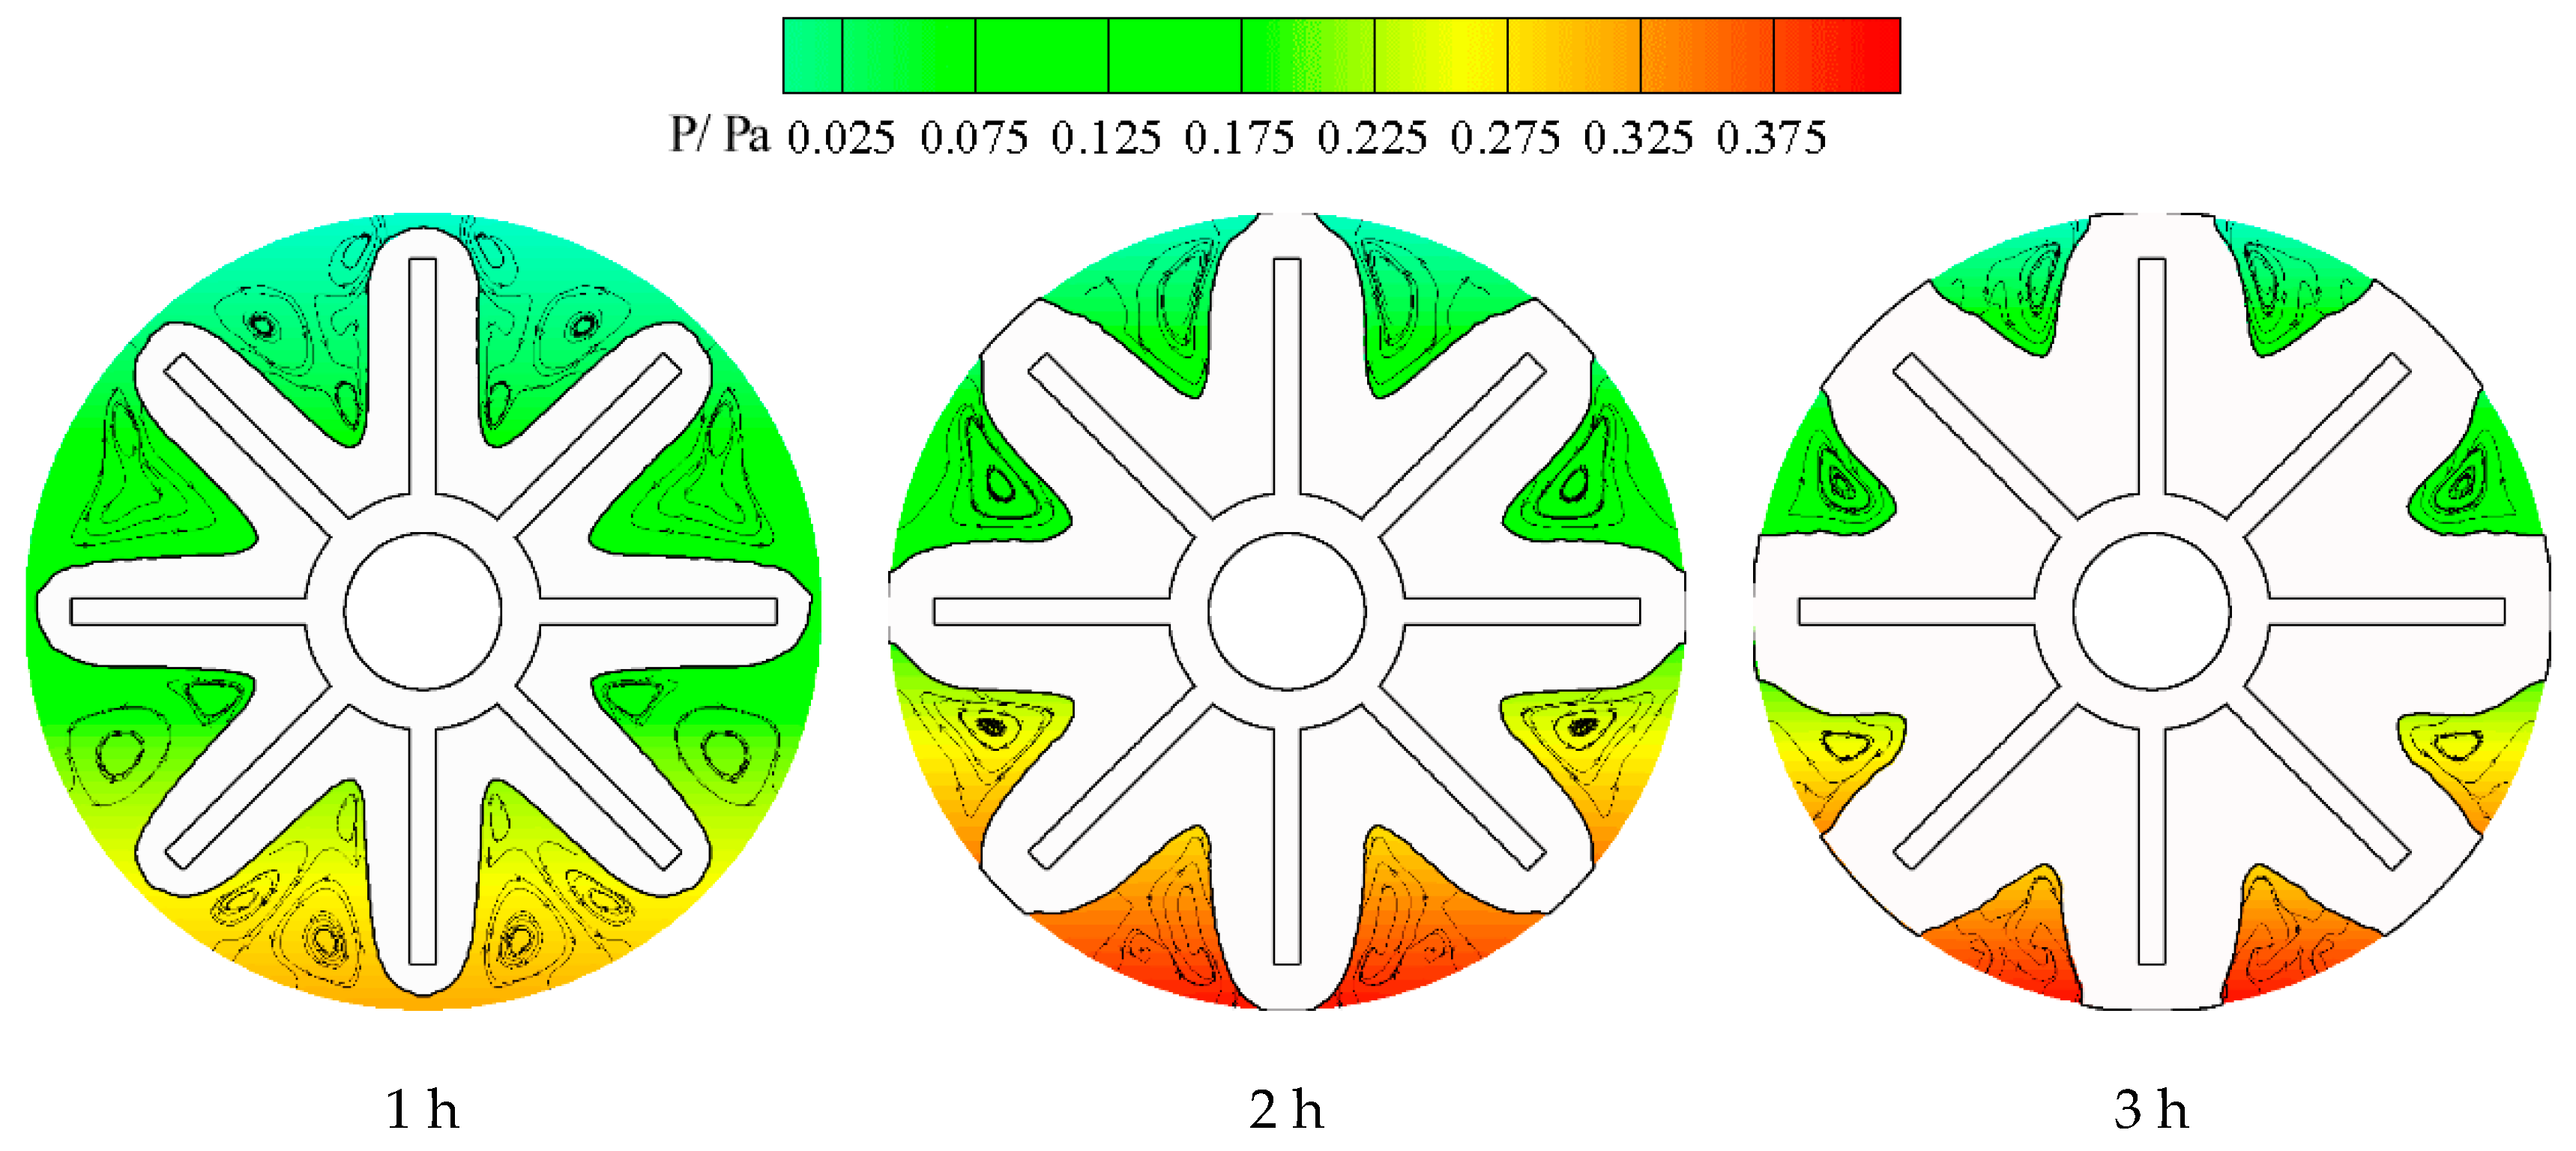
3.1. Solidification Process
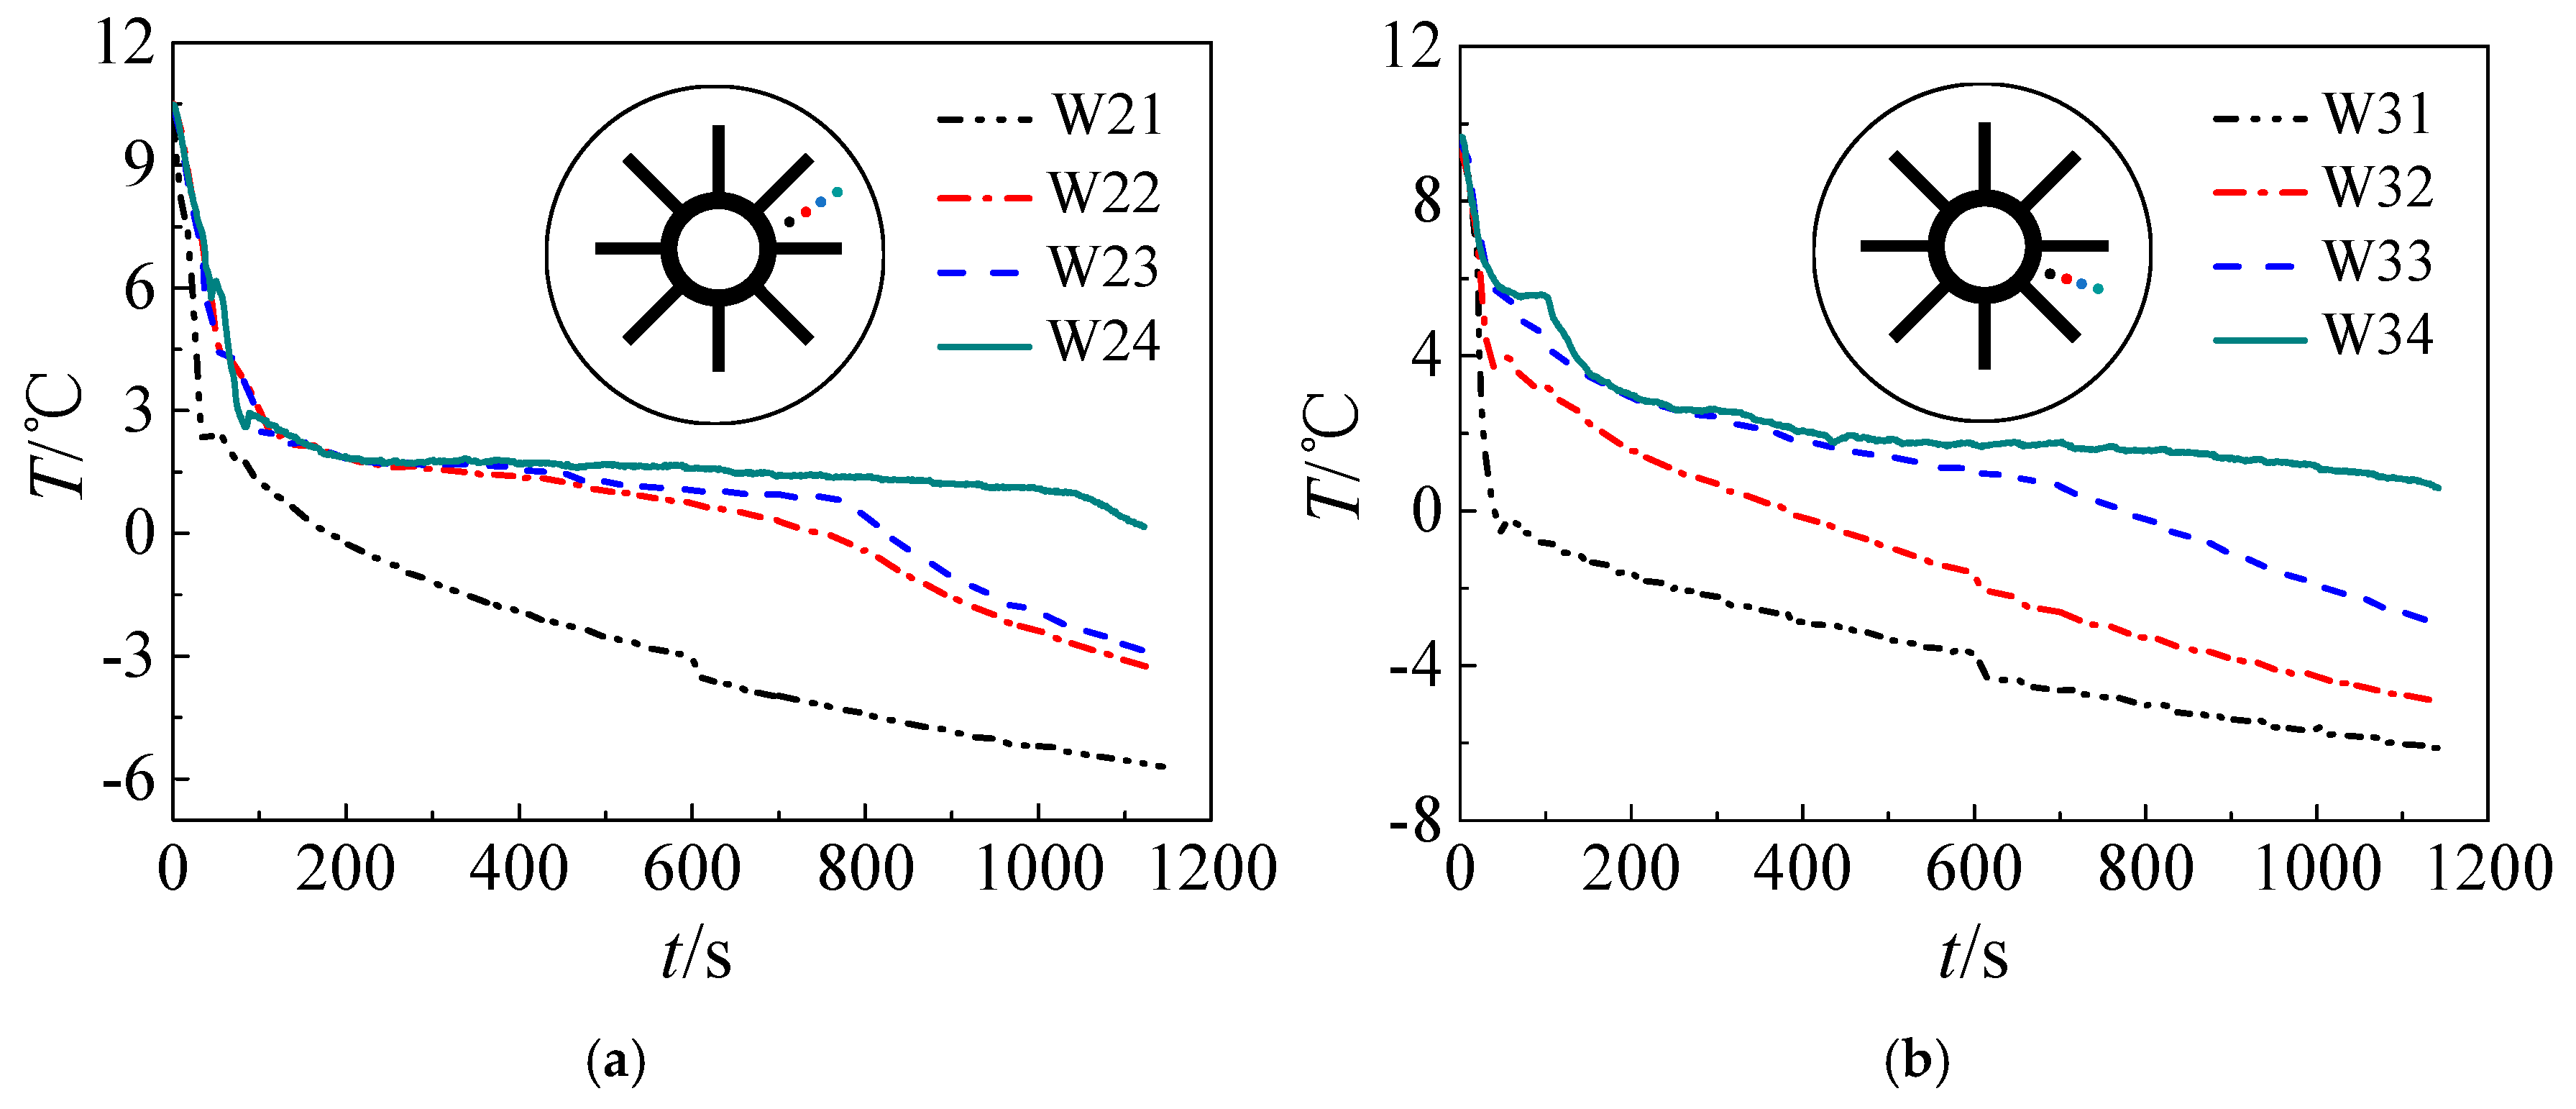
3.2. Effect of the Temperature of the Refrigerants
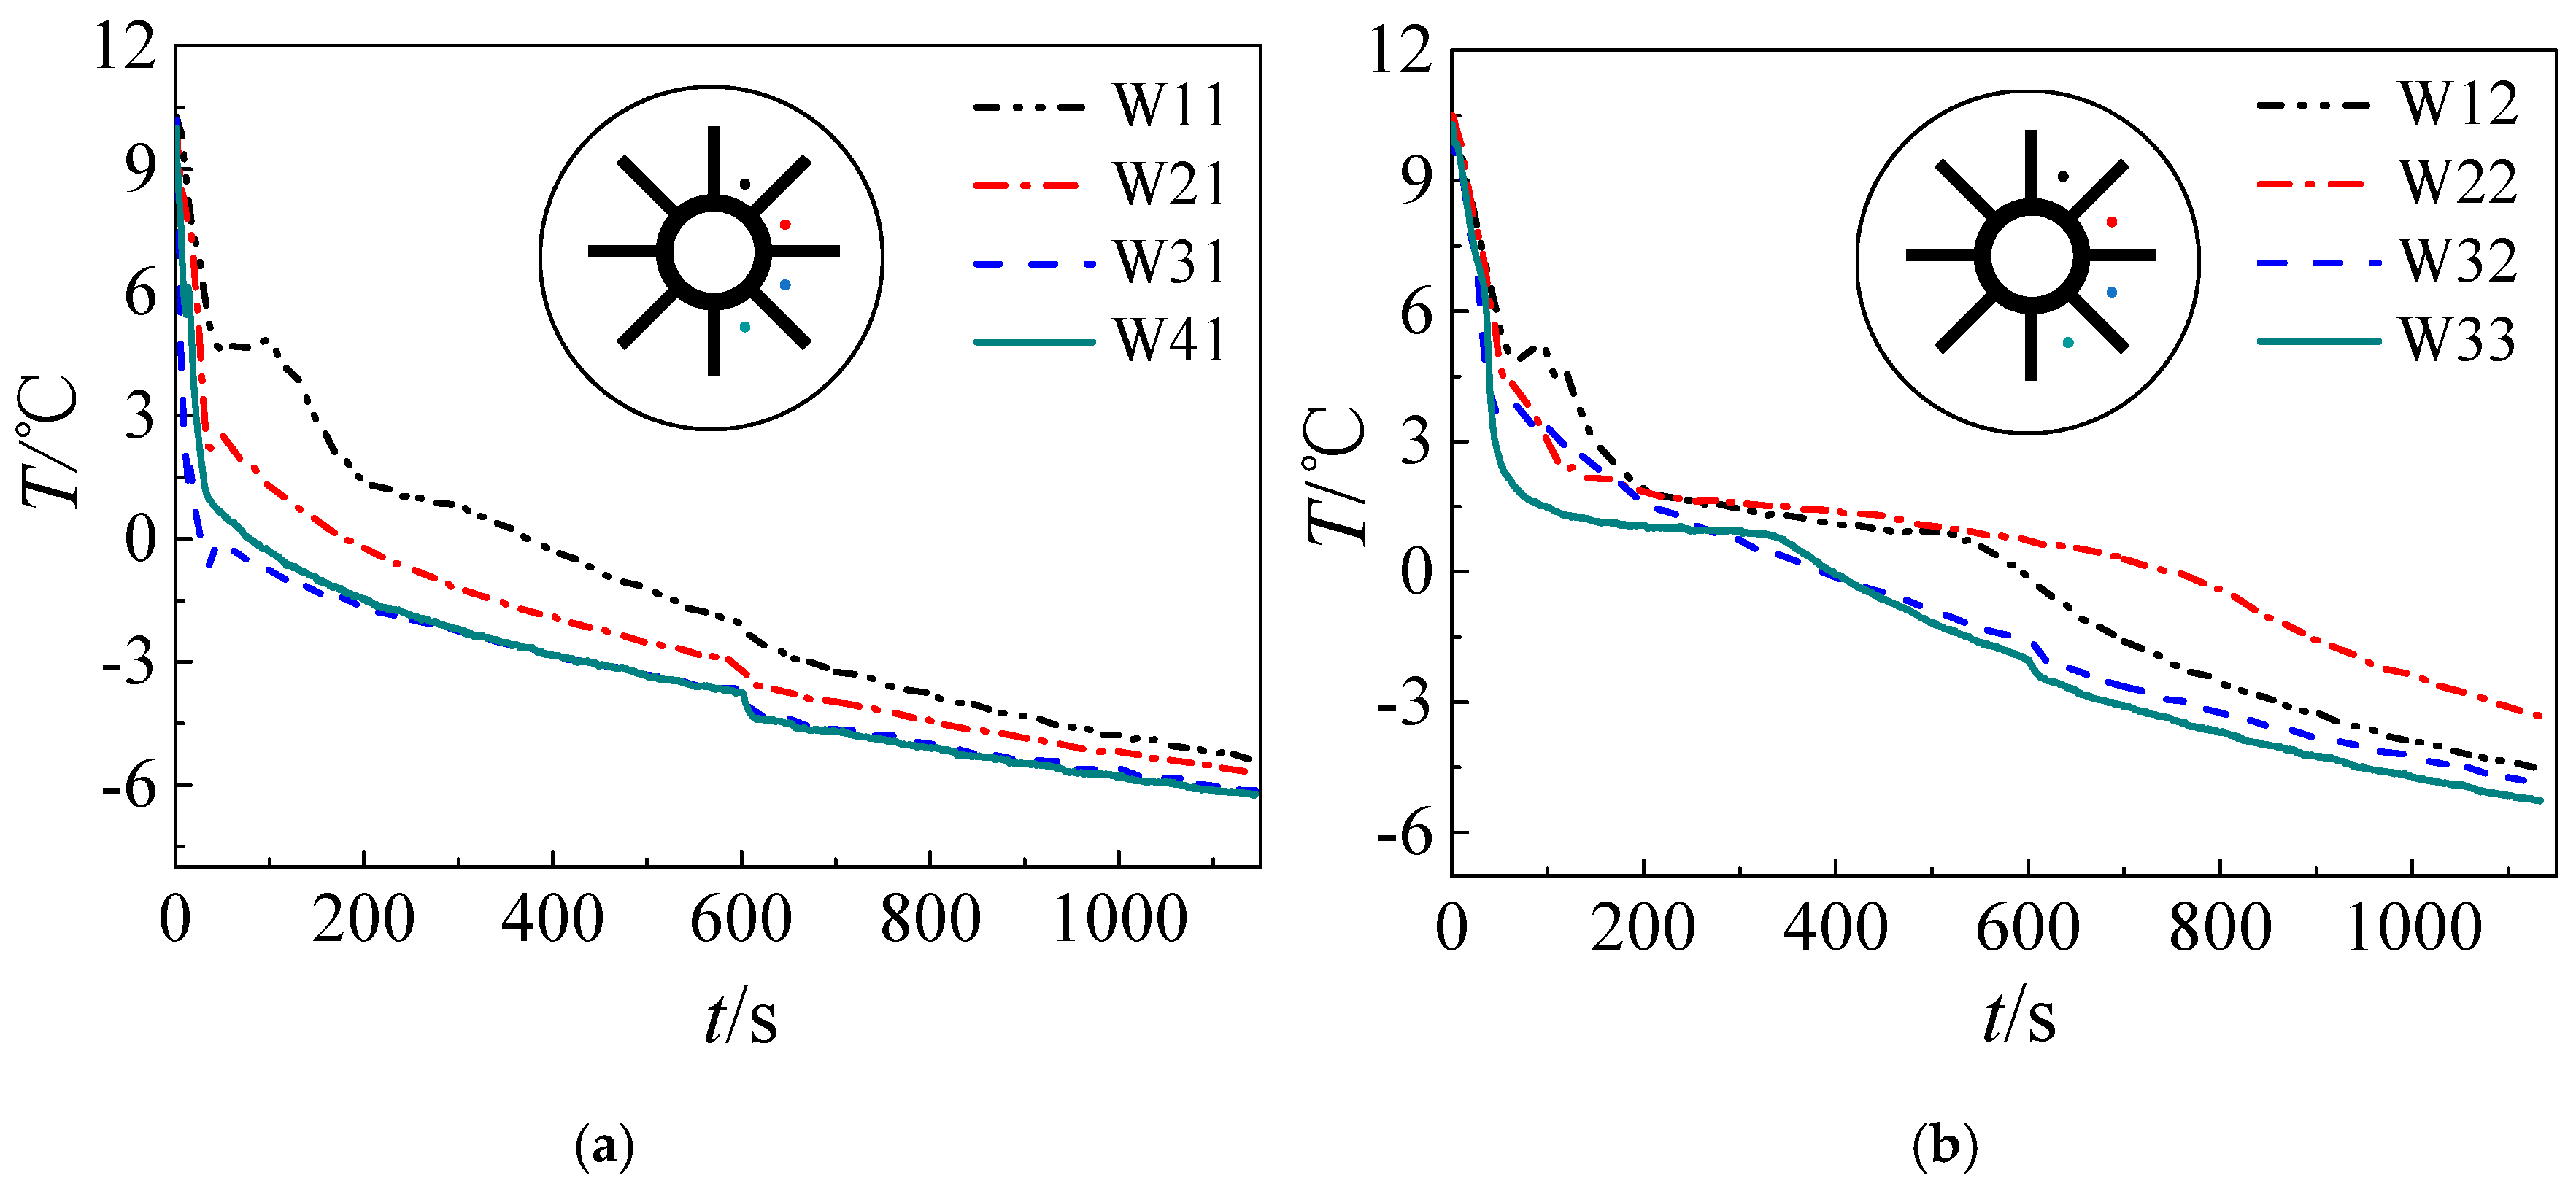
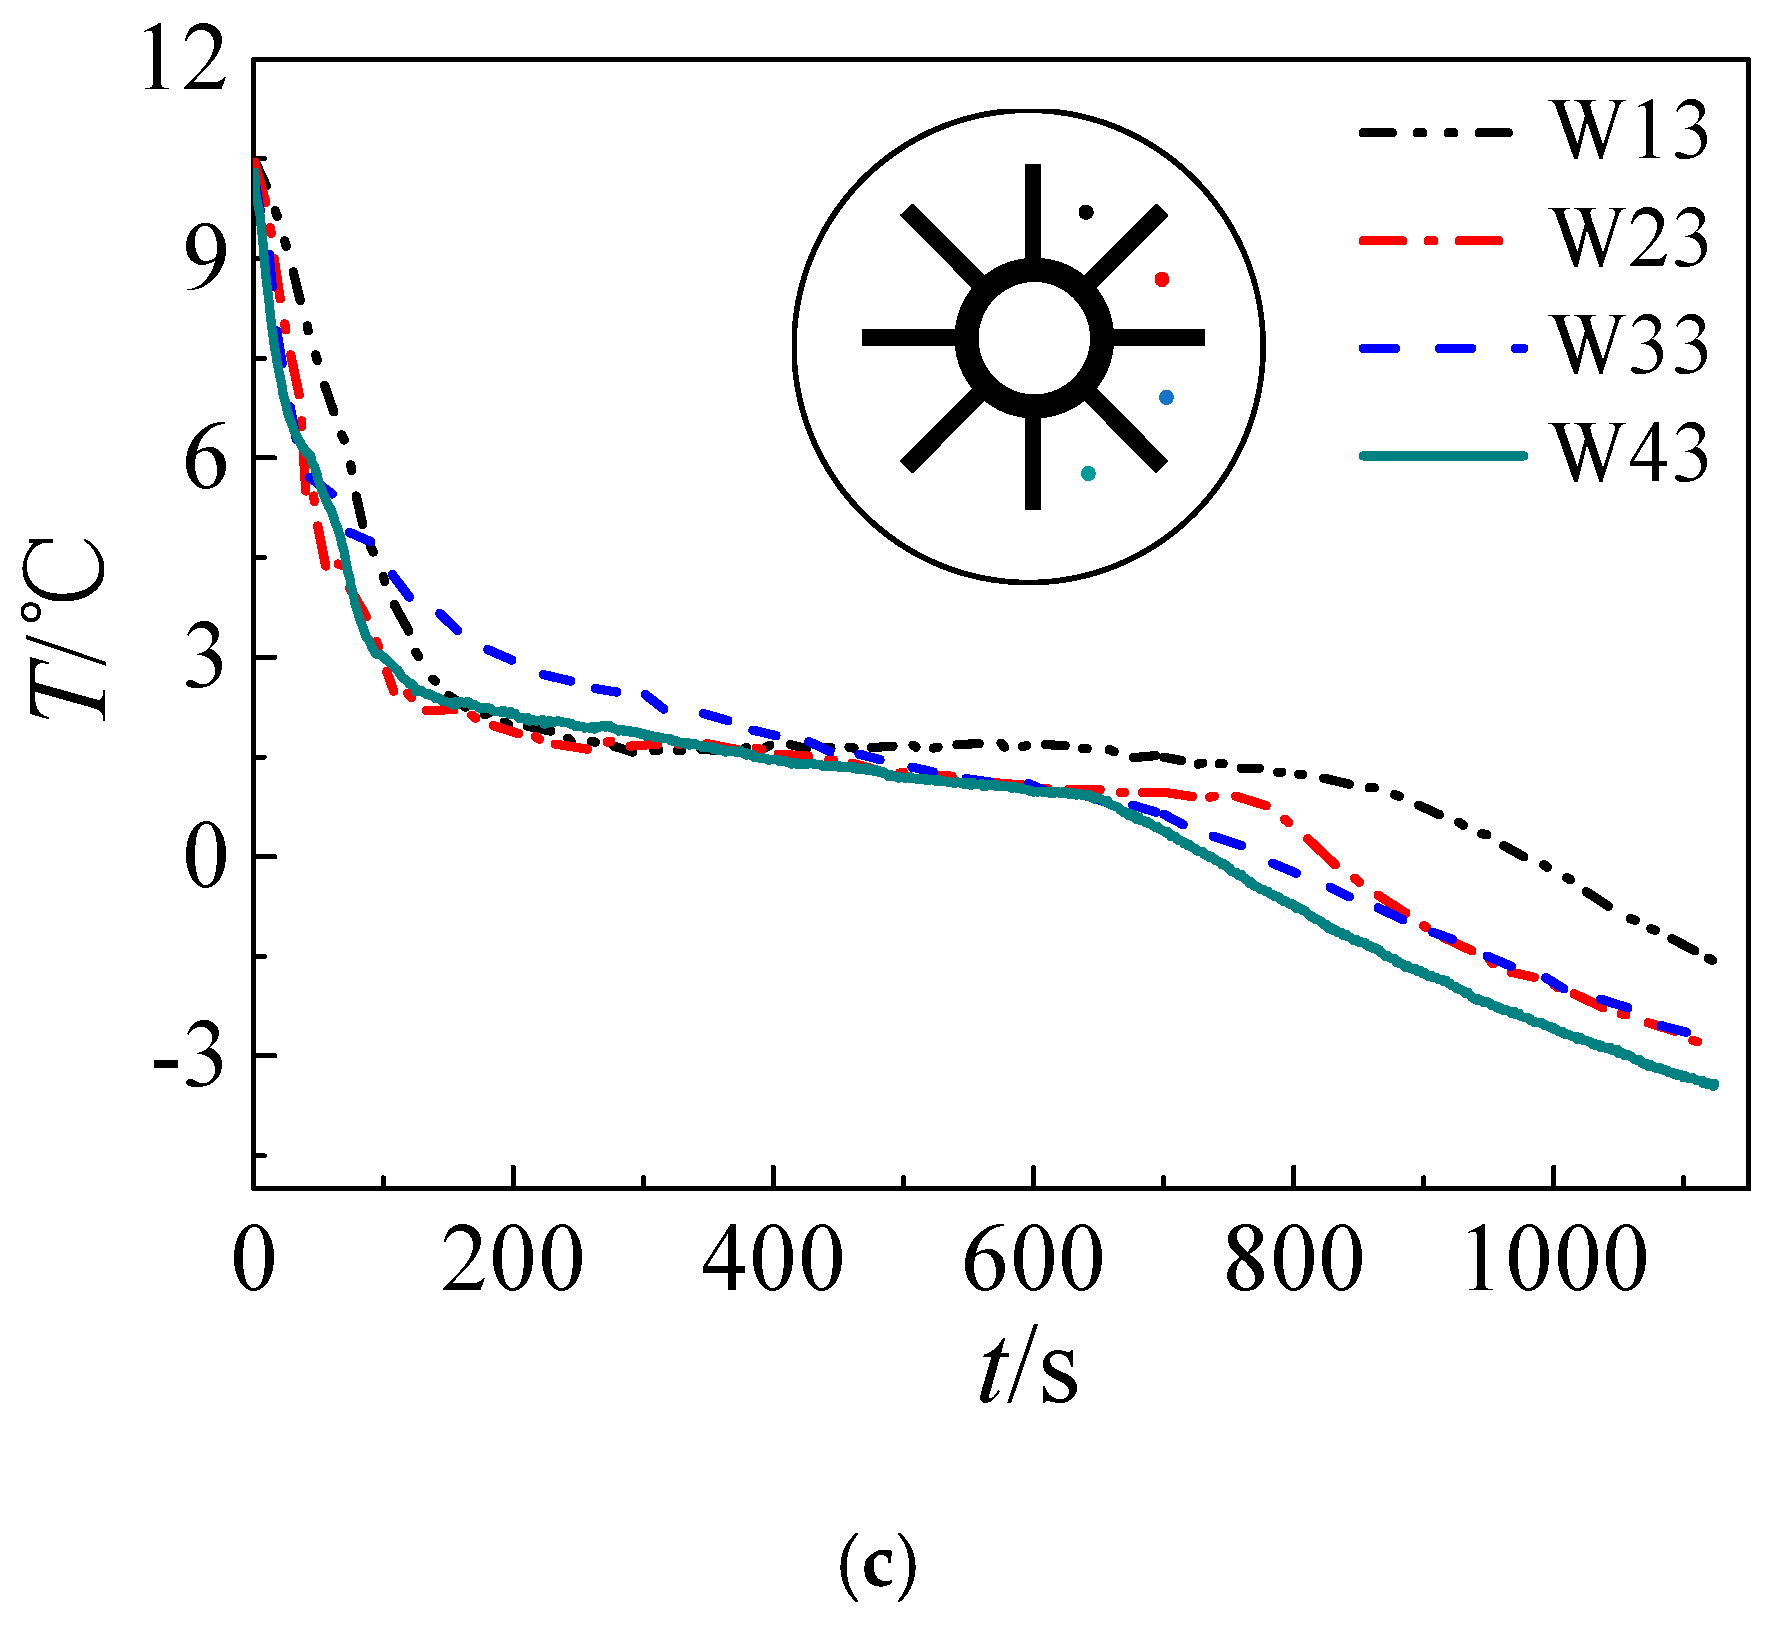
3.3. Effect of the Initial Temperature of the Water
4. Conclusions
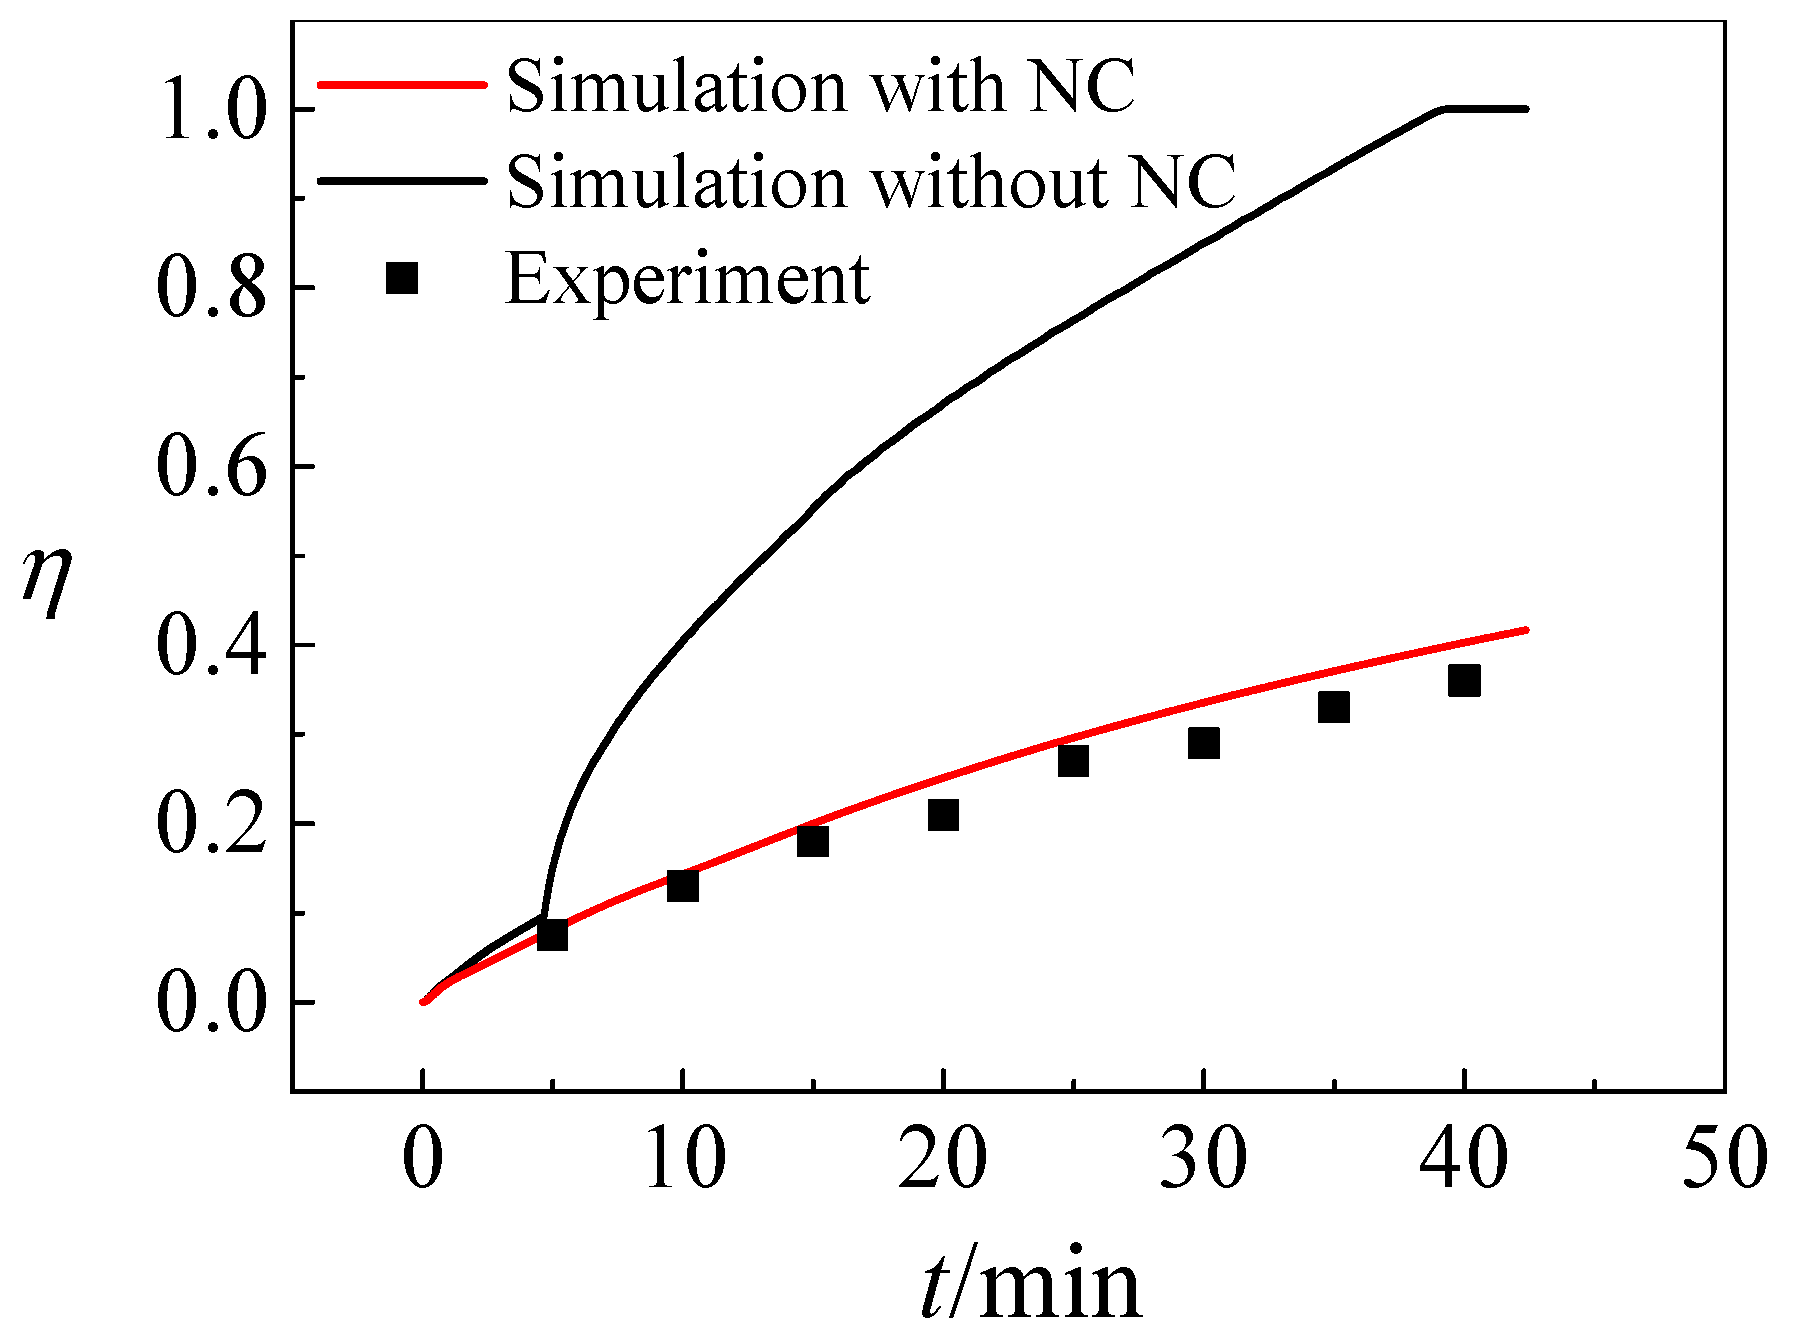
- Compared with solidification without natural convection, double the time or more is required to store the same amount of ice under the influence of natural convection. Decouple time is required for the device with natural convection to eventually solidify all the water.
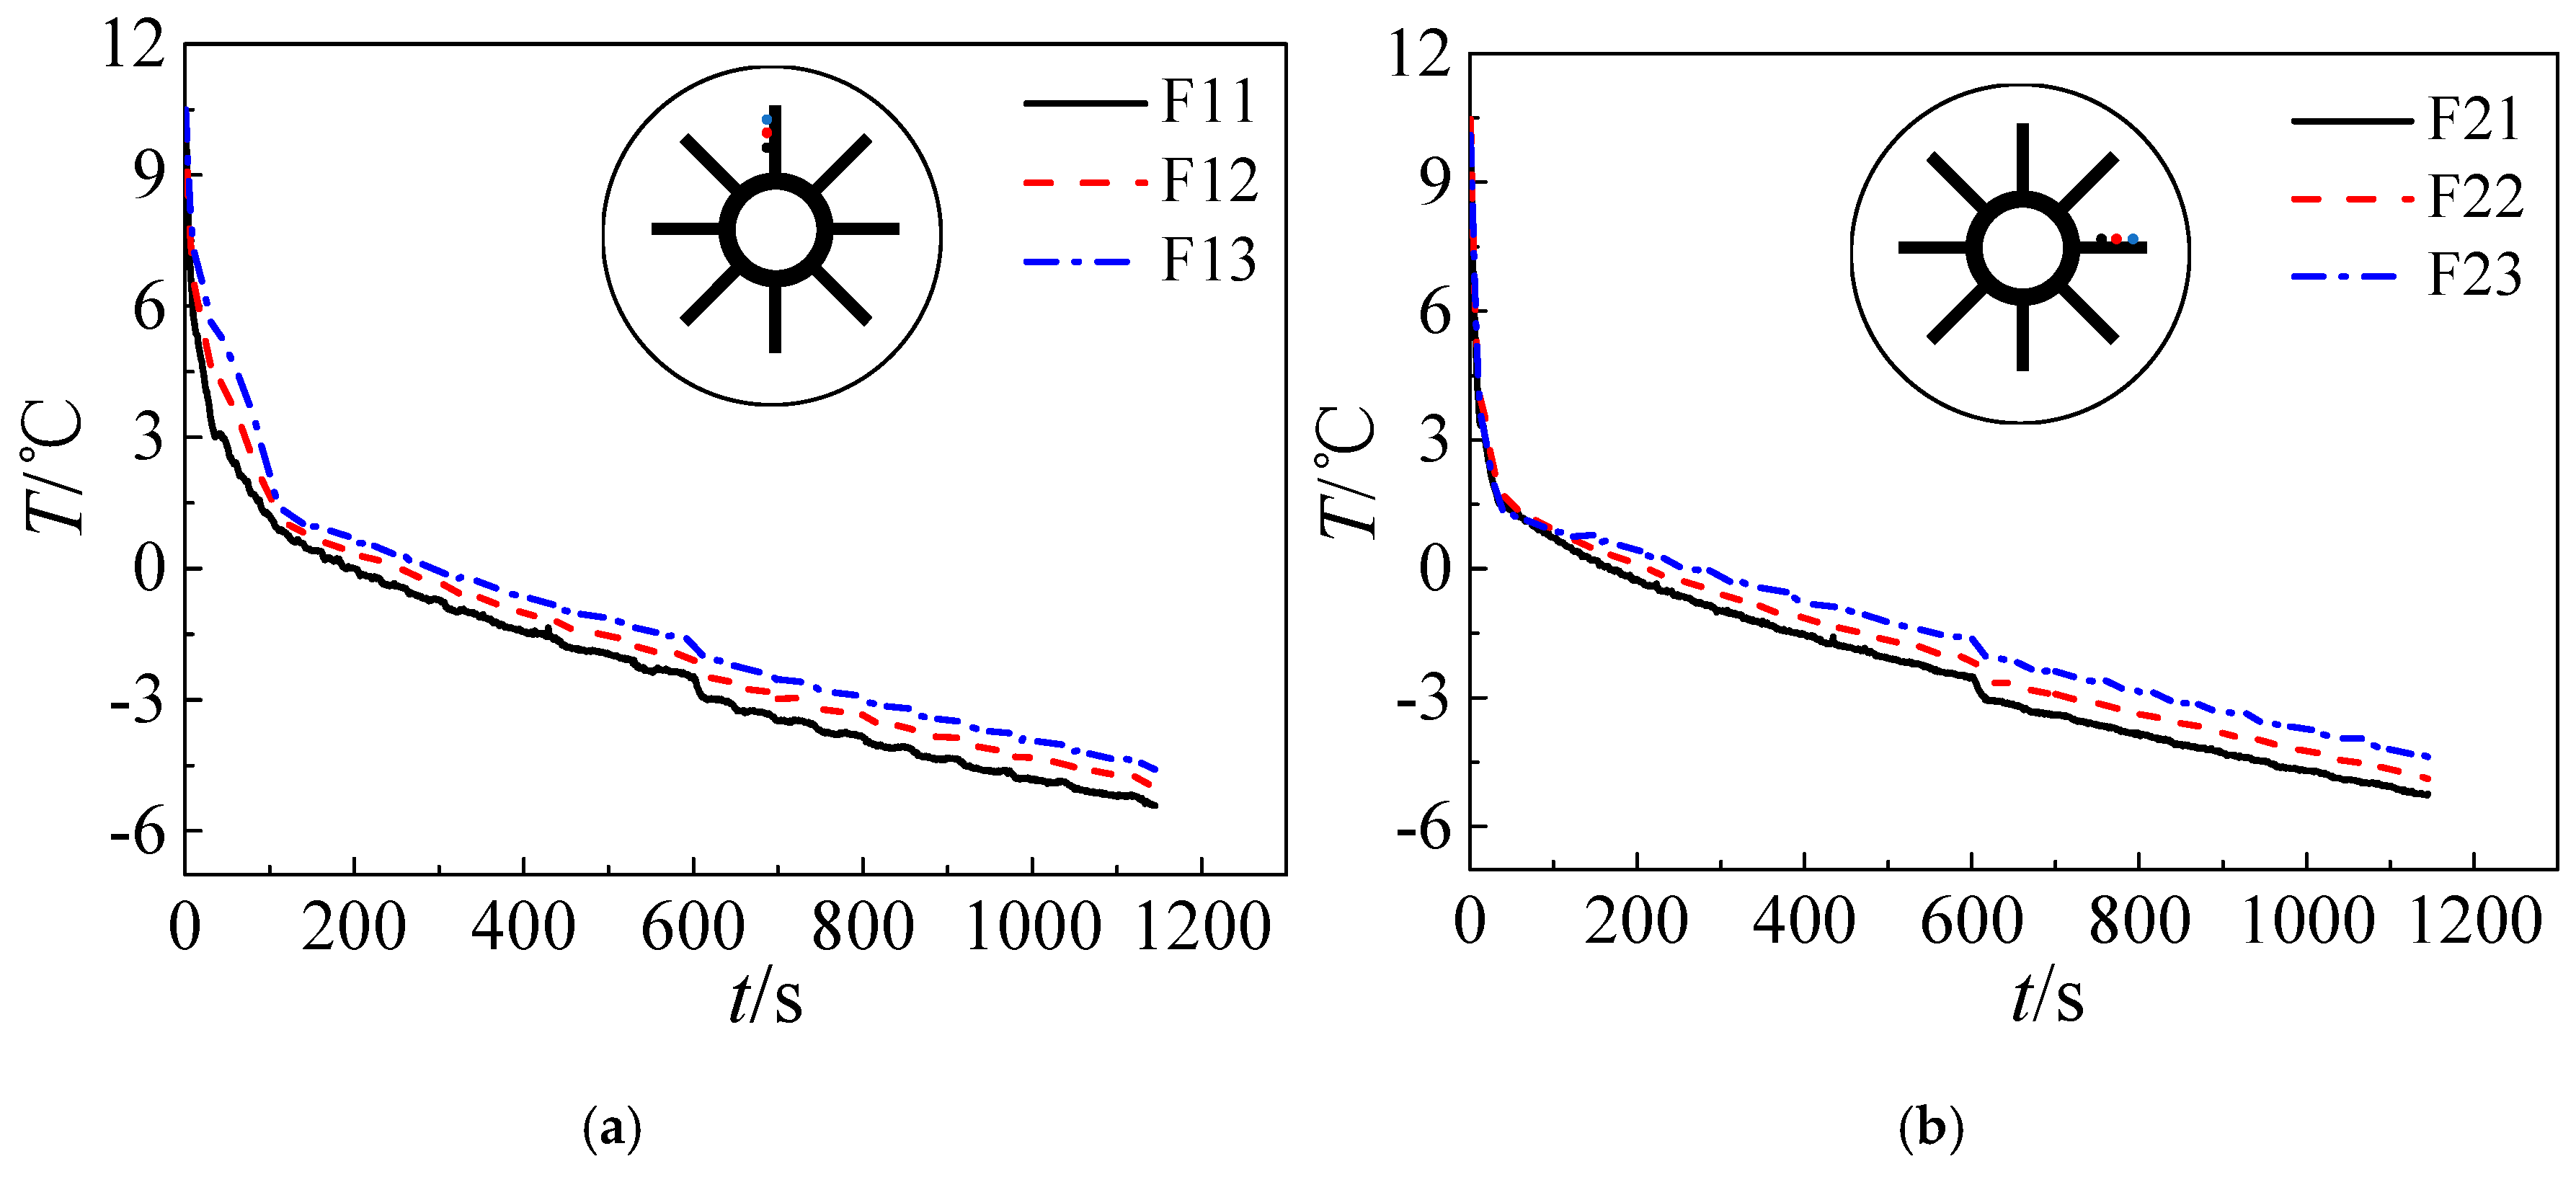
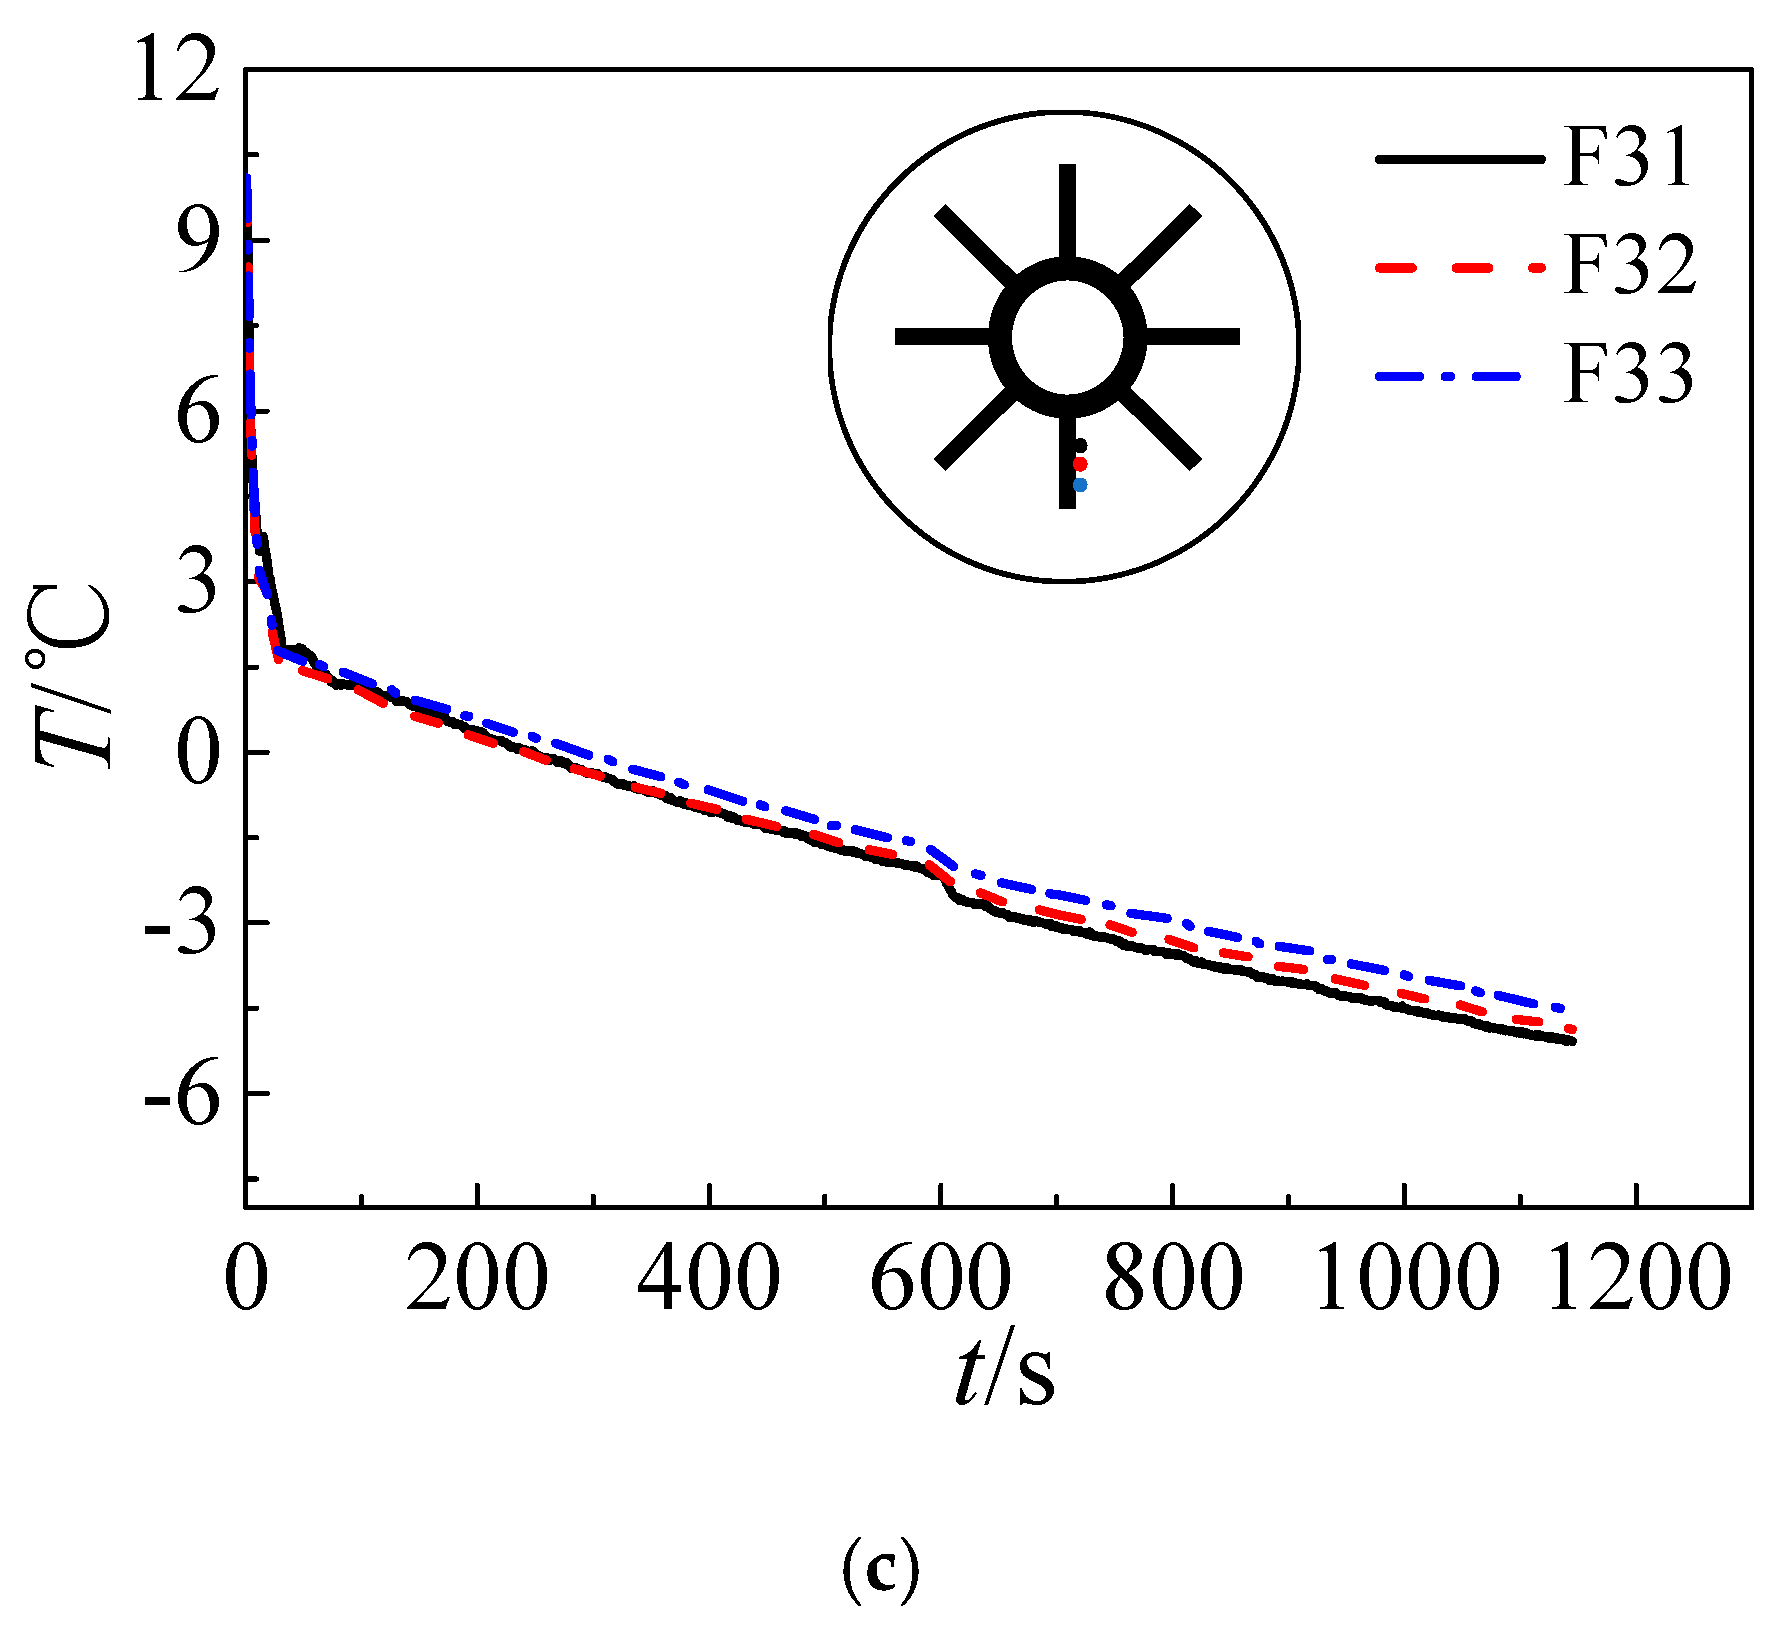
- Both numerical simulation and experimental results show that the freezing area is larger in the upper part of the tank and the temperature of the upper part is lower due to natural convection. Additionally, the liquid fraction and water area is large at the initial stage, during which natural convection is strong. Water with different temperature mixes that a large amount of cooling energy is consumed in cooling the water. The heat transfer temperature difference is reduced and less cooling energy can be occupied in solidification, indicating that natural convection is disadvantageous in ice storage systems.
- Variations of refrigerant temperature do not obviously affect the pre-solidification phase. However, the time required by solidification shortens with refrigerant temperature and more cooling energy can be stored in ice in the form of sensible heat in the post-solidification phase.
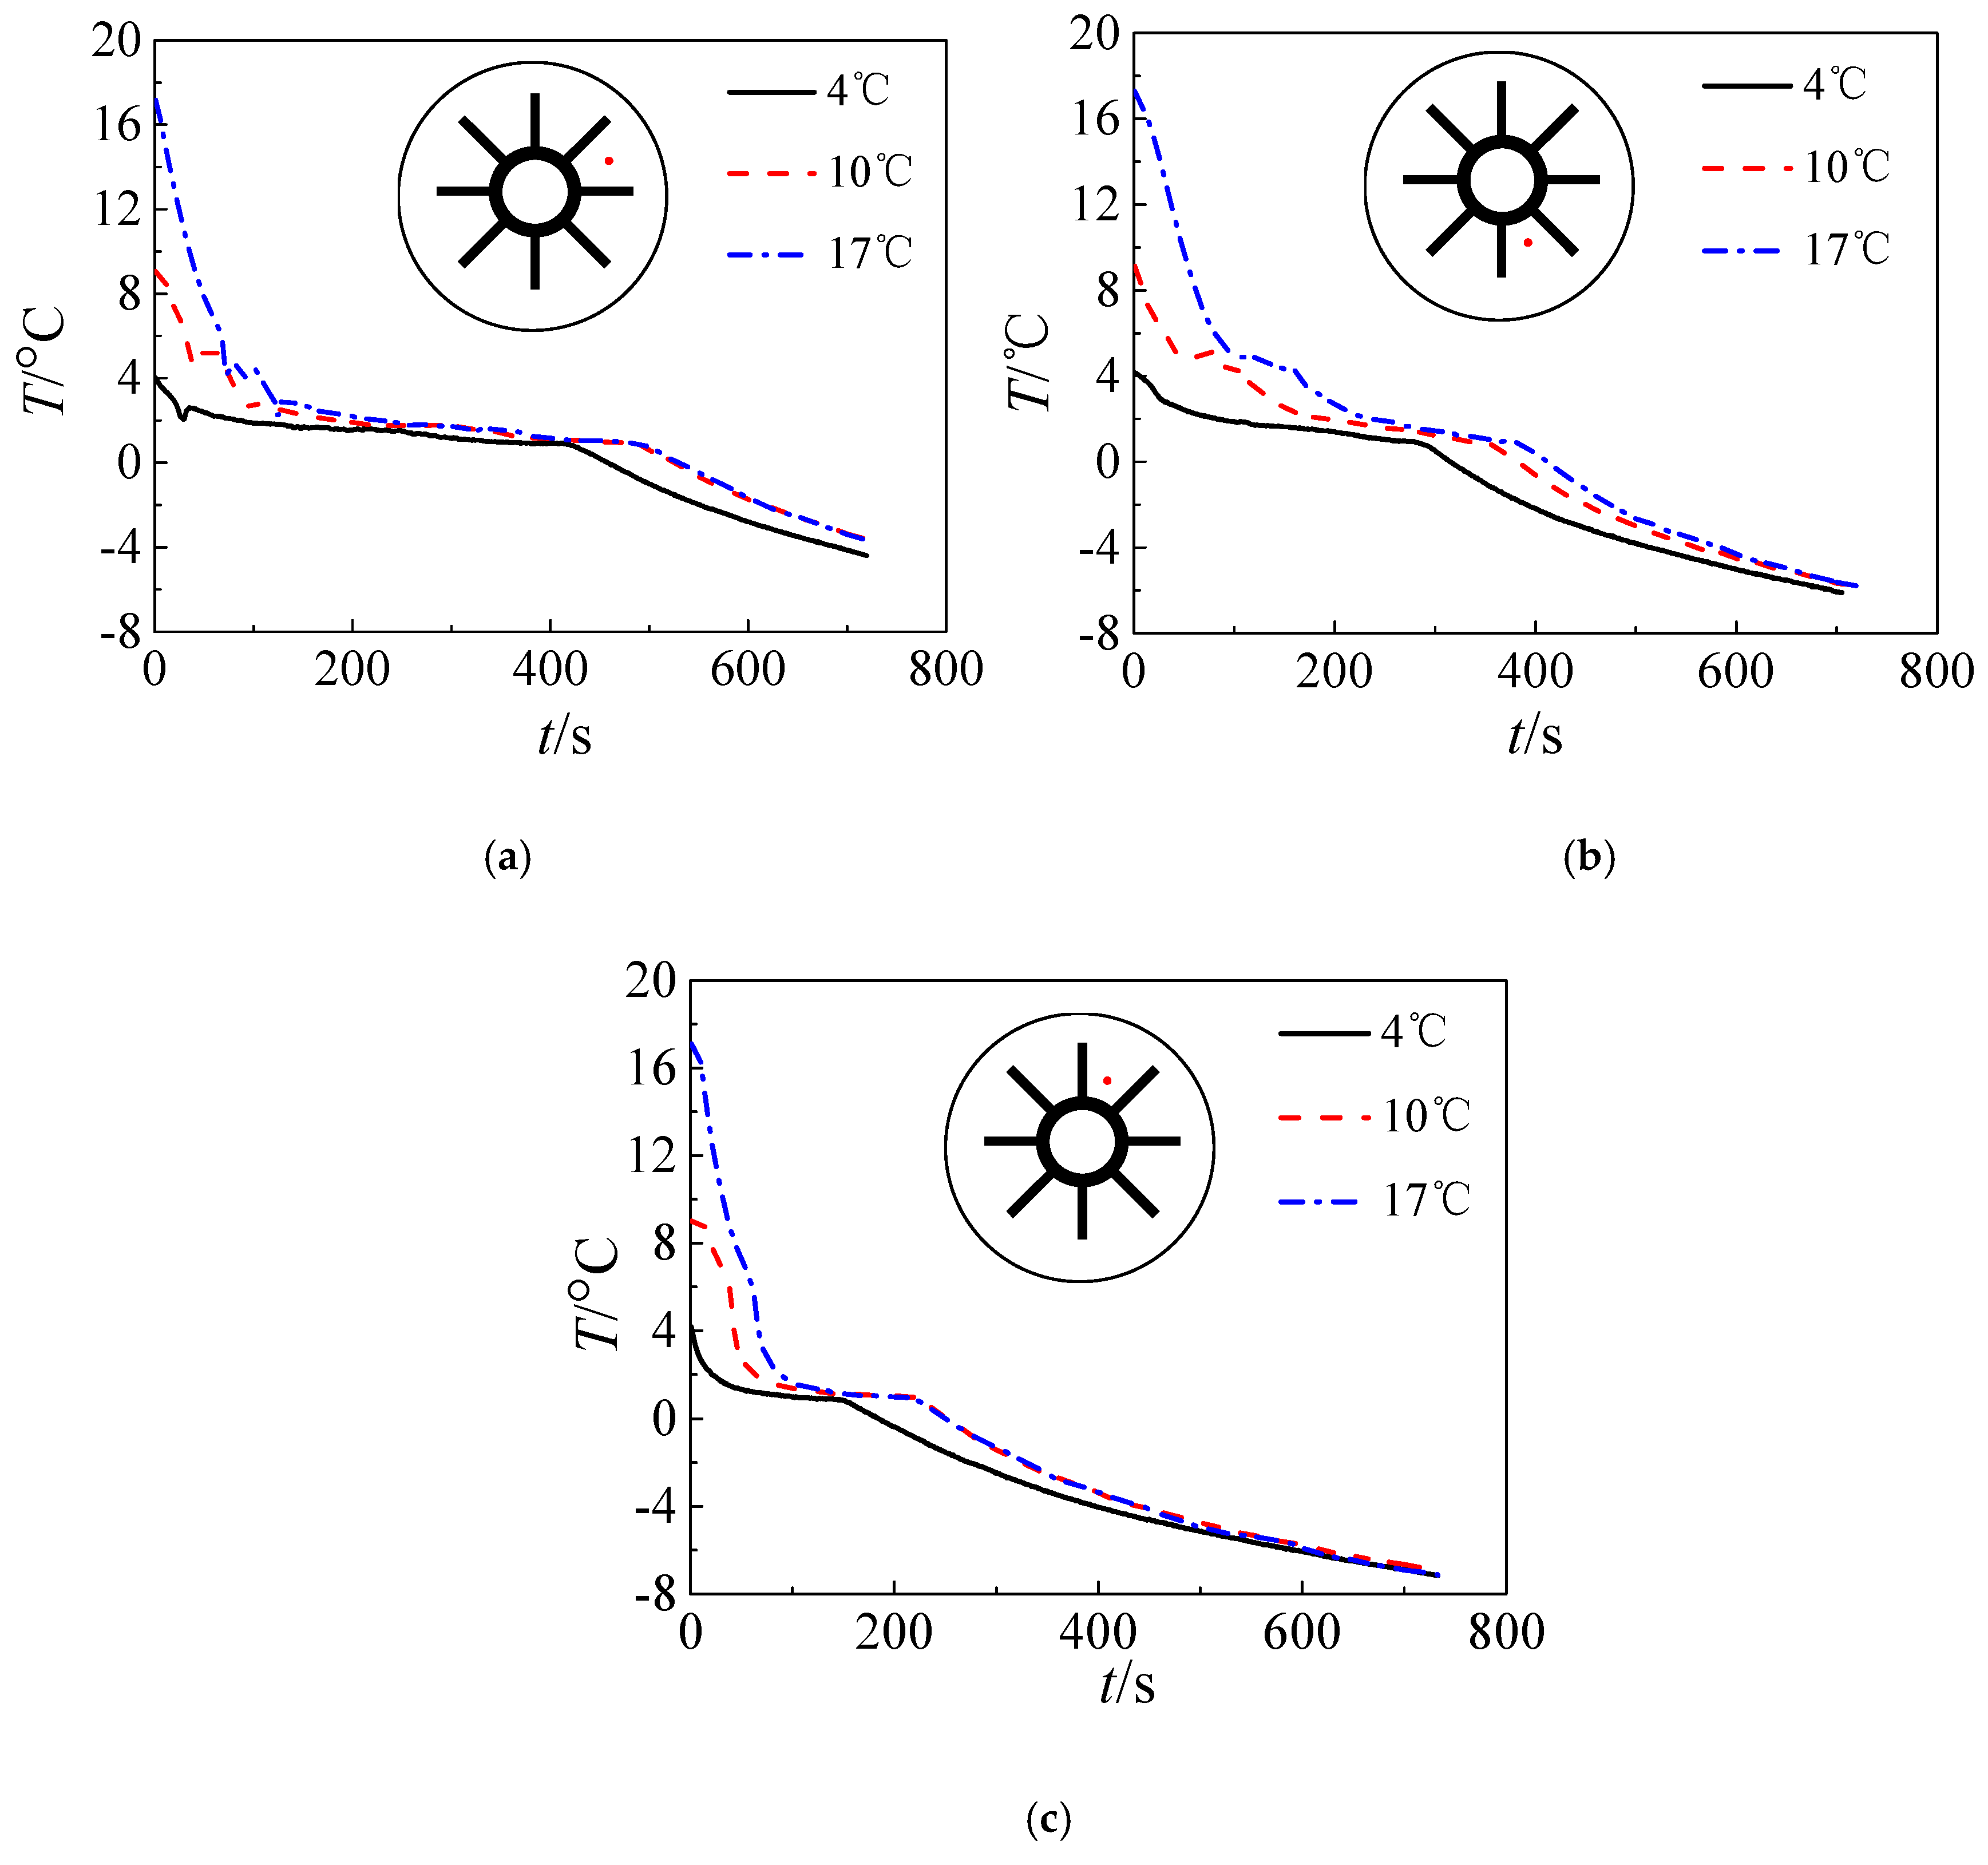
- The duration of the pre-solidification phase increases with increasing initial water temperature. However, the influence the initial water temperature on the temperature of the ice weakens with time.
Author Contributions
Funding
Conflicts of Interest
References
- Kandasamy, R.; Wang, X.-Q.; Mujumdar, A.S. Transient cooling of electronics using phase change material (pcm)-based heat sinks. Appl. Therm. Eng. 2008, 28, 1047–1057. [Google Scholar] [CrossRef]
- Zhang, C.; Yu, F.; Li, X.; Chen, Y. Gravity–capillary evaporation regimes in microgrooves. AIChE J. 2019, 65, 1119–1125. [Google Scholar] [CrossRef]
- Chen, Y.; Liu, X.; Shi, M. Hydrodynamics of double emulsion droplet in shear flow. Appl. Phys. Lett. 2013, 102, 051609. [Google Scholar] [CrossRef]
- Cui, Y.; Xie, J.; Liu, J.; Pan, S. Review of phase change materials integrated in building walls for energy saving. Procedia Eng. 2015, 121, 763–770. [Google Scholar] [CrossRef]
- Chen, Y.P.; Gao, W.; Zhang, C.B.; Zhao, Y.J. Three-dimensional splitting microfluidics. Lab Chip 2016, 16, 1332–1339. [Google Scholar] [CrossRef]
- Fixler, S.Z. Satellite thermal control using phase-change materials. J. Spacecr. Rockets 1966, 3, 1362–1368. [Google Scholar] [CrossRef]
- Liu, X.; Chen, Y.; Shi, M. Dynamic performance analysis on start-up of closed-loop pulsating heat pipes (clphps). Int. J. Therm. Sci. 2013, 65, 224–233. [Google Scholar] [CrossRef]
- Mao, Q.; Chen, H.; Yang, Y. Energy storage performance of a pcm in the solar storage tank. J. Therm. Sci. 2019, 28, 195–203. [Google Scholar] [CrossRef]
- Zhang, C.; Shen, C.; Chen, Y. Experimental study on flow condensation of mixture in a hydrophobic microchannel. Int. J. Heat Mass Transf. 2017, 104, 1135–1144. [Google Scholar] [CrossRef]
- Zhang, C.; Chen, Y.; Wu, R.; Shi, M. Flow boiling in constructal tree-shaped minichannel network. Int. J. Heat Mass Transf. 2011, 54, 202–209. [Google Scholar] [CrossRef]
- Lo, C.-C.; Tsai, S.-H.; Lin, B.-S. Ice storage air-conditioning system simulation with dynamic electricity pricing: A demand response study. Energies 2016, 9, 113. [Google Scholar] [CrossRef]
- Galindo-Luna, Y.R.; Gómez-Arias, E.; Romero, R.J.; Venegas-Reyes, E.; Montiel-González, M.; Unland-Weiss, H.E.K.; Pacheco-Hernández, P.; González-Fernández, A.; Díaz-Salgado, J. Hybrid solar-geothermal energy absorption air-conditioning system operating with naoh-h2o—las tres vírgenes (baja california sur), “la reforma” case. Energies 2018, 11, 1268. [Google Scholar] [CrossRef]
- Deng, Z.; Liu, X.; Zhang, C.; Huang, Y.; Chen, Y. Melting behaviors of pcm in porous metal foam characterized by fractal geometry. Int. J. Heat Mass Transf. 2017, 113, 1031–1042. [Google Scholar] [CrossRef]
- Wang, J.; Sun, L.; Zou, M.; Gao, W.; Liu, C.; Shang, L.; Gu, Z.; Zhao, Y. Bioinspired shape-memory graphene film with tunable wettability. Sci. Adv. 2017, 3, e1700004. [Google Scholar] [CrossRef]
- Zhang, D.H.; Shen, Y.L.; Zhou, Z.P.; Qu, J.; Xu, H.Y.; Cao, W.; Song, D.; Zhang, F.M. Convection heat transfer performance of the fractal tube bank under cross flow. Fractals 2018, 26, 1850073. [Google Scholar] [CrossRef]
- Xiao, B.Q.; Wang, W.; Fan, J.T.; Chen, H.X.; Hu, X.L.; Zhao, D.S.; Zhang, X.; Ren, W. Optimization of the fractal-like architecture of porous fibrous materials related to permeability, diffusivity and thermal conductivity. Fractals 2017, 25, 9. [Google Scholar] [CrossRef]
- Yang, J.; Yang, L.; Xu, C.; Du, X. Experimental study on enhancement of thermal energy storage with phase-change material. Appl. Energy 2016, 169, 164–176. [Google Scholar] [CrossRef]
- Wang, J.; Gao, W.; Zhang, H.; Zou, M.H.; Chen, Y.P.; Zhao, Y.J. Programmable wettability on photocontrolled graphene film. Sci. Adv. 2018, 4, eaat7392. [Google Scholar] [CrossRef] [PubMed]
- Cheng, K.C.; Inaba, H.; Gilpin, R.R. Effects of natural convection on ice formation around an isothermally cooled horizontal cylinder. J. Heat Transf. 1988, 110, 931–937. [Google Scholar] [CrossRef]
- Habeebullah, B.A. An experimental study on ice formation around horizontal long tubes. Int. J. Refrig. 2007, 30, 789–797. [Google Scholar] [CrossRef]
- Jannesari, H.; Abdollahi, N. Experimental and numerical study of thin ring and annular fin effects on improving the ice formation in ice-on-coil thermal storage systems. Appl. Energy 2017, 189, 369–384. [Google Scholar] [CrossRef]
- Ismail, K.A.R.; Lino, F.A.M. Fins and turbulence promoters for heat transfer enhancement in latent heat storage systems. Exp. Therm. Fluid Sci. 2011, 35, 1010–1018. [Google Scholar] [CrossRef]
- Rozenfeld, A.; Kozak, Y.; Rozenfeld, T.; Ziskind, G. Experimental demonstration, modeling and analysis of a novel latent-heat thermal energy storage unit with a helical fin. Int. J. Heat Mass Transf. 2017, 110, 692–709. [Google Scholar] [CrossRef]
- Kumar, V.; Srivastava, A.; Karagadde, S. Real-time observations of density anomaly driven convection and front instability during solidification of water. J. Heat Trans. 2018, 140, 042503. [Google Scholar] [CrossRef]
- Agyenim, F.; Eames, P.; Smyth, M. A comparison of heat transfer enhancement in a medium temperature thermal energy storage heat exchanger using fins. Sol. Energy 2009, 83, 1509–1520. [Google Scholar] [CrossRef]
- Ismail, K.A.; Henriquez, J.; Da Silva, T. A parametric study on ice formation inside a spherical capsule. Int. J. Therm. Sci. 2003, 42, 881–887. [Google Scholar] [CrossRef]
- Drees, K.H.; Braun, J.E. Modeling of area-constrained ice storage tanks. Hvac R Res. 1995, 1, 143–158. [Google Scholar]
- Kousksou, T.; Arid, A.; Majid, J.; Zeraouli, Y. Numerical modeling of double-diffusive convection in ice slurry storage tank. Int. J. Refrig. 2010, 33, 1550–1558. [Google Scholar] [CrossRef]
- Jia, X.; Zhai, X.; Cheng, X. Thermal performance analysis and optimization of a spherical pcm capsule with pin-fins for cold storage. Appl. Therm. Eng. 2019, 148, 929–938. [Google Scholar] [CrossRef]
- Ezan, M.A.; Kalfa, M. Numerical investigation of transient natural convection heat transfer of freezing water in a square cavity. Int. J. Heat Fluid Flow 2016, 61, 438–448. [Google Scholar] [CrossRef]
- Sciacovelli, A.; Gagliardi, F.; Verda, V. Maximization of performance of a pcm latent heat storage system with innovative fins. Appl. Energy 2015, 137, 707–715. [Google Scholar] [CrossRef]
- Voller, V.R.; Prakash, C. A fixed grid numerical modelling methodology for convection-diffusion mushy region phase-change problems. Int. J. Heat Mass Transf. 1987, 30, 1709–1719. [Google Scholar] [CrossRef]
- Brent, A.D.; Voller, V.R.; Reid, K.J. Enthalpy-porosity technique for modeling convection-diffusion phase change: Application to the melting of a pure metal. Numer. Heat Transf. 1988, 13, 297–318. [Google Scholar] [CrossRef]
- Vu, T.V. Three-phase computation of solidification in an open horizontal circular cylinder. Int. J. Heat Mass Transf. 2017, 111, 398–409. [Google Scholar] [CrossRef]
- Fertelli, A.; Günhan, G.; Buyruk, E. Numerical investigation of effect of the position of the cylinder on solidification in a rectangular cavity. Heat Mass Transf. 2017, 53, 687–704. [Google Scholar] [CrossRef]
- Huang, Y.; Khajepour, A.; Bagheri, F.; Bahrami, M. Optimal energy-efficient predictive controllers in automotive air-conditioning/refrigeration systems. Appl. Energy 2016, 184, 605–618. [Google Scholar] [CrossRef]


| Refrigerant Temperature | −5 °C | −10 °C | −15 °C |
|---|---|---|---|
| t = 10 min |  |  | 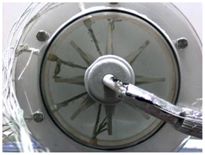 |
| t = 30 min |  |  | 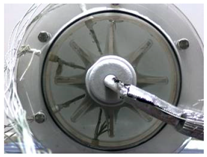 |
| t = 50 min |  | 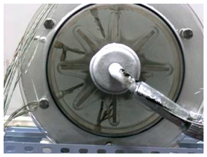 | 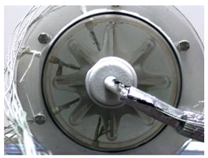 |
| t = 80 min | 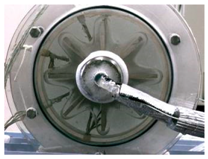 |  |  |
| t = 120 min | 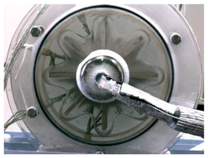 | 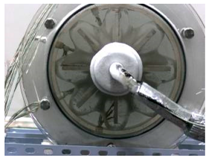 |  |
| Initial Temperature of the Water | 4 °C | 10 °C | 17 °C |
|---|---|---|---|
| t = 10 min |  | 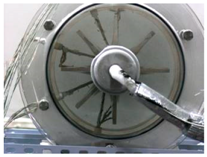 |  |
| t = 30 min | 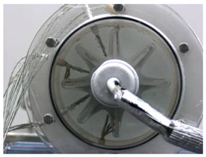 |  | 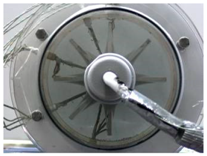 |
| t = 50 min | 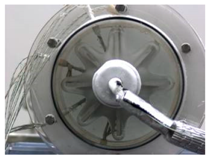 | 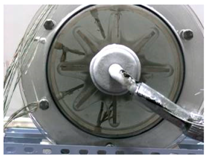 | 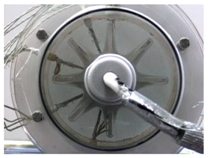 |
| t = 80 min |  |  | 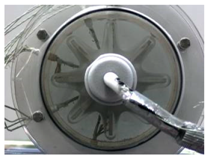 |
| t = 120 min | 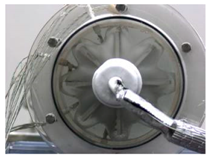 |  | 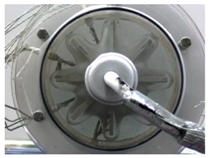 |
© 2019 by the authors. Licensee MDPI, Basel, Switzerland. This article is an open access article distributed under the terms and conditions of the Creative Commons Attribution (CC BY) license (http://creativecommons.org/licenses/by/4.0/).
Share and Cite
Zhou, H.; Chen, M.; Han, X.; Cao, P.; Yao, F.; Wu, L. Enhancement Study of Ice Storage Performance in Circular Tank with Finned Tube. Processes 2019, 7, 266. https://doi.org/10.3390/pr7050266
Zhou H, Chen M, Han X, Cao P, Yao F, Wu L. Enhancement Study of Ice Storage Performance in Circular Tank with Finned Tube. Processes. 2019; 7(5):266. https://doi.org/10.3390/pr7050266
Chicago/Turabian StyleZhou, Hua, Mengting Chen, Xiaotian Han, Peng Cao, Feng Yao, and Liangyu Wu. 2019. "Enhancement Study of Ice Storage Performance in Circular Tank with Finned Tube" Processes 7, no. 5: 266. https://doi.org/10.3390/pr7050266
APA StyleZhou, H., Chen, M., Han, X., Cao, P., Yao, F., & Wu, L. (2019). Enhancement Study of Ice Storage Performance in Circular Tank with Finned Tube. Processes, 7(5), 266. https://doi.org/10.3390/pr7050266