In Situ Measurements and CFD Numerical Simulations of Thermal Environment in Blind Headings of Underground Mines

 ,
,
Abstract
:1. Introduction
2. Field Measurements
2.1. Measuring Setup
2.2. Results and Discussion
- No mining operation before 20:40;
- Air temperature increased due to the blasting at 20:40; and
- Air temperature increased due to the moving of LHD between 21:50 and 23:30.
2.2.1. Heat Emitted from Surrounding Rock
2.2.2. Heat Transferred from LHD
3. Numerical Study
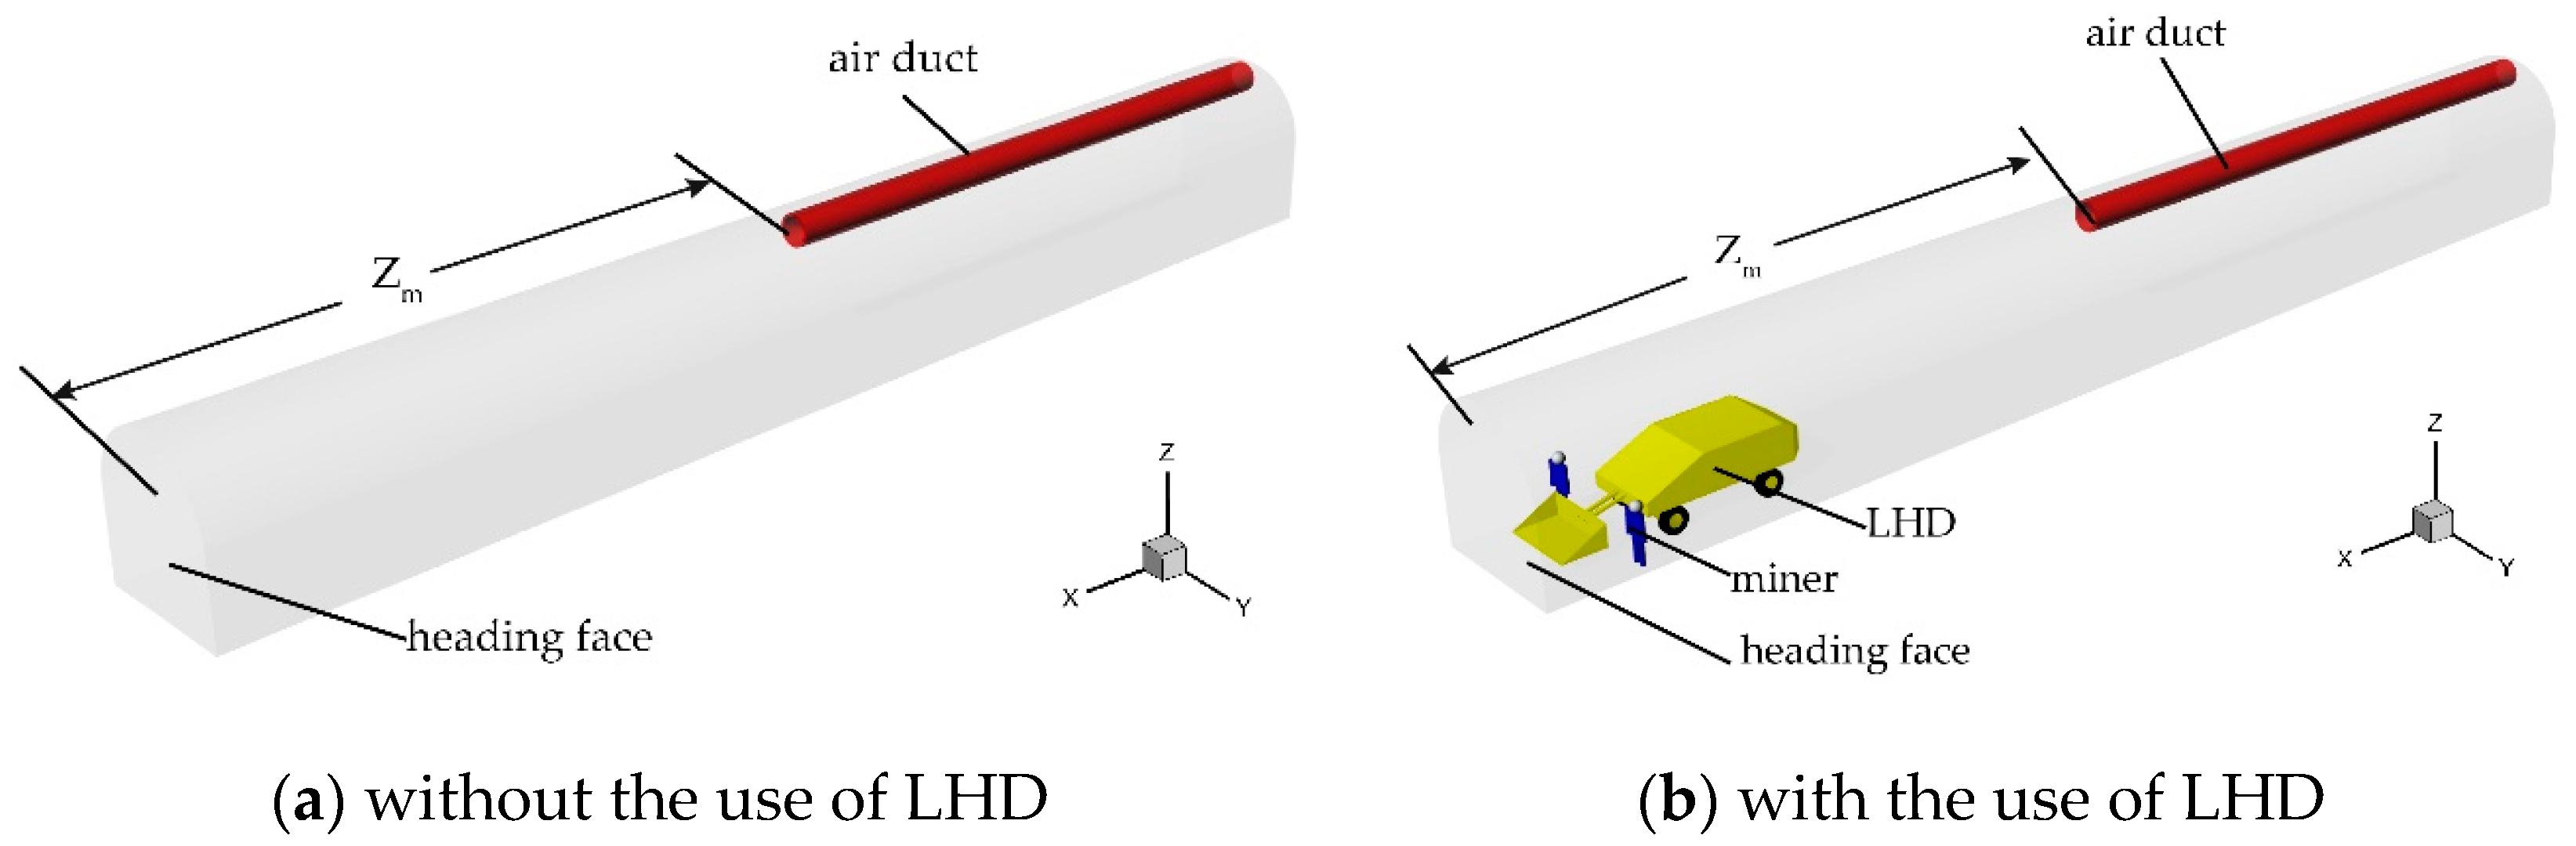
3.1. Geometry Model
3.2. Mesh Generation
3.3. Mesh Independence Test
3.4. Boundary Conditions
3.5. Turbulence Model
4. Results and Discussion
4.1. Effect of Different Zm on the Thermal Environment
4.2. Effect of Heat Emitted from LHD on the Thermal Environment
4.3. Effect of Auxiliary Ventilation on Thermal Environment of Airway
5. Conclusions
Author Contributions
Funding
Conflicts of Interest
References
- Greth, A.; Roghanchi, P.; Kocsis, K. A review of cooling system practices and their applicability to deep and hot underground US mines. In Proceedings of the 16th North American Mine Ventilation Symposium, Golden, CO, USA, 17–22 June 2017; Volume 11, pp. 1–9. [Google Scholar]
- Kong, B.; Li, Z.H.; Wang, E.Y.; Yang, Y.L.; Chen, L.; Qi, G.S. An experimental study for characterization the process of coal oxidation and spontaneous combustion by electromagnetic radiation technique. Process Saf. Environ. Prot. 2018, 119, 285–294. [Google Scholar] [CrossRef]
- Kong, B.; Wang, E.Y.; Li, Z.H.; Lu, W. Study on the feature of electromagnetic radiation under coal oxidation and temperature rise based on multi-fractal theory. Fractals 2019, 27, 14–38. [Google Scholar]
- Lowndes, I.S.; Crossley, A.J.; Yang, Z.Y. The ventilation and climate modelling of rapid development tunnel drivages. Tunn. Undergr. Space Technol. 2004, 19, 139–150. [Google Scholar] [CrossRef]
- Yang, W.Y.; Inoue, M.; Miwa, S.H.; Kobayashi, Y. Heat form fragmented rock, explosives and diesel equipment in blind headings of underground mines. Mem. Fac. Eng. Kyushu Univ. 2013, 73, 13–26. [Google Scholar]
- Wala, A.M.; Vytla, S.; Taylor, C.D.; Huang, G. Mine face ventilation: A comparison of CFD results against benchmark experiments for the CFD code validation. Min. Eng. 2007, 59, 49–55. [Google Scholar]
- Glehn, F.H.V.; Bluhm, S.J. Practical aspects of the ventilation of high-speed developing tunnels in hot working environments. Tunn. Undergr. Space Technol. 2000, 15, 471–475. [Google Scholar] [CrossRef]
- Liu, C.Q.; Nie, W.; Bao, Q.; Liu, Q.; Wei, C.H.; Hua, Y. The effects of the pressure outlet’s position on the diffusion and pollution of dust in tunnel using a shield tunneling machine. Energy Build. 2018, 176, 232–245. [Google Scholar] [CrossRef]
- Lowndes, I.S.; Yang, Z.Y.; Jobling, S.; Yates, C. A parametric analysis of a tunnel climatic prediction and planning model. Tunn. Undergr. Space Technol. 2006, 21, 520–532. [Google Scholar] [CrossRef]
- Shimada, S.; Ohmura, S. Experimental study on cooling of heading face by local ventilation. Shigen-to-Sozai 1990, 106, 725–729. [Google Scholar] [CrossRef]
- Jia, M.T.; Chen, Y.H.; Wu, L.J.; Wang, S.; Qi, C.G. The heat exchange simulation test platform for deep excavation roadway in metal mine. Met. Mine 2014, 461, 113–116. [Google Scholar]
- Sasmito, A.P.; Kurnia, J.C.; Birgersson, E.; Mujumdar, A.S. Computational evaluation of thermal management strategies in an underground mine. Appl. Therm. Eng. 2015, 90, 1144–1150. [Google Scholar] [CrossRef]
- Gao, J.L.; Uchino, K.; Inoue, M. Simulation of Thermal Environmental Conditions in heading face with Forcing Auxiliary Ventilation-control of thermal environmental conditions in locally ventilated working face. Shigen-to-Sozai 2002, 118, 9–15. [Google Scholar] [CrossRef]
- Hua, Y.; Nie, W.; Wei, W.L.; Liu, Q.; Liu, Y.H.; Peng, H.T. Research on multi-radial swirling flow for optimal control of dust dispersion and pollution at a fully mechanized tunnelling face. Tunn. Undergr. Space Technol. 2018, 79, 293–303. [Google Scholar] [CrossRef]
- Zhou, G.; Feng, B.; Yin, W.J.; Wang, J.Y. Numerical simulations on airflow-dust diffusion rules with the use of coal cutter dust removal fans and related engineering applications in a fully-mechanized coal mining face. Powder Technol. 2018, 339, 354–367. [Google Scholar] [CrossRef]
- Cai, P.; Nie, W.; Chen, D.W.; Yang, S.B.; Liu, Z.Q. Effect of airflow rate on pollutant dispersion pattern of coal dust particles at fully mechanized mining face based on numerical simulation. Fuel 2019, 239, 623–635. [Google Scholar] [CrossRef]
- Torano, J.; Torno, S.; Menendez, M.; Gent, M. Auxiliary ventilation in mining roadways driven with roadheaders: Validated CFD modelling of dust behaviour. Tunn. Undergr. Space Technol. 2011, 26, 201–210. [Google Scholar] [CrossRef]
- Ren, T.; Wang, Z.; Cooper, G. CFD modelling of ventilation and dust flow behaviour above an underground bin and the design of an innovative dust mitigation system. Tunn. Undergr. Space Technol. 2014, 41, 241–254. [Google Scholar] [CrossRef]
- Cheng, W.M. Mining Ventilation and Safety; China Coal Industry Publishing House: Beijing, China, 2016. [Google Scholar]
- McPherson, M.J. Subsurface Ventilation and Environmental Engineering; Chapman and Hall: New York, NY, USA, 1993. [Google Scholar]
- Kurnia, J.C.; Sasmito, A.P.; Mujumdar, A.S. Simulation of a novel intermittent ventilation system for underground mines. Tunn. Undergr. Space Technol. 2014, 42, 206–215. [Google Scholar] [CrossRef]
- Shim, B.O.; Park, J.M.; Kim, H.C.; Lee, Y. Statistical Analysis on the Thermal Conductivity of Rocks in the Republic of Korea. In Proceedings of the World Geothermal Congress, Bali, Indonesia, 25–30 April 2010. [Google Scholar]
- Mao, N.; Pan, D.; Deng, S.; Chan, M. Thermal, ventilation and energy saving performance evaluations of a ductless bed-based task/ambient air conditioning (TAC) system. Energy Build. 2013, 66, 297–305. [Google Scholar] [CrossRef]
- Parra, M.T.; Villafruela, J.M.; Castro, F.; Mendez, C. Numerical and experimental analysis of different ventilation systems in deep mines. Build. Environ. 2006, 41, 87–93. [Google Scholar] [CrossRef]
- Sasmito, A.P.; Birgersson, E.; Ly, H.C.; Mujumdar, A.S. Some approaches to improve ventilation system in underground coal mines environment—A computational fluid dynamic study. Tunn. Undergr. Space Technol. 2013, 34, 82–95. [Google Scholar] [CrossRef]
- Kurnia, J.C.; Xu, P.; Sasmito, A.P. A novel concept of enhanced gas recovery strategy from ventilation air methane in underground coal mines—A computation investigation. J. Natl. Gas Sci. Eng. 2016, 35, 661–672. [Google Scholar] [CrossRef]
- Yang, L.X. Modern Tunwnel Construction Ventilation Technology; China Communications Press: Beijing, China, 2012. [Google Scholar]
- Mkhwanazi, D. Optimizing LHD utilization. South. Afr. Inst. Min. Metall. 2011, 111, 273–280. [Google Scholar]
- Liu, W.W.; Lian, Z.W.; Yao, Y. Optimization on indoor air diffusion of floor-standing type room air-conditioners. Energy Build. 2008, 40, 59–70. [Google Scholar] [CrossRef]
- Ren, T.; Wang, Z.W. CFD modelling of ventilation, dust and gas flow dispersion patterns on a longwall face. In Proceedings of the 11th International Mine Ventilation Congress; Springer: Singapore, 2019. [Google Scholar]


| Starting Time | End Time | Operation | Heavy-Duty Machinery | Charge Quantity (kg) | Ore Amount (ton) |
|---|---|---|---|---|---|
| 20:40 | — | Blasting | — | 41.8 | 49.6 |
| 21:50 | 23:30 | Loading and hauling the Ore | LHD | — | — |
| Combustion engine | Displacement | 6.7 L |
| Output Power | 144 kW | |
| Physical dimension | Length | 8.0 m |
| Width | 2.5 m | |
| Height | 2.0 m |
| Min | Max | Average | Standard Deviation | |
|---|---|---|---|---|
| Skewness | 1.72 × 10⁻⁴ | 0.84 | 0.30 | 0.17 |
| Orthogonal quality | 0.16 | 0.99 | 0.78 | 0.15 |
| Boundary | Conditions |
|---|---|
| Air duct outlet | Supply airflow temperature 25 °C supply airflow velocity 12 m/s, supply airflow relative humidity 70% |
| Airway outlet | Pressure outlet |
| Wall of airway | The heat thermal conductivity: 2.8 W/m·K [22]; Outside heat flux 192.9 W/m2 |
| Wall of LHD | Fixed heat: Total power: 27 kW |
| Wall of miners | Metabolic rate: 180 W/m2 [23] |
| Measurement Point | Measured Results | Spalart–Allmaras | Standard K-Epsilon | Standard K-Omega | Reynolds Stress Model | |||||
|---|---|---|---|---|---|---|---|---|---|---|
| with LHD | without LHD | with LHD | without LHD | with LHD | without LHD | with LHD | without LHD | with LHD | without LHD | |
| a1 | Unmeasurable | 0.31 | 0.15 | 0.33 | 0.14 | 0.31 | 0.15 | 0.28 | 0.17 | 0.35 |
| a2 | 0.32 | Unmeasurable | 0.34 | 0.26 | 0.33 | 0.27 | 0.30 | 0.25 | 0.36 | 0.28 |
| a3 | 0..50 | 0.75 | 0.54 | 0.77 | 0.50 | 0.77 | 0.47 | 0.74 | 0.55 | 0.79 |
| a4 | 0.85 | 1.18 | 0.86 | 1.19 | 0.86 | 1.17 | 0.83 | 1.15 | 0.87 | 1.21 |
| a5 | Unmeasurable | Unmeasurable | 0.16 | 0.31 | 0.16 | 0.29 | 0.18 | 0.26 | 0.19 | 0.30 |
| a6 | Unmeasurable | Unmeasurable | 0.29 | 0.30 | 0.29 | 0.30 | 0.29 | 0.28 | 0.31 | 0.30 |
| a7 | 0.43 | 0.78 | 0.45 | 0.79 | 0.44 | 0.79 | 0.40 | 0.74 | 0.46 | 0.82 |
| a8 | 0.65 | 1.25 | 0.67 | 1.28 | 0.65 | 1.25 | 0.61 | 1.23 | 0.69 | 1.29 |
| p | \ | \ | 0.039 | 0.041 | 0.083 | 0.414 | 0.041 | 0.042 | 0.042 | 0.034 |
© 2019 by the authors. Licensee MDPI, Basel, Switzerland. This article is an open access article distributed under the terms and conditions of the Creative Commons Attribution (CC BY) license (http://creativecommons.org/licenses/by/4.0/).
Share and Cite
Wang, W.; Zhang, C.; Yang, W.; Xu, H.; Li, S.; Li, C.; Ma, H.; Qi, G. In Situ Measurements and CFD Numerical Simulations of Thermal Environment in Blind Headings of Underground Mines. Processes 2019, 7, 313. https://doi.org/10.3390/pr7050313
Wang W, Zhang C, Yang W, Xu H, Li S, Li C, Ma H, Qi G. In Situ Measurements and CFD Numerical Simulations of Thermal Environment in Blind Headings of Underground Mines. Processes. 2019; 7(5):313. https://doi.org/10.3390/pr7050313
Chicago/Turabian StyleWang, Wenhao, Chengfa Zhang, Wenyu Yang, Hong Xu, Sasa Li, Chen Li, Hui Ma, and Guansheng Qi. 2019. "In Situ Measurements and CFD Numerical Simulations of Thermal Environment in Blind Headings of Underground Mines" Processes 7, no. 5: 313. https://doi.org/10.3390/pr7050313