Abstract
Docynia indica (D. indica) shows various useful biological activities, such as antioxidant, anti-inflammatory, antibacterial effects, and positive benefits for human health. Such biological activities relate to the main phytochemicals of D. indica including phenolic and flavonoid. However, isolation for phenolic and flavonoid by popular methods such as hot extraction, soxhlet extraction, and ultrasonic extraction have been relatively ineffective. Therefore, in this study, microwave-assisted extraction (MAE) was used for the extraction of total phenolic and total flavonoid from D. indica. The optimization experiments were conducted based on response surface methodology (RMS) according to a central composite design with four independent variables: extraction time (min), ethanol concentration (%, v/v), microwave power (W), and pH of the solvent. Three dependent variables were total phenolic content (TPC), total flavonoid content (TFC), and yield. The optimal conditions for the extraction of phenolic and flavonoid from D. indica were: extraction time of 50 min, ethanol concentration of 65%, microwave power of 440 W, and solvent pH of 5.4. These conditions corresponded to TPC, TFC, and yield values of 33.57 ± 0.12 (mg GAE/g), 25.01 ± 0.11 (mg QE/g) and 33.44 ± 0.14 (%), respectively.
1. Introduction
Docynia indica (Wall.) Decne (Rosaceae) is a plant that is widely distributed in Vietnam, India and some southern provinces of China [1,2]. In Vietnam, D. indica grows mainly in the northern mountainous provinces such as Yen Bai, Lao Cai, Son La, Ha Giang and Lai Chau [1,2]. D. indica is increasingly used as a reforestation species for environmental services and as a fruit tree for commercial purposes in a small scale. The fruit of D. indica could not be consumed directly in fresh form, but requires a certain kind of processing, usually resulting in the form of syrup, alcohol, wine, and vinegar [3]. The increasing demand for ready-for-use products such as filter bag tea, agglomerated instant tea, and dry jam has promoted the cultivation of D. indica [3]. Evidently, the production area and market demand of D. indica has grown over the last few years, mostly due to the consumer belief in positive effects on human health. Traditionally, the D. indica fruits are used as food and treatment of infectious diseases, digestive disorders, and hypertension [1,2]. The extract of D. indica fruits has also been found to have diverse pharmacological effects such as antimicrobial, anti-inflammatory, cytotoxic antioxidant activities and lower cholesterol in the blood [4,5,6]. The main phytochemicals of D. indica are mainly flavonoids, triterpenoids and megastigmane glycosides [4,6,7].
In India, it was shown that D. indica mature fruits possess a total content of phenolic and flavonoids of 36.82 ± 0.34 mg of gallic acid/g extract and 22.62 ± 0.21 mg equivalent to Rutin (RE)/g extract [8]. In a study involving Vietnamese D. indica fruits, the total phenolic content of the fruit was found to account for 4.99% of extract dry equivalent to 49.9 mg GAE/g extract [5]. These studies suggested that D. indica fruits could serve as a potential source of phenolic substances.
The phenolics are a group of compounds that have strong antioxidant activity [9,10]. However, they are relatively sensitive to temperature and are easily oxidized at high temperatures under a extended period [11,12,13]. Therefore, common extraction methods such as hot extraction, and ultrasonic extraction with heating could be ineffective. Nowadays, the method of microwave-assisted extraction (MAE), shows many advantages [14]. First, since the extraction time is short, more active compounds could be preserved and the amount of used solvent is lower than in the traditional methods. In addition, the method is also adaptable not only at the laboratory, but also at an industrial scale, thus bringing high efficiency [15,16,17]. The parameters that influence the extraction efficiency of MAE are extraction solvent, extraction time, microwave power and ratio solvent and material, solvent pH.
The main objective of this study is to extract the total phenolic and flavonoid content yield from D. indica in Vietnam using microwave-assisted extraction. In addition, the total phenolic content and total flavonoid content yield in the extraction process were optimized with regard to four independent variables including extraction time, solvent concentration, microwave power and solvent pH. The response surface methodology (RSM) was applied to find the optimal conditions for the extraction.
2. Materials and Methods
2.1. Plant Sample Preparation
The fruits of D. indica (Wall.) Decne. were collected in Bac Yen district, Son La province, Vietnam in September, 2017. The plant was identified by Assoc. Prof. Tran The Bach, Institute of Ecology and Biological Resources (VAST), Vietnam. Fresh D. indica fruits had the seed removed. The remainder was dried at 60 ± 5 °C and crushed to obtain D. indica powder (Figure 1).
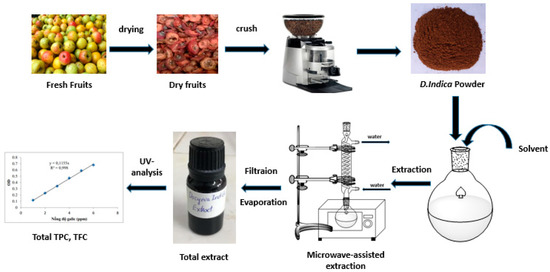
Figure 1.
The process of the total phenolic and flavonoid extraction.
2.2. Extraction Method
D. indica extraction system consists of a microwave oven (model ME71A, Samsung, Ho Chi Minh City, Vietnam), which acts as the heat source of the extraction process, and solvent refluxing device. The flask contains raw materials placed in the microwave cavity, connected to the reflux condenser system located outside the oven to recover the solvent. Microwave power of equipment: in range 100–800 W; Volume of equipment: 23 L.
2.3. Extraction Process
The process of phenolic and flavonoid extraction from D. indica powder is illustrated in Figure 1. First, 100 g of sample were weighted accurately by an electronic scale and transferred into an 1 L flask. The extraction solvent is added to the flask at at 5/1 (v/w, mL/g) ratio. The flask was shaken to allow the solvent to penetrate evenly into the sample. Then, the extraction was performed by the microwave oven. Time is measured when the oven starts. After finishing the extraction process, the filtration process is used to remove the solid phase and to collect the liquid phase. The filtered solution is concentrated with a solvent evaporator. The crude extract is obtained after concentration.
2.4. Determination of Total Phenolic Content
The total phenolic content (TPC) of the D. indica extracts was measured according to the method reported by Singleton et al. [18] with some modifications. First, 1 mL of sample was mixed with 5 mL of Folin-Ciocalteu’s solution. After 5 min, 4 mL of 7.5% sodium carbonate solution were added to the mixture and adjusted to 10 mL with distilled water. The mixture was allowed to stand at room temperature in the dark enviroment for 60 min. Then absorbance was measured against blank at 765 nm using UV-visible spectrophotometer (Shimadzu UV-Vis 1800, Japan). A standard curve was established using gallic acid at different concentrations (10–70 µg/mL). The concentration of total phenolics in the D. indica extract was calculated based on the equation from the standard curve and expressed in terms of milligam gallic acid equivalent (mg GAE/g extract).
2.5. Determination of Total Flavonoid Content
The total flavonoid content (TFC) of the D. indica extracts was measured according to the procedures described by Zhishen J et al. [19] with some modifications. Flavonoid concentration in D. indica fruit extract was measured by the Aluminium chloride colorimetric assay. The standard was quercetin prepared at different concentrations (10–70 µg/mL). Aliquot of (1 mL) of extracts was added to 10 mL volumetric flask containing 4 mL distilled water. The flask were added with 0.3 mL of 5% NaNO2. After 5 min, 0.3 mL of 10% AlCl3 were added. At 6th min, 2.0 mL of NaOH (1 M) were added and total volume was made up to 10 mL with distilled water. The solution was mixed well in a vortex and the absorbance was read against blank at 510 nm (Shimadzu UV-Vis 1800, Kyoto, Japan). The concentration of total flavonoid in the D. indica extract was calculated based on the equation from the standard curve and expressed in terms of milligam Quercetin equivalent (mg QE/g extract).
2.6. Determination of Extraction Yield
Extract yield, measured in %, is determined from the following the formula:
where w1 is weight of extract (g) and w2 is weight of used D. indica powder (g).
2.7. Experimental Design
The response surface methodology, in conjunction with the Box-Wilson central composite design was employed to estimate the effect of 4 parameters (microwave power, extraction time, solvent concentration and solvent pH) on phenolic total, flavonoid total output and yield of the extraction process [20]. Procedure for the construction of the 27 experiment orthogonal design matrix with the mathematical-statistical treatments. the determination of optimal conditions were executed using Design-Expert 7.0 software (Stat-Ease, Minneapolis, MN, United States). Ranges of microwave power, radiation time, solvent composition and solvent pH, and the central point were selected based on preliminary experimental results. First, we conducted single factor investigation of four factors by individually varying one factor while keeping other variables at a fixed value. The obtained set of values by single factor investigation will then be used in Central Composite Design to produce 27 sets of experiment conditions with a coefficient of α = 1.414 (Table 1 and Table 2). Estimation results will be tested with Analysis of Variance (ANOVA) to confirm model validity. Then, optimal conditions are calculated from the final model and verified by an actual experiment attempt. The dependent variables as a function of independent variables were expressed using the following second order polynomial equation.
where is the predicted response; b0 is the intercept coefficient; bj is the linear coefficient; bjj is the square coefficient; buj is the interaction coefficient; Xu and Xj are the coded independent avariables, term of XuXj and Xj2 are the interection and quadratic terms, respectively.

Table 1.
Independent variables and their corresponding levels.
Table 2.
Experimental design and response values.
3. Result and Discussion
3.1. Single Factor Investigation
Based on our familiarity with experiments involving D. indica fruits, fixed values were chosen as microwave power of 400 W, extraction time of 30 min, solvent concentration of 60% (v/v) and solvent pH of 4. The used solvent is ethanol and the solvent to material ratio is fixed at 5/1 (mL/g).
Figure 2 shows the effect of factors on total phenolic and flavonoids during extraction. In Figure 2a, the extraction time is varied from 10 min to 50 min. The factor is fixed at 60% concentration of ethanol, 400 W microwave power and solvent pH of 4. The results showed that the highest total phenolic is obtained at the extraction time of 40 min (32.5 mg GAE/g) and the total flavonoid was highest at the extraction time of 40 min (22.5 mg QE/g). When the extraction time was 50 min, the phenolic and flavonoid content was reduced to 32 mg GAE/g and 22.2 mg QE/g, respectively. This can be explained by the fact that when the extraction time exceeds a certain limit, some phenols and flavonides decompose; reducing their content in the result. This pattern is consistent with the research results of Wang et al. (2010) in the study on the microwave-assisted extraction of polyphenols from tea leaves [21]. Extraction time of lower than 40 min resulted in reduced total phenolic content and total flavonoids. Therefore, we selected 40 min of extraction time as the time parameter for further studies.
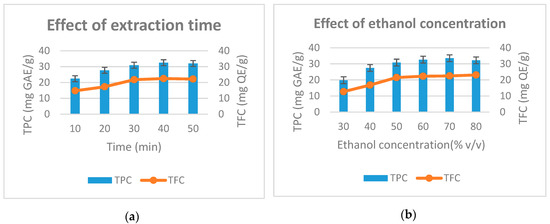
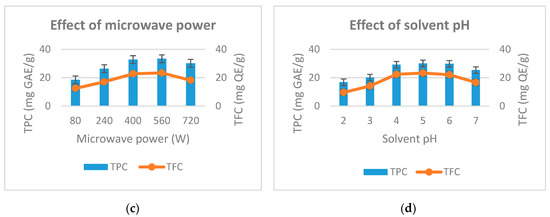
Figure 2.
Effect of extraction time (a), ethanol concentration (b), microwave power (c) and solvent pH (d) to the total phenolic and total flavonoid from D. indica.
In the next study, surveyed ethanol concentrations were varied from 30% to 80%, while the remaining factors were fixed. Figure 2b shows that as ethanol concentration increased from 30%–70%, total phenolic and flavonoid content increased from 19.8 to 33.5 (mg GAE/g) and from 12.7 to 22.5 (mg QE/g), respectively. Continuing to increase the ethanol concentration to 80%, the total phenolic content tends to decrease slightly, while the flavonoid content increases slightly. The results of the study are quite sensible because when the concentration of ethanol increases, the polarization of the solvent will gradually decline to the level consistent with the polarization of the phenolic group, which results in the highest content of total phenolic and flavonoid extract yield. The study results of Dent et al. (2013) also indicated that the recovery of phenolic compounds was dependent on the type of solvent used, its polarity and the solubility of phenolic compounds in the extraction solvents [22]. Therefore, the ethanol concentration of 70% is selected for subsequent experiments.
The effect of microwave power on total phenolic content and total flavonoid was conducted afterwards. Microwave power is surveyed from 80–720 W while other factors are kept fixed. The study results are shown in Figure 2c. As the microwave power increased from 80–400 W, the total phenolic and total flavonoid increased rapidly from 18.5 to 32.8 (mg GAE/g) and 12.5 to 22.8 (mg QE/g). Continuing to increase microwave power to 560 W, total phenolic and flavonoid increased slightly to 33.4 (mg GAE/g) and 23.4 (mg QE/g). As the microwave power reached 720W, the total phenolic content and total flavonoid are reduced. The microwave power is directly related to the thermal effect for the extraction process. This result is consistent with the result given by Su et al. (2018) [23]. To be specific, high microwave power results in high temperature, which decomposes the phenolic and flavonoids. Therefore, we choose the microwave power at 400 W to perform the next experiments.
Finally, the effect of solvent pH on the total phenolic yield and total flavonoids was studied in the range of 2–7 (pH). Other factors in this experiment are fixed. The results in Figure 2d show that, when the solvent pH increased from 2 to 5, the total phenolic content and flavonoid total increased from 16.8–30.1 (mg GAE/g) and 9.6 to 23.3 (mg QE/g). When the solvent pH was 6, the total phenolic content and total flavonoid begin to decrease slightly. At solvent pH of 7, total phenolic and flavonoid content decreased rapidly to 25.4 (mg GAE/g) and 16.6 (mg QEg). This result shows that the pH of the extraction solvent effects the stability of plant phenolic compounds. This is consistent with the results of Friedman et al. (2000) [24]. Based on experiences, we choose a solvent pH of 4 as the center level to conduct subsequent experiments.
3.2. Predicted Model and Statistical Anlalysis
The responses consisting of TPC, TFC and yield of D. indica extract by using microwave-assisted extraction were optimized based on the central composite design. Four considered independent variables were as follows: extraction time, ethanol concentration microwave power and solvent pH. The input range of the selected variables was determined from the preliminary experiments (Table 1). Three dependent variables including total phenolic content (Y1), total flavonoid content (Y2) and yield (Y3) were detemined following extraction under optimal conditions. These experimental values were compared with those of the predicted values to confirm the validity of the model.
On the basis of the single factor experiments results, a total of 27 runs was performed for optimization of these four variables by RMS method via multiple regression analysis on the experimental data. Results for multiple regression analysis and response surface quadratic model of Y1, Y2 and Y3 were evaluated using F-value, p-value and R2 values (Table 3) and the predicted reponse on TPC (Y1), TFC (Y2), Yield (Y3) and the independent variables related by the second-order polynomial equation are given in Table 4. The ANOVA of quadratic regression model demonstrated that the models was highly significant and had a good fit of model, F-value of Y1, Y2 and Y3 were calculated to be 14, 34.07, 21.03 and the p-value was very low (p < 0.0001), suggesting all the models were statistically extremely significant (Table 3). The model coefficients of determination (R2) were 0.9423, 0.9755, and 0.9608. indicating that more than 94.23%, 97.55% and 96.08% of the response variability could be explained by the experimental data, supporting a good accuracy and capability of the established model within the range limits use. The F-values of lack of fit of Y1, Y2 and Y3 were 0.71, 0.53 and 1.18, respectively, implying that the lack of fit is not significant relative to the pure error. This indicates that the accuracy of the polynominal model was adequate.
Table 3.
Regression coefficient of the predicted second-order polynomial models for total phenolic content, total flavonoid content and yield.
Table 4.
Empirical second-order polynomial model of total phenolic content (TPC), total flavonoid content (TFC) and Yield.
3.3. Response Surface Analysis
Based on the empirical second-order polynomial model, the experimental data were analyzed by RSM using the Design Expert software. The X- and Y-axes of the three dimensional response surface represented two factors, for extraction time and ethanol concentation (microwave power 400 W and solvent pH 4), extraction time and microwave power (ethanol concentation 60% and solvent pH 4), extraction time and solvent pH (ethanol concentation 60% and microwave power 400 W), ethanol concentation and microwave power (extraction time 30 min and solvent pH 4), ethanol concentation and solvent pH (extraction time 30 min and microwave power 400 W), microwave power and solvent pH (extraction time 30 min and ethanol concentation 60%). The Z-axes represented one of three evalution indices (TPC, TFC and Yield). Three dimensional response surfaces were constructed, as shown in Figure 3.
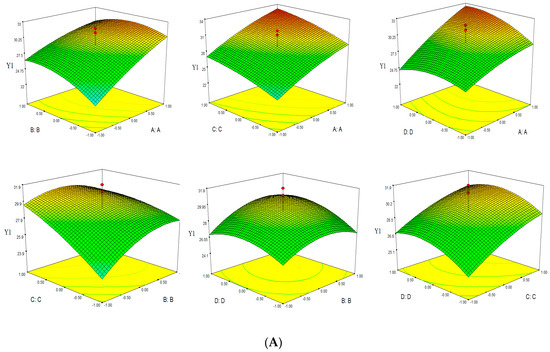
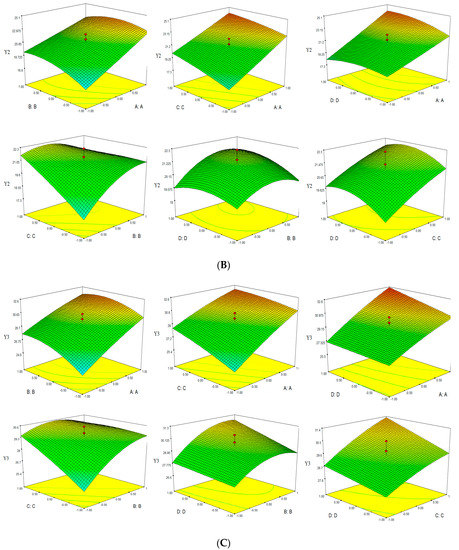
Figure 3.
Response surface of TPC-Y1 (A), TFC-Y2 (B) and Yield-Y3 (C).
3.4. Optimization and Model Verification
Using the RMS method to optimize the response optimal, the optimal values of the independent variables were obtained by solving second-order regression equations to maximize total phenolic content, total flavonoid content and yield. The level of importance of three responses (TPC, TFC, Yield) is chosen as the order below: The highest level is Y1 (TPC) in level 5, the next one is Y2 (TFC) in level 3 and the lowest is Y3 (yield) in level 2. Experimental data show that maximum total phenolic content, total flavonoid content and yield occurring when the extraction time: 50.1 min, ethanol concentration: 64.6%, microwave power: 441.6 W and pH solvent: 5.4. (Table 5, Table 6 and Figure 4). However, to meet the operability of the actual conditions, we modified predicted optimum extraction conditions as follows: extraction time of 50 min, ethanol concentration of 65%, microwave power of 440 W and pH solvent 5.4.
Table 5.
The values of the independent variable and real variables.
Table 6.
Predicted response values and experimental response values obtained at optimum conditions.
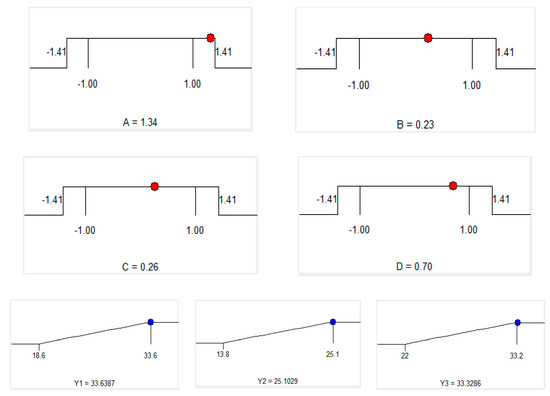
Figure 4.
Optimum conditions by solution of ramps.
The presented results indicate that the Vietnamese D. indica fruits possess a higher total phenolic content when compared to some other fruits. For example, in the study of Sharma et al. [25] investigating five Indian fruits including Garcinia pedunculata, Garcinia xanthochymus, Docynia indica, Rhus semialata, and Averrhoa carambola, it was shown that the total phenolic content (mg GAE/g extract) for the five fruits was respectively 9.44 ± 0.24; 31.31 ± 2.07; 49.26 ± 4.21; 172.84 ± 15.33 and 43.11 ± 2.46. Furthermore, Brazillian Psidium guajava fruit was found to have a total phenolic content of 11.62 (mg GAE/g extract) according to Chiari et al. [26]. The high total phenolic content of Vietnamese D. indica suggests the fruit as a potential source for phenolics, a group of substances with strong biological activity.
Microwave-assisted extraction of polyphenols from tea leaves in the study of Wang et al. [21] was proved to be more effective than traditional extraction techniques. Specifically, in the extraction process of polyphenols from tea leaves, the microwave-assisted extraction method, when compared with the hot reflux method, required eightfold lower extraction time and simultaneously yielded 17.5% more total polyphenol content. In comparison with the the ultrasonic-assisted extraction in the same study, microwave extraction was also found to consume less energy by four times and reduce the extraction time by two times. In another study by Hemwimon et al. [27], microwave extraction of anthraquinones from Morinda citrifolia gave better performance than ultrasound-assisted extraction. To be specific, while the recovery efficiency of anthraquinones by microwave-assisted extraction was equal to that of soxhlet extraction, however, the time of microwave extraction (15 min) elapsed is much lower than that of soxhlet extraction (4 h). For comparison with this study, we attempted the Soxhlet extraction of phenolic extract from D. indica. In order to achieve a total phenolic content of 33.5 (mg GAE/g extract), the required extraction time was 10 h, which is approximately 12 times higher than that of the microwave-assisted extraction. Therefore, in terms of total phenolic content from medicinal plants, microwave-assisted is suggested to be more effective than other traditional methods.
4. Conlusions
In this study, RSM, in conjunction with the central composite experiment design, was successfully employed to optimize the extraction of total phenolic and total flavonoid from fruits of Docynia indica with regard to four experimental conditions, namely extraction time (min), ethanol concentration (%, v/v), microwave power (W) and solvent pH. Three dependent variables including total phenolic content (mg GAE/g), total flavonoid content (mg QE/g) and yield (%) were considered. The optimal factors consisted of extraction time of 50 min, ethanol concentration of 65%, microwave power 440 W and solvent pH of 5.4. Using these conditions yielded values of TPC, TFC and yield of 33.57 ± 0.12 (mg GAE/g), 25.01 ± 0.11 (mg QE/g) and 33.44 ± 0.14 (%) respectively.
Author Contributions
Investigation, M.C.N., H.V.D., M.Q.P., Q.L.P., Q.T.N., T.A.N., V.T.P., L.G.B., T.V.N. and Q.T.T.; Writing—original draft, X.D.L.
Acknowledgments
This study was supported by grants from Institute of Natural Products Chemistry, Vietnam Academy of Science and Technology (VAST), 18 Hoang Quoc Viet, Cau Giay, Hanoi, Vietnam.
Conflicts of Interest
The authors declare no conflict of interest.
References
- Do, T.L. The Medicinal Plants and Traditional Medicines in Viet Nam; Medical Publishing: Ha Noi, Vietnam, 2004; pp. 355–357. (In Vietnamese) [Google Scholar]
- Vo, V.C. Dictionary of Medicinal Plants in Viet Nam; Medical Publishing House: Ha Noi, Vietnam, 2012; pp. 1097–1098. (In Vietnamese) [Google Scholar]
- Lua, H.T.; Degrande, A.; Catacutan, D.; Hoa, N.T.; Cuong, V.K. Son Tra (Docynia indica) Value Chain and Market Analysis; AFLI Technical Report; Research Program on Integrated Systems for the Humid Tropics: Ha Noi, Vietnam, 2013. [Google Scholar]
- Dung, H.V.; Bach, N.V.; Trung, T.N.; Nhiem, N.X.; Tai, B.H.; Kiem, P.V.; Kim, S.H. Megastigmane Glycosides from Docynia indica and Their Anti-inflammatory Activities. Helv. Chim. Acta. 2016, 99, 681–686. [Google Scholar] [CrossRef]
- Loan, N.T.T.; Tan, H.T.M.; Tam, V.T.H.; Luan, C.L. Anti-obesity and body weight reducing effect of Docynia indica (Wall.) Decne fruit extract fractions in experimentally obese mice. VNU J. Sci. Nat. Sci. Technol. 2011, 27, 125–133. (In Vietnamese) [Google Scholar]
- Hoang, V.D.; Kim, Y.H.; Cuong, N.M. Triterpene Acids from Docynia Indica Fruits and Their Cytotoxic Activity. Vietnam J. Technol. 2018, 56, 199–204. [Google Scholar]
- Thu, N.T.B.; Tuan, V.V.; Thuong, P.T. Flavonoids and chlorogenic acid from ethyl acetate fraction of the fruits of Docynia indica. J. Med. Mater. 2015, 20, 283–285. (In Vietnamese) [Google Scholar]
- Km, S.; Ni, S.; Ps, N. Phytochemical Characterization and Biological Activities of Docynia indica (wall) Fruit Extracts. J. Mol. Genet. Med. 2016, 10, 2041–2045. [Google Scholar] [CrossRef]
- Brewer, M. Natural Antioxidants: Sources, Compounds, Mechanisms of Action, and Potential Applications. Compr. Rev. Food Sci. Food Saf. 2011, 10, 221–247. [Google Scholar] [CrossRef]
- Pourreza, N. Phenolic Compounds as Potential Antioxidant. Jundishapur. J. Nat. Pharm. Prod. 2013, 8, 149–150. [Google Scholar] [CrossRef]
- Chipurura, B.; Muchuweti, M.; Manditseraa, F. Effects of Thermal Treatment on the Phenolic Content and Antioxidant Activity of Some Vegetables. Asian J. Clin. Nutr. 2010, 2, 93–100. [Google Scholar] [CrossRef]
- Réblová, Z. Effect of temperature on the antioxidant activity of phenolic acids. Czech. J. Food Sci. 2012, 30, 171–175. [Google Scholar] [CrossRef]
- Ereifej, K.I.; Feng, H.; Rababah, T.M.; Tashtoush, S.H.; Al-U’Datt, M.H.; Gammoh, S.; Al-Rabadi, G.J. Effect of Extractant and Temperature on Phenolic Compounds and Antioxidant Activity of Selected Spices. Food Nutr. Sci. 2016, 7, 362–370. [Google Scholar] [CrossRef]
- Mandal, V.; Mohan, Y.; Hemalatha, S. Microwave assisted extraction—An innovative and promising extraction tool for medicinal plant research. Pharmacogn. Rev. 2007, 1, 7–18. [Google Scholar]
- Silva, E.; Rogez, H.; Larondelle, Y. Optimization of extraction of phenolics from Inga edulis leaves using response surface methodology. Sep. Purif. Technol. 2007, 55, 381–387. [Google Scholar] [CrossRef]
- Wang, S.; Chen, F.; Wu, J.; Wang, Z.; Liao, X.; Hu, X. Optimization of pectin extraction assisted by microwave from apple pomace using response surface methodology. J. Food Eng. 2007, 78, 693–700. [Google Scholar] [CrossRef]
- Rezzoug, S.; Boutekedjiret, C.; Allaf, K. Optimization of operating conditions of rosemary essential oil extraction by a fast controlled pressure drop process using response surface methodology. J. Food Eng. 2005, 71, 9–17. [Google Scholar] [CrossRef]
- Singleton, V.L.; Orthofer, R.; Lamuela-Raventos, R.M. Analysis of total phenols and other oxidation substrates and antioxidants by means of folin-ciocalteu reagent. Methods Enzymol. 1999, 299, 152–178. [Google Scholar]
- Jia, Z.S.; Tang, M.C.; Wu, J. The determination of flavonoid contents in mulberry and their scavenging effects on superoxide radicals. Food Chem. 1999, 64, 555–559. [Google Scholar]
- Pham, H.H. The Data Anlysis and Planning of Experiments in Chemical Research; Science and Technics Publishing House: Ha Noi, Vietnam, 2007; pp. 89–99. (In Vietnamese) [Google Scholar]
- Wang, L.; Qin, P.; Hu, Y. Study on the microwave-assisted extraction of polyphenols from tea. Front. Chem. Eng. China 2010, 4, 307–313. [Google Scholar] [CrossRef]
- Dent, M.; Dragović-Uzelac, V.; Penić, M.; Bosiljkov, T.; Levaj, B. The effect of extraction solvents, temperature and time on the composition and mass fraction of polyphenols in Dalmatian wild sage (Salvia officinalis L.) extracts. Food Technol. Biotechnol. 2013, 51, 84–91. [Google Scholar]
- Su, D.; Li, H.; Lu, C. Microwave Extraction of Polyphenol from Pomegranate Seed. Asian J. Bot. (Transferred) 2018, 1, 36–46. [Google Scholar]
- Friedman, M.; Jürgens, H.S. Effect of pH on the Stability of Plant Phenolic Compounds. J. Agric. Food Chem. 2000, 48, 2101–2110. [Google Scholar] [CrossRef]
- Sharma, P.B.; Handique, P.J.; Devi, H.S. Antioxidant properties, physico-chemical characteristics and proximate composition of five wild fruits of Manipur. India J. Food Sci. Technol. 2015, 52, 894–902. [Google Scholar] [CrossRef]
- Chiari, B.G.; Severi, J.A.; Pauli-Credendio, D.; Abackerli, P.; Sylos, C.M.D.; Vilegas, W.; Isaac, V.L.B. Assessment of the chemical profile, polyphenol content and antioxidant activity in extracts of Psidium guajava L. fruits. Int. J. Pharm. Pharm. Sci. 2012, 4, 331–336. [Google Scholar]
- Hemwimon, S.; Pavasant, P.; Shotipruk, A. Microwave-assisted extraction of antioxidative anthraquinones from roots of Morinda citrifolia. Sep. Purif. Technol. 2007, 54, 44–50. [Google Scholar] [CrossRef]


© 2019 by the authors. Licensee MDPI, Basel, Switzerland. This article is an open access article distributed under the terms and conditions of the Creative Commons Attribution (CC BY) license (http://creativecommons.org/licenses/by/4.0/).