Abstract
The sodium triple-quantum (TQ) magnetic resonance (MR) signal created by interactions of sodium ions with macromolecules has been demonstrated to be a valuable biomarker for cell viability. The aim of this study was to monitor a cellular response using the sodium TQ signal during inhibition of Na/K-ATPase in living cancer cells (HepG2). The cells were dynamically investigated after exposure to 1 mM ouabain or K+-free medium for 60 min using an MR-compatible bioreactor system. An improved TQ time proportional phase incrementation (TQTPPI) pulse sequence with almost four times TQ signal-to-noise ratio (SNR) gain allowed for conducting experiments with 12–14 × 106 cells using a 9.4 T MR scanner. During cell intervention experiments, the sodium TQ signal increased to 138.9 ± 4.1% and 183.4 ± 8.9% for 1 mM ouabain (n = 3) and K+-free medium (n = 3), respectively. During reperfusion with normal medium, the sodium TQ signal further increased to 169.2 ± 5.3% for the ouabain experiment, while it recovered to 128.5 ± 6.8% for the K+-free experiment. These sodium TQ signal increases agree with an influx of sodium ions during Na/K-ATPase inhibition and hence a reduced cell viability. The improved TQ signal detection combined with this MR-compatible bioreactor system provides a capability to investigate the cellular response of a variety of cells using the sodium TQ MR signal.
1. Introduction
The intracellular sodium concentration in cells is tightly regulated by the Na/K-ATPase. This ATP-driven pump consumes up to two-thirds of the available cellular energy to maintain a sodium concentration gradient between the intra- and extracellular space [1,2]. Coupled transporters use this stored energy in the electrochemical gradient to transport solutes across the cell membrane. The sodium concentration gradient is also the underlying basis for the excitability of muscle cells and for the electric signaling between neurons [3]. Irreversible damages and a breakdown of the energy supply cause a failure of the Na/K-ATPase, which results in an influx of sodium ions followed by an influx of water leading to cell swelling. Consequently, the cell viability is linked to the sodium concentration gradient and alterations thereof reflect the early onset of pathophysiological changes.
Sodium magnetic resonance (MR) signals provide non-invasive information about cell physiology and viability [4,5,6,7,8]. For instance, the sodium single-quantum (SQ) signal reflects the mean tissue sodium level, which is a weighted average of the intra- and extracellular sodium concentration. It was shown that the mean tissue sodium levels rise in multiple conditions, such as stroke [9,10] and cancer [11,12,13], and therefore provide valuable information about cell viability. However, the mean tissue sodium level cannot discriminate between an increased intracellular sodium concentration and an increased extracellular space [14]. The sodium nucleus with a spin of 3/2 can also create multi-quantum coherences during ion binding [15]. Interactions of the positively charged sodium ions with surrounding electrical field gradients created by electro-negative groups within macromolecules yield a sodium triple-quantum (TQ) signal. These charged groups include carboxyl, hydroxyl and phosphate groups of proteins, nucleic acids and carbohydrates [16]. This intrinsic selectivity of the sodium TQ signal results in a large contribution of the intracellular sodium concentration of approximately 30-70% to the total sodium TQ signal [17,18,19,20,21,22,23,24]. Correlation of sodium TQ signal increase and the loss of cell viability was demonstrated in experiments with a perfused rat heart system [17,21,22,25,26,27], brain ischemia [28] and tumors [29,30]. In the perfused rat heart system, Schepkin et al. [22] showed that the sodium TQ signal correlated linearly with the intracellular sodium concentration determined by destructive methods during intracellular sodium loading using a variety of Na/K-ATPase inhibitions. Based on these findings, Schepkin et al. [26] demonstrated that the viability of myocytes was better conserved during multi-dose cardioplegia which was preserving the sodium TQ signal and heart rate pressure product. Eykyn et al. [18] also revealed a linear correlation of the ratio of TQ and double-quantum (DQ) signal to intracellular sodium concentration determined by shift reagent in the perfused mouse heart system. A linear dependence of the sodium TQ signal on the intracellular sodium concentration represents an attractive feature to quantify cellular responses.
To non-invasively investigate living cells by nuclear magnetic resonance (NMR), Gottwald et al. [31] recently proposed an MR-compatible bioreactor system. This bioreactor system features an organotypic 3D cell culture cultivated on a collagenized microcavity array (MCA) within a finely tunable environment. An external perfusion pump continuously supplies the 3D cell culture with fresh medium containing nutrients and oxygen. The excellent filling and washout characteristics of this bioreactor design allow the monitoring of the cellular response to pharmaceutical treatments by NMR [31]. Previous studies investigated the cellular heat shock response by chemical exchange saturation transfer MR signal [32] and ischemia by sodium TQ MR signal [33,34]. An initial investigation of the cellular response of HepG2 cells to an inhibition of the Na/K-ATPase by ouabain and simultaneous stop of perfusion in this bioreactor system yielded a reduction in the sodium TQ signal [35]. This contradicts others who found an influx of sodium ions and a subsequent increase in sodium TQ signal [18,22,27]. Most likely it was due to the use of a perfusion stop and a very weak TQ signal-to-noise ratio (SNR) [35], which was dramatically improved in the current study. Hoesl et al. [33,34] demonstrated that a stop of the perfusion reduces the sodium TQ signal using the same bioreactor system. This reduction in the sodium TQ signal due to the perfusion stop potentially interferes with the increase in the sodium TQ signal due to the Na/K-ATPase inhibition [18,22,27]. Therefore, the aim of the current study was to investigate the feasibility of monitoring intracellular sodium changes caused solely by an inhibition of the Na/K-ATPase of living cells in this MR-compatible bioreactor system using the sodium TQ signal.
In the current study, the capability of monitoring intracellular sodium changes by the sodium TQ signal was verified by inhibition of the Na/K-ATPase of HepG2 cells for 60 min using an MR-compatible bioreactor system at 9.4 T. An improved TQ time proportional phase incrementation (TQTPPI) pulse sequence was developed. The modification allowed us to achieve several times gain in TQ SNR, while preserving the simultaneous measurement of the SQ and TQ signals at distinct frequencies. To obtain the maximum sodium TQ signal from the 3D cell culture in this bioreactor system, the sodium TQ signal was optimized and the individual contribution of medium and cells to the total sodium TQ signal was determined. With this optimized TQ signal detection, the cellular response to 1 mM ouabain (n = 3) or 0 mM K+-free medium (n = 3) in six independent cell cultures was investigated using 12–14 × 106 cells in each experiment.
2. Materials and Methods
MR measurements were performed using a 9.4 T preclinical MR scanner (Bruker Biospec 94/20, Ettlingen, Germany). The comparison of the standard and the fixed TQTPPI pulse sequences was done using agarose samples and a linear polarized 1H/23Na/39K Bruker volume coil with an inner diameter of 40 mm. The length of its sodium coil was 42 mm.
In the cell experiments with the MR-compatible bioreactor system, an in-house built surface coil with a single loop of diameter 35 mm was used.
The evaluation of perfusion characteristics of our bioreactor system was performed using a 1H MR contrast agent. For this measurement, a quadrature 1H Bruker volume coil was combined with a Bruker rat receiver surface array.
2.1. Model Solutions
The comparison of the fixed TQTPPI pulse sequence with the standard TQTPPI pulse sequence was assessed using three samples with [2,4,6] % agarose and 134.75 mM NaCl. The size of these samples was: diameter = 28 mm, length = 75 mm and volume = 35 mL.
2.2. MR-Compatible Microcavity Array-Based Bioreactor System
A detailed description of the MR-compatible bioreactor system (Figure 1) can be found in Gottwald et al. [31,36] and Kleimaier et al. [32]. This bioreactor system contains an organotypic 3D cell culture on a polycarbonate MCA, which consists of 634 cavities with a depth of 250 μm and a diameter of 300 μm on an area of 1 × 1 cm2 (Figure 1b). This MCA was first hydrophilized and then collagenized by a collagen I-solution (0.24 mg/mL). In the final step, a drop of 150 μL medium containing 6–7 × 10⁶ hepatoblastoma cells of line HepG2, which were prepared according to previous reports [31,37,38], was pipetted on the collagen-coated MCA. The HepG2 cell line, HB-8065, was obtained from ATCC (Manassas, USA).
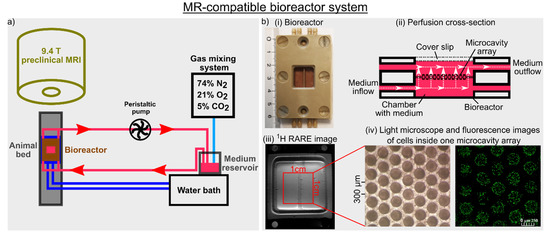
Figure 1.
(a) Graphical illustration of the magnetic resonance (MR)-compatible bioreactor setup. A peristaltic pump perfused a 3D cell culture at a perfusion speed of 400 μL/min with fresh medium under normoxic conditions at 37 °C. A change to a new medium was achieved by switching a three-way cock. (b) (i) Bioreactor dimension, (ii) cross-section of the bioreactor with perfusion of the medium indicated by white arrows, (iii) 1H high-resolution rapid acquisition relaxation enhanced (RARE) image of the bioreactor containing two microcavity arrays (MCAs) and (iv) light microscope and fluorescence images of cells inside one MCA are shown. The fluorescence image visualizes the cytoplasm of the cells using CellTracker green. Adapted with permission from Kleimaier et al. [32] published by Springer Nature.
After initial cultivation of the cells on the MCA, two MCAs with the upper array placed upside down were used in the bioreactor. The peristaltic pump actively perfused the 3D cell culture located inside the MCAs within the bioreactor at a perfusion speed of 400 μL/min with fresh medium through the pores of the MCAs (Figure 1). The medium consisted of minimum essential medium (MEM) with 10% fetal bovine serum, 1% glutamax, 1% non-essential amino acids, 1% sodium pyruvate, 1% penicillin-streptomycin and 0.1% phenol red.
The 0 mM K+ medium consisted of 1.8 mM CaCl2, 0.8 mM MgSO4, 26.2 mM NaHCO3, 117.2 mM NaCl, 1.0 mM NaH2PO4-H2O and 5.6 mM glucose. This formulation of the 0 mM K+ medium is based on the formulation of MEM without amino acids, vitamins and 5.3 mM KCl. A gas mixing system aerated the medium with 74% N2, 21% O2 and 5% CO2. The addition of phenol red to the normal medium allowed monitoring the pH during the MR measurements. The pH measurement was an in-line and off-line measurement according to Biechele et al. [39]. To achieve a temperature of 37 °C inside the bioreactor, the animal bed, on which the bioreactor and parts of the tubes were placed, was heated by a water bath inside the magnet. In addition, the medium reservoir and the tubes from the medium reservoir to the animal bed were heated by a second water bath. The temperature was regularly controlled with an infrared thermometer. The temperature measurement was also an in-line and off-line measurement.
The Na/K-ATPase was inhibited by 1 mM ouabain (n = 3) or by 0 mM K+ medium (n = 3) for 60 min by switching a three-way cock, which was connected to a bottle with normal medium and a bottle with 1 mM ouabain or 0 mM K+ medium. After 60 min perfusion with 1 mM ouabain or 0 mM K+ medium, the 3D cell cultures were reperfused with normal medium for 250 min. Unless otherwise indicated, experiments were repeated independently three times.
The MR scanner safety rules require the placement of the peristaltic pump outside the radiofrequency (RF) shielded scanner room. This results in a long tube length of approximately 2.5 m between the bioreactor and the medium reservoir. To determine the delay between the switching of the three-way cock and the arrival of a new medium inside the bioreactor, we used the MR contrast agent Dotarem (Guebert, France) with a concentration of 2 mM combined with a T1-weighted rapid acquisition relaxation enhanced (RARE) 1H imaging pulse sequence (Figure 2). The determination of the perfusion characteristic represents an in-line and quasi-on-line measurement. The RARE pulse sequence parameters were: TR = 1 s, TE = 4.6 ms, RARE factor 4, 5 averages, 92 repetitions, imaging matrix = 256 × 128, slice thickness 1 mm, field of view = 50 × 35 cm2, 8 slices and a scan duration of 2 min. In this experiment, the bioreactor did not contain an MCA. The start of the 2 mM Dotarem medium was around 2 min. This medium was perfused into the circulation system for 60 min followed by a reperfusion with normal medium for 120 min. An imaging slice, in the place which would contain the 3D cell culture in the presence of MCAs, was selected and a region of interest (ROI) containing both compartments was drawn (Figure 2). The mean signal intensity in the ROI was normalized to the first 20 min. The Dotarem medium reached the bioreactor 28 min after the bolus start. From approximately 54 min until 90 min after the bolus start, the Dotarem medium was homogeneously distributed in the bioreactor. The bolus was completely removed from the bioreactor 118 min after the bolus start. This confirmed the excellent filling and washout characteristics determined by Gottwald et al. [31].
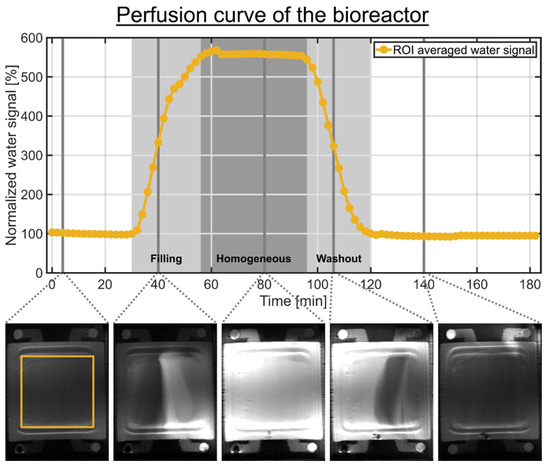
Figure 2.
Perfusion curve of the bioreactor without MCA determined by a 60 min bolus containing 2 mM Dotarem medium. Selected 1H RARE images are shown below the time course. The bolus start was around 2 min. The two light gray shaded backgrounds indicate the filling and washout of the bolus in the bioreactor, while the dark gray shaded background indicates the homogeneous distribution of the bolus in the bioreactor. The signal time course of each compartment represents the mean signal intensity of a ROI containing both compartments. An imaging slice, in the place which would contain the 3D cell culture in the presence of MCAs, was selected. The following time points are relative to the bolus start. After 28 min, the Dotarem bolus reached the bioreactor. From approximately 54 min until 90 min, the bolus was homogeneously distributed in the bioreactor. After 118 min, the bolus was completely removed from the bioreactor.
2.3. Sodium TQ MR Spectroscopy
In this study, we used the TQTPPI technique to simultaneously detect the SQ and TQ signals at distinct frequencies [40,41]. The standard TQTPPI pulse sequence [16] yields an equal optimal detection of the sodium TQ signals for a wide range of ion interaction strengths. Therefore, it does not result in a maximum TQ signal sensitivity. A fixed TQTPPI pulse sequence was developed, which increases the TQ signal sensitivity by using a maximum TQ signal at a fixed inter-pulse delay but preserves the phase modulation.
2.3.1. Standard TQTPPI Pulse Sequence
A detailed description of the standard TQTPPI pulse sequence can be found in previous reports [16,33,42]. The TQTPPI pulse sequence consisted of three 90° RF pulses and one 180° refocusing RF pulse, which was set in the middle between the first two 90° RF pulses (Figure 3a). This refocusing RF pulse compensates for B0 inhomogeneity during the evolution time (τevo). In the standard TQTPPI pulse sequence, the RF phase α = 90° + (ns – 1) × 45° and the evolution time τevo = τmin,evo + (ns – 1) × Δτevo are simultaneously incremented. The RF phase increment by 45° results in eight phase steps to cover a full rotation of 360°. The number of phase cycles nPC describes how many times these eight phase steps are repeated. This yields a total number of phase increments of ns = 8 × nPC. The RF phase of the second 90° RF pulse β = α ± 90° was alternated and the signals were added during each time increment to suppress the DQ signal.
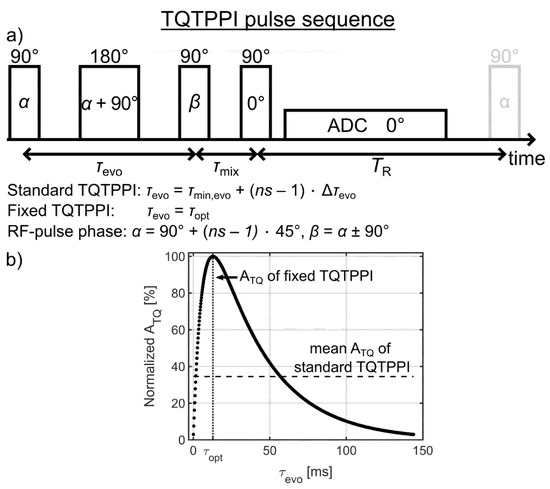
Figure 3.
(a) The triple-quantum time proportional phase incrementation (TQTPPI) pulse sequence. In the standard TQTPPI pulse sequence, the radiofrequency (RF) phase α = 90° + (ns – 1) × 45° and the evolution time τevo = τmin,evo + (ns – 1) × Δτevo are simultaneously incremented. For the proposed fixed TQTPPI pulse sequence, the evolution time is optimized and fixed throughout the pulse sequence. The RF phase of the second 90° RF pulse β = α ± 90° was alternated and the output signals were added during each phase increment α to suppress double-quantum (DQ) signals. (b) Exemplary buildup of the TQ signal using the relaxation times of the sample with 4% agarose in 134.75 mM NaCl (Table 1). The evolution time increment in the standard TQTPPI pulse sequence samples the whole triple-quantum (TQ) free induction decay (FID). This results in a lower mean ATQ amplitude compared to the ATQ amplitude at the optimal evolution time, which is used in the fixed TQTPPI pulse sequence.
Sequence parameters for the standard TQTPPI pulse sequence were: TR = 300 ms; 2048 complex points; 50 μs sampling rate; Δτevo = 200 μs; the range of τevo = 0.1–143.9 ms; τmix = 42–44 μs; ns = 720; 1 average; scan time of 8.92 min. Each measurement was repeated three times.
Data analysis was performed using Matlab (Mathworks, Natick, MA, USA). To reconstruct the TQTPPI data set, the free induction decay (FID) of the first regular FID at the minimum evolution time τmin,evo was Fourier-transformed and the spectrum was phase-corrected by an automatic phasing. All subsequent regular FIDs acquired at the other evolution times were phase corrected by the previously found phase correction. Then all spectra were stacked along the evolution time axis. The sodium spectral peak height constituted the amplitudes of the standard TQTPPI FID in a second dimension (Figure 4a). A Fourier transformation of this TQTPPI FID results in a standard TQTPPI spectrum showing an SQ and a TQ signal at the distinct frequencies (Figure 4c).
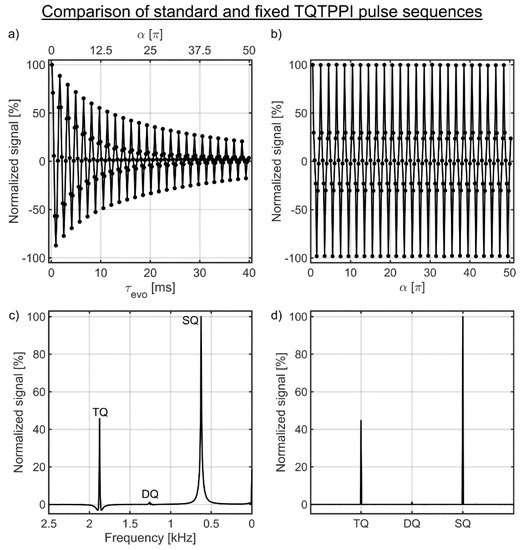
Figure 4.
(a,b) show the standard and the fixed TQTPPI FID of the sample with 4% agarose in 134.75 mM NaCl, respectively. The corresponding standard and fixed TQTPPI spectrum are shown in (c,d), respectively. (a) The evolution time increment samples the TQ signal for a wide range of ion interaction strengths, which allows correcting the TQ signal for changes in the transverse relaxation times. The RF phase increment causes oscillations in the single-quantum (SQ) and TQ signals, which yields SQ and TQ signals at distinct frequencies after Fourier transformation. (b) The signal of the fixed TQTPPI FID oscillates only between the maximum and minimum signal due to the RF phase increment and a fixed evolution time. (c) Lorentzian functions represent the different coherences in the standard TQTPPI spectrum, while the coherences in the fixed TQTPPI spectrum are close to delta functions as shown in (d).
For quantification of the SQ and TQ signals, the TQTPPI FID was fitted by [16]:
S(τevo) = ASQS sin(ωτevo + φ1) exp(−τevo/T2S) + ASQF sin(ωτevo + φ1) exp(−τevo/T2F) + ATQ
sin(3ωτevo + φ2)(exp(−τevo/T2F) − exp(−τevo/T2S)) + DC,
sin(3ωτevo + φ2)(exp(−τevo/T2F) − exp(−τevo/T2S)) + DC,
The amplitudes of the slow and fast sodium SQ relaxation components are ASQS and ASQF, respectively. The total SQ amplitude is ASQ = ASQS + ASQF. The respective slow and fast transverse relaxation times are T2S and T2F. The TQ amplitude is ATQ. The frequency of the phase rotation of the SQ component in the standard TQTPPI FID is given by ω = 2π*625 Hz. The phases φ1 and φ2 compensate for possible hardware phase shifts. The DC is a baseline offset. To compare the performance of the fixed TQTPPI pulse sequence with the standard TQTPPI pulse sequence, ASQ and ATQ of the standard TQTPPI pulse sequence were corrected to the optimal evolution time τopt, which was set for the fixed TQTPPI pulse sequence, using Equation (1). The TQ SNR was calculated by division of ATQ by the standard deviation of ATQ determined from the fit.
2.3.2. Fixed TQTPPI Pulse Sequence
The proposed fixed TQTPPI pulse sequence allows achieving several times gain in the sodium TQ SNR. In contrast to the sodium SQ signal, which is maximum at minimum evolution time, the TQ signal has a characteristic build up interval with the maximum TQ signal at an optimal evolution time, which depends on the transverse relaxation times (Figure 3b). Hence, the sampling of the standard TQTPPI FID by incrementing the evolution time represents an elegant way for equal optimal detection of a wide range of ion interaction strengths. However, the evolution time increment results in a lower mean TQ amplitude compared to a fixed evolution time, which is set to the optimal evolution time (Figure 3b).
The fixed TQTPPI pulse sequence also comprised three 90° RF pulses and one 180° refocusing RF pulse (Figure 3a). Compared to the standard TQTPPI pulse sequence, the evolution time was optimized and fixed throughout the pulse sequence. The RF phase increment by 45° results again in eight phase steps to cover a full rotation of 360°. Before each RF phase increment, the RF phase of the second 90° RF pulse β = α ± 90° was alternated and the signal of these two RF phase alterations were added to suppress DQ signals. The phase cycle of eight steps was repeated to yield a total number of phase increments of ns = 8 × nPC. The larger number of phase increments yields a greater separation of different coherence orders in the fixed TQTPPI spectrum and a better SNR for the SQ and TQ MR signals (Figure 4d).
There are two equivalent methods to determine the optimal evolution time for maximum TQ signal. They are the use of the standard TQTPPI pulse sequence or a variation of the evolution time using the fixed TQTPPI pulse sequence. In the case of a sufficient TQ SNR, the standard TQTPPI pulse sequence can be used to extract the transverse relaxations. The optimal evolution time can then be calculated according to:
τopt = ln(T2S/T2F)/(1/T2F − 1/T2S).
This τopt was employed for the comparison of the standard and the fixed TQTPPI pulse sequences using agarose samples. For a low TQ SNR, a variation of the evolution time of the fixed TQTPPI pulse sequence is preferable for the estimation of the optimal evolution time. This method was used to optimize the TQ signal from cells in the bioreactor system.
The reconstruction of the fixed TQTPPI FID is similar to the standard TQTPPI FID. The first regular FID was Fourier-transformed and the spectrum was phase corrected by an automatic phase correction. Then the found phase correction was applied to all other regular FIDs and the spectra were stacked along the RF phase increment axis. The sodium spectral peak heights constituted the amplitudes of the fixed TQTPPI FID (Figure 4b). A Fourier transformation of this fixed TQTPPI FID results in the fixed TQTPPI spectrum showing an SQ and a TQ signal at the distinct frequencies (Figure 4d).
The amplitudes of the SQ and TQ signals were quantified by a non-linear fit of the fixed TQTPPI FID:
S(α) = ASQ(τevo) sin(α + φ1) + ATQ(τevo) sin(3α + φ2) + DC.
In contrast to the standard TQTPPI FID, the fixed TQTPPI FID does not contain any contributions from relaxation effects (cf. Figure 4a,b), as the evolution time is fixed throughout the pulse sequence. The remaining oscillations in the fixed TQTPPI FID are caused by the RF phase incrementation as shown in Figure 4b.
To compare the performance of the fixed TQTPPI pulse sequence with the standard TQTPPI pulse sequence, the TQ SNR gain and the transverse relaxation times were investigated. A variation of the evolution time in the fixed TQTPPI pulse sequence allows the calculation of the transverse relaxation times by fitting the SQ and TQ amplitudes according to their transfer function [40,43]:
ASQ(τevo) = ASQS exp(−τevo/T2S) + ASQF exp(−τevo/T2F) + DC.
ATQ(τevo) = ATQ (exp(−τevo/T2S) − exp(−τevo/T2F)) + DC.
Equations (4) and (5) were simultaneously fitted to the measured ASQ and ATQ using nonlinear data fitting, respectively. This simultaneous fitting of both equations mirrors the standard TQTPPI FID fit, where the transverse relaxation times are simultaneously fitted to the FID consisting of SQ and TQ signals. For the fixed TQTPPI pulse sequence, we report the transverse relaxation times and the 95% confidence intervals determined by the nonlinear fit. The fixed TQTPPI pulse sequence parameters for the comparison of both pulse sequences were: TR = 300 ms; 2048 complex points; 50 μs sampling rate; τevo = [18.6, 12.8, 10.2] ms for the [2, 4, 6]% agarose samples, respectively; τmix = 42–44 μs; ns = 720; 1 average; 3 repetitions and a scan time of 7.2 min. To determine the transverse relaxation times, 43–46 non-equidistant evolution times in the range of 0.1 to 120 ms were acquired. In the cell experiments the fixed TQTPPI pulse sequence parameters were: TR = 300 ms; 2048 complex points; 50 μs sampling rate; τevo = 10 ms; τmix = 57–61 μs; ns = 480; 1 average and a scan time of 4.2 min. To determine the optimal evolution time for maximal TQ signal, the evolution time was varied in the range of 5 to 25 ms with an evolution time step of 5 ms. This TQ signal optimization was performed for three cell cultures before the Na/K-ATPase inhibition and two cell cultures after the Na/K-ATPase inhibition. The time after the Na/K-ATPase inhibition corresponded to approximately 6 h after the dynamic measurements of the Na/K-ATPase inhibition.
Dynamic measurements of the sodium TQ signal during the Na/K-ATPase inhibitions were performed from 20 min before the bolus start until 250 min after the bolus stop. The ratio ATQ/ASQ was calculated where the background TQ signal of the normal medium or the 0 mM K+ medium was subtracted from the ATQ/ASQ time course. Then the time course of ATQ/ASQ was normalized to the first 37 min and denoised by a wavelet denoising using Matlab [44]. Finally, the mean and the standard deviation of the three denoised ATQ/ASQ time courses for each Na/K-ATPase inhibition were calculated. The dynamic measurements of the sodium TQ signal represent an in-line and quasi-on-line measurement according to Biechele et al. [39].
The baseline of the temporal signal fluctuations was evaluated separately in an additional control experiment with cells but without intervention.
An additional perfusion curve of the bioreactor was obtained without a contrast agent by using the sodium SQ signal during the Na/K-ATPase inhibition experiments with 0 mM K+ medium. In these experiments, the bioreactor contained two MCAs with cells, which is in contrast to the experiment using the MR contrast agent (Figure 2). The sodium SQ signal was normalized to the first 37 min. Then the average of the normalized ASQ was calculated from the three Na/K-ATPase inhibitions reported here and from three further experiments. This averaged ASQ time course was smoothed using a smoothing spline [45].
2.4. Statistical Analysis
The alterations in the sodium TQ signal during the Na/K-ATPase inhibition and during reperfusion with normal medium were compared to the control experiment without intervention by using a single-factor analysis of variance (anova) followed by a multiple comparison test. In addition, the optimal evolution time after the Na/K-ATPase inhibition was compared to the optimal evolution time before the Na/K-ATPase inhibition using the same statistical test. The change in sodium TQ signal was stated statistically significant if p < 0.01.
3. Results
3.1. Comparison of the Standard and the Fixed TQTPPI Pulse Sequences
The comparison of the FID fit results of the standard and the fixed TQTPPI pulse sequences using the agarose samples can be found in Table 1. It is important to note that the amplitudes ASQ and ATQ of the standard TQTPPI FID were taken for the optimal evolution time, which was set for the fixed TQTPPI pulse sequence. The values of ASQ, ATQ and ATQ/ASQ for both pulse sequences agreed within the 95% confidence interval determined by the nonlinear fit. The fixed TQTPPI pulse sequence with the fixed evolution time yielded an expected theoretical TQ SNR gain in the range of 2.4 to 3.2 for the agarose samples compared to the standard TQTPPI pulse sequence with the evolution time increment. The measured TQ SNR gain calculated from ATQ and its standard deviation was in the range of 3.2 to 3.8. This higher TQ SNR gain could be explained by fewer fitting parameters for the fixed TQTPPI FID fit compared to the standard TQTPPI FID fit. The variation of the evolution time for the fixed TQTPPI pulse sequence also yielded the same values for T2S, T2F and τopt within the 95% confidence interval. In summary, the fixed TQTPPI pulse sequence resulted in the identical parameters for ASQ, ATQ and the transverse relaxation times compared to the standard TQTPPI pulse sequence. However, the fixed TQTPPI pulse sequence yields an improved TQ signal sensitivity (Table 1), as the evolution time is optimized and fixed throughout the pulse sequence (Figure 3b).

Table 1.
Comparison of standard and fixed TQTPPI FID fit results. The values of ASQ and ATQ from the standard TQTPPI pulse sequence were corrected to the optimal evolution time, which was set for the fixed TQTPPI pulse sequence, by using Equation (1). The transverse relaxation times of the fixed TQTPPI pulse sequence were determined by a variation of the evolution time followed by a simultaneously fit of ASQ and ATQ using Equations (4) and (5), respectively.
3.2. Contributions to the Sodium TQ Signal from the Bioreactor
Figure 5a shows the sodium TQ signal of 0 mM K+ medium, medium and a 3D cell culture on MCAs in medium for the optimized evolution time of 10 ms (Figure 5b). The tiny sodium TQ signal of ATQ/ASQ = 0.02 ± 0.01% from 0 mM K+ medium, which only contained inorganic salts and glucose, could be caused by incomplete relaxation as TR ≈ 3.6T1. Proteins in medium resulted in a small background sodium TQ signal of ATQ/ASQ = 0.04 ± 0.01%. The presence of a 3D cell culture of 12–14 × 106 HepG2 cells increased the sodium TQ signal by more than a factor of three to ATQ/ASQ = 0.13 ± 0.04%. This increase in sodium TQ signal is in accordance with a higher protein concentration of cells compared to medium. The protein concentration of 12–14 × 106 HepG2 cells is approximately 12–14 mg/mL, while the protein concentration in the medium is 3–4 mg/mL due to the supplement of 10% FBS [46]. Consequently, the sodium TQ signal from the bioreactor originated mainly from the 3D cell culture with a small background TQ signal from medium.
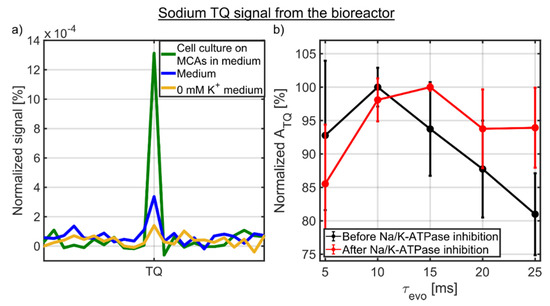
Figure 5.
(a) Sodium TQ signal of 0 mM K+ medium, medium and 3D cell culture on MCAs in medium from the bioreactor. The sodium TQ signal of ATQ/ASQ = 0.13 ± 0.04% mainly originated from the 3D cell culture of 12–14 × 106 HepG2 cells, while proteins in medium contributed to a small background TQ signal of ATQ/ASQ = 0.04 ± 0.01%. The even smaller TQ signal of ATQ/ASQ = 0.02 ± 0.01% from 0 mM K+ medium could be caused by incomplete relaxation. (b) Optimization of sodium TQ signal before and after the Na/K-ATPase inhibition. In both cases, an evolution time between 10 and 15 ms yielded the maximum sodium TQ signal.
The sodium TQ signal was optimized in the presence of a 3D cell culture (Figure 5b). Before the Na/K-ATPase inhibition, the evolution time of 10 ms yielded the maximum sodium TQ signal. Additional optimization experiments were performed after the Na/K-ATPase inhibition, which corresponded to approximately 6 h after the dynamic measurement as shown in Figure 6a. The sodium TQ signal was more than two times larger than during the optimization before the Na/K-ATPase inhibition. After the Na/K-ATPase inhibition, the optimal evolution time was in the range of 10 to 15 ms. Hence, within a standard deviation for ATQ and the evolution time step of 5 ms, the optimal evolution time did not significantly change before and after the Na/K-ATPase inhibition (p > 0.01).
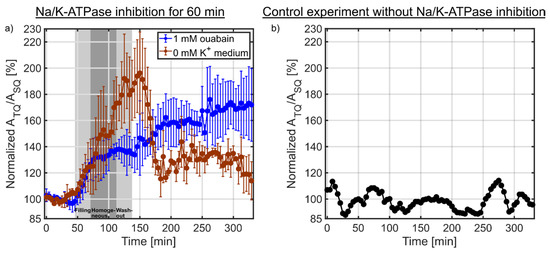
Figure 6.
(a) Dynamic measurements of the sodium TQ signal during the Na/K-ATPase inhibition for 60 min using 1 mM ouabain (n = 3) or 0 mM K+ medium (n = 3). The two light gray shaded backgrounds indicate the filling and washout of the bolus in the bioreactor, while the dark gray shaded background corresponds to the homogeneous distribution of the bolus in the bioreactor determined using the 1H MR contrast agent experiment (Figure 2). In both experiments, a similar initial increase in the sodium TQ signal was observed. The sodium TQ signal reached an intermediate plateau of 138.9 ± 4.1% (p < 0.01) for the ouabain experiment from 75–142 min, while in the 0 mM K+ medium experiment a plateau of 183.4 ± 8.9% (p < 0.01) was reached from 120-160 min. During reperfusion by normal medium, the sodium TQ signal further increased to 169.2 ± 5.3% (p < 0.01) for the ouabain experiment which indicated a loss of cell viability and further influx of sodium ions. In the experiment using 0 mM K+ medium, the sodium TQ signal decreased to 128.5 ± 6.8% (p < 0.01) during reperfusion, which indicated a partial restoration of Na/K-ATPase pump activity and partial cell viability. (b) Temporal stability of the sodium TQ signal in the presence of a 3D cell culture without Na/K-ATPase inhibition. The sodium TQ signal fluctuated only around the mean value.
3.3. Na/K-ATPase Inhibition
Figure 6a shows the results of the sodium TQ signal during the Na/K-ATPase inhibition using 1 mM ouabain or 0 mM K+ medium. After 20 min, the medium was switched to 1 mM ouabain or 0 mM K+ medium for 60 min. The gray shaded background indicates the time in which the inhibition solution arrives in the bioreactor and is washed out of the bioreactor. In the ouabain experiment, the sodium TQ signal showed an initial growth rate of ~1.09%/min from 46–75 min. Later, the growth rate decreased to ~0.05%/min from 75–142 min reaching an intermediate plateau of 138.9 ± 4.1% (p < 0.01). During reperfusion by normal medium, the growth rate increased to ~0.20%/min. A maximum TQ signal of 169.2 ± 5.3% (p < 0.01) was reached at the end of the measurement.
In the 0 mM K+ medium experiment, the sodium TQ signal increased with a similar initial growth rate of ~1.11%/min compared to the ouabain experiment. This initial growth rate was observed from 46–120 min. The period of the sodium TQ signal increase was much longer than in the ouabain experiment. A maximum TQ signal of 183.4 ± 8.9% (p < 0.01) was reached around 120–160 min. During reperfusion by normal medium, the TQ signal partially recovered to 128.5 ± 6.8% (p < 0.01) within 20 min. Later the TQ signal was relatively unchanged until the end of the measurement.
During the 0 mM K+ medium experiments, the sodium SQ signal increased during the filling of the bioreactor with the bolus (Figure 7). This was due to a minor difference in the sodium concentration between normal medium and 0 mM K+ medium. Such difference additionally allowed us to detect the time course of sodium intervention, but now it was observed in the presence of a 3D cell culture on MCAs. The sodium SQ signal increase occurred slightly earlier compared to the change in the water signal using an MR contrast agent (Figure 2). One possible explanation for this could be the use of a non-localized pulse sequence for the sodium measurement, as the medium entered at the bottom and the left the bioreactor on top (Figure 1b). In the 1H experiment, the perfusion characteristic was determined in a slice, which would contain the cell culture in the presence of MCAs. Consequently, this could explain the delay in the 1H measurement. Despite this minor deviation both perfusion curves were similar. The maximum sodium SQ signal was 103.9 ± 0.1% around 87.5–95.8 min, as shown in Figure 7. The 0 mM K+ medium contained only inorganic salts and glucose, which also caused a change in sodium relaxation times. The T1 and T2 values of the normal medium were 69.9 ± 0.6 ms and 63.2 ± 0.4 ms, while T1 and T2 values of 0 mM K+ medium were 72.2 ± 0.6 ms and 67.8 ± 0.6 ms, respectively. Based on a mono-exponential decay, this slight change in T2 value caused an SQ increase of 1.1 ± 0.2%. The remaining increase in the sodium SQ signal could be caused by a slightly increased sodium concentration in 0 mM K+ medium.
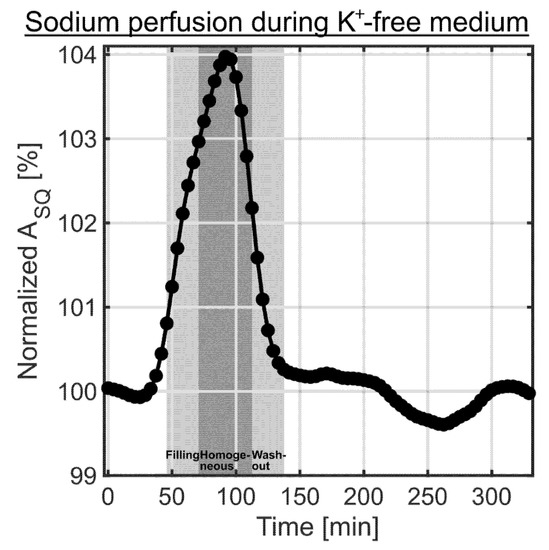
Figure 7.
Sodium SQ signal changes during the 0 mM K+ medium experiments (n = 6). The two light gray shaded backgrounds indicate the filling and washout of the bolus in the bioreactor, while the dark gray shaded background corresponds to the homogeneous distribution of the bolus in the bioreactor determined using the 1H MR contrast agent experiment (Figure 2). A slight increase in sodium relaxation times and in the sodium content for 0 mM K+ medium compared to normal medium resulted in the observed increase in the sodium SQ signal. The sodium perfusion curve during the 0 mM K+ experiments was acquired in the presence of a cell culture on MCAs. It agrees well with the perfusion curve determined using 1H MR contrast agent (Figure 2).
The sodium TQ signal potentially could also be altered by temporal signal fluctuations, which would confound the interpretation of sodium TQ signal changes during the perfusion with 1 mM ouabain or 0 mM K+ medium. Figure 6b shows the temporal stability of the sodium TQ signal in the presence of a 3D cell culture without Na/K-ATPase inhibition. The normalized sodium TQ signal fluctuated only around the mean value, while these fluctuations were smaller than the observed sodium TQ signal changes during the Na/K-ATPase inhibition using 1 mM ouabain or 0 mM K+ medium (Figure 6a).
4. Discussion
In the present study, the feasibility of monitoring intracellular sodium changes in living cancer cells was investigated by an inhibition of the Na/K-ATPase by 1 mM ouabain or by 0 mM K+ medium during 60 min of intervention. The time course of changes was non-invasively detected without contrast agents using the sodium TQ signal. The application of an MR-compatible bioreactor for 3D cell culture experiments allows a large flexibility with regard to cellular interventions. The combination with the non-invasive capability of MR is a promising research tool for a variety of applications and, in particular, in anti-cancer drug development.
It is well known that the perfusion of cells with 1 mM ouabain or 0 mM K+ medium causes an inhibition of the Na/K-ATPase [18,22,47,48,49]. This leads to an increase in the intracellular sodium concentration and subsequent growth of the sodium TQ signal (Figure 6a). The increase in sodium TQ signal results from an increase in sodium ions interacting with proteins, as the protein concentration inside the cells is higher compared to the medium. These interactions of sodium ions with negatively charged groups of macromolecules are necessary for the creation of a sodium TQ signal. The initial growth rates in both experiments were approximately the same, which was also observed in a perfused rat heart system [22]. In the ouabain experiments, after approximately 30 min the TQ signal reached an intermediate plateau with a substantially reduced growth rate. This is a common feature for high concentrations of ouabain that has also been observed in the perfused rat heart system [22] and for sheep heart Purkinje fibers [47,48]. Our experiments also demonstrate that 0 mM K+ perfusion can inhibit the Na/K-ATPase stronger than ouabain.
The reperfusion with normal medium in our experiments resulted in a further increase in the sodium TQ signal in the ouabain experiment. This continuation of sodium influx into the cells is an indication of irreversible cell damage during ouabain perfusion. It is in contrast to the 0 mM K+ medium experiment, where reperfusion with normal medium led to a partial recovery of the sodium TQ signal comparable to the results in the perfused rat heart [22]. This recovery despite the high intracellular load indicated a partial preservation of the Na/K-ATPase pump activity. The cells remained viable but with some irreversible functional change of the Na/K-ATPase, as the recovered sodium TQ signal was not the same as before the Na/K-ATPase inhibition (Figure 6a). There is no explanation yet, but in a comparable situation, the effect of ouabain could be irreversible, as a result from a slow dissociation of ouabain from their inhibitory binding sites [47,48].
In a previous study by our group [35], a reduction in the sodium TQ signal was observed during an exposure of HepG2 cells to 20 mM ouabain and a simultaneous stop of perfusion using this MR-compatible bioreactor system. This is contrary to the results in the current study and to the increase in the sodium TQ signal during ouabain perfusion observed by others [18,22,27]. In recent studies, Hoesl et al. [33,34] showed that a stop of perfusion caused a reduction in the sodium TQ signal using this MR-compatible bioreactor system. In the current study, we did not use a stop of the perfusion, as the reduction in the sodium TQ signal during a perfusion stop potentially interferes with the increase in the sodium TQ signal due to the Na/K-ATPase inhibition [18,22,27]. Consequently, the difference in the sodium TQ signal change in this study compared to the previous study [35] could be caused by the use of a perfusion stop. Compared to the previous study [35], we also achieved several times gain in TQ signal sensitivity using the fixed TQTPPI pulse sequence and in addition the cell number was doubled in the current bioreactor system.
In the perfused rat heart system [22], the sodium TQ signal increased to 190 ± 9% and ~265% for 30 min of 1 mM ouabain and 60 min of 0 mM K+ medium, respectively. These relative TQ signal increases are substantially larger compared to our study, where the TQ signal only increased by 138.9 ± 4.1% and 183.4 ± 8.9% for 60 min of 1 mM ouabain and 0 mM K+ medium, respectively. These lower TQ signal increases may be an indirect indication of a higher intracellular sodium concentration in cancer cells [50], which reduced the relative growth in intracellular sodium concentration and subsequently the sodium TQ signal. Changes in sodium relaxation times can be excluded as a cause for these lower TQ signal increases. The optimal evolution time for a maximum TQ signal did not substantially change between before and after the Na/K-ATPase inhibition (Figure 5b).
There are also other techniques to monitor changes in the intracellular sodium concentration compared to the sodium TQ signal. Several fluorescence dyes are commercially available, which require a fluorescence microscopy or flow cytometry and administration of the fluorescence dyes into the cells [51,52,53]. Dye leakage out of the cells, the shallow fluorescence penetration depth, photobleaching and cellular autofluorescence are some drawbacks of the fluorescence technique [51,52,53,54]. In contrast to the fluorescence technique, the MR technique is non-invasive, as it exploits the intrinsic property of the sodium nucleus. The main benefit of using the sodium TQ MR technique is the possibility to transfer it to in vivo studies. The sodium TQ signal is also not without its limitations. The sodium TQ signal has contributions from intra- and extracellular sodium [17,18,19,20,21,22,23,24]. Similar to the fluorescence dyes, a calibration of the sodium TQ signal as proposed by Schepkin et al. [22,26] allows the correlation of the sodium TQ signal to the intracellular sodium concentration in the presence of an unchanged extracellular sodium TQ signal and the exclusion of possible pH changes [42]. With respect to other MR techniques, only the administration of chemical shift reagents yields a separation of the intra- and extracellular sodium MR signals [24,55,56]. However, the toxicity of these compounds limits the in vivo applications [57]. The major benefit of the proposed technique is that the MR-compatible bioreactor system allows to perform a variety of interventions with a variety of cells and to correlate MR signal changes to cellular processes. Several efforts are already made to image the sodium SQ and TQ signals simultaneously in vivo, as both may represent valuable biomarkers for cell viability [58,59,60].
The fixed TQTPPI pulse sequence, where the evolution time is optimized and fixed throughout the pulse sequence, resulted in a measured TQ SNR gain of 3–4 times compared to the standard TQTPPI pulse sequence with the evolution time increment in a wide range (Table 1 and Figure 3b). This TQ SNR gain allowed us to detect the signal of only 12–14 × 106 cells (Figure 5a). In contrast to a commonly used TQ filtration pulse sequence [40], where the evolution time is also fixed throughout the pulse sequence, the fixed TQTPPI pulse sequence preserves the simultaneous measurement of SQ and TQ signals at distinct frequencies. In a TQ filtration pulse sequence, an appropriate phase cycle is chosen to cancel out SQ and DQ signals and the TQ signal is detected at the same frequency as the SQ and DQ signals. Consequently, the imperfect cancellation of SQ and DQ signals can interfere with the measurement of the TQ signal, especially when the TQ signals are weak. In the fixed TQTPPI pulse sequence no extra noise is introduced compared to the filtration procedure [16]. This allows a more sensitive detection of the TQ signal and its changes which was crucial in the current experiments. Furthermore, the internal SQ signal in the fixed TQTPPI pulse sequence represents a reference signal which is a valuable feature for in vivo applications.
The non-invasive capability of the MR technique to obtain a variety of physiological information resulted in a large effort to investigate living cells in bioreactor systems by MR [31,32,33,35,61,62,63,64,65,66,67,68,69,70,71,72,73,74,75]. In general, the low sensitivity of the MR technique requires a high cell density/number, which can be obtained by densely packed 3D cell cultures, to achieve a sufficient SNR within a high temporal resolution. In addition, the bioreactor system has to feature an active perfusion of cells with fresh medium, which supplies the cells with nutrients and oxygen. The active perfusion with fresh medium will maintain the cells under physiological metabolic conditions [73]. To supply the cells with oxygen, the medium in a medium reservoir needs to be aerated with the desired composition of N2, O2 and CO2. For long-term measurements, a pH control system is necessary to compensate for the metabolic activity of the cells [68,76]. A versatile bioreactor system or the possibility to extract the cells from the bioreactor system is beneficial to obtain complementary or additional information using other methods, e.g., fluorescence measurements [31,36,63].
The above-presented sodium TQ MR signal detection method could be used to non-invasively monitor the cellular response for a variety of cells upon disease progression or treatment-related changes in an isolated manner using the sodium TQ signal. In this direction, machine learning [77,78,79] or compressed sensing [80,81] approaches could further speed up the sodium TQ signal measurements, which would greatly assist the study of the involved cellular mechanisms. For these suggested long-term measurements, an electronic control unit to regulate the CO2 concentration could provide a precise control of the pH of the medium [39,76], as the metabolic activity of the cells can change the pH of the medium on a long term. In the current experiments, the influence of the metabolic activity of the cells on the pH of the medium could be excluded, as the medium reservoir contained approximately 80 mL medium and the cells were only placed in the bioreactor system for a maximum of 10 h.
5. Conclusions
Changes in the intracellular sodium concentration by the inhibition of the Na/K-ATPase of cancer cells were successfully detected using the sodium TQ signal with improved TQ signal detection. The fixed TQTPPI pulse sequence with a fixed and optimized evolution time resulted in several times gain in the TQ SNR compared to the standard TQTPPI pulse sequence, while it preserved the simultaneous measurement of SQ and TQ signals at distinct frequencies. This optimized TQ signal detection allowed us to achieve a cell sensitivity of 12–14 × 106 using an MR-compatible bioreactor system. Perfusion of cells with 1 mM ouabain or 0 mM K+ medium for 60 min yielded a substantial increase in the sodium TQ signal, due to the inhibition of the Na/K-ATPase and subsequent influx of sodium ions into the cell. Reperfusion by normal medium indicated irreversible cell damage during intervention implied by the further sodium influx in the ouabain experiment. Meanwhile the cells remained viable in the 0 mM K+ experiment and partially recovered the Na/K-ATPase pump activity. The MR-compatible bioreactor system with the improved sodium TQ signal detection provides the capability to investigate the cellular response for a variety of cells during disease progression or treatment-related interventions.
Author Contributions
V.S., E.G. and L.R.S. designed the experiments and worked on the MR-compatible bioreactor design. V.S. and L.R.S. provided supervision. D.K. performed the experiments and analyzed the data. D.K. and V.S. wrote the manuscript. C.N. prepared the bioreactor and cultivated the cells. V.S., C.N., E.G. and L.R.S. provided interpretation of the analyzed data and feedback. All authors have read and agreed to the published version of the manuscript.
Funding
Victor D. Schepkin would like to acknowledge the support from the National Science Foundation through NSF/DMR-1644779 and the state of Florida.
Acknowledgments
We cordially thank Thorsten Lau and Felix Hoerner from the Central Institute of Mental Health in Mannheim, Germany, for the access to the cell culture lab and support during MR experiments. In addition, we thank Matthias Malzacher for the construction of the RF coil and for answering all coil related questions.
Conflicts of Interest
The authors declare no conflict of interest.
References
- Clausen, M.V.; Hilbers, F.; Poulsen, H. The structure and function of the Na, K-ATPase isoforms in health and disease. Front. Physiol. 2017, 8, 371. [Google Scholar] [CrossRef] [PubMed]
- Alberts, B.; Johnson, A.; Lewis, J.; Raff, M.; Roberts, K.; Walter, P. Molecular Biology of the Cell; Garland Science: New York, NY, USA, 2017. [Google Scholar]
- Madelin, G.; Regatte, R.R. Biomedical applications of sodium MRI in vivo. J. Magn. Reson. Imaging 2013, 38, 511–529. [Google Scholar] [CrossRef] [PubMed]
- Hu, R.; Kleimaier, D.; Malzacher, M.; Hoesl, M.A.U.; Paschke, N.K.; Schad, L.R. X-nuclei imaging: Current state, technical challenges, and future directions. J. Magn. Reson. Imaging 2020, 51, 355–376. [Google Scholar] [CrossRef] [PubMed]
- Madelin, G.; Lee, J.S.; Regatte, R.R.; Jerschow, A. Sodium MRI: Methods and applications. Prog. Nucl. Magn. Reason Spectrosc. 2014, 79, 14–47. [Google Scholar] [CrossRef]
- Thulborn, K.R. Quantitative sodium MR imaging: A review of its evolving role in medicine. Neuroimage 2018, 168, 250–268. [Google Scholar] [CrossRef]
- Malzacher, M.; Chacon-Caldera, J.; Paschke, N.; Schad, L.R. Feasibility study of a double resonant 1 H/23 Na abdominal RF setup at 3T. Zeitschrift für Medizinische Physik 2019, 29, 359–367. [Google Scholar] [CrossRef]
- Lachner, S.; Ruck, L.; Niesporek, S.C.; Utzschneider, M.; Lott, J.; Hensel, B.; Dorfler, A.; Uder, M.; Nagel, A.M. Comparison of optimized intensity correction methods for 23 Na MRI of the human brain using a 32-channel phased array coil at 7 Tesla. Zeitschrift für Medizinische Physik 2020, 30, 104–115. [Google Scholar] [CrossRef]
- Neumaier-Probst, E.; Konstandin, S.; Ssozi, J.; Groden, C.; Hennerici, M.; Schad, L.R.; Fatar, M.A. Double-tuned 1 H/23 Na resonator allows 1 H-guided 23 Na -MRI in ischemic stroke patients in one session. Int. J. Stroke 2015, 10, 56–61. [Google Scholar] [CrossRef]
- Thulborn, K.R.; Davis, D.; Snyder, J.; Yonas, H.; Kassam, A. Sodium MR imaging of acute and subacute stroke for assessment of tissue viability. Neuroimaging Clin. N. Am. 2005, 15, 639–653. [Google Scholar] [CrossRef]
- Jacobs, M.A.; Ouwerkerk, R.; Wolff, A.C.; Gabrielson, E.; Warzecha, H.; Jeter, S.; Bluemke, D.A.; Wahl, R.; Stearns, V. Monitoring of neoadjuvant chemotherapy using multiparametric, 23Na sodium MR, and multimodality (PET/CT/MRI) imaging in locally advanced breast cancer. Breast Cancer Res. Treat. 2011, 128, 119–126. [Google Scholar] [CrossRef]
- Schepkin, V.D.; Ross, B.D.; Chenevert, T.L.; Rehemtulla, A.; Sharma, S.; Kumar, M.; Stojanovska, J. Sodium magnetic resonance imaging of chemotherapeutic response in a rat glioma. Magn. Reson. Med. 2005, 53, 85–92. [Google Scholar] [CrossRef]
- Zaric, O.; Pinker, K.; Zbyn, S.; Strasser, B.; Robinson, S.; Minarikova, L.; Gruber, S.; Farr, A.; Singer, C.; Helbich, T.H.; et al. Quantitative sodium MR imaging at 7 T: Initial results and comparison with diffusion-weighted imaging in patients with breast tumors. Radiology 2016, 280, 39–48. [Google Scholar] [CrossRef]
- Rooney, W.D.; Li, X.; Sammi, M.K.; Bourdette, D.N.; Neuwelt, E.A.; Springer, C.S., Jr. Mapping human brain capillary water lifetime: High-resolution metabolic neuroimaging. NMR Biomed. 2015, 28, 607–623. [Google Scholar] [CrossRef]
- Schepkin, V.D. Statistical tensor analysis of the MQ MR signals generated by weak quadrupole interactions. Zeitschrift für Medizinische Physik 2019, 29, 326–336. [Google Scholar] [CrossRef]
- Schepkin, V.D.; Neubauer, A.; Nagel, A.M.; Budinger, T.F. Comparison of potassium and sodium binding in vivo and in agarose samples using TQTPPI pulse sequence. J. Magn. Reson. 2017, 277, 162–168. [Google Scholar] [CrossRef] [PubMed]
- Dizon, J.M.; Tauskela, J.S.; Wise, D.; Burkhoff, D.; Cannon, P.J.; Katz, J. Evaluation of triple-quantum-filtered 23 Na NMR in monitoring of Intracellular Na content in the perfused rat heart: Comparison of intra-and extracellular transverse relaxation and spectral amplitudes. Magn. Reson. Med. 1996, 35, 336–345. [Google Scholar] [CrossRef] [PubMed]
- Eykyn, T.R.; Aksentijevic, D.; Aughton, K.L.; Southworth, R.; Fuller, W.; Shattock, M.J. Multiple quantum filtered 23 Na NMR in the Langendorff perfused mouse heart: Ratio of triple/double quantum filtered signals correlates with [Na]i. J. Mol. Cell. Cardiol. 2015, 86, 95–101. [Google Scholar] [CrossRef] [PubMed]
- Jelicks, L.A.; Gupta, R.K. On the extracellular contribution to multiple quantum filtered 23 Na NMR of perfused rat heart. Magn. Reson. Med. 1993, 29, 130–133. [Google Scholar] [CrossRef] [PubMed]
- Knubovets, T.; Shinar, H.; Navon, G. Quantification of the contribution of extracellular sodium to Na-23 multiple-quantum-filtered NMR spectra of suspensions of human red blood cells. J. Magn. Reson. 1998, 131, 92–96. [Google Scholar] [CrossRef]
- Schepkin, V.D.; Choy, I.O.; Budinger, T.F. Sodium alterations in isolated rat heart during cardioplegic arrest. J. Appl. Physiol. 1996, 81, 2696–2702. [Google Scholar] [CrossRef][Green Version]
- Schepkin, V.D.; Choy, I.O.; Budinger, T.F.; Obayashi, D.Y.; Taylor, S.E.; DeCampli, W.M.; Amartur, S.C.; Young, J.N. Sodium TQF NMR and intracellular sodium in isolated crystalloid perfused rat heart. Magn. Reson. Med. 1998, 39, 557–563. [Google Scholar] [CrossRef] [PubMed]
- Seshan, V.; Sherry, A.D.; Bansal, N. Evaluation of triple quantum-filtered 23 Na NMR spectroscopy in the in situ rat liver. Magn. Reson. Med. 1997, 38, 821–827. [Google Scholar] [CrossRef] [PubMed]
- Winter, P.M.; Bansal, N. Triple-quantum-filtered 23 Na NMR spectroscopy of subcutaneously implanted 9 L gliosarcoma in the rat in the presence of TmDOTP(5–1). J. Magn. Reson. 2001, 152, 70–78. [Google Scholar] [CrossRef]
- Choy, I.O.; Schepkin, V.D.; Budinger, T.F.; Obayashi, D.Y.; Young, J.N.; DeCampli, W.M. Effects of specific sodium/hydrogen exchange inhibitor during cardioplegic arrest. Ann. Thorac. Surg. 1997, 64, 94–99. [Google Scholar] [CrossRef][Green Version]
- Schepkin, V.D.; Choy, I.O.; Budinger, T.F.; Young, J.N.; DeCampli, W.M. Multi-dose crystalloid cardioplegia preserves intracellular sodium homeostasis in myocardium. J. Mol. Cell. Cardiol. 1999, 31, 1643–1651. [Google Scholar] [CrossRef][Green Version]
- Tauskela, J.S.; Dizon, J.M.; Whang, J.; Katz, J. Evaluation of multiple-quantum-filtered 23 Na NMR in monitoring intracellular Na content in the isolated perfused rat heart in the absence of a chemical-shift reagent. J. Magn. Reson. 1997, 127, 115–127. [Google Scholar] [CrossRef]
- LaVerde, G.; Nemoto, E.; Jungreis, C.A.; Tanase, C.; Boada, F.E. Serial triple quantum sodium MRI during non-human primate focal brain ischemia. Magn. Reson. Med. 2007, 57, 201–205. [Google Scholar] [CrossRef]
- Babsky, A.M.; Zhang, H.; Hekmatyar, S.K.; Hutchins, G.D.; Bansal, N. Monitoring chemotherapeutic response in RIF-1 tumors by single-quantum and triple-quantum-filtered 23 Na MRI, 1 H diffusion-weighted MRI and PET imaging. Magn. Reson. Imaging 2007, 25, 1015–1023. [Google Scholar] [CrossRef]
- Winter, P.M.; Poptani, H.; Bansal, N. Effects of chemotherapy by 1,3-bis(2-chloroethyl)-1-nitrosourea on single-quantum-and triple-quantum-filtered 23 Na and 31 P nuclear magnetic resonance of the subcutaneously implanted 9 L glioma. Cancer Res. 2001, 61, 2002–2007. [Google Scholar]
- Gottwald, E.; Kleintschek, T.; Giselbrecht, S.; Truckenmuller, R.; Altmann, B.; Worgull, M.; Dopfert, J.; Schad, L.; Heilmann, M. Characterization of a chip-based bioreactor for three-dimensional cell cultivation via magnetic resonance imaging. Zeitschrift für Medizinische Physik 2013, 23, 102–110. [Google Scholar] [CrossRef]
- Kleimaier, D.; Goerke, S.; Nies, C.; Zaiss, M.; Kunz, P.; Bachert, P.; Ladd, M.E.; Gottwald, E.; Schad, L.R. The cellular heat shock response monitored by chemical exchange saturation transfer MRI. Sci. Rep. 2020, 10, 11118. [Google Scholar] [CrossRef] [PubMed]
- Hoesl, M.A.U.; Kleimaier, D.; Hu, R.; Malzacher, M.; Nies, C.; Gottwald, E.; Schad, L.R. 23 Na triple-quantum signal of in vitro human liver cells, liposomes, and nanoparticles: Cell viability assessment vs. separation of intra-and extracellular signal. J. Magn. Reson. Imaging 2019, 50, 435–444. [Google Scholar] [CrossRef] [PubMed]
- Hoesl, M.A.U.; Wuestemann, T.; Malzacher, M.; Nies, C.; Gottwald, E.; Schad, L. Non-invasive assessment of myocardial cell viability based on 23 Na triple-quantum signal. Proc. Int. Soc. Magn. Reson. Med. 2019, 27, 4202. [Google Scholar]
- Neubauer, A.; Nies, C.; Schepkin, V.D.; Hu, R.; Malzacher, M.; Chacon-Caldera, J.; Thiele, D.; Gottwald, E.; Schad, L.R. Tracking protein function with sodium multi quantum spectroscopy in a 3D-tissue culture based on microcavity arrays. Sci. Rep. 2017, 7, 3943. [Google Scholar] [CrossRef] [PubMed]
- Gottwald, E.; Nies, C.; Wuchter, P.; Saffrich, R.; Truckenmuller, R.; Giselbrecht, S. A Microcavity Array-based 3D model system of the hematopoietic stem cell niche. Methods Mol. Biol. 2019, 2017, 85–95. [Google Scholar] [CrossRef] [PubMed]
- Altmann, B.; Giselbrecht, S.; Weibezahn, K.F.; Welle, A.; Gottwald, E. The three-dimensional cultivation of the carcinoma cell line HepG2 in a perfused chip system leads to a more differentiated phenotype of the cells compared to monolayer culture. Biomed. Mater. 2008, 3, 034120. [Google Scholar] [CrossRef]
- Gottwald, E.; Giselbrecht, S.; Augspurger, C.; Lahni, B.; Dambrowsky, N.; Truckenmuller, R.; Piotter, V.; Gietzelt, T.; Wendt, O.; Pfleging, W.; et al. A chip-based platform for the in vitro generation of tissues in three-dimensional organization. Lab Chip 2007, 7, 777–785. [Google Scholar] [CrossRef]
- Biechele, P.; Busse, C.; Solle, D.; Scheper, T.; Reardon, K. Sensor systems for bioprocess monitoring. Eng. Life Sci. 2015, 15, 469–488. [Google Scholar] [CrossRef]
- Jaccard, G.; Wimperis, S.; Bodenhausen, G. Multiple-quantum NMR spectroscopy of S = 3/2 spins in isotropic phase: A new probe for multiexponential relaxation. J. Chem. Phys. 1986, 85, 6282–6293. [Google Scholar] [CrossRef]
- Marion, D.; Wüthrich, K. Application of phase sensitive two-dimensional correlated spectroscopy (COSY) for measurements of 1 H-1 H spin-spin coupling constants in proteins. Biochem. Biophys. Res. Commun. 1983, 113, 967–974. [Google Scholar] [CrossRef]
- Kleimaier, D.; Schepkin, V.; Hu, R.; Schad, L.R. Protein conformational changes affect the sodium triple-quantum MR signal. NMR Biomed. 2020, 33, e4367. [Google Scholar] [CrossRef] [PubMed]
- Van der Maarel, J.R.C. Thermal relaxation and coherence dynamics of spin 3/2. I. Static and fluctuating quadrupolar interactions in the multipole basis. Concepts Magn. Reason. 2003, 19, 97–116. [Google Scholar] [CrossRef]
- Johnstone, I.M.; Silverman, B.W. Needles and straw in haystacks: Empirical Bayes estimates of possibly sparse sequences. Ann. Stat. 2004, 32, 1594–1649. [Google Scholar] [CrossRef]
- Reinsch, C.H. Smoothing by spline functions. Numer. Math. 1967, 10, 177–183. [Google Scholar] [CrossRef]
- Zheng, X.; Baker, H.; Hancock, W.S.; Fawaz, F.; McCaman, M.; Pungor, E., Jr. Proteomic analysis for the assessment of different lots of fetal bovine serum as a raw material for cell culture. Part IV. Application of proteomics to the manufacture of biological drugs. Biotechnol. Prog. 2006, 22, 1294–1300. [Google Scholar] [CrossRef] [PubMed]
- Deitmer, J.W.; Ellis, D. The intracellular sodium activity of cardiac Purkinje fibres during inhibition and re-activation of the Na-K pump. J. Physiol. 1978, 284, 241–259. [Google Scholar] [CrossRef] [PubMed]
- Ellis, D. The effects of external cations and ouabain on the intracellular sodium activity of sheep heart Purkinje fibres. J. Physiol. 1977, 273, 211–240. [Google Scholar] [CrossRef]
- Pike, M.M.; Frazer, J.C.; Dedrick, D.F.; Ingwall, J.S.; Allen, P.D.; Springer, C.S.; Smith, T.W. 23 Na and 39 K nuclear magnetic resonance studies of perfused rat hearts. Discrimination of intra- and extracellular ions using a shift reagent. Biophys. J. 1985, 48, 159–173. [Google Scholar] [CrossRef]
- Cameron, I.L.; Smith, N.K.; Pool, T.B.; Sparks, R.L. Intracellular concentration of sodium and other elements as related to mitogenesis and oncogenesis in vivo. Cancer Res. 1980, 40, 1493–1500. [Google Scholar]
- Amorino, G.P.; Fox, M.H. Intracellular Na + measurements using sodium green tetraacetate with flow cytometry. Cytometry 1995, 21, 248–256. [Google Scholar] [CrossRef]
- Gao, G.; Cao, Y.; Liu, W.; Li, D.; Zhou, W.; Liu, J. Fluorescent sensors for sodium ions. Anal. Methods 2017, 9, 5570–5579. [Google Scholar] [CrossRef]
- Yin, J.; Hu, Y.; Yoon, J. Fluorescent probes and bioimaging: Alkali metals, alkaline earth metals and pH. Chem. Soc. Rev. 2015, 44, 4619–4644. [Google Scholar] [CrossRef] [PubMed]
- Iamshanova, O.; Mariot, P.; Lehen’Kyi, V.; Prevarskaya, N. Comparison of fluorescence probes for intracellular sodium imaging in prostate cancer cell lines. Eur. Biophys. J. 2016, 45, 765–777. [Google Scholar] [CrossRef] [PubMed]
- Naritomi, H.; Kanashiro, M.; Sasaki, M.; Kuribayashi, Y.; Sawada, T. In vivo measurements of intra-and extracellular Na + and water in the brain and muscle by nuclear magnetic resonance spectroscopy with shift reagent. Biophys. J. 1987, 52, 611–616. [Google Scholar] [CrossRef]
- Navon, G. Complete elimination of the extracellular 23 Na NMR signal in triple quantum filtered spectra of rat hearts in the presence of shift reagents. Magn. Reson. Med. 1993, 30, 503–506. [Google Scholar] [CrossRef]
- Simor, T.; Lóránd, T.; Szöllösy, Á.; Gaszner, B.; Digerness, S.B.; Elgavish, G.A. 23 Na NMR shift reagents enhance cardiac staircase effect in isolated perfused rat hearts. NMR Biomed. 1999, 12, 267–274. [Google Scholar] [CrossRef]
- Fiege, D.P.; Romanzetti, S.; Mirkes, C.C.; Brenner, D.; Shah, N.J. Simultaneous single-quantum and triple-quantum-filtered MRI of 23 Na (SISTINA). Magn. Reson. Med. 2013, 69, 1691–1696. [Google Scholar] [CrossRef]
- Hoesl, M.A.U.; Schad, L.R.; Rapacchi, S. Efficient 23 Na triple-quantum signal imaging on clinical scanners: Cartesian imaging of single and triple-quantum 23 Na (CRISTINA). Magn. Reson. Med. 2020, 84, 2412–2428. [Google Scholar] [CrossRef]
- Worthoff, W.A.; Shymanskaya, A.; Shah, N.J. Relaxometry and quantification in simultaneously acquired single and triple quantum filtered sodium MRI. Magn. Reson. Med. 2018, 81, 303–315. [Google Scholar] [CrossRef]
- Bartusik-Aebisher, D.; Aebisher, D.; Czmil, A.; Mazur, D. Evaluation of MR relaxation times following trastuzumab treatment of breast cancer cells in a 3D bioreactor. Acta Pol. Pharm. 2020, 77, 35–41. [Google Scholar] [CrossRef]
- Carvalho, J.; Alves, S.; Castro, M.; Geraldes, C.; Queiroz, J.A.; Fonseca, C.P.; Cruz, C. Development of a bioreactor system for cytotoxic evaluation of pharmacological compounds in living cells using NMR spectroscopy. J. Pharmacol. Toxicol. Methods 2019, 95, 70–78. [Google Scholar] [CrossRef] [PubMed]
- Cox, B.L.; Erickson-Bhatt, S.; Szulczewski, J.M.; Squirrell, J.M.; Ludwig, K.D.; Macdonald, E.B.; Swader, R.; Ponik, S.M.; Eliceiri, K.W.; Fain, S.B.; et al. A novel bioreactor for combined magnetic resonance spectroscopy and optical imaging of metabolism in 3D cell cultures. Magn. Reson. Med. 2019, 81, 3379–3391. [Google Scholar] [CrossRef]
- Grivet, J.-P.; Delort, A.-M. NMR for microbiology: In vivo and in situ applications. Prog. Nucl. Magn. Reason. Spectrosc. 2009, 54, 1–53. [Google Scholar] [CrossRef]
- Hemminga, M.A.; Visser, J. NMR in biotechnology. J. Biotechnol. 2000, 77, 1–3. [Google Scholar] [CrossRef]
- Hertig, D.; Maddah, S.; Memedovski, R.; Felser, A.; Moreno, A.; Pennestri, M.; Nuoffer, J.-M.; Vermathen, P. Life monitoring of cellular metabolism and mitochondrial respiration in 3D cell culture system using NMR Spectroscopy. Proc. Int. Soc. Magn. Reson. Med. 2020, 28, 2994. [Google Scholar]
- Keshari, K.R.; Kurhanewicz, J.; Jeffries, R.E.; Wilson, D.M.; Dewar, B.J.; Van Criekinge, M.; Zierhut, M.; Vigneron, D.B.; Macdonald, J.M. Hyperpolarized 13 C spectroscopy and an NMR-compatible bioreactor system for the investigation of real-time cellular metabolism. Magn. Reson. Med. 2010, 63, 322–329. [Google Scholar] [CrossRef] [PubMed]
- Macdonald, J.M.; Grillo, M.; Schmidlin, O.; Tajiri, D.T.; James, T.L. NMR spectroscopy and MRI investigation of a potential bioartificial liver. NMR Biomed. 1998, 11, 55–66. [Google Scholar] [CrossRef]
- Macdonald, J.M.; Kurhanewicz, J.; Dahiya, R.; Espanol, M.T.; Chang, L.H.; Goldberg, B.; James, T.L.; Narayan, P. Effect of glucose and confluency on phosphorus metabolites of perfused human prostatic adenocarcinoma cells as determined by 31 P MRS. Magn. Reson. Med. 1993, 29, 244–248. [Google Scholar] [CrossRef]
- Majors, P.D.; McLean, J.S.; Scholten, J.C. NMR bioreactor development for live in-situ microbial functional analysis. J. Magn. Reson. 2008, 192, 159–166. [Google Scholar] [CrossRef]
- Mancuso, A.; Fernandez, E.J.; Blanch, H.W.; Clark, D.S. A nuclear magnetic resonance technique for determining hybridoma cell concentration in hollow fiber bioreactors. Biotechnology 1990, 8, 1282–1285. [Google Scholar] [CrossRef]
- Narayan, K.S.; Moress, E.A.; Chatham, J.C.; Barker, P.B. 31 P NMR of mammalian cells encapsulated in alginate gels utilizing a new phosphate-free perfusion medium. NMR Biomed. 1990, 3, 23–26. [Google Scholar] [CrossRef] [PubMed]
- Siegal, G.; Selenko, P. Cells, drugs and NMR. J. Magn. Reson. 2019, 306, 202–212. [Google Scholar] [CrossRef] [PubMed]
- Thelwall, P.E.; Brindle, K.M. Analysis of CHO-K1 cell growth in a fixed bed bioreactor using magnetic resonance spectroscopy and imaging. Cytotechnology 1999, 30, 121–132. [Google Scholar] [CrossRef] [PubMed]
- Trouard, T.P.; Harkins, K.D.; Divijak, J.L.; Gillies, R.J.; Galons, J.P. Ischemia-induced changes of intracellular water diffusion in rat glioma cell cultures. Magn. Reson. Med. 2008, 60, 258–264. [Google Scholar] [CrossRef] [PubMed]
- Giusti, S.; Mazzei, D.; Cacopardo, L.; Mattei, G.; Domenici, C.; Ahluwalia, A. Environmental control in flow bioreactors. Processes 2017, 5, 16. [Google Scholar] [CrossRef]
- Lundervold, A.S.; Lundervold, A. An overview of deep learning in medical imaging focusing on MRI. Zeitschrift für Medizinische Physik 2019, 29, 102–127. [Google Scholar] [CrossRef]
- Madelin, G.; Poidevin, F.; Makrymallis, A.; Regatte, R.R. Classification of sodium MRI data of cartilage using machine learning. Magn. Reson. Med. 2015, 74, 1435–1448. [Google Scholar] [CrossRef]
- Wang, S.; Su, Z.; Ying, L.; Peng, X.; Zhu, S.; Liang, F.; Feng, D.; Liang, D. Accelerating magnetic resonance imaging via deep learning. In Proceedings of the 2016 IEEE 13th International Symposium on Biomedical Imaging (ISBI), Prague, Czech Republic, 13–16 April 2016. [Google Scholar] [CrossRef]
- Lustig, M.; Donoho, D.; Pauly, J.M. Sparse MRI: The application of compressed sensing for rapid MR imaging. Magn. Reson. Med. 2007, 58, 1182–1195. [Google Scholar] [CrossRef]
- Madelin, G.; Chang, G.; Otazo, R.; Jerschow, A.; Regatte, R.R. Compressed sensing sodium MRI of cartilage at 7T: Preliminary study. J. Magn. Reson. 2012, 214, 360–365. [Google Scholar] [CrossRef]


© 2020 by the authors. Licensee MDPI, Basel, Switzerland. This article is an open access article distributed under the terms and conditions of the Creative Commons Attribution (CC BY) license (http://creativecommons.org/licenses/by/4.0/).