Abstract
The addition of nanoparticles to liquid media can improve thermomechanical properties of dispersants. This ability gives rise to the development of multiple applications of nanofluids (NF) in branches so different as electronic and photonic devices or cosmetic industry. Logically, these applications require a good control of heat transfer and flow properties. Moreover, if we consider the necessity to optimize industrial processes in which NF take part, it is necessary to obtain possible relationships between both physical mechanisms. Specifically, in this work, a study about thermal conductivity and rheological behavior of fumed silica suspensions in polypropylene glycol (PPG400) and polyethylene glycol (PEG200) was performed. The study of these two suspensions is interesting because the flow behaviors are very dissimilar (while the fumed silica in PEG200 suspension is viscoplastic, the fumed silica in PPG400 suspension shows shear-thickening behavior between two shear-thinning regions), despite the addition of fumed silica producing similar enhancement of the relative thermal conductivity in both liquid phases. The more outstanding contribution of this work lies in the combination of rheological and conductivity measurements to deepen in the understanding of the heat transfer phenomenon in NF. The combination of rheological together with thermal conductivity measurements have permitted establishing the mechanisms of liquid layering and aggregate formation as the more relevant in the heat transfer of these silica fumed suspensions.
1. Introduction
The addition of solid particles to liquid media has been reported a common practice because it improves the thermomechanical properties of the liquids. This ability gives place to the development of multiple applications of nanofluids (NF) in branches so different as electronic and photonic devices, microelectronics, air-conditioning, chemical production, heating and cooling processes, nuclear system cooling or cosmetic industry [1,2,3]. Various types of nanoparticles with or without surfactant molecules can be dispersed into fluids such as water, ethylene/propylene glycol, oils and other lubricants for different purposes. For example, dispersions of colloidal particles, of at least one silica/alumina composite filler and at least one thickening hydrocolloid, i.e., fumed silica dispersed in polyethylene glycol/polypropylene glycol (PEG/PPG), have been used as rheological modifiers for treating oily skin and acne [4]. They have also been used in insulation blocks in order to promote building’s energy efficiency [5]; as heat transfer materials within innovative building envelope prototypes [6]; in a double thermal envelope, which encloses the urban greenhouse space [7]. Hydrophilic and hydrophobic silica are also used as filler in liquid crystals (LC) [8]. In biomedical applications, PEG-coated silica nanoparticles reduce protein and cell adsorption onto the particles and can reduce the rate of clearance (through organs such as kidneys), thus increasing the particle circulation time for in vivo applications [6]. Nonetheless, these advantages can be countered to some extent by the increase in viscosity of NF and the complexity of other rheological behaviors that emerge from the inclusion of fillers [9,10,11].
The classical models of Maxwell [12] and Hamilton–Crosser (HC) [13] to predict the thermal conductivity of micrometer/millimeter-sized particles of well-dispersed solid–liquid mixtures are applicable at low volume fraction. The Maxwell model [12] deals with parameters that influence on the thermal conductivity of the dispersion such as particle volume fraction, base fluid and particle thermal conductivities. The HC model [13] is the modification of Maxwell’s model with the inclusion of an empirical shape factor, . This is also applicable for micrometer- and millimeter-sized particles. For spherical shape , the model reduces to Maxwell equation. However, these two classical models do not include effects such as microstructure, temperature, particle size, interfacial layer of solid/fluid, particle distribution, particle cluster aggregates and Brownian motion. Both of them have been developed by assuming the dispersed particles are in static condition.
Keblinski et al. [14] described different heat transfer mechanisms in nanofluids, such as the formation of a liquid layer around nanoparticles (liquid layering) [15,16,17], particles clustering [17,18,19,20], and Brownian motion of particles [21,22,23]. These investigations have been performed about the aforementioned mechanisms and contradictory conclusions have been formulated about the validity of each mechanism for effective enhancing of heat conduction in NF. Recent studies [24] conclude that the role of Brownian effect in heat transfer is only of importance when nanoparticle dimensions are of the order of magnitude of molecule size . Thus, the agglomeration of particles and liquid layer formation should be the dominant effects in nanofluid heat transfer. The results [24] show that clustering of particles turns out to have the upper hand with respect to the presence of liquid layer formation when particle size is large because for large particles the liquid layer thickness becomes negligible with respect to the agglomeration radius. However, the effect of liquid layer formation may be of greater importance in the intermediate region, i.e., for particle size higher than but lower than but, logically, depending on the thickness of this layer.
Colloidal silica shows the unique ability to form network structures in liquids. This ability depends on solid volume fraction, functional groups linked to particle surface, and also on the properties of the liquid suspending medium. In addition, silica is safe, biodegradable, and biocompatible. It is well known that several functional groups can be easily anchored onto its surface. For example, silica particles can be modified to partially hydrophobic by linking long chains of alkyl groups onto the solid surface [25,26]. These features of colloidal silica particles enable their use as carriers of biomacromolecules in biomedical applications [27] and for biocatalytic applications when hydrophobic reactants are involved [28]. Rheological studies performed in a wide variety of suspensions concluded that partially hydrophobic silica, covered by large nonpolar n-alkyl chains , develops at rest an extended particle network, in polar organic media, which manifests macroscopically as a gel. However, shear-thickening behavior has been observed in fully hydrophobic silica (Aerosil®R816) suspensions in polypropylene glycol of low molecular weight (PPG400) [29], while this behavior has not been observed when the same particles are dispersed in polyethylene glycol of low molecular weight (PEG200) [30]. It is worth noting that a necessary condition to observe shear-thickening behavior in suspensions is that particles must maintain dispersed at the quiescent state. The explanation given for the different behavior observed of fumed silica suspensions in PPG400 and PEG200 liquid phases is based on the different sign of the steric interaction between particles [30]. Based on Raman spectroscopy studies, it has been suggested [30] that these antagonistic results are possibly due to the different conformations adopted by the n-alkyl (C16H33-) chains linked to Aerosil®R816 particle surface; specifically, they extend to the bulk in PPG400 but bend in PEG200. In a nutshell, different flow behaviors are observed in two similar suspensions due to the very dissimilar microstructure of particles, different molecular size and physical properties (dielectric constant) of the liquid phase. The question that arises and justifies this research work is if the very distinct microstructure of the solid particles in the two liquid phases, PEG200 and PPG400, could affect the heat transfer mechanism in both suspensions.
This work addresses with the thermal conductivity assessment of hydrophobic fumed silica (R816) suspended in PPG400 and PEG200 in relation to the different rheological behavior of both suspensions. In the study of the thermal conductivity, the relative importance of liquid layering and particle agglomeration in the heat transfer mechanisms was specifically checked.
2. Materials and Methods
2.1. Materials
Polypropylene glycol (H[OCH(CH3)CH2]nOH) is a polymer with a quoted molar mass (PPG400), density of and viscosity of , respectively, both at . Polyethylene glycol (HO-[CH2-CH2-O]n-H) is a polymer with an average molar mass of (PEG200), density of and viscosity of also at . Both of them were purchased from Sigma-Aldrich (Chemical GmbH, Düsseldorf, Germany). Commercially available colloidal hydrophobic fumed silica, Aerosil®R816, purchased from Evonik Degussa Ibérica S.A. (Spain), was used as solid phase. According to the manufacturer, its specific surface area BET is . The density was measured with a Gas Displacement Pycnometry System AccuPyc II 134 Serie, Anton Paar GmbH (Germany), which provided a true density value of .
The suspensions were prepared by adding the liquid to the silica powder and mixing in a stirrer Onilab OS40-Pro (Labbox-Spain) for at rotational frequency . In these conditions the reproducibility between batches was achieved. The powder was weighted using a Mettler AE-163 electronic balance (Mettler-Toledo, Columbus, OH, USA), whose accuracy is . In thermal conductivity measurements, the same volume fractions were prepared in both suspensions (0.09; 0.06; 0.04; 0.03; 0.01) despite the viscosity of fumed silica in PEG200 suspensions being higher than that of fumed silica in PPG400 dispersions, as it was suggested by inspection of Figure 1a. However, in the rheological study the volume fractions were increased in the R816/PPG400 suspensions (0.10; 0.09; 0.07; 0.05; 0.03) due to the lower viscosity of these samples compared to the R816/PEG200 dispersions (0.09; 0.07; 0.05; 0.03; 0.01). The samples were separated in lots of , left at low vacuum with sonication at room temperature for approximately one hour to eliminate air bubbles. Afterwards, each sample was allowed to rest for at least before the experimental measurements were recorded.
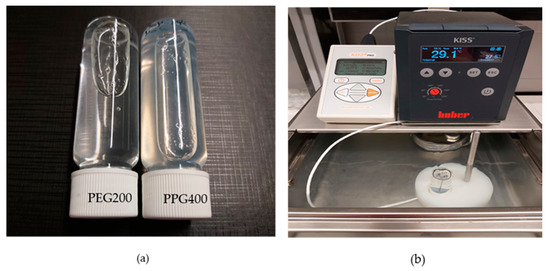
Figure 1.
(a) Fumed silica particles dispersed in PEG200 (left) and PPG400 (right). The bubble flows slower in PEG200 than in PPG400 suspension due to the higher viscosity of the former. (b) Experimental set up for the thermal conductivity measurements. The sample is placed in a glass vial provided with a septum closure in which the needle of the probe is inserted.
The particle volume fraction in the suspensions , i.e., the ratio between the volume occupied by the solid phase and the total volume of the suspension, was calculated from bulk densities considering silica particles as Euclidean solids. Despite it being suggested that a high volume fraction is necessary in order to observe shear-thickening behavior [31], the fact is that this rheological phenomenon, which has been observed at low concentration values in silica suspensions, can be explained taking into account the different form of aggregation in Euclidean and fractal solids. As a consequence of their fractal nature, silica particles generate loose and open primary aggregates [32]. Then an effective disperse phase volume fraction being much higher than is expected [33] and can justify the observation of shear-thickening behavior when the solid volume fraction was low.
2.2. Apparatus
Micrograph images were carried out on a TEM JEM-1400, JEOL Company, USA. This apparatus is a tungsten-filament 120 kV transmission electron microscope. Samples were dispersed in ethanol, attached to Formvar copper grids by placing one drop on the grid and evaporating the solvent before to obtain TEM images. The apparent hydrodynamic radius of the particles was obtained by using the Dynamic Light Scattering (DLS) technique on a Zetasizer Nano-S system (Malvern Instruments, Worcestershire, UK). This instrument is fitted with Helium–Neon laser source ( and ) and uses a backscattering detection system (scattering angle ). It disposes a built-in Peltier temperature control with an accuracy of .
Thermal conductivity was measured by employing a KD2 Pro Thermal Properties Analyzer (Decagon Devices, Inc., Pullman, WA, USA) with a maximum error of about , in the temperature range of to . This device uses the transient hot wire (THW) method to measure thermal conductivity. The advantage of this method is connected with its success to nearly completely avoid natural convection effects. Approximately of the sample was sealed in a glass sample vial ( diameter, length). The KS-1 stainless steel thermal probe ( diameter, length), provided with a heating element and a thermo-resistor, was inserted into the sample vertically by means of a purpose-made port in the lid of the vial, rather than horizontally (for minimizing inducing convection). The sealed vial was fully immersed in a refrigerated/heating water bath with air-cooled refrigerating unit and KISS-Controller model Huber Kiss K6, Germany. This apparatus is equipped with an isolated cooling bath made of stainless steel with an immersion thermostat (as it is shown in Figure 1b). The operating temperature range varies from to . The uncertainties of thermal conductivities were estimated from standard deviations of experimental data and were lower than .
Rheological experiments were carried out on a controlled stress rheometer RS600 (Thermo Scientific Haake, Waltham, Massachusetts, USA) using a cone-plate sensor system with a cone angle of and a diameter of ( gap). In order to erase the shear history-dependent behavior, a pre-shear stage was applied before recording all measurements [34,35,36]. Afterwards, the sample was kept at rest for certain period of time. The values of the shear rate applied in the pre-shear stage and the duration of the resting time were determined for each sample. The temperature of the samples was controlled with a Peltier system. Isothermal steady flow curves were obtained by varying the shear rate from to (in R816/PPG400, no further than were measured due to the shear thickening effect and recording the steady shear stress corresponding to each shear rate when the condition was accomplished. Strain sweeps were also performed from to of non-dimensional deformation amplitude and frequency sweep in the linear viscoelastic region from to . The two linear viscoelastic parameters, storage modulus and loss modulus were recorded.
3. Results and Discussion
3.1. Thermal Conductivity
The transmission electron microscope (TEM) image of R816 silica particles shows a number of spheroidal particles, as can be seen in Figure 2a,b. The particles of silica present fractal branching structures that result from the irreversible fusion process of the primary pyrogenic particles [37], therefore signs of agglomeration are observed in the micrographs. The technical specifications given by the manufacturer (Evonik, Essen, Germany) suggest the existence of aggregates formed by chains of silica particles with a size of . With the image treatment toolbox of Matlab® (Mathworks, Inc., Natick, Massachusetts, U.S.A.), an average primary size of was obtained, this value is named as diameter particle size. However, at the microscopic scale, the agglomeration of aggregates could achieve higher effective hydrodynamic particle size. This value was determined by DLS, as was indicated before in suspensions of fumed silica in PPG400 and PEG200. Average particle sizes obtained by DLS experiments were for suspensions in PPG400, and for suspensions in PEG200. These values corresponded to the respective agglomerate diameter size.
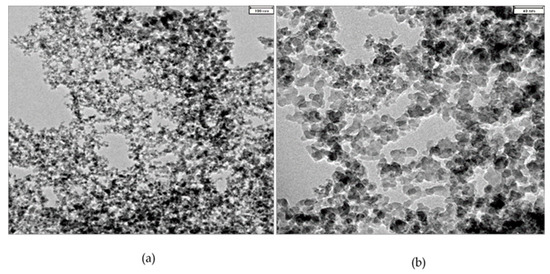
Figure 2.
TEM micrographs of silica nanopowder at two magnifications. Silica particles aggregates present fractal branching (a) resulting from irreversible fusion of primary spherical particles (b).
The polymers PPG400 and PEG200 have shown to be poor thermal transfer liquids since they exhibit low thermal conductivity values and for PPG400 and PEG200, respectively. The addition of R816 nanoparticles improves the thermal conductivity of these liquids, as is shown in Figure 3a. The suspensions of R816/PEG200 have shown higher conductivity than those based on PPG400 (Figure 3a). The relevant fact is to determine the solid specific influence on the effective increase of thermal conductivity when it is compared to that of the liquid base. Thus, the relative thermal conductivity is logically defined as the quotient between the thermal conductivity of the suspension and the thermal conductivity of the base fluid . Figure 3b represents the relative thermal conductivity of the above mention nanofluids versus the volume fraction. An improvement of the thermal conductivity with the presence of solid particles can be inferred in the two base liquids. However, the increase of thermal conductivity is lightly higher in R816/PPG400 suspensions than in R816/PEG200 suspensions. This interesting result is masked if only absolute values of thermal conductivity are considered (Figure 3a). In addition, the influence of temperature on the thermal conductivity of both suspensions and the pure liquid phases was also checked. As it can be seen in Figure 3c, the thermal conductivity is not affected in any case by the temperature changes in the interval . This is an interesting result, which is in line with the different non-aqueous suspensions reported by other authors [38]. On the other hand, it opposes the increase of thermal conductivity with temperature observed in aqueous dispersions [39].
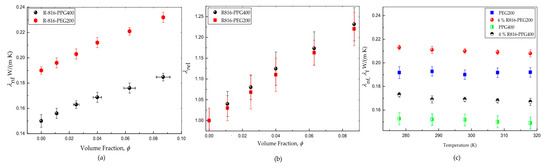
Figure 3.
(a) Thermal conductivity of R816 fumed silica in PPG400 and PEG200 suspensions at . (b) Relative thermal conductivity of R816 fumed silica in PPG400 and PEG200 suspensions. (c) Effect of temperature on thermal conductivity of R816 fumed silica in PPG400 and PEG200 suspensions and of the base fluids.
It has been reported that the macroscopic HC theory of heat transport, which provides the effective thermal conductivity of two or multicomponent materials, fails in the case of nanofluids. The expression for the thermal conductivity of a two-component system is given by [13]
The experimental values (Figure 3a) for the thermal conductivity of both liquid phases used in this study were for PPG400 and for PEG200, respectively. On the other hand, is the particle conductivity whose value was taken from literature [40]. The HC approach, which is based on the diffusive heat transport model, takes into account the shape of the particles by means of the factor (for spheres ), and also the solid volume fraction. However, it does not consider the influence of the particle size. Several factors have been pointed out as potentially responsible for the poor adequacy of this classical theory for fitting experimental results. Namely, it is not considered the existence of molecular-level layering of the liquid at the liquid/particle interface, and the effects of particle clustering mediated by liquid within the limit of a short inter-particle distance and Brownian motion of particles are neglected. As we are concerned with liquid layering and particle clustering (agglomeration) as heat transport mechanism, a recent mathematical model that has been developed taking into account these two mechanisms of heat transfer [24] was considered here. This approach has also been developed assuming constant temperature. Therefore, the convection induced by some thermal gradient can be neglected. In addition, the model assumes that particles are spherical and rigid, and with the same size; they are dispersed in a homogeneous fluid; and they do not transport any electric surface charge; and, finally, it is assumed the absence of any surfactant in the suspension. Equation (2), which results from the Machrafi and Lebon model [24] for thermal conductivity, considering the liquid layering and agglomerate effects, is
where the subscripts are specifically indicated to remind that liquid-layering and agglomerate effects are considered in this model. In Equation (2), the radius of the agglomerates is used instead of the radius of the particles. The radius of the agglomerates is included in the terms and in which the liquid layer thickness is also considered as follows
is the thermal boundary resistance coefficient whose value is for PEG200 [41]. In order to estimate the value for PPG400, several considerations were taken into account
- (a)
- the physical properties of the liquid samples are assumed independent of the molar mass at atmospheric pressure [42],
- (b)
- should decrease with heat capacity per unit volume and increase with some unspecific function of the sound velocity in the two media . Therefore, [43]. The values for have been taken from the literature [44,45] ( for PEG200 and for PPG400),
- (c)
- as the sound speed is approximately the same for various organic liquids and water [45], and assuming the same function of the sound velocity for PEG200 and PPG400, the value of for PPG400 was finally estimated as .
The value of was calculated assuming that the microstructure developed by R816 silica nanoparticles in PPG400 and PEG200 is different. While the hexadecyl silane molecules anchored onto the particle surface adopt trans conformation in PPG400, as it was inferred from Raman spectrum [33], when R816 particles are suspended in PEG200 it turns into a kinked conformation [33]. Thus, the length of the liquid layer around silica particles when they are suspended in PPG400 coincides with the hexadecyl silane molecule length. This value is calculated by means of the following expression [46]:
where is the bond length of the hexadecyl silane, and and are parameters for calculating the bound length. Specifically, for carbon and ; and for silicon and . The value obtained using Equation (5) is for PPG400 [46]. On the other hand, as it was pointed out before, in PEG200 the hexadecyl group is twisted (see Figure 4). Then, we will assume that the liquid layer should be enclosure surrounding the silica particle with an extension of [24]. It is worth noting that the value proposed here for the extension of hexadecyl silane tails in PEG200 is supported by results obtained in other studies. They focused on the determination of the interfacial layer thickness of a pseudo-solid–liquid system [47] in which is of the order of . Experimental results [48] and molecular dynamics simulations [49] showed that the typical interfacial layer thickness between the solid (nanoparticles) and liquid phase is of the order of a few atomic distances . Considering the twisted conformation of the hexadecyl silane in PEG200 (Figure 4b), it could be reasonably assumed a value of .
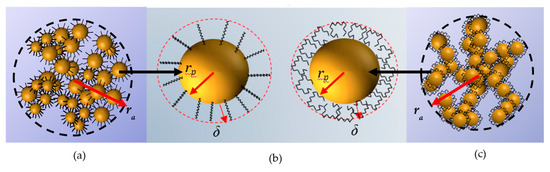
Figure 4.
(a) Representation of an agglomerate of R816 fumed silica particles in PPG400. (b) The hexadecyl silane conformation adopted in each base fluid. In PPG400, the trans conformation (left) leads to a high liquid layer thickness surrounding the particle vs. the twisted conformation in PEG200 with a small liquid layer (right). (c) Representation of an agglomerate of R816 fumed silica particles in PEG200.
In Equation (2), the (effective) volume fraction considers the volume occupied by the agglomerates as , where is the agglomerate radius and the fractal dimension (see Figure 4a,c). As the fractal dimension of SiO2 clusters suspended in ethanol is calculated to be [50], and the TEM image (Figure 2) and the manufacturer description of the R816 powder suggested a fractal branching structure close to a value of , which coincides with other studies of silica materials [40], the same value in both liquid media was assumed here.
The quantity in Equation (2) refers to the thermal conductivity of an agglomerate which is formed by clustering of particles that are surrounded by a liquid layer of size , and it was obtained with
In Equation (6), the thermal conductivity of the particle was estimated by the following equation
was calculated from the experimental values of density, , and specific heat capacity, , of fumed silica. The velocity group, , and the mean free path, , of phonons in silica, are and , respectively [40]. The Knudsen number, , is defined as the ratio of mean free path and particle radius, and for fumed silica particles is . Finally, is the ratio of particle and agglomerate volume fractions.
The comparative results of the classical HC and the liquid-layering-agglomerate (ll,a) models with the experimental measurements of both fumed silica suspensions are shown in Figure 5a (PPG400 suspensions) and Figure 5b (PEG200 suspensions). In both cases, the HC model underestimates the experimental values of the relative thermal conductivity. Moreover, there is a good agreement of the ll,a model and the experimental results. According to Equation (2), the conductivity of the suspensions depends on the radius of the agglomerates (which include the liquid layer ) and the conductivity of the solid and liquid phases . These magnitudes were experimentally measured or estimated on the basis of experimental measurements. The thickness of the liquid layers was estimated under consistent considerations of the most probable conformation according to rheological and spectroscopic studies.
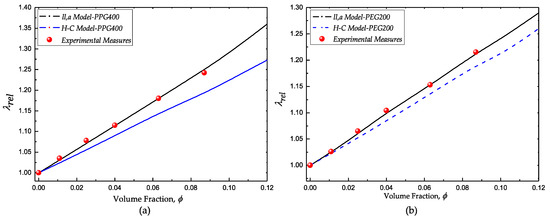
Figure 5.
Comparative results of the experimental measurements with the Hamilton–Crosser (HC) model and the liquid-layering-agglomerate model. (a) fumed silica in PPG400 and (b) fumed silica in PEG200.
3.2. Rheological Behaviour
The flow behavior of fumed silica in PPG400 and PEG200 is very different. The steady shear flow curves show that R816 fumed silica particles in PEG200 suspensions are more viscous than R816 fumed silica particles in PPG400 suspensions (Figure 6a,b). The viscosity curves of R816 in PEG200 (Figure 6a), at concentrations between and , showed a very pronounced shear-thinning behavior. The higher the solid concentration, the smaller the shear-thickening effect is. In turn, the suspensions of R816 in PPG400 (Figure 6b) with solid concentrations between and showed a more pronounced increase of viscosity (shear-thickening) between and than suspensions in PEG200. The shear-thickening behavior in R816/PPG400 suspensions disappears at the lowest solid volume fraction considered here . As the difference between maximum and minimum viscosities also decreases when the solid volume fraction reduces, it is clear that some critical volume fraction between and must separate suspensions that show shear-thickening behavior from suspensions in which only shear-thinning behavior can be observed. Presumably, this critical volume fraction must be dependent on the temperature of the sample, but its determination is out of the scope of this study. These very different behaviors of R816/PPG400 and R816/PEG200 suspensions (Figure 6c) can be justified as follows. As it was shown in Figure 4, the agglomerates formed by silica particles in PEG200 are more compacted ( diameter) than those in PPG400 ( diameter); that is, at the same volume fraction, the number of aggregates of solid particles must be higher in PEG200 than in PPG400. Particle aggregates are more extended in PPG400 due to the trans conformation adopted by the hexadecyl silane groups of fumed silica. The lower values of the viscosity in suspensions of R816 in PPG400 can be justified considering that the microstructure formed by the silica particles with hexadecyl silane hydrophobic molecules adsorbed onto the particle surface can perform a dispersant effect, avoiding the approximation of aggregates to each other. Therefore, as it is inferred from Figure 4, there are fewer particles in agglomerates formed in PPG400 than in PEG200. In order to confirm this hypothesis, an estimation of the maximum packing fraction will be obtained using the well-known Krieger–Dougherty equation [51]. Equation (8) was originally deduced assuming Newtonian behavior of the suspensions (dilute). However, it can be used to fit the dependence of the viscosity with the solid volume fraction in non-Newtonian suspensions taking the shear rate as a parameter [52],
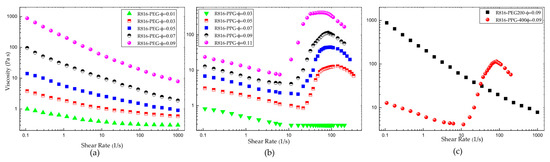
Figure 6.
(a) Viscosity curves of R816 fumed silica in PEG200 suspensions. (b) Viscosity curves of R816 fumed silica in PPG400 suspensions. (c) Comparison between the viscosity curves of R816 in PEG200 and in PPG400 suspensions .
.
In Equation (8), the quotient between the suspension viscosity and the viscosity of the liquid phase is the relative viscosity ; is the maximum particle volume fraction, whose value, for monodisperse suspensions of hard spherical particles, is equal to ; and is the intrinsic viscosity ( is the value corresponding to hard spheres). Equation (8) was adjusted for different shear rates to the data obtained with R816/PPG400 and R816/PEG200 suspensions. Therefore, the maximum packing fraction and the intrinsic viscosity were obtained as a function of shear rate. The results are presented in Figure 7. The maximum packing fraction versus shear rate of R816/PPG400 and R816/PEG200 suspensions is shown in Figure 7a. As it can be seen, showed a minimum value around in R816/PPG400 suspensions while in R816/PEG200 suspensions it reduced with shear rate from onwards. The values and trend displayed by the maximum packing fraction with shear rate can be used to infer information on the microstructure developed in the suspensions. Both systems should be structured at rest because they exhibited shear-thinning behavior at low shear rates. The shear-thinning behavior was more abrupt in the R816/PEG200 suspension, probably due to the formation of clusters of aggregates, while the aggregates are maintained separated in the R816/PPG400 suspension due to the hexadecyl silane conformation, as it is shown in Figure 4, which gave place to a smaller maximum packing fraction at all shear rates studied. In the shear-thinning region, the mechanical energy supplied by the rheometer erodes first the clusters of aggregates and subsequently the aggregates themselves in R816/PEG200 suspensions and erodes the aggregates in R816/PPG400 suspensions. It could be said the aggregates take more ramified shapes in R816/PEG200 than in R816/PPG400 suspensions (see Figure 4). Furthermore, the formation of aggregates (hydroclusters) is proposed as the more probable mechanism of shear thickening in these systems [29]. This idea is endorsed by the increase of the maximum packing fraction at the onset of the shear-thickening region.
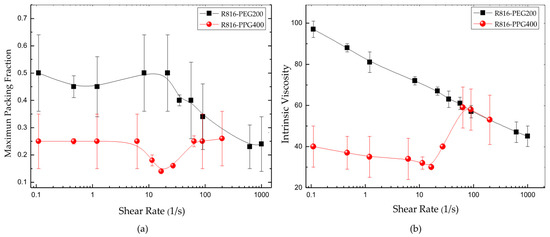
Figure 7.
(a) Maximum packing fraction of R816 in PEG200 and PPG400 vs. shear rate. (b) Intrinsic viscosity of R816 in PEG200 and PPG400 vs. shear rate.
The intrinsic viscosity is a parameter related to the shape of the solid particle. As said before, is the intrinsic viscosity of hard spheres. This value was also estimated at different shear rates from Equation (8) and the results are plotted in Figure 7b. The shape of the intrinsic viscosity curves vs. shear rate reflects the shape of the viscosity curves plotted in Figure 6a,b. Is there any connection between viscosity and shape? Certainly, there is, and it is supported by the high increase of the intrinsic viscosity in the shear-thickening region in PPG400. This result reinforced the effect of shear rate over the maximum packing fraction, which also increased in the shear thickening region. The mechanical energy, high shear rate, is able to erode or form clusters and reduce or increase the viscosity of the suspension.
It is worthy to note that the intrinsic viscosity of the R816/PPG400 suspensions took a high value ) around , where the formation of hydroclusters is maximum. At the same time, the maximum packing fraction also increased because of the formation of clusters of aggregates causing the increase of viscosity in the shear-thickening region. Therefore, we can affirm that the aggregates can distort the flow field in a very remarkable way, indicating that the shape of the aggregates in R816/PPG400 suspensions dramatically departs from the spherical form. In R816/PEG200 suspensions, the intrinsic viscosity was also high, but it was falling with shear rate as it could be expected in a shear thinning fluid, where the effect of the increasing shear rate is to erode progressively the aggregates.
As solid particles are dispersed in liquids, the intrinsic viscosity is also related to the heaviness of the agglomerates. The compaction degree of the clusters or particle aggregates gives an idea of the aggregate compaction. It represents the volume fraction of particles in a cluster and it is given by the relation derived by Smith and Bruce [53]
From Equation (9), it is clear that the higher the intrinsic viscosity value, the more opened the aggregate microstructure is. The following results were obtained, 2 for R816/PPG400 suspensions at the lowest value at , and for R816/PEG200 suspensions being the lowest value at . These relatively low results suggest that the most eroded clusters, at higher shear rate, are ramified or opened structures [54] in PPG400. In PEG200 the clusters of aggregates were present at any value of shear rate, decreasing with mechanical energy but being always ramified open structures.
The experimental results obtained from oscillatory shear tests are plotted in Figure 8. The strain sweeps, Figure 8a, showed that R816/PEG200 suspensions are solid-like at low deformations, with a linear viscoelastic behaviour that extend until around ; moreover, R816/PPG400 suspensions showed liquid-like behavior for all deformation amplitudes. The viscoelastic behavior was linear until . These different viscoelastic behaviors of the suspensions are consistent with what was observed in steady flow curves tests (Figure 6a,b). Certainly, the viscosity of R816/PEG200 dramatically increased at very low shear rate showing viscoplastic behavior, which corresponded to solid-like behavior at very small deformations. The low viscosity values showed by R816/PPG400 suspensions at low shear rates (Figure 6b) indicated a liquid-like microstructure at rest, which is a necessary condition previous to the shear-thickening behavior shown at higher shear rates. This is probably due, as it was suggested before, to the higher repulsive forces between particles derived from the more extended configuration of the hexadecyl silane molecules anchored onto the surface of silica particles.
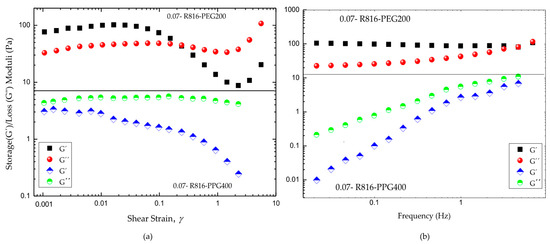
Figure 8.
(a) Comparative strain sweep tests of fumed silica in PPG400 and PEG200 suspensions . (b) Comparative frequency sweep tests in the linear viscoelastic regions of fumed silica in PPG400 and PEG200 suspensions . All the uncertainties in the experimental points are under .
The frequency sweeps were performed in the linear viscoelastic region in both cases (Figure 8b). As it can be seen, the R816/PEG200 suspension exhibits a gel-like flow behavior. This is concluded from the fact that the value of the storage modulus is always higher than the loss modulus value, and both rheological parameters are almost independent on the frequency. On the other hand, in R816/PPG400 suspensions the storage modulus value is always lower than the value of the loss modulus and dependent on the frequency, which is the typical behavior of non-aggregated suspensions in the quiescent state. This behavior manifests macroscopically as mainly viscous flow.
The rheological study carried out with hydrophobic fumed silica suspensions in the two polymers, PPG400 and PEG200, can help to determine which of the heat transfer mechanisms is more relevant in these systems. In addition, rheological studies can be used to infer information on which is the microstructure that can be more effective to transport heat. From the results obtained in this study by thermal conductivity and flow behavior measurements it can be inferred some influence of the liquid-layer surrounding particles in the heat transmission with R816/PEG200 and R816/PPG400 suspensions. The increment of the relative thermal conductivity with the solid volume fraction seems to be slightly higher in R816/PPG400 than in R816/PEG suspensions. This is presumably due to the more effective steric interaction between particles provoked by the hexadecyl silane molecules anchored onto silica particles dispersed in PPG400. Consequently, R816 particles are more disjointed and the suspension is formed by open aggregates at rest-state, which are surrounded by a liquid layer. The formation of aggregates in R816/PPG400 suspensions was checked by DLS measurements, resulting that the diameter was wider than the aggregates formed in R816/PEG200 suspensions . In turn, fumed silica R816 particles formed more compact agglomerates in PEG200 than in PPG400, since the hexadecyl silane is kinked in that liquid phase (see Figure 4). This conformation did not act so effectively as a dispersant agent for particles, which explained the higher values of in R816/PEG200. Consequently, the main heat transfer mechanism that probably dominated in R816/PEG200 suspensions could result from the formation of particle aggregates, while liquid layering mainly governed the heat transmission in R816/PPG400.
In summary, comparing the relative effect that the same silica fumed particles (R816) dispersed in two different liquid media (PEG200 and PPG400) exerts on their thermal conductivity, it can be stated that particles surrounded by a liquid layer showing viscous flow (suspensions in PPG400) increased the base liquid conductivity more efficiently than particles forming agglomerates which gave place to solid-like behavior in the quiescent state (suspensions in PEG200).
4. Conclusions
The heat transfer mechanism model that takes into account the formation of a liquid layer around particles dispersed in a liquid media combined with the formation of agglomerates fitted the experimental measurements at low volume fraction (under ). This mathematical model was compared with the classical theories of Maxwell and Hamilton–Crosser, which incorporate only particle shape and volume fraction as variables and assume diffusive heat transport in both liquid and solid phases, but no effects of solid/liquid interfaces, particle size or particle mobility are taken into account. The experimental results concluded that liquid layering and cluster formation contributed to the heat transmission in these systems and adjusted the thermal conductivity measurements better than the classical theories above mentioned.
The flow properties of fumed silica (R816) in PPG400 and PEG200 are very different. While R816 in PPG400 showed shear-thickening behavior at intermediate shear rate values, and low values of viscosity at the quiescent state, the same silica particles in PEG200 exhibited high viscosity values and gel-like behavior in the quiescent state. These two different behaviors were deduced from steady flow curves and confirmed by frequency sweep tests in the linear viscoelastic region. The combination of rheological together with thermal conductivity measurements have permitted to establish the mechanisms of liquid layering and aggregate formation as the more relevant in the heat transfer of nonpolar colloidal silica fumed suspensions. Therefore, thermal conductivity is an appropriate method to determine which of the potential heat transfer mechanisms could take place in a system and which of them would be more effective in the heat transmission. Nevertheless, considering the different microstructure of the two suspensions caused by distinct dielectric constant of the fluid bases, PPG400 and PEG200, the liquid layering mechanism seemed to be more effective than the formation of aggregates. Furthermore, this mechanism predominated in the less viscous system, which is also desirable. However, as this last suspension presents shear thickening effect, the flow properties of this system should also be controlled. In summary, flow properties are of supreme importance in industrial applications and provided a great tool in thermal property studies. This methodology could also be applied to liquid crystals filled with silica particles. The control of the disordering degree can be achieved by varying particle concentration. Rheology combined with thermal conductivity are good tools in the study and control of the flow properties and heat exchange of these systems and can help to elucidate the microstructure of these materials since they exhibit properties between conventional liquids and solid crystals.
Author Contributions
Conceptualization, A.I.G.-M. and F.J.R.-H.; methodology, A.I.G.-M. and J.J.J.-G.; validation, J.J.J.-G., J.L.A.-E., and I.M.S.-R.; formal analysis, A.I.G.-M. and F.J.R.-H.; investigation, J.J.J.-G., J.L.A.-E., and I.M.S.-R.; resources, A.I.G.-M.; data curation, A.I.G.-M. and J.J.J.-G.; writing—original draft preparation, A.I.G.-M. and J.J.J.-G.; writing—review and editing, F.J.R.-H. and A.I.G.-M.; supervision, A.I.G.-M. All authors have read and agreed to the published version of the manuscript.
Funding
This research received no external funding.
Acknowledgments
The authors acknowledge the University of Málaga for the support in (SCAI Service): TEM images, thermal analyses and porous solid Service.
Conflicts of Interest
The authors declare no conflict of interest.
Abbreviations and Nomenclature
The following abbreviations and symbols are used in this manuscript:
| Heat capacity per unit volume of fluid base | |
| Particle specific heat capacity | |
| Liquid layer thickness | |
| Fractal dimension | |
| Dynamic light scattering | |
| Particle volume fraction | |
| Agglomerate volume fraction | |
| Maximum packing fraction | |
| Storage modulus | |
| Loss modulus | |
| Hamilton-Crosser thermal conductivity theory | |
| Dynamic viscosity | |
| Intrinsic viscosity | |
| Relative viscosivity | |
| Fluid base thermal conductivity | |
| Nanofluid thermal conductivity | |
| Nanofluid thermal conductivity with liquid-layering and aggregate formation | |
| Agglomerate thermal conductivity | |
| Particle thermal conductivity | |
| Relative thermal conductivity | |
| Knudsen number | |
| Phonon mean free path | |
| Shape factor | |
| Nanofluid | |
| Polyethylene glycol | |
| Polypropylene glycol | |
| Particle radius | |
| Agglomerate radius | |
| Thermal boundary resistance | |
| Hydrophobic Silica fumed | |
| Particle density | |
| Transmission electron microscopy | |
| Phonon velocity group in silica fumed |
References
- Rudyak, V.Y.; Minakov, A.V. Thermophysical properties of nanofluids. Eur. Phys. J. E 2018, 41, 15. [Google Scholar] [CrossRef] [PubMed]
- Gupta, M.; Singh, V.; Kumar, R.; Said, Z. A review on thermophysical properties of nanofluids and heat transfer applications. Renew. Sust. Energy Rev. 2017, 74, 638–670. [Google Scholar] [CrossRef]
- Mariano, A.; Pastoriza-Gallego, M.J.; Lugo, L.; Camacho, A.; Canzonieri, S.; Piñeiro, M.M. Thermal conductivity, rheological behaviour and density of non-Newtonian ethylene glycol-based SnO2 nanofluids. Fluid Phase Equilib. 2013, 337, 119–124. [Google Scholar] [CrossRef]
- Knapp, B.; DiSalvo, R. Gel-Based Cosmetic and Wound-Healing Formulation and Method. US Patent 7,217,417 B2, 15 May 2007. [Google Scholar]
- Modi, P.; Bushehri, R.; Georgantopoulou, C.; Mavromatidis, L. Design and development of a mini scale hot box for thermal efficiency evaluation of an insulation building block prototype used in Bahrain. Adv. Build. Energy Res. 2017, 11, 130–151. [Google Scholar] [CrossRef]
- Mavromatidis, L.E. Study of coupled transient radiation-natural convection heat transfer across rectangular cavities in the vicinity of low emissivity thin films for innovative building envelope applications. Energy Build. 2016, 120, 114–134. [Google Scholar] [CrossRef]
- Mavromatidis, L. Constructal macroscale thermodynamic model of spherical urban greenhouse form with double thermal envelope within heat currents. Sustainability 2019, 11, 3897. [Google Scholar] [CrossRef]
- Kutnjak, Z.; Kralj, S.; Žumer, S. Effect of dispersed silica particles on the smectic-A–smectic-C* phase transition. Phys. Rev. E 2002, 66, 041702. [Google Scholar] [CrossRef]
- Wu, Q.; Ruan, J.; Huang, B.; Zhou, Z.C.; Zou, J.P. Rheological behavior of fumed silica suspension in polyethylene glycol. J. Cent. South. Univ. Technol. 2006, 13, 1–5. [Google Scholar] [CrossRef]
- Shenoy, A.V. Rheology of Filled Polymer Systems; Springer: Dordrecht, The Netherlands, 1999; pp. 175–243. [Google Scholar]
- Zhang, Q.; Wu, C.; Song, Y.; Zheng, Q. Rheology of fumed silica/polypropylene glycol dispersions. Polymer 2018, 148, 400–406. [Google Scholar] [CrossRef]
- Maxwell, J.C. A Treatise on Electricity and Magnetism, 3rd ed.; Oxford Clarendon Press: Oxford, UK, 1873. [Google Scholar]
- Hamilton, R.L.; Crosser, O.K. Thermal conductivity of heterogeneous two component systems. Ind. Eng. Chem. Fundam. 1962, 1, 187–191. [Google Scholar] [CrossRef]
- Keblinski, P.; Phillpot, S.R.; Choi, S.U.S.; Eastman, J.A. Mechanisms of heat flow in suspensions of nano-sized particles (nanofluids). Int. J. Heat Mass Transf. 2002, 45, 855–863. [Google Scholar] [CrossRef]
- Yu, W.; Choi, S.U.S. The role of interfacial layers in the enhanced thermal conductivity of nanofluids: A renovated Maxwell model. J. Nanopart. Res. 2003, 5, 161–167. [Google Scholar] [CrossRef]
- Pasrija, R.; Srivastava, S. The interfacial layer effect on thermal conductivity of nano-colloidal dispersions. Int. J. Appl. Phys. Math. 2014, 4, 1–4. [Google Scholar] [CrossRef]
- Kole, M.; Dey, T.K. Role of interfacial layer and clustering on the effective thermal conductivity of CuO–gear oil nanofluids. Exp. Therm. Fluid Sci. 2011, 35, 1490–1495. [Google Scholar] [CrossRef]
- Kochetov, R.; Korobko, A.V.; Andritsch, T.; Morshuis, P.H.F.; Picken, S.J.; Smit, J.J. Modelling of the thermal conductivity in polymer nanocomposites and the impact of the interface between filler and matrix. J. Phys. D Appl. Phys. 2011, 44, 395–401. [Google Scholar] [CrossRef]
- Timofeeva, E.V.; Gavrilov, A.N.; McCloskey, J.M.; Tolmachev, Y.V. Thermal conductivity and particle agglomeration in alumina nano-fluids: Experiment and theory. Phys. Rev. E 2007, 76, 061203. [Google Scholar] [CrossRef]
- Anoop, K.B.; Kabelac, S.; Sundararajan, T.; Das, S.K. Rheological and flow characteristics of nanofluids: Influence of electroviscous effects and particle agglomeration. J. Appl. Phys. 2009, 106, 034909. [Google Scholar] [CrossRef]
- Xiao, B.; Yang, Y.; Chen, L. Developing a novel form of thermal conductivity of nanofluids with Brownian motion effect by means of fractal geometry. Powder Technol. 2013, 239, 409–414. [Google Scholar] [CrossRef]
- Azizian, R.; Doroodchi, E.; Moghtaderi, B. Effect of nanoconvection caused by Brownian motion on the enhancement of thermal conductivity in nanofluids. Ind. Eng. Chem. Res. 2012, 51, 1782–1789. [Google Scholar] [CrossRef]
- Jang, S.P.; Choi, S.U.S. Role of Brownian motion in the enhanced thermal of nanofluids. Appl. Phys. Lett. 2004, 84, 43164318. [Google Scholar] [CrossRef]
- Machrafi, H.; Lebon, G. The role of several heat transfer mechanisms on the enhancement of thermal conductivity in nanofluids. Contin. Mech. Thermodyn. 2016, 28, 1461–1475. [Google Scholar] [CrossRef]
- Khan, S.A.; Zoeller, N.J. Dynamic rheological behavior of flocculated fumed silica suspensions. J. Rheol. 1993, 37, 1225–1235. [Google Scholar] [CrossRef]
- Ma, T.; Yang, R.; Zheng, Z.; Song, Y. Rheology of fumed silica/polydimethylsiloxane suspensions. J. Rheol. 2017, 61, 205–215. [Google Scholar] [CrossRef]
- Fuertes, A.B.; Valle-Vigón, P.; Sevilla, M. Synthesis of colloidal silica nanoparticles of a tunable mesopore size and their application to the adsorption of biomolecules. J. Colloid Interface Sci. 2010, 349, 173–180. [Google Scholar] [CrossRef] [PubMed]
- Heyse, A.; Kraume, M.; Drews, A. The impact of lipases on the rheological behavior of colloidal silica nanoparticle stabilized Pickering emulsions for biocatalytical applications. Colloids Surf. B 2020, 185, 110580. [Google Scholar] [CrossRef]
- Galindo-Rosales, F.J.; Rubio-Hernández, F.J.; Velázquez-Navarro, J.F. Shear-thickening behavior of Aerosil® R816 nanoparticles suspensions in polar organic liquids. Rheol. Acta 2009, 48, 699–708. [Google Scholar] [CrossRef]
- Rubio-Hernández, F.J.; Gómez-Merino, A.I.; Páez-Flor, N.M.; Velázquez-Navarro, J.F. On the steady shear behavior of hydrophobic fumed silica suspensions in PPG and PEG of low molecular weight. Soft Mater. 2017, 15, 55–63. [Google Scholar] [CrossRef]
- Barnes, H.A. Shear-thickening (“dilatancy”) in suspensions of nonaggregating solid particles dispersed in Newtonian liquids. J. Rheol 1989, 33, 329–366. [Google Scholar] [CrossRef]
- Eisenlauer, J.; Killmann, E. Stability of colloidal silica (aerosol) hydrosol. J. Colloid Interface Sci. 1980, 74, 108–119. [Google Scholar] [CrossRef]
- Raghavan, S.R.; Khan, S.A. Shear-thickening response of fumed silica suspensions under steady and oscillatory shear. J. Colloid Interface Sci. 1997, 185, 57–67. [Google Scholar] [CrossRef]
- Khan, S.A.; Baker, G.L.; Colson, S. Composite polymer electrolytes using fumed silica fillers: Rheology and ionic conductivity. Chem. Mater. 1994, 6, 2359–2363. [Google Scholar] [CrossRef]
- Raghavan, S.R.; Riley, M.; Fedwik, P.S.; Khan, S.A. Composite polymer electrolytes based on poly(ethylene) glycol and hydrophobic fumed silica: Dynamic rheology and microstructure. Chem. Mater. 1998, 10, 244–251. [Google Scholar] [CrossRef]
- Nguyen, Q.D.; Je, C.T.B.; Kristensen, P.G. Experimental and modeling studies of the properties of maize and waxy maize starch pastes. Chem. Eng. J. 1998, 70, 165–171. [Google Scholar] [CrossRef]
- Mulderig, A.; Beaucage, G.; Vogtt, K.; Jiang, H.; Kuppa, V. Quantification of branching in fumed silica. J. Aerosol Sci. 2017, 109, 28–37. [Google Scholar] [CrossRef]
- Shima, P.D.; Philip, J.; Raj, B. Synthesis of aqueous and nonaqueous iron oxide nanofluids and study of temperature dependence on thermal conductivity and viscosity. J. Phys. Chem. C 2010, 114, 18825–18833. [Google Scholar] [CrossRef]
- Das, P.K. A review based on the effect and mechanism of thermal conductivity of normal nanofluids and hybrid nanofluids. J. Mol. Liq. 2017, 240, 420–466. [Google Scholar] [CrossRef]
- Coquard, R.; Baillis, D.; Grigorova, V.; Enguehard, F.; Quenard, D.; Levitz, P. Modelling of the conductive heat transfer through nano-structured porous silica materials. J. Non Cryst. Solids 2013, 363, 103–115. [Google Scholar] [CrossRef]
- Prasher, R.; Bhattacharya, P.; Phelan, P.E. Brownian-motion-based convective-conductive model for the effective thermal conductivity of nanofluids. J. Heat Transf. 2006, 128, 588–595. [Google Scholar] [CrossRef]
- Dee, G.T.; Ougizawa, T.; Walsh, D.J. The pressure-volume-temperature properties of polyethylene, poly (dimethyl siloxane), poly (ethylene glycol) and poly (propylene glycol) as a function of molecular weight. Polymer 1992, 33, 3462–3469. [Google Scholar] [CrossRef]
- Swartz, E.T.; Pohl, R.O. Thermal boundary resistance. Rev. Mod. Phys. 1989, 61, 605. [Google Scholar] [CrossRef]
- Kou, Y.; Wang, S.; Luo, J.; Sun, K.; Zhang, J.; Tan, Z.; Shi, Q. Thermal analysis and heat capacity study of polyethylene glycol (PEG) phase change materials for thermal energy storage applications. J. Chem. Thermodyn. 2019, 128, 259–274. [Google Scholar] [CrossRef]
- Lide, D.R. CRC Handbook of Chemistry and Physics, 84th ed.; CRC Press, Taylor and Francis Group: Boca Raton, FL, USA, 2004. [Google Scholar] [CrossRef]
- O’Keefe, M.; Brese, N.E. Atom sizes and bond lengths in molecules and crystals. J. Am. Chem. Soc. 1991, 113, 3226–3229. [Google Scholar] [CrossRef]
- Li, Z.H.; Gong, Y.J.; Pu, M.; Wu, D.; Sun, Y.H.; Wang, J.; Liu, Y.; Dong, B.Z. Determination of interfacial layer thickness of a pseudo two-phase system by extension of the Debye equation. J. Phys. D Appl. Phys. 2001, 34, 2085–2088. [Google Scholar] [CrossRef]
- Yu, C.J.; Richter, A.G.; Datta, A.; Durbin, M.K.; Dutta, P. Molecular layering in a liquid on a solid substrate: An X-ray reflectivity study. Phys. B 2000, 283, 27–31. [Google Scholar] [CrossRef]
- Xue, L.; Keblinski, P.; Phillpot, S.R.; Choi, S.U.S.; Eastman, J.A. Effect of liquid layering at the liquid-solid interface on thermal transport. Int. J. Heat Mass Transf. 2004, 47, 4277–4284. [Google Scholar] [CrossRef]
- Wang, B.X.; Zhou, L.P.; Peng, X.F. A fractal model for predicting the effective thermal conductivity of liquid with suspension of nanoparticles. Int. J. Heat Mass Transf. 2003, 46, 2665–2672. [Google Scholar] [CrossRef]
- Krieger, I.M.; Dougherty, T.J. A mechanism for non-Newtonian flow in suspensions of rigid spheres. Trans. Soc. Rheol. 1959, 3, 137–152. [Google Scholar] [CrossRef]
- Gómez-Merino, A.I.; Rubio-Hernández, F.J.; Velázquez-Navarro, J.F.; Aguiar, J.; Jiménez-Agredano, C. Study of the aggregation state of anatase water nanofluids using rheological and DLS methods. Ceram. Int. 2013, 40, 14045–14050. [Google Scholar] [CrossRef]
- Smith, T.L.; Bruce, C.A. Intrinsic viscosities and other rheological properties of flocculated suspensions of nonmagnetic and magnetic ferric oxides. J. Colloid Interf. Sci. 1979, 72, 13–26. [Google Scholar] [CrossRef]
- Rubio-Hernández, F.J.; Ayúcar-Rubio, M.F.; Velazquez-Navarro, J.F.; Galindo-Rosales, F.J. Intrinsic viscosity of SiO2, Al2O3 and TiO2 aqueous suspensions. J. Colloid Interf. Sci. 2006, 298, 967–972. [Google Scholar] [CrossRef]


Publisher’s Note: MDPI stays neutral with regard to jurisdictional claims in published maps and institutional affiliations. |
© 2020 by the authors. Licensee MDPI, Basel, Switzerland. This article is an open access article distributed under the terms and conditions of the Creative Commons Attribution (CC BY) license (http://creativecommons.org/licenses/by/4.0/).