Abstract
The study investigated in situ biosynthesis of albumin capped 5-fluorouracil (5-FU) loaded gold nanoparticles (NPs) using bacterial extract for enhanced efficacy against MCF-7 and in silico prediction using a GastroPlus® software. The optimized formulations were characterized for morphology, size, zeta potential, drug loading (%DL) and entrapment (%EE), compatibility, in vitro drug release, in vitro hemolysis, cellular toxicity and apoptosis studies. The results exhibited highly dispersed albumin capped mono-metallic stable NPs. Spherical size, negative zeta potential and polydispersity index were in range of 38.25–249.62 nm, 18.18–29.87 mV and 0.11–0.283, respectively. F11, F7 and F3 showed a progressive increase in %DL and %EE with increased concentration of the cellular lysate (100% > 50% > 10%). The drug release was relatively extended over 48 h as compared to drug solution (96.64% release within 5 h). The hemolysis result ensured hemocompatibility (<14%) at the explored concentration. The biogenic F11 was more cytotoxic (81.99% inhibition by F11 and 72.04% by pure 5-FU) to the MCF-7 cell lines as compared to others which may be attributed to the preferential accumulation by the tumor cell and capped albumin as the source of energy to the cancer cells. Finally, GastroPlus® predicted the key factors responsible for improved pharmacokinetics parameters and regional absorption from various segments of human intestine. Thus, the approach can be more efficacious and suitable to control breast cancer when administered transdermally or orally.
1. Introduction
Breast cancer is the second most common leading cause of death amongst women. GLOBOCAN estimated 2,088,849 new cases of breast cancer (including both sexes of all ages) which is 11.6% of total new cases in 2018 [1]. 5-fluorouracil (5-FU) is a pyrimidine analogue (antimetabolite) commonly used to treat solid tumors (breast, skin, liver, ovarian, rectal, colon and gastrointestinal cancers) despite of having several side effects (severe bone marrow deficiency, skin reactions, hair thinning, severe gastrointestinal disturbances, hematological disturbances, hand foot syndrome) in conventional dosage forms [2]. Considering these alarming statistics and clinical limitations in chemotherapy, several novel drug delivery systems such as liposomes, polymeric nanoparticles (NPs), lipid nanoparticles, synthetic drug conjugates, synthetic inorganic NPs and lipidic nanoemulsion have been explored [3,4,5]. Interestingly, light activated gold NPs mediated photothermal therapy provided substantial efficacy to treat breast cancer without genetic side effects as compared to 5-FU [6]. However, the drug and carrier associated challenges limit their clinical applications. Generally, polymeric NPs possessed larger particle size, high polydispersity, stability, possible toxic metabolites, time consuming stepwise synthesis, difficult to scale up for large scale production and challenging task to translate from lab to clinical bed limit its safe application as drug carrier [7]. It is noteworthy that physical method requires heating of gold at reduced pressure to generate gold vapor while chemical method needs costly reducing agent, expensive capping agent, toxic solvent and chemical stabilizer with tedious process control [8]. Based on these concerns in chemotherapy, biogenic gold NPs (GNs) could be an alternative and attractive approach for delivery of small molecule such as 5-FU to control breast cancer. Several microbial methods have been reported due to cost effective ecofriendly synthesis and natural mechanisms of detoxification of metallic ions (Au) through reduction intracellularly or extracellularly by bioaccumulation, precipitation, biomineralization and biosorption using bacterial and fungal strains [9,10,11,12]. GNs have been reported to provide eminence in clinical benefits due to their distinctive properties such as (a) controlled size and shape owing to unique optical properties, (b) non-toxic and biocompatible mono metallic nanoparticles, (c) tunable surface dependent properties, (d) ease of synthesis, (e) desired surface functionalization, (f) protection drug from degradation, (g) increased blood circulation time, (h) enhanced efficacy through active or passive targeting and (i) preferential accumulation into the tumor tissue [13,14,15,16,17,18]. Moreover, low bioavailability, short plasma half-life (15–20 h), non-specificity and rapid metabolism of 5-FU forced the need to high dose of intravenous administration (400–600 mg/m2) [19]. Thus, GNs have high surface to volume ratio which is prudent to achieve increased drug payload leading to reduce the need of high dose of 5-FU and dose related toxicity to normal tissue [20,21]. Literature showed several authors reported improved efficacy of 5-FU loaded GNs against various cancer cell lines [22,23,24,25]. Wu et al., claimed 60% cell death against SW480 colon cancer cell lines when treated with 5-FU loaded onto oligonucleotide functionalized GNs (1 mg/mL) [25]. Furthermore, two thiol containing ligands (glutathione and thioglycolic acid) were investigated to functionalize GNs to increase 5-FU efficacy against colon cancer wherein glutathione functionalized GNs exhibited induced apoptosis and arrested the cell cycle progression [26]. Furthermore, 5-FU permeability across the mice skin was enhanced by capping gold NPs with two cationic ligands in addition to improved entrapment efficiency, loading capacity and stability (for 4 months at 4 and 25 °C) against salinity [26]. Therefore, biogenic synthesis of 5-FU loaded gold NPs followed by albumin (bovine serum albumin) capping could be a promising approach with high drug payload, desired targeted drug release, increased accumulation to tumor tissue, reduced dose related side effect and minimized hemolysis in the treatment of breast cancer. It has been known that capping Au NPs with albumin (surface modification) offers several advantages such as (a) improved colloidal stability, (b) increased blood circulation time, (c) biocompatibility, (d) augmented cellular uptake and intracellular trafficking and (e) reduced interaction with the plasma protein [27]. No study has been reported for transdermal or oral delivery of 5-FU using biogenic gold nanoparticle capped with BSA (bovine serum albumin) for obvious advantages.
In the present study, 5-FU loaded and BSA capped biogenic gold NPs (Au°) were prepared using Bacillus licheniformis based cellular lysate solution containing enzyme. The optimized and selected formulations were characterized for morphology, particle size, size distribution, % drug loading (%DL), % entrapment efficiency (%EE), Fourier transform infrared (FTIR). in vitro drug release, in vitro hemolysis, cell viability, morphological study of apoptosis using Hoechst 33342 nuclear staining dye (≥98.0% pure Merck, USA) and prediction studies using an in silico GastroPlus® simulation and prediction software (version 9.7, simulations Plus Inc., Lancaster, CA, USA). The optimized formulation needs to be investigated (in future communication) using suitable animal model to find the effect of capping on permeation parameters (permeation rate, targeted flux, enhancement ratio and permeation coefficient) as compared to free drug solution (DS) and uncapped gold NPs. The biogenic BSA capped gold NPs increased anticancer efficacy of 5-FU against MCF-7 cancer cell lines which could be a promising approach for transdermal or oral delivery to control breast cancer with minimum side effects and high patient compliance.
2. Materials and Methods
2.1. Materials
A Gram positive and thermophilic Bacillus licheniformis (B. licheniformis, MTCC 429) was obtained from Indian Institute of Microbial Technology, Chandigarh, Punjab, India. 5-Fluorouracil (5-FU) was gifted from Spectrochem Pvt. Ltd. (Mumbai, India). BSA (Bovine serum albumin) was procured from SRL, India. Chloroauric acid (HAuCl4) as starting material was procured from Sigma Aldrich, Mumbai. Mammary adenocarcinoma human cell lines (MCF-7) was obtained from Tata Memorial for Cancer Research, Kharghar, Mumbai, India, ATCC (American type culture collection). Dulbecco’s modified Eagle’s medium (DMEM) supplemented with 10% fetal bovine serum was purchased from HiMedia. An aqueous solution of 1% penicillin- streptomycin mixture was used in cell culture. Solvents and other reagents were of AR grade. Distilled water was used as an aqueous media for buffer and related preparation in the study.
2.2. Methods
2.2.1. Culture Growth and Isolation of Enzyme from Bacillus licheniformis
The bacteria was revived and sub-cultured as per the guideline of the sample leaflet information [27,28]. The culture was grown in a modified nitrate broth by incubating at 37 °C for 24 h under constant shaking (100 rpm) as described [27,28,29]. The growth media was supplemented with glucose as source of carbon. Then, the grown culture (10 mL) was centrifuged at 5000 rpm for 30 min to obtain a pellet at the bottom. The obtained pellet was further re-suspended in 50 mL of 0.05 M buffer solution (phosphate buffer solution as PBS) and subjected to probe sonication for 5 min with 30 s on-off cycle (sonic vibra Cell VC 130, Newton, MA, USA) to fracture the bacterial cells. Then, it was again centrifuged to separate the supernatant containing the enzymes which served as cellular lysate supernatant (CLS) for the synthesis of 5-FU loaded gold NPs. In this study, the extracted intracellular enzyme was utilized for the biosynthesis of gold nanoparticles as described below.
2.2.2. In Situ Biosynthesis of 5-FU Loaded BSA Capped Gold Nanoparticles
For the synthesis of 5-FU loaded gold nanoparticles, the extracted CLS (25 mL) was transferred to an Erlenmeyer flask (100 mL). The method was adopted by published report with slight modification [7,29]. In a typical reaction, the mixture of HAuCl4 (1 mL of 2 × 10⁻⁴ M) and the CLS (25 mL) incubated (30 °C for 8 h) followed by capping using the BSA aqueous (3 mg/mL) solution (1:1 ratio with HAuCl4) under constant stirring (150 rpm) and subsequent incubation at 30 °C for 72 h [29]. For uncapped placebo (GP), the same was followed except BSA under similar experimental conditions. For capped placebo gold NPs (CGP), the drug was not incubated with reaction mixtures (HAuCl4, CLS and BSA). For 5-FU loaded uncapped gold NPs (5-GP), 10 μL of the DS (50 mg/mL) and HAuCl4 were incubated with the CLS (25 mL) at 30 °C for 8 h. After 8 h, a visible purple color change was developed owing to CLS mediated reduction of Au+3 ions in the reaction mixture. Moreover, the reaction mixture was allowed to stand for 72 h to ensure complete reduction of Au ion (Au+3 ions). The obtained ruby red colored colloidal nanosuspension was further ultracentrifuged (18,000 rpm for 15 min) to isolate GP followed with washing using 10 mM PBS (phosphate buffer solution, pH 7.4). The resulting pellet was re-dispersed in PBS solution for further characterizations. The concentration of CLS solution extracted in supernatant was considered as 100%. Dilution was made with sterile water to make 10% and 50% for formulating various formulations (F1 to F16).
To understand the effect of concentration of CLS on %DL and %EE, three concentrations (10%, 50% and 100%) were accurately investigated [30]. Likewise, the concentration of HAuCl4 was varied and formulated at two concentrations (250 mg/L and 500 mg/L) [30]. The details of the developed formulations have been summarized in Table 1.

Table 1.
Developed 5-FU (1% w/v) loaded gold nanoparticles and placebo with varied concentrations of CLS (%) and HAuCl4 (mg/L).
2.3. Characterization of Gold Nanoparticles
2.3.1. Scanning Electron Microscopy (SEM) Study
Morphological evaluation of the developed NPs were examined under scanning electron microscopy (SEM) (Jeol, Japan; JSM 6390LV). The particles were carefully mounted on double-sided adhesive carbon tape and was coated with platinum using Jeol JFC-1600 Auto Fine Coater before scanning. The coated samples were scanned and visualized to obtain morphology at accelerated voltage of 10 kV and resolution of 20,000×. Moreover, the EDX-SEM (energy dispersive X-ray spectroscopy-scanning electron microscopy) was carried out to find the presence of gold from the uncoated sample.
2.3.2. Particle Size and Size Distribution of Selected Formulations
The average size and size distribution of all developed NPs (sixteen) were measured by dynamic light scattering (DLS) method (also known as photon correlation spectroscopy) which fundamentally measures Brownian motion of particles (Malvern Inst., UK; Nano ZS zetasizer). Formulations were 100 times diluted with distilled water. DLS provides the mean particle diameter (dm) and the polydispersity index (PDI). The mean diameter and PDI values were obtained at an angle of 90° and ambient temperature (25 °C). All samples were prepared by diluting with distilled water and sonicated for 2 min (30 s pulse on/off) before measurement to guarantee that the particles were homogeneously dispersed. All experiments were carried out in triplicate to obtain mean value (n = 3). Z-Average particle is defined as the following Equation:
where Dz is average particle size in terms of hydrodynamic diameter (nm), Dt,avg as translational diffusion coefficient (in DLS), KB as Boltzmann’s constant, T as thermodynamic temperature (°C) and η as dynamic viscosity (cP).
2.3.3. Zeta Potential of Selected Formulations
The gross surface charge or electrostatic potential of any particle or colloid in suspension is provided by zeta potential which implies the physical stability of colloidal systems. The NPs formulations were diluted (10 times) with distilled water before measurement. All of the samples were measured by dynamic light scattering method (Malvern Inst., UK; Nano ZS zetasizer), to check their stability. Surface charge signifies the electrostatic perspective and behavior of the particles in the system. All metals are reducing agent by birth and possess positive charge in ion form.
2.3.4. Drug Loading (%DL) and Entrapment Efficiency (%EE)
Experiments were carried out to determine the %DL of 5-FU from the stable formulations only. The theoretical %DL was calculated as the ratio of drug loaded in carrier to the total amount of 5-FU used in NPs multiplied by 100. The amount of 5-FU trapped (%EE) in nanoformulation was calculated as the difference between the amount of 5-FU used in the nanoformulations and the amount of 5-FU found in the supernatant. The amount of entrapped 5-FU in 5-GP (uncapped) and 5-CGP (capped) nanoformulations were estimated using UV-Vis spectrophotometer method. Freshly prepared aliquots of all developed formulations (all approx. 1 mL) were centrifuged at 12,000 rpm for 20 min, to separate bound 5-FU from unbound 5-FU present in the supernatant. Furthermore, the amount of entrapped 5-FU was estimated from the supernatant at 266 nm using UV-Vis spectrophotometer (U-1800, Tokyo, Japan).
2.3.5. Effect of Concentration of Cell Lysate on %EE
Formulations F3, F7 and F11 were formulated using cell lysate concentration (CLS) of 10%, 50% and 100%, respectively. Various lysate concentrations were prepared in distilled water. Then, %EE of loaded 5-FU was determined and calculated using spectrophotometer as per described in previous section. This was carried out in triplicate.
2.3.6. Fourier Transform Infrared (FTIR) Study
FTIR study was conducted to assess any possible chances of any incompatibility of the drug and excipients in formulation. FTIR spectral peaks are finger print of a compound used to compare with standard peak reported in terms of bond vibration, stretching and bond transition. In brief, a weighed amount of the sample (~50 mg) was completely admixed with dried KBr for pellet or disk formation. The disk was scanned using FTIR coupled with diffuse reflectance spectroscopy (DRS) in the range of 4000–500 cm−1 (FTIR 8400S; Shimadzu, Tokyo, Japan). The spectra was observed for the characteristic peaks of the drug and excipients to find compatibility.
2.3.7. In Vitro Drug Release Study
The cumulative dissolution release profiles of pure 5-FU aqueous solution (10 mg/mL), F-3, F-7, F-11 and F-15 were performed using the USP dissolution apparatus-II (Paddle). The samples were kept in dialysis membrane (12–14 K Dal molecular weight cut-off) properly tied with both ends and fixed inside sinker. Paddle was stirred with a constant speed of 50 rpm in 900 mL PBS (pH 7.4) as release medium at 37 °C [31,32,33]. To estimate the concentration of the drug released from each time point (1, 2, 4, 6, 8, 10 and 12 h), sample (1 mL) was withdrawn followed by replacing with fresh dissolution medium. The removed sample was centrifuged (12,000 rpm, 15 min) and filtered using a membrane filter (0.22 µm) before analysis spectrophotometer at 281 nm [34]. Moreover, the obtained results were applied for various mathematical models such as Zero order, First order, Higuchi model and Korsemeyer-peppas for mechanistic evaluation of drug release pattern [35]. The kinetics of the drug release from the formulations were studied using mathematical models as cited in the following equations.
Zero order:
First order:
Higuchi:
Weibull model:
Hixson-Crowell model:
where Dt and Do are the amount of drug released at time point t and the initial drug content, respectively. Similarly, ko, k1 and KH are zero order (concentration independent drug release), first order (concentration dependent drug release) and Higuchi (time dependent drug release) release constants, respectively. The Weilbull model predicts both the burst release as well as slow drug release. Another model Hixson-Crowell is suitable to describe the drug release from the particles when the size and surface area vary wherein Qo, Qt and KHC represent the initial concentration of the drug, the amount of the drug at time t and the model’s release rate constant, respectively. The value of “n” signifies that the value in the range of 0.28–0.84 explains the diffusion mediated (Fickian method of drug release) drug release. The value > 0.84 suggests non-Fickian release pattern.
2.3.8. In Vitro Hemolysis Study
To understand the insight of hemocompatibility of the developed formulations, it was prerequisite to investigate in vitro hemolysis assessment. For this, the developed formulations were diluted with saline water to achieve final lower concentration (100 µg/mL). Blood for erythrocytes or RBCs (red blood cells) was collected from healthy human volunteer into blood collection tube containing heparin as anticoagulant. The same was used to prepare 4% RBCs suspension in normal saline. Distilled water and saline were used as positive and negative controls, respectively. Erythrocytes suspension (0.5 mL) was treated with the test sample (1 mL) and final volume was made with PBS to 3.5 mL. Finally, they were incubated for one h at 37 ± 1 °C. After incubation, test tubes were centrifuged to remove lysed cellular debris and fibers. The supernatant was diluted with saline water and the content of hemoglobin (Hb) released after lysis was estimated taking absorbance at 550 nm using spectrophotometer [36]. The hemolysis caused by the positive control was considered as 100% and the content of Hb released is the marker of lysis under experimental conditions.
2.4. Cellular Cytotoxicity Assessment by the Developed Formulation
2.4.1. Cell Lines and Growth Media
MCF-7 was utilized for performing the cytotoxicity study using Dulbecco’s modified Eagle’s medium (DMEM) supplemented with 10% fetal bovine serum (Gibco, USA), 0.25% NaHCO3, 100 U/mL Penicillin G and 100 U/mL streptomycin to culture cell lines. The cells were cultured by incubating in a humidified incubator at standard conditions (18% O2 and 5% CO2 at 37 °C) for an appropriate time period. Furthermore, the cells were grown significantly in culture flask and after certain passages; the cells were seeded for cytotoxicity assessment.
2.4.2. Cell Viability Assay (MTT Assay)
Cell viability was evaluated and measured by MTT (3-(4,5-dimethylthiazol-2-yl)-2, 5-diphenyltetrazolium bromide (MTT)), to confirm antitumor activity in MCF-7. The cellular viability (MCF-7) was evaluated on the competency of the cells to alter tetrazolium salt to purple formazan crystals [32,33]. Cells were specifically seeded (5 × 10³ cells/well) in a sterilized 96-well culture plate and incubated for 24 h. MCF-7 cell culture was treated with various concentrations of formulations for 24 h to determine IC50 (half maximum inhibitory concentration). Furthermore, these cells were significantly treated with all the formulations (F7, F9, F10, F11, F12, F15, 5-FU solution and control untreated) at their IC50 concentration (except placebo) for four (4, 8, 12 and 24 h) time points. After 24 h of incubation, 20 µL of MTT solution (1 mg/mL) was added to each well accurately and the culturing (incubation) was further continued for next 4 h. 100 µL of DMSO (dimethyl sulfoxide) was added in each treated well which results into development of purple blue formazan dye formation as measured using an ELISA reader (BIORAD) at 490 nm and 630 nm. The percent relative cell viability is calculated as follows:
The study was repeated to investigate the influence of varied concentrations (10 and 100 µg/mL) on cytotoxic potential of the selected three formulations (F11, F12 and F15) and compared against 5-FU solution (10 and 100 µg/mL) under same experimental conditions. Subtraction of the percent viability from 100 gives us percent cytotoxicity. Saline was used as negative control while 5-FU drug is used as positive control in the study. Experiments were performed in triplicate.
2.4.3. Apoptosis Analysis and Morphological Studies
Cellular morphology was evaluated using Hoechst 33342 staining under a fluorescent microscope after treated cells as per reported method with slight modification [5]. This assay is stated to be a consistent method for quantification of apoptosis. The cell culture (MCF-7 cells) was plated into the 96 well plates to adhere and left overnight by maintaining at 37 °C in a humidified CO2 incubator. Furthermore, treated cells were gently rinsed thrice with pre-cold phosphate-buffered saline (pH 7.4) and stained with the dye (5 µg/mL) in each well and subsequently incubation at 37 ± 1 °C for 10 min. Then, cultured cells were treated with F11 (5.27 µg/mL as IC50) and 5-FU solution (22.25 µg/mL as IC50) followed by incubation at two time points (12 h and 24 h). Finally, they were again washed to remove excess dye and visualized for cell morphology after 12 h and 24 h as per scheduled under Nikon (DMI 4000B; Leica Microsystems) inverted fluorescence microscope (Ti series) at 40X magnification [32,33]. The percentage of apoptotic cells was calculated by:
2.4.4. GastroPlus® Prediction: In Silico Prediction
Parameter Sensitivity Analysis (PSA)
The drug is a hydrophilic molecule with negative logP value of 0.8 and pKa value of 7.7. The drug is associated with variable oral absorption and short half-life (10–20 min) which results in frequent drug dosing. In addition to these, other parameters (particle size, nanoeffect, solubility, permeability and shape) also affect pharmacokinetics (PK) profiles (Cmax, Tmax and AUC). Nanonization process affects PK parameters which can be predicted using PKplus module of GastroPlus® software version 9.7 (Simulation Plus Inc., Lancaster, CA, USA). The PSA study investigated the effect of solubility, NanoEffect and primary permeability on major PK parameters when administered orally.
Regional Absorption: Compartmental Absorption Prediction
The software predicts regional absorption of 5-FU and NPs (compartmental analysis) from nine different segments of gastrointestinal tract (GIT) based on the physicochemical properties and in vitro input parameters (from literature and by default system available in the software) of the drug. Thus, the required physicochemical input parameters (experimental, literature and ADMET Predictor® based) were added to the system before the program executes. These nine GIT segments are stomach, duodenum, jejunum-1, jejunum-2, ileum-1, ileum-2, ileum-3, caecum and ascending colon. The amount absorbed indicates the overall absorption. The regional absorption through different segments are illustrated in percent.
2.5. Statistical Analysis
In the present study, all data were calculated using the OriginPro8.0 software (version 8, origin lab, Northampton, MA, USA). The mean and standard deviation was identified statistically for cytotoxicity analysis and release kinetics data for 5-FU. The Student “t-test” was utilized for the statistical validation of cytotoxicity data. The value of ‘p’ value less than 0.05 was considered to be significant for calculating statistical differences amongst variables parameters. All studies were carried out in triplicate to present as mean with standard deviation value.
3. Results and Discussion
3.1. Culture Growth of Bacillus licheniformis
The bacteria was revived and found to be rod shaped [29]. Notably, the intracellular extract of bacteria was used for biogenic synthesis of gold NPs. Therefore, the supernatant was used for the synthesis of gold NPs loaded with 5-FU [29]. To find the effect of cell lysate concentration on the characteristics of NPs, three different concentrations (10%, 50% and 100%) were used.
3.2. Preparation of BSA Capped and Uncapped Gold Nanoparticles
To investigate the influence of lysate concentration and the concentration of chloroauric acid (250 mg/L and 500 mg/L) on NPs characteristics parameters such as drug loading and entrapment efficiency, several formulations were prepared as shown in Table 1. F1, F5 and F9 are placebo gold NPs with 10%, 50% and 100% cell lysate, respectively without BSA capping [37,38,39]. Similarly, F2, F6 and F10 are placebo gold NPs with 10%, 50% and 100% cell lysate, respectively with BSA capping. 5-FU loaded BSA capped gold NPs were F3, F7, F11 and F15 whereas F4, F8, F12 and F16 were uncapped formulations loaded with 5-FU as portrayed in Table 1. The biocompatible BSA was purposely utilized as a coating agent over the gold nanoparticles for increased drug loading and entrapment efficiency probably due to maximum interaction with 5-FU. It was reported that 5-FU exhibits its maximum drug loading and entrapment at pH below 6 due to maximized protonation (possessing two pKa values). It was also reported that BSA exists in two distinguishable unfolded states at pH range of 4.8–5.6 as compared to HSA (single unfold state) [40]. Therefore, it was optionally good for the present study so that we can achieve maximum drug loading, entrapment and coating over biogenic gold nanoparticles. Moreover, BSA based nanoparticles revealed sustained release of 5-FU as reported before [41]. Formulations such as F13, F14, F15 and F16 were prepared using lower concentration (250 mg/mL) of chloroauric acid (HAuCl4). Thus, the concentration of lysate and chloroauric acid were two main variables to formulate 16 formulations. The drug loaded formulations were lyophilized to remove aqueous phase from the formulation and subjected for morphological and other evaluation parameters. This improved stability and reconstitution ability in saline solution. The reconstituted product was free of any instability and settling issues for 48 h (bench top stability at room temperature). This product can be a suitable approach for transdermal and oral delivery to control breast cancer. Final strength of 5-FU reconstituted (normal saline) formulation was 1% w/v.
3.3. Characterizations of Prepared Formulations
All formulations were characterized for particle size, size distribution and zeta potential. Percent drug loading and entrapment efficiency were also determined for them. Results of the selected nine formulations were presented in Table 2. For morphological assessment, the representative images of SEM have been illustrated in Figure 1. In vitro drug release pattern, compatibility study using FTIR and in vitro hemocompatibility, have been discussed in subsequent discussion in the following subsections. Thus, evaluations parameters have been discussed coherently as below:
Table 2.
Characterizations of the selected stable placebo and 5-FU ferrying gold nanoparticles formulation with or without capped BSA (Bovine serum albumin).
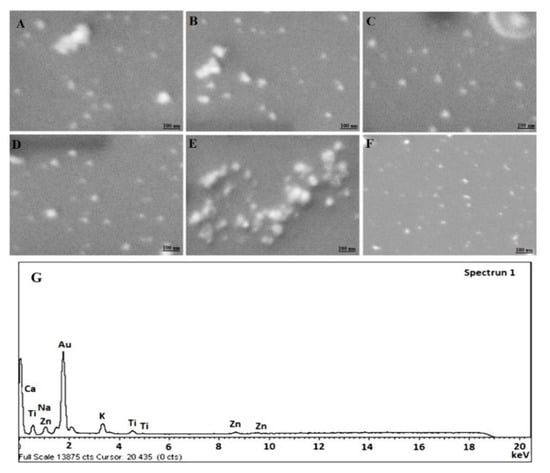
Figure 1.
Scanning electron microscopy (SEM) micrograph of (A) F9 (Placebo GP), (B) F10 (Placebo CGP), (C) F11 (5-CGP), (D) F12 (5-GP), (E) F14 (Placebo CGP), (F) F15 (5-CGP) and (G) EDX (energy dispersive X-ray spectroscopy) image of F11. 50.35 KX magnification and scale of 100 nm.
3.3.1. Morphological Analysis
The results of morphological assessment of selected formulations have been portrayed in Figure 1A–F. Figure 1A,B,E are placebo NPs comprising of drug free uncapped gold nanoparticles, drug free BSA capped gold NPs (HAuCl4 ~ 500 mg/L) and drug free BSA capped gold NPs (HAuCl4 ~ 250 mg/L), respectively. Figure 1C,D,F are 5-FU loaded formulations of respective placebo. Notably, the developed formulations were apparently spherical in shape with uniform distribution of particles. Moreover, Figure 1A,D are uncapped formulations with prominent smooth surface as compared to rest capped formulations (Figure 1B,C,E,F). Furthermore, F14 and F15 are not significantly different in morphology from those formulations prepared with higher concentration of HAuCl4. However, the size of NPs seems to be greater than former. This might be due to variation in nucleation rate at low concentration at explored pH and temperature [30]. There were large variations in the color changes while preparation with varied extract concentration and similar findings were noticed by the previous published literature [30]. The EDS study exhibited the presence of pure Gold in NPs as evidenced with intense peak observed in Figure 1G as compared to others.
3.3.2. Particle Size, Size-Distribution and Zeta Potential
The particle size is one of the most significant parameters used for determining biocompatibilities and bioactivities of NPs. It is an essential parameter because it has a direct consequence to the stability of the formulation during storage period [42,43]. The result has been presented in Table 2 wherein the particle size ranged as 38.25—249.63 nm. It is obvious to explain that F9 (38.25 ± 11.33 nm) and F10 (58.72 ± 17.65 nm) are significantly (p < 0.05) different in size owing to BSA coated gold NPs which was evident in SEM findings. It is obvious that capping imparted increment in particle size as measured by DLS. Furthermore, CLS affected particle size and size distribution as observed in Table 2. The particle size of F3, F7 and F11 were observed as 81.49 ± 12.41 nm, 140.46 ± 16.48 and 249.62 ± 18.45, respectively. There was a progressive increase in particle size from 10% to 100% cell lysate (F3, F7 and F11) and vice versa. The smallest particle size of capped F3 (81.49 ± 12.41 nm) was found with lowest concentration cell lysate (10%) and this was in excellent agreement with the reported results by Das et al., Song et al. and Kumari et al. [30,44,45]. The finding was rationalized based on the fact that higher concentration of cellular lysate (acting as reducing agent) might have increased the catalytic activity resulting into faster reaction rate and larger particle size with rapid particles growth (faster nucleation) [30]. It must be noted that pH, temperature and reaction time were kept constant throughout the experiment to observe the effect of one variable at a time. These are potential factors greatly affecting size and size distribution and thereby drug loading or %EE [30]. On comparing F11 and F15 being difference in HAuCl4 content (250 mg/mL and 500 mg/L) as shown in Table 1, the effect of gold content on particle size with 100% cell lysate was investigated. In Table 2, it is quite clear that there is reduction in particle size of gold nanoparticle when prepared with lower concentration of gold salt. Kumari et al. reported that there is vital role of temperature, gold salt and cell lysate on the shape of resulting nanoparticles. Furthermore, authors reported that particles were predominantly in mixed population with the lower content of gold salt (250 mg/mL) as compared to the higher concentration of the same (500 mg/L) (predominantly hexagonal) [30]. As per Table 2, the particle size of F11 is relatively larger than that of the F15 which might be explained with a reasonable and fundamental concept that cell lysates with higher concentration of gold salt are comparatively less available. This results into insufficient capping and stabilization action of reducing agent which then exposes different facets on surface leading to formation of larger size particles owing to random collisions and nuclei fusion [30,44]. The finding supported previous results of SEM shape image wherein Figure 1C revealed slight change in particle shape from spherical morphology prepared with higher concentration of gold salt as compared to lower concentration (Figure 1F). However, there are no significant differences in PDI value between F11 and F15 which might be due to formulated at the same temperature (30 °C). It is well known fact that the pH of the reaction mixture plays a vital role on the oxidation state and reducing power of cell lysate containing responsible enzyme and secondary metabolites [44]. In general, a mixed population of particle shape (tetragonal, hexagonal and rod shaped) and larger size are synthesized at lower pH 2–6. On further increasing pH (up to 8.5), there was substantial reduction in particle size with more spherical morphology [30]. Therefore, in our study, we set the reaction pH at 7.4 for getting optimum shape, size and size distribution (PDI < 0.3). The documented values of PDI were found to be less than 0.3 which signify a reasonably narrow particle size distribution in all the nanoformulations.
The result of zeta potential has been provided in Table 2 showing consistence and negative charge on the surface which may be attributed owing to phosphate anion (PO4−3) adsorption on the Au (as observed in uncapped placebo gold nanoparticles) or negatively charged BSA capped on the Au core [46]. These values ranged from −18.18 to −29.89 mV suggesting substantial surface charge for repulsion to avoid particle coagulation and results into stabilized formulation. There is a sensitive correlation between the zeta potential value and the loading of BSA molecules to the AuNPs at explored ratio (1:1) [46]. To understand the insight of charge while nucleation and particle size, pH of reaction mixture plays a significant role. In each method of gold nanoparticle synthesis, there is either the process of nucleation or crystal growth. There is a reduced repulsion between the anion of AuCl4− and COO− group of cell lysate (extract) which results into uncontrolled nucleation and subsequent larger mixed shape particle [47]. Thus, neutral pH (6–8) is suitable for optimum particle size and size distribution and negative charge is predominantly attributed by all three AuCl4− ions, BSA and carboxylic group of extract. At lower pH, repulsion between negatively charged AuCl4− ions and carboxylic group of extract is reduced resulting in uncontrolled nucleation of seeds and formation of larger mixed shape particles. Without BSA coated nanoparticle, the negative zeta potential is indicative of strong binding and adsorption of lysate to the surface of developed gold NPs and the finding is in accordance with values reported before [48].
3.3.3. %DL and %EE Studies
In the present study, there are two types of gold NPs prepared to ferry hydrophilic 5-FU. One set was capable to load or entrap drug on the lysate uncapped AuNPs represented as 5-GP (F4, F8, F12 and F16) (Table 1). Another set of formulations was expected with dual coatings such as initial coat with lysate followed by BSA. Since the drug is hydrophilic and soluble in aqueous medium then it may possibly be trapped in both capping matrixes. Thus, results of drug loading efficiency and entrapment efficiency have been illustrated in Figure 2 and Table 2. F3, F7 and F11 exhibited %DL as 26.9 ± 1.3, 54.5 ± 2.7 and 89.4 ± 3.2%, respectively. Similarly, F3, F7 and F11 exhibited %EE as 10.23 ± 0.01, 37.46 ± 0.8 and 64.77 ± 1.32%, respectively. This finding suggested that the loading efficiency was higher than the entrapment which could be prudent to correlate the hydrophilic nature of 5-FU adsorbed onto the biocompatible and hydrophilic BSA carrier. Moreover, %DL and %EE were found to be increased with the increase in cell lysate concentration (extract concentration) from 10% to 100%. It is obvious due to respective increase in size and coat thickness adsorbed on the AuNP [46]. Thus, there is direct relationship between the BSA (with 5-FU if laden) loading capacity per AuNPs and particle size (zeta potential too) [46]. Conclusively, the concentration of cell lysate affected %DL and %EE. Both parameters were found to be increased with increase in lysate concentration as shown in Figure 2. Furthermore, the study investigated the effect of gold concentration on %DL and %EE. On comparing the formulation F11 (HAuCl4 = 250 mg/mL) and F15 (HAuCl4 = 500 mg/mL), the values of %DL and %EE of F15 were found to be less as compared to F11 which could be owing to half concentration of gold salt. At low concentration of gold salt, cell lysate efficiently capped and stabilized with reduced particle size resulting in a minimized %DL and %EE at the explored temperature (30 °C) and pH (7.4) [30,46].
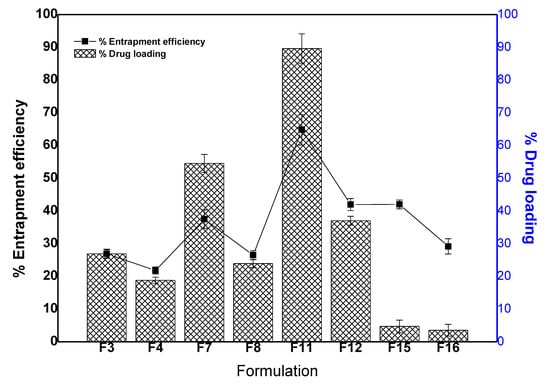
Figure 2.
Drug loading and entrapment efficiency (%) of the selected. Data presented as mean ± standard deviation (n = 3).
3.3.4. FT-IR Analysis
FT-IR analysis was carried out to identify any possible chemical interaction between the drug molecule and excipients for crafting the nanoparticles. The IR absorption spectra of pure 5-FU, placebo formulations, optimized formulations (F11, F12 and F15) and physical mixture of BSA-HAu (1:1 ratio) is portrayed in Figure 3A–G. A broad band between the 3000 and 3500 cm−1, is attributed to -NH stretching vibrations in the spectrum of 5-FU (Figure 3A). This band was also observed at 3130 cm−1 in the IR spectrum of 5-FU loaded F11, F12 and F15. 5-FU seemed to have band of carbonyl stretching (C=O) at 1662 cm−1. The peak at 1246 cm−1 belongs to C-F stretching band in the spectrum of 5-FU. This peak was perceived at 1249 cm−1 in the spectrum of fabricated F11, F12 and F15. The peaks obtained were in conformity with various literature reports indicating identity and purity of 5-FU [49]. Figure 3B,C showed the spectrum of placebo formulation of F9 and F10, respectively wherein gold NPs exhibited characteristic peaks at 3312.65 cm−1 (N-H stretching from amino group of protein), 1245.83 cm−1 (C-O-C stretching), 1090.32 cm−1 (C-O stretching), 1388.75 cm−1 (C-H bending), 1154.22 cm−1, a peak of NH3 + at 1554.76 cm−1 and 2923.43 cm−1 in agreement with our previous report [29]. The intense and broad peaks at 3312.65 cm−1 is due to inherent OH− hydroxyl and carboxylic groups present in the cellular lysate and BSA protein. It is noteworthy that less intense band at 1249.31 cm−1 corresponds to amide III functional group of protein suggesting the involvement of a capping agent (cell lysate as well as BSA) responsible for biogenic synthesis of AuNPs [29]. Figure 3D–G elicit preserved intense peak at 3312.65 cm−1 of gold salt interaction with the OH−1 group of extract reflecting the reducing property of intracellular enzyme. The intense peak (Figure 1G) of pure gold in nanoparticle biogenic synthesis corroborated the reduced form of AuCl4− salt to pure Au particles by interaction with the enzyme responsible for particle synthesis.
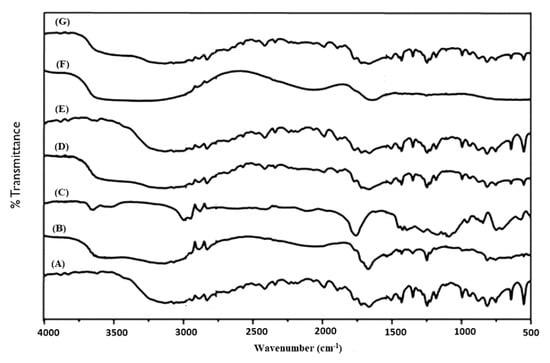
Figure 3.
Fourier transform infrared (FTIR) plot from top to bottom (A) 5-FU, (B) F9 gold nanoparticles (Placebo 5), (C) F10 gold nanoparticles CGP (Placebo 6), (D) F11 as 5-CGP (500 mg/mL), (E) F12 as 5-GP, (F) BSA-HAu mixture and (G) F15 as 5-CGP (250 mg/mL).
3.3.5. Drug Release Study
The drug release kinetic is important for assessing behavior of drug release from the tailored NPs as it can be easy to predict in vivo absorption pattern. 5-FU is soluble in PBS solution (pH 7.4) and the selected formulations (F3, F7, F11 and F15) were investigated for the drug release pattern. The amount of the drug released from matrix was compared amongst them based on the variation in composition. The release pattern is shown in Figure 4A where the 5-FU solution showed 96.64% within 6.8 h indicating no chemical interaction with the dialysis membrane. Formulation F11 exhibited maximum drug release (82.12%) in the same medium as compared to others formulations (F7, F15 and F3). Considering the effect of concentration of cell lysate, the released drug content get increased from 10% to 100% owing to maximum DL and EE from the formulations (F3, F7 and F11).
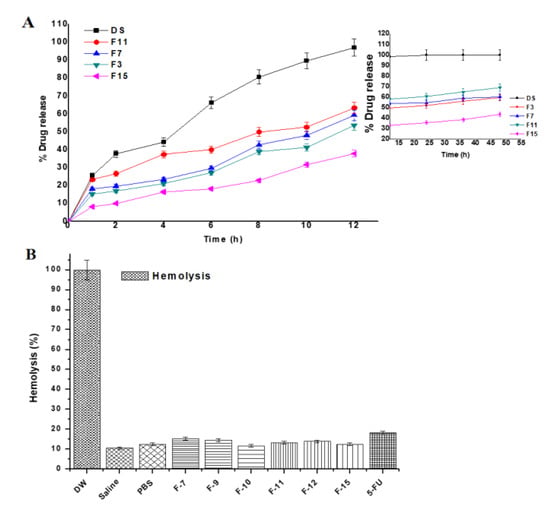
Figure 4.
(A) In vitro biphasic (0–12 and 12–48 h) drug release profile of the formulations and (B) In vitro hemolysis study of the developed gold nanoparticles over period of 4 h. Each sample was incubated with erythrocytes at 37 °C. DW (served as positive control) and PBS (buffer control) represent distilled water and phosphate buffer solution (pH 7.4), respectively. Data presented as mean ± sd (n = 3).
To understand the effect of gold salt concentration on release profile, there is direct relationship between %EE and the drug release. It was observed that the drug release increases with increase in %EE or %DL. The cumulative drug release profile of 5-FU from all nanoformulations followed sustained release pattern. Moreover, about 82% of free 5-FU was released within 6 h while F11 showed less than 40% 5-FU which were in accordance with the earlier findings [31]. These nanoformulations were able to release 5-FU in a biphasic pattern and characterized by an initial faster release trailed by a sustained release. The initial burst release (within 30 min) can be assigned due to the diffusion of loosely bound 5-FU molecules in the BSA matrix or 5-FU adsorbed on the AuNPs surface. These findings were found to be similar with reported studies [43,50,51]. The initial burst release provides immediate effect and the sustained release is requisite to avoid frequent drug administration. Conversely, the most desired release pattern for an encapsulated drug in a nanoparticle system for targeted delivery is sustained release over a prolonged time.
The release kinetic of 5-FU was biphasic (two phase pattern) in the studied medium. The initial phase up to 12 h showed burst release followed by slight release increment (12–48 h, inset of Figure 4A). The second phase (12–48 h) revealed slow and sustained release of 5-FU over period of 48 h (inset of Figure 4A). The release pattern of the developed 5-FU loaded formulation complies with the investigation reported by Nivethaa et al. [49]. For mechanistic understanding of release kinetics from each phase, various mathematical models were applied (Zero order, First order, Higuchi, Hixson-Crowell and Korsmeyer-Peppas etc.). The value of correlation coefficient usually > 0.97 was considered as the best fit model [49]. As per the value of r2 obtained after applying these models in the first phase, the values of zero order model for F3, F7, F11 and F15 were 0.992, 0.98, 0.99 and 0.99, respectively, confirming constant release (0–12 h) of the drug from the gold nanoparticles [49]. This approach of therapeutic drug delivery for achieving slow and sustained release (prolonged therapeutic action) could be a promising approach to control menace of breast cancer and colorectal cancers. Similarly, these values (zero order model) were found to be 0.95, 0.99, 0.99 and 0.98 for F3, F7, F11 and F15, respectively when applied for the subsequent phase 2. Moreover, these data were the best fit (r2 = 0.97–0.99) for Higuchi model for phase 2 describing the release kinetic process following the Fick’s law of diffusion. Furthermore, the values of “n” as diffusion exponent calculated by fitting in the Korsmeyer-Peppas model were in the range of 0.164–0.2426 and 0.062–0.103, for phase 1 and phase 2, respectively confirming the Fickian diffusion based controlled drug release mechanism. It is evident from the previous published report that 5-FU loaded gold NPs exhibited super class II transport mechanism (n = 1.8) in third phase (40–72 h) when formulated as chitosan/gold nanocomposite for breast cancer treatment [49].
3.3.6. Hemolysis Assessment
To confirm any possible hemoincompatibility of the developed formulations at explored concentration of excipients (particularly chloroauric acid) used in the formulations, it was prerequisite to assess in vitro hemolysis assessment using rat erythrocytes [34]. Parenteral administration of gold NPs (coated and uncoated) gained special interest of scientist working to treat tumor site by targeted delivery [52]. However, the circulating gold NPs in systemic circulation get exposed to blood cells and blood vessels for possible cause of hemolysis. Therefore, data of hemolysis of gold NPs loaded with anticancer drug for transdermal or oral delivery are limited. The study was designed to investigate the safety aspect of the developed nanoformulation on rat blood exposing with erythrocytes suspension and subsequent incubation for 4 h. Generally, gold NPs are plasma protein coated circulating in the blood for the treatment of cancer [53]. The result of ex vivo hemolysis study has been demonstrated in Figure 4B. The hemolysis caused by the distilled water (positive control) considered as 100% and negative control saline exhibited significantly low hemolysis (10.7%) as compared to others. However, all developed formulations F7, F9, F10, F11, F12 and F15 revealed minimum and approximate value to negative control and these values were 15.32%, 14.51%, 11.76%, 13.26%, 13.97% and 12.55%, respectively, during studied time. The free 5-FU solution (18.09%) showed slightly greater than the formulations due to its innate toxic potential. This might be correlated with the lysate and hemocompatible excipients (BSA) employed for capping the gold nanoparticles [50,51]. In the present study, the gold concentration (≤1.4 mM and 0.7 mM) exposed with erythrocytes suspension was much less than 20 mM as studied by Aseichev et al. [50]. It is well established fact that synthetic polymers and cationic surfactants owing to electrostatic interaction with negatively charged RBCs are more prone to hemolysis as compared to natural and neutral compounds suggested that the formulations were unable to interact with blood cells at physiological conditions [34]. In this investigation, formulations were coated with either cellular content of bacterial lysate or BSA solution. Thus, the formulations showed hemocompatible and safe without inducing any hemolysis.
3.3.7. MTT Assay Analysis
MTT assay was performed to show the potential of 5-FU on cellular growth inhibition as compared to the nanoformulation loaded with 5-FU against MCF-7 cells. Also, the effect of all the seven samples (F7, F9, F10, F11, F12 and F15) were observed against the treated MCF-7 cells [5,54]. The IC50 values of F7, F11, F12, F15 and 5-FU were found as 10.52, 5.27, 12.69, 17.85 and 22.25 µg/mL, respectively, estimated after 24 h of incubation. The cellular viability was evaluated by calculating the color intensity of formazan solution. As shown in Figure 5 (cell viability) and Appendix A Figure A1 exhibited time dependent and concentration (at IC50) dependent lethal potential (cells inhibition) by the optimized formulation, respectively. Notably, the number of viable cells treated with F7 and F11 were significantly (p < 0.05) reduced with increasing exposure time (Figure 5). This may be prudent to correlate with the content of cellular lysate and %DL (~54% for F7 and ~89% for F11) of F7 and F11. F11 was formulated using 100% cellular lysate which exhibited maximum inhibition as compared to F7 and the finding is in accordance with the reported results [30]. Authors reported that both reducing potential and capping ability depend on the concentration of cell free lysate (extract) [30]. Similarly, cytotoxic potential is also dependent on the concentration of the gold salt. It is clear that the F15 formulation exhibited slightly less inhibition at all studied time points (4, 8, 12 and 24 h) as compared to F11 which may be owing to the decreased amount of gold salt (250 mg/L) used to formulate F15 (Figure 5) [30]. However, the formulation F11 showed the maximum inhibition amongst them. It was interesting to notice that the nanoformulation of F11 showed percent cell viability of 18.23 ± 0.60% while 5-FU solution showed percent cell viability of 52.95 ± 1.43% which is ~3 fold higher than the DS (at 24 h). Conclusively, both gold salt concentration and the concentration of the extract are the prime factors for maximized drug loading, entrapment and suitable size.
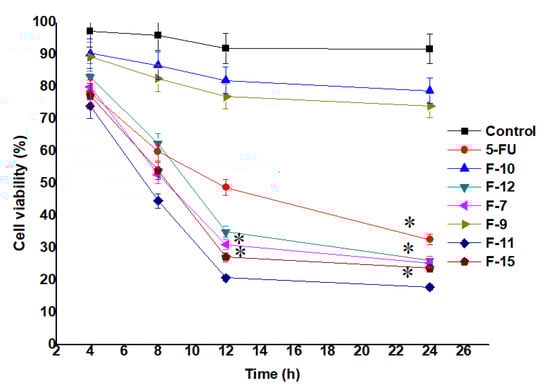
Figure 5.
Viable cells (MCF-7 cells) treated (at their IC50) with the formulations and drug solution (MTT assay). Data presented as mean ± standard deviation (n = 3). * Indicates statistically significant inhibition as compared to control (p < 0.05).
Three selected formulations (F11, F15 and F12) were further investigated for the effect of concentration on cytotoxicity (viable cells). Two concentrations (10 and 100 µg/mL) were used at four different exposure time as shown in Appendix A Figure A1. F11 and F15 differ in terms of the concentration of gold salt whereas F12 is prepared without BSA coating. The study was carried out to evaluate the effect of capped and uncapped gold NPs ferrying 5-FU. Moreover, the effect of concentration of the extract on the cellular cytotoxicity was investigated for different time points. The results showed that the viable cells were found to be 25.03% and 18.09% by F11 using the concentration of 10 and 100 µg/mL, respectively, at 24 h. The formulation F11 (100 µg/mL) showed significant cytotoxic potential (23.9% remained as viable cells) as compared to free DS (17.03% remained as viable cells) at 24 h. Appendix A Figure A1 showed concentration and time dependent cytotoxic potential of formulations. F11 showed maximum cytotoxicity at 24 h among them [55]. Thus, BSA capped F11 formulation has remarkable potential as a chemotherapeutic nanocarrier compared to 5-FU solution.
3.3.8. Cell Inhibition by Optimized F11 at IC50 and 0.5 × IC50 against MCF-7
F11 was the best optimized one amongst them and therefore, this was further studied for cellular inhibition at IC50 to compare with pure DS. In order to elucidate the concentration dependent cytotoxic effect on MCF-7 by the optimized F11, cells were incubated with two concentrations as shown in Figure 6. The result portrayed that there is progressive detrimental effect on MCF-7 cells when the concentration of exposure was increased (IC50 > 0.5 IC50). Moreover, this was relatively higher than the free 5-FU solution over explored period (24 h). In this study, 5.27 and 22.25 µg/mL were IC50 of F11 and 5-FU, respectively, against the MCF-7 cell lines (4 × 10⁴ cells/mL). Figure 6A showed densely populated normal and intact MCF-7 cells without treatment. Figure 6B,C exhibited comparative killing of tumor cells at two varied concentrations whereas Figure 6D,E revealed similar pattern of killing but relatively lesser than F11. Thus, after exposure at IC50 concentration of F11 caused profound cell inhibition as compared to pure 5-FU irrespective of time of incubation.
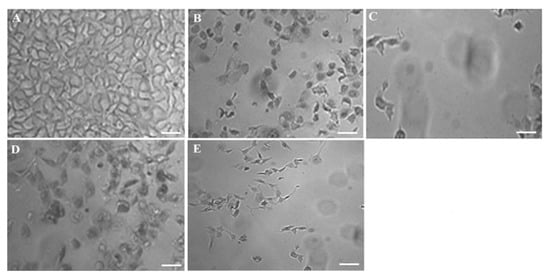
Figure 6.
Concentration dependent in vitro antitumor activity (MCF-7) of the optimized formulation (F11) and 5-FU pure drug after 24 h of exposure: (A) Control group, (B) 0.5 × IC50 of F11, (C) IC50 of F11, (D) 0.5 × IC50 of 5-FU pure and (E) IC50 of 5-FU pure. Scale bars = 50 µm.
3.3.9. Apoptosis Analysis and Morphological Studies
It is a well-established fact that apoptotic cells exhibit specific morphological changes such as cytoplasmic constriction, nuclear fragmentation and abnormal cellular shape [56]. Nuclear specific dye Hoechst 33342 was used to stain the MCF-7 cells treated with the IC50 of optimized F11 and 5-FU followed by incubation for 12 h and 24 h. The cellular alterations in nucleus (morphology) can be inspected distinctively for the apoptotic cells as compared to control normal live cells. Normal control cells are clearly distinct from the treated cells after varied incubation exposure suggesting progressive detrimental effect of F11 with time. Results have been portrayed in Figure 7. It is apparently clear that tumor cell density and nuclear fragmentation caused by F11 (IC50 = 5.27 µg/mL) was profound after 24 h of incubation as compared to 12 h as shown in Figure 7B,C. Similar pattern of cell cytotoxicity was observed with 5-FU solution (IC50 = 22.25 µg/mL). The data suggested that number of viable cells decreases with increase in drug concentration as shown in Figure 7A. This difference from pure 5-FU might be owing to (a) augmented cellular internalization of capped gold NPs with MCF-7 leading to enhanced permeation and retention effect (EPR effect), (b) albumin having ability to be accumulated in solid tumor site for targeted delivery, (c) GNPs possessing high surface to volume ratio resulting into increased drug payload for site specific delivery at minimized dose and (d) albumin possessed versatile properties for drug delivery such as small size (~66 kD), biocompatible, its abundance, established carrier for the targeted delivery to tumor site [7,57,58]. Moreover, F11 revealed localized stained DNA chromatin of the nucleus suggesting late-stage apoptotic cells due to identified intense blue and asymmetrically fragmented cells [55]. Necrotic cells were amplified in volume and exhibited uneven blue fluorescence because of stained condensed nuclei in Figure 7B–E by the dying cells only. The cells appeared to be in the process of disintegrating which shows that the F11 formulation had the maximum accumulation in the tumor cells which leads to substantial killing of cancer cells as compared to pure 5-FU. This may be correlated with the differences in IC50 values of both F11 and 5-FU. We hypothesized that BSA capped 5-FU ferrying gold NPs induced apoptosis was relatively high due to maximized %DL, %EE, small size, stability and albumin attributed cellular internalization with MCF-7 cells [55].
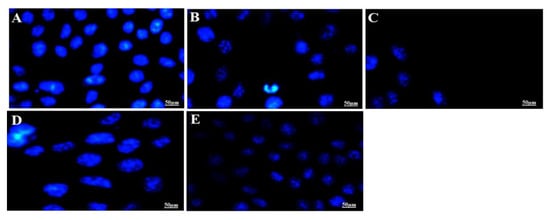
Figure 7.
In vitro apoptotic assay carried out for different treated time (12 h and 24 h) to visualize the nuclear morphological changes of apoptotic cells post treatment with F11 (5.27 µg/mL) and 5-FU pure drug (22.25 µg/mL) at their IC50 concentration. Fluorescence microscopic images revealed stained MCF-7 nucleus with Hoechst 33342 dye based on their morphological variation at varied time points. (A) Untreated control MCF-7 cells, (B) F11 treated for 12 h, (C) F11 treated for 24 h, (D) 5-FU treated for 12 h and (E) 5-FU treated for 24 h. Control group showed normal and intact blue dyed nucleus as compared to other treated groups. Figure 7B–E exhibited apparent fragmentation and loss of nuclear integrity as evidenced with shrinkage of nucleus or time dependent reduced number of cells.
It is a well-established fact that gold NPs possessing unique size, shape, inertness, surface dependent properties, biocompatibility, non-toxic and high surface to volume ratio (SVR). Gold NPs having high SVR properties result into high drug payload which may lead to significant dose and hence dose related toxicity to the normal tissue [7]. Efficient drug loading and entrapment to the gold NPs are still challenging tasks as the stability and drug delivery (in active form) from the systemic circulation to the target site are requisite concerns [7]. Several commercial (Abraxane) and literature survey provided successful proof of concept for efficient delivery of several anticancer drugs with mitigated toxicity and improved chemotherapeutic potential using biocompatible albumin bound (conjugated) delivery [59,60]. Murawala et al., reported in situ synthesis of BSA capped gold NPs for effective delivery of methotrexate against MCF-7 cell line wherein BSA capped gold NPs induced profound apoptosis as compared to pure methotrexate. Furthermore, it was confirmed that the preferential uptake by the MCF-7 cells was attributed to the presence of BSA acting as the source of nutrients and energy to rapidly proliferating cancerous cell lines [7]. In the present study, the use of BSA was based on the previous findings wherein the BSA served as dual benefits (reducing agent and stabilizer) in delivery of methotrexate. Interestingly, the capped BSA served as trio in our case such as reducing agent (secondary) for formulation preparation, stabilizer and carrier being hydrophilic to trap hydrophilic 5-FU [7]. BSA has long been explored for improved stability, non-immunogenicity and pharmacokinetics profiles.
3.3.10. GastroPlus® Prediction: PSA Analysis and Regional Absorption
In the present study, the PSA (parameter sensitivity analysis) study was performed under fast condition for the formulation parameters and the physiological parameters with high uncertainty. It is a potential and powerful soft tool for QbD (quality by design) implementation once it is validated for the key factors [61]. There are three basic tabs (interfaces) used for the data input functions such as (a) compound, (b) pharmacokinetics and (c) physiology pharmacokinetics tabs. It was required to feed the basic physicochemical properties (dose, dose volume, solubility, logP, pKa and molecular weight) of the drug in the compound tab as shown in Table 3 [62,63,64]. In the physiological tab, protein binding capacity, apparent permeability of colon and jejunum and human body weight were used. Similarly, the basic data pertaining to the PK parameters such as total clearance, elimination half-life and volume of distribution were entered in the pharmacokinetics tab for simulation and prediction estimation. The apparent effective permeability coefficient (Peff) for 5-FU was estimated in Caco-2 cell lines and obtained from the previously reported literature [64]. LogP, pKa, molecular formula, simulation time and human body weight were estimated using the ADMET predictorTM module of the software.
Table 3.
Details of the input parameters for 5-FU in the ACAT model of the GastroPlus® simulation.
The prediction results of the PSA study are exhibited in Figure 8, Figure 9 and Figure 10. The PSA study was carried out to assess the effect of the key parameters pertaining to the formulation on the drug dissolved in release media, percent drug absorbed and PK parameters (Cmax and AUC). These key parameters are drug particle size (as RadPart), apparent effective permeability (as Peff), nanonization effect (as NanoEffect), drug particle density (as DenPart), oral hold time (as OralHoldTime), particle shape, dose, pH, reference solubility and diffusion coefficient (as DiffCoeff). In this, PSA was run with high uncertainty for oral formulation to predict the effect of the key factors responsible for in vivo performance based on the in vitro input data. The Figure 8A clearly indicated that the drug dissolution was not affected with the drug particle size (RadPart), nanonization and Peff of the drug. The predicted value of 5-FU was 50.0 mg in 5 mL of PBS solution which is very close value to the reported aqueous solubility (11.1 mg/mL) (Table 3). Physicochemical properties (drug particle size, density, dose, shape and oral hold time) of the drug did not have an impact on the drug absorption as shown in prediction report (Figure 8B). Predicted percent drug absorbed was about 44.7% closely related to the drug dissolved (good correlation) as shown in Figure 8B. However, the nanoformulation changed the apparent effective permeability of 5-FU and % drug absorption was predicted as 80% at the particle size of 25 nm (Figure 8C). The percent drug absorbed increases with the increase of Peff value over particle size range of 25–100 nm as shown in Figure 8C.
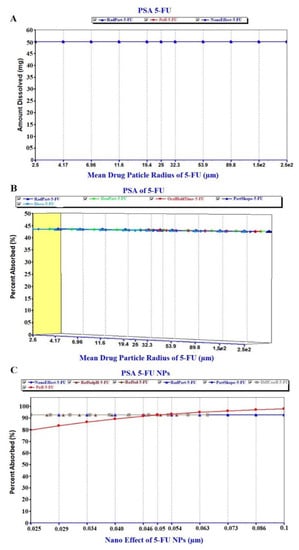
Figure 8.
Parameter sensitivity assessment (PSA) of the pure 5-FU and 5-FU loaded nanoparticles: (A) PSA of drug dissolution, (B) PSA of percent drug absorbed of free 5-FU and (C) PSA of % absorbed of 5-FU from NPs.
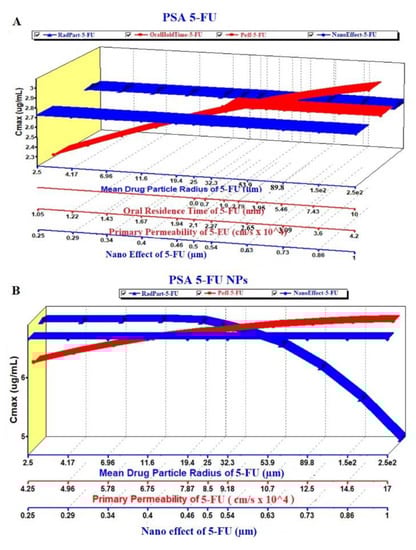
Figure 9.
PSA of the pure 5-FU and 5-FU loaded NPs: (A) Effect on Cmax of 5-FU and (B) Effect on Cmax of 5-FU loaded NPs.
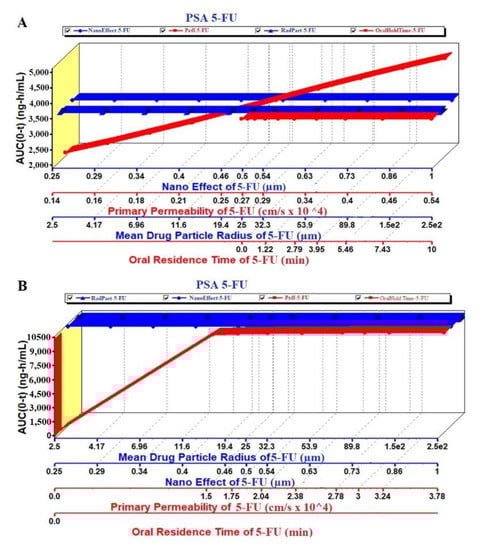
Figure 10.
PSA of the pure 5-FU and 5-FU loaded NPs: (A) Effect on AUC0-t of 5-FU and (B) Effect on AUC0-t of 5-FU loaded NPs.
The PSA study was performed on PK parameters, such as Cmax and AUC (area under the curve), for the pure 5-FU and 5-FU loaded NPs. The key parameters such as Peff, RadPart, oralHoldTime and particle size were taken into account to study their effect on these PK parameters. The result is illustrated in Figure 9A,B where there were no effect of particle size and NanoEffect on the Cmax for the pure 5-FU. However, Peff and oral hold time were found to be directly proportional to Cmax (Figure 9A). This prediction may be correlated with the lipophilic nature of the GIT mucosal membrane. Increased oral residence time increases the extent of absorption of any drug. Notably, the Cmax was found to be increased up to particle size (formulation) of 340 nm and then followed a plateau state (Figure 9A). The module predicted that both the Peff and nanoEffect (formulation effect) were significant on the Cmax whereas the drug-particle size (drug characteristic) was of no effect (Figure 9B). Comparing these two, the Cmax values of 5-FU and 5-FU-NPs were 2.7 and 6.8 µg/mL, respectively, which predicted that the biogenic NPs may improve the Cmax by ~2.5 folds than the pure 5-FU at formulation particle size of 250 nm. Two pka values of 5-FU are ~8.0 and 13 due to amino functional group which shows maximum ionization at pH 6 and it has been reported that protonation of amino group in 5-FU, is essential for drug incorporation in polymeric and gold based NPs [65,66,67].
Likewise, the AUC was studied in PSA prediction with respect to the same key parameters as shown in Figure 10A,B. There were no effect of the mean particle size and nanoEffect on the AUC whereas the Peff and the oralHoldTime showed considerable impact for pure 5-FU. It was a linear relationship of the Peff and oral hold time with the AUC (Figure 10A). On the other hand, the Figure 10B revealed a linear relationship between the AUC and Peff/oral hold time up to the particle size 340 nm. There was no effect of these key parameters at particle size > 340 nm. This may be due to the greater particle size which hindered oral absorption across the mucosal membrane of enterocytes. It is noteworthy that the AUC of the NPs was predicted profoundly greater (3 folds) than the pure 5-FU at the particle size of 250 nm (Figure 10A,B).
Regional Compartmental Absorption
The predicted regional absorption distribution of 5-FU and the 5-FU loaded NPs was generated by GastroPlus® as displayed in Figure 11A,B, respectively. The PKa value of 5-FU is 7.8 as reported in the literature which hinted that the absorption was expected from the intestinal portion being non-ionic nature of the drug at this pH. Thus, the drug could be maximally available in large amount as unionized form in the jejunum and ileum [62,63,64]. Comparing both of them, total amount of the drug absorbed from the GIT lumen was predicted as 63.8 and 98.56% for 5-FU and 5-FU loaded NPs, respectively. The percent absorption predicted was quite lower than the NPs which may be due to various factors playing together in NPs formulation. Moreover, the maximum drug absorption site predicted was jejunum in both cases wherein the total percent drug absorbed was 35.1% and 56.8% from the pure 5-FU and NPs, respectively. However, the percent drug absorption was significantly increased from 5.6% to 25.7% through the duodenum when formulated in NPs (Figure 11A,B). The hydrophilic nature of the drug hinders its permeation across the lipophilic mucosal membrane after mixing with the hydrophilic mucosal content. Therefore, the mucosal tissue is an ideal site for absorption of hydrophobic drug whereas the mucosal content (hydrophilic) favors emulsification of hydrophilic drug molecules. This might be a reason for > 80% 5-FU is degraded either at absorption site or after absorption [68]. These findings are in accordance with the general trends of the drug absorption.
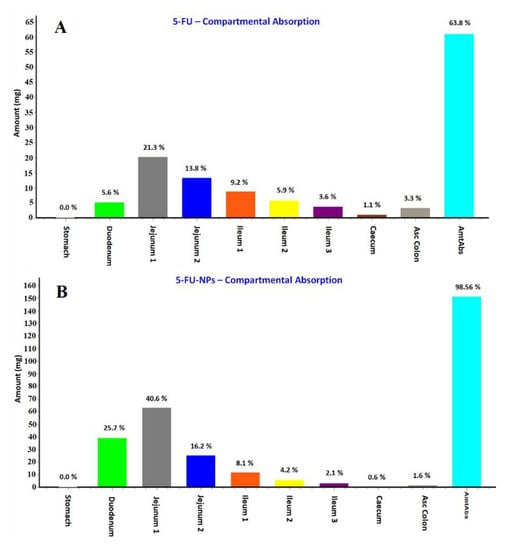
Figure 11.
Regional absorption of 5-FU from various segments of the GIT (gastrointestinal tract) predicted by the GastroPlus® simulation and prediction tool. (A) 5-FU; (B) 5-FU loaded NPs.
4. Conclusions
5-FU is gold standard anticancer drug for the treatment of breast tumor despite possessing several side effects, limited clinical efficacy and poor patient compliance. Proof of concept generated to guarantee an alternative approach using the biogenic albumin capped gold NPs based on in vitro findings was well explored. The bacterial based extract worked as good natural reducing agent and stabilizer to achieve the stable gold nanoparticle with an excellent drug payload and extended release profile. In vitro hemolysis study corroborated hemocompatibility of the formulation if delivered orally/transdermally to treat breast cancer. Albumin capping played a diverse role such as stability, controlled size, sustained drug release and preferential accumulation of NPs into the MCF-7 cell lines as compared to free DS. In addition, it helped to increase %DL, %EE and expected drug protection for prolonged blood circulation time. Furthermore, an MTT assay confirmed the superior efficacy of the formulated NPs to induce apoptosis in MCF-7 cells compared with free drug and other combinations. Finally, PSA study predicted the major keys factors related to the drug, formulation and physiological conditions which might play a vital role to influence pharmacokinetics profiles when administered orally. Moreover, there are several parameters that need to be taken into account for the formulation scientists as predicted by the in silico GastroPlus® simulation and prediction tool. Thus, biogenic albumin coated gold NPs could be a promising therapeutic approach for transdermal or oral delivery of 5-FU in chemotherapy.
Author Contributions
W.A.M.: conceptualization, software and funding, A.H.: conceptualization, software, writing—original draft preparation, M.R.: data curation and reviewing. All authors have read and agreed to the published version of the manuscript.
Funding
All authors are thankful to the Deputyship for Research & Innovation “Ministry of Education” in Saudi Arabia for funding this research work through the project number IFKSURG-1441-443.
Acknowledgments
The authors extend their sincere appreciation to the Deputyship for Research & Innovation “Ministry of Education” in Saudi Arabia for funding this research work through the project number IFKSURG-1441-443.
Conflicts of Interest
No conflict of interest reported.
Appendix A

Figure A1.
Cell viability (%) of MCF-7 cells (MTT assay: Concentration (10 and 100 mcg/mL) and time (4, 8, 12, and 24 h) dependent cytotoxicity potential of the optimized formulations.
Figure A1.
Cell viability (%) of MCF-7 cells (MTT assay: Concentration (10 and 100 mcg/mL) and time (4, 8, 12, and 24 h) dependent cytotoxicity potential of the optimized formulations.

References
- World Health Organization. Available online: https://gco.iarc.fr (accessed on 1 April 2020).
- Macdonald, J.S. Toxicity of 5-fluorouracil. Oncology 1999, 13, 33–34. [Google Scholar] [PubMed]
- Haggag, Y.A.; Osman, M.A.; El-Gizawy, S.A.; Goda, A.E.; Shamloula, M.M.; Faheem, A.M.; McCarron, P.A. Polymeric nano-encapsulation of 5-fluorouracil enhances anti-cancer activity and ameliorates side effects in solid Ehrlich Carcinoma-bearing mice. Biomed. Pharmacother. 2018, 105, 215–224. [Google Scholar] [CrossRef] [PubMed]
- Lai, L.F.; Guo, H.X. Preparation of new 5-fluorouracil-loaded zein nanoparticles for liver targeting. Int. J. Pharm. 2011, 404, 317–323. [Google Scholar] [CrossRef] [PubMed]
- Le, V.M.; Nho, T.D.T.; Ly, H.T.; Vo, T.S.; Nguyen, H.D.; Phung, T.T.H.; Zou, A.; Liu, J. Enhanced anticancer efficacy and tumor targeting through folate-PEG modified nanoliposome loaded with 5-fluorouracil. Adv. Nat. Sci. Nanosci. Nanotechnol. 2017, 8, 7. [Google Scholar] [CrossRef]
- Gomaa, I.E.; Gaber, S.A.A.; Bhatt, S.; Liehr, T.; Glei, M.; El-Tayeb, T.A.; Abdel-Kader, M.H. In vitro cytotoxicity and genotoxicity studies of gold nanoparticles-mediated photo-thermal therapy versus 5-fluorouracil. J. Nanopart. Res. 2015, 17, 102. [Google Scholar]
- Murawala, P.; Tirmale, A.; Shiras, A.; Prasad, B.L.V. In situ synthesized BSA capped gold nanoparticles: Effective carrier of anticancer drug Methotrexate to MCF-7 breast cancer cells. Mater. Sci. Eng. C 2014, 34, 158–167. [Google Scholar] [CrossRef]
- Srivastav, S.K.; Yamada, R.; Ogino, C.; Kondo, A. Biogenic synthesis and characterization of gold nanoparticles by Escherichia coli K12 and its heterogeneous catalysis in degradation of 4-nitrophenol. Nanoscale Res. Lett. 2013, 8, 70. [Google Scholar] [CrossRef]
- Das, S.K.; Das, A.R.; Guha, A.K. Gold nanoparticles: Microbial synthesis and application in water hygiene management. Langmuir 2009, 25, 8192–8199. [Google Scholar] [CrossRef]
- Gericke, M.; Pinches, A. Microbial production of gold nanoparticles. Gold Bull. 2006, 39, 22–28. [Google Scholar] [CrossRef]
- Narayanan, K.B.; Sakthivel, N. Biological synthesis of metal nanoparticles by microbes. Adv. Colloid Interface Sci. 2010, 156, 1–13. [Google Scholar] [CrossRef]
- Thakkar, K.N.; Mhatre, S.S.; Parikh, R.Y. Biological synthesis of metallic nanoparticles. Nanomed.-Nanotechnol. 2010, 6, 257–262. [Google Scholar] [CrossRef] [PubMed]
- Boisselier, E.; Astruc, D. Gold nanoparticles in nanomedicine: Preparations, imaging, diagnostics, therapies and toxicity. Chem. Soc. Rev. 2009, 38, 1759–1782. [Google Scholar] [CrossRef] [PubMed]
- Daniel, M.C.; Astruc, D. Gold nanoparticles: Assembly, supramolecular chemistry, quantum-size-related properties and applications toward biology, catalysis and nanotechnology. Chem. Rev. 2004, 104, 293–346. [Google Scholar] [CrossRef] [PubMed]
- Ghosh, P.; Han, G.; De, M.; Kim, C.K.; Rotello, V.M. Gold nanoparticles in delivery applications. Adv. Drug Deliv. Rev. 2008, 60, 1307–1315. [Google Scholar] [CrossRef]
- Kumar, A.; Ma, H.; Zhang, X.; Huang, K.; Jin, S.; Liu, J.; Wei, T.; Cao, W.; Zou, G.; Liang, X.J. Gold nanoparticles functionalized with therapeutic and targeted peptides for cancer treatment. Biomaterials 2012, 33, 1180–1189. [Google Scholar] [CrossRef]
- Maeda, H.; Nakamura, H.; Fang, J. The EPR effect for macromolecular drug delivery to solid tumors: Improvement of tumor uptake, lowering of systemic toxicity and distinct tumor imaging in vivo. Adv. Drug Deliv. Rev. 2003, 65, 71–79. [Google Scholar] [CrossRef]
- Paciotti, G.F.; Myer, L.; Weinreich, D.; Goia, D.; Pavel, N.; McLaughlin, R.E.; Tamarkin, L. Colloidal gold: A novel nanoparticle vector for tumor directed drug delivery. Drug Deliv. 2004, 11, 169–183. [Google Scholar] [CrossRef]
- Lee, J.J.; Beumer, J.H.; Chu, E. Therapeutic drug monitoring of 5-fluorouracil. Cancer Chemother. Pharmacol. 2016, 78, 447–464. [Google Scholar] [CrossRef]
- Dhar, S.; Reddy, E.M.; Shiras, A.; Pokharkar, V.; Prasad, B.L.V. Natural gum reduced/stabilized gold nanoparticles for drug delivery formulations. Chem. Eur. J. 2008, 14, 10244–10250. [Google Scholar] [CrossRef]
- Kratz, F. Albumin as a drug carrier: Design of prodrugs, drug conjugates and nanoparticles. J. Control Release 2008, 132, 171–183. [Google Scholar] [CrossRef]
- Mohamed, M.B.; Adbel-Ghani, N.T.; El-Borady, O.M.; El-Sayed, M.A. 5-Fluorouracil induces plasmonic coupling in gold nanospheres: New generation of chemotherapeutic agents. J. Nanomed. Nanotechnol. 2012, 3, 1–7. [Google Scholar] [CrossRef]
- Ngernyuang, N.; Seubwai, W.; Daduang, S.; Boonsiri, P.; Limpaiboon, T.; Daduang, J. Targeted delivery of 5-fluorouracil to cholangiocarcinoma cells using folic acid as a targeting agent. Mater. Sci. Eng. C 2016, 60, 411–415. [Google Scholar] [CrossRef] [PubMed]
- Safwat, M.A.; Soliman, G.M.; Sayed, D.; Attia, M.A. Fluorouracil-loaded gold nanoparticles for the treatment of skin cancer: Development, in vitro characterization and in vivo evaluation in a mouse skin cancer xenograft model. Mol. Pharm. 2018, 15, 2194–2205. [Google Scholar] [CrossRef] [PubMed]
- Wu, C.M.; Wu, P.C.; Wang, Y.H.; Li, T.J.; Yang, L.X.; Wu, Y.N.; Yang, H.Y.; Shieh, D.B. Synthesis of polynucleotide modified gold nanoparticles as a high potent anti-cancer drug carrier. J. Chin. Chem. Soc. 2009, 56, 703–708. [Google Scholar] [CrossRef]
- Safwat, M.A.; Ghareb, M.S.; Sayed, D.; Attia, M.A. Gold nanoparticles capped with benzalkonium chloride and poly (ethylene imine) for enhanced loading and skin permeability of 5-fluorouracil. Drug Dev. Ind. Pharm. 2017, 43, 1780–1791. [Google Scholar] [CrossRef] [PubMed]
- Zhao, F.; Zhao, Y.; Liu, Y.; Chang, X.; Chen, C.; Zhao, Y. Cellular uptake, intracellular trafficking and cytotoxicity of nanomaterials. Small 2011, 2011. 7, 1322–1337. [Google Scholar] [CrossRef]
- Mohammad, O.; Faisal, S.M.; Ahmad, N.; Rauf, M.A.; Umar, M.S.; Mujeeb, A.A.; Pachauri, P.; Ahmed, A.; Kashif, M.; Ajmal, M.; et al. Bio-mediated synthesis of 5-FU based nanoparticles employing orange fruit juice: A novel drug delivery system to treat skin fibrosarcoma in model animals. Sci. Rep. 2019, 9, 12288. [Google Scholar] [CrossRef]
- Singh, S.; Vidyarthi, A.S.; Nigam, V.K.; Dev, A. Extracellular facile biosynthesis, characterization and stability of gold nanoparticles by Bacillus licheniformis. Artif. Cells Nanomed. Biotechnol. 2014, 42, 6–12. [Google Scholar] [CrossRef]
- Kumari, M.; Mishra, A.; Pandey, S.; Singh, S.P.; Chaudhry, V.; Mudiam, M.K.R.; Nautiyal, C.S. Physico-chemical condition optimization during biosynthesis lead to development of improved and catalytically efficient gold nanoparticles. Sci. Rep. 2016, 6, 1–14. [Google Scholar] [CrossRef]
- Karmi, A.; Husseini, G.A.; Faroun, M.; Sowwan, M. Multifunctional nanovehicles for combined 5-fluorouracil and gold nanoparticles based on the nanoprecipitation method. J. Nanosci. Nanotechnol. 2011, 11, 4675–4683. [Google Scholar] [CrossRef]
- Nair, L.; Jagadeeshan, S.; Nair, S.A.; Kumar, G.V. Biological evaluation of 5-fluorouracil nanoparticles for cancer chemotherapy and its dependence on the carrier, PLGA. Int. J. Nanomed. 2011, 6, 1685. [Google Scholar]
- Pan, X.; Zhang, X.; Sun, H.; Zhang, J.; Yan, M.; Zhang, H. Autophagy inhibition promotes 5-fluorouraci-induced apoptosis by stimulating ROS formation in human non-small cell lung cancer A549 cells. PLoS ONE 2013, 8, e56679. [Google Scholar] [CrossRef] [PubMed]
- Hussain, A.; Samad, A.; Ramzan, M.; Ahsan, M.N.; Rehman, Z.; Ahmad, F.J. Elastic liposome-based gel for topical delivery of 5-fluorouracil: In vitro and in vivo investigation. Drug Deliv. 2016, 23, 1115–1129. [Google Scholar] [CrossRef] [PubMed]
- Dash, V.; Mishra, S.K.; Singh, M.; Goyal, A.K.; Rath, G. Release kinetic studies of aspirin microcapsules from ethyl cellulose, cellulose acetate phthalate and their mixtures by emulsion solvent evaporation method. Sci. Pharm. 2010, 78, 93–102. [Google Scholar] [CrossRef] [PubMed]
- Hussain, A.; Shakeel, F.; Singh, S.K.; Al sarra, I.A.; Faruk, A.; Alanazi, F.K.; Christoper, G.V.P. Solidified SNEDDS for the oral delivery of rifampicin: Evaluation, proof of concept, in vivo kinetics and in silico GastroPlusTM simulation. Int. J. Pharm. 2019, 566, 203–217. [Google Scholar] [CrossRef] [PubMed]
- Baskaran, M.; Baskaran, P.; Arulsamy, N.; Thyagarajan, B. Preparation and evaluation of PLGA-coated capsaicin magnetic nanoparticles. Pharm. Res. 2017, 34, 1255–1263. [Google Scholar] [CrossRef]
- McCall, R.L.; Sirianni, R.W. PLGA nanoparticles formed by single-or double-emulsion with vitamin E-TPGS. J. Vis. Exp. JoVE 2013, 82, 1–8. [Google Scholar] [CrossRef]
- Zhang, Z.; Wang, X.; Li, B.; Hou, Y.; Yang, J.; Yi, L. Development of a novel morphological paclitaxel-loaded PLGA microspheres for effective cancer therapy: In vitro and in vivo evaluations. Drug Deliv. 2018, 25, 166–177. [Google Scholar] [CrossRef]
- Steinhardt, J.; Krijn, J.; Leidy, J.G. Differences between Bovine and Human Serum Albumins: Binding Isotherms, Optical Rotatory Dispersion, Viscosity, Hydrogen Ion Titration and Fluorescence Effects. Biochemistry 1971, 10, 4005–4015. [Google Scholar] [CrossRef]
- Maghsoudi, A.; Shojaosadati, S.A.; Farahani, E.V. 5-Fluorouracil-Loaded BSA Nanoparticles: Formulation Optimization and In Vitro Release Study. AAPS Pharm. Sci. Tech. 2008, 9, 1092–1096. [Google Scholar] [CrossRef]
- Matai, I.; Sachdev, A.; Gopinath, P. Multicomponent 5-fluorouracil loaded PAMAM stabilized-silver nanocomposites synergistically induce apoptosis in human cancer cells. Biomater. Sci. 2015, 3, 457–468. [Google Scholar] [CrossRef] [PubMed]
- Sun, S.B.; Liu, P.; Shao, F.M.; Miao, Q.L. Formulation and evaluation of PLGA nanoparticles loaded capecitabine for prostate cancer. Int. J. Clin. Exp. Med. 2015, 8, 19670. [Google Scholar] [PubMed]
- Das, S.K.; Das, A.R.; Guha, A.K. Microbial synthesis of multishaped gold nanostructures. Small 2010, 6, 1012–1021. [Google Scholar] [CrossRef] [PubMed]
- Song, J.Y.; Jang, H.K.; Kim, B.S. Biological synthesis of gold nanoparticles using Magnolia kobus and Diopyros kaki leaf extract. Process. Biochem. 2009, 44, 1133–1138. [Google Scholar] [CrossRef]
- Wang, W.; Ding, X.; Xu, Q.; Wang, J.; Wang, L.; Lou, X. Zeta-potential data reliability of gold nanoparticle biomolecularconjugates and its application in sensitive quantification of surfaceabsorbed protein. Colloids Surf. B Biointerfaces 2016, 148, 541–548. [Google Scholar] [CrossRef]
- Sneha, K.; Kumar, S.M.; Kim, S.; Yun, Y. Counter ions and temperature incorporated tailoring of biogenic gold nanoparticles. Process. Biochem. 2010, 45, 1450–1458. [Google Scholar] [CrossRef]
- Komalam, A.; Muraleegharan, L.G.; Subburaj, S.; Suseela, S.; Babu, A.; George, S. Designed plasmonic nanocatalysts for the reduction of eosin Y: Absorption and fluorescence study. Int. Nano Lett. 2012, 2, 26. [Google Scholar] [CrossRef]
- Nivethaa, E.A.K.; Dhanavel, S.; Narayanan, V.; Vasu, C.A.; Stephen, A. An in vitro cytotoxicity study of 5-fluorouracil encapsulated chitosan/gold nanocomposites towards MCF-7 cells. RSC Adv. 2015, 5, 1024–1032. [Google Scholar] [CrossRef]
- Senapati, S.; Mahanta, A.K.; Kumar, S.; Maiti, P. Controlled drug delivery vehicles for cancer treatment and their performance. Signal Transduct. Target. Ther. 2018, 3, 7. [Google Scholar] [CrossRef]
- Tawfik, E.; Ahamed, M.; Almalik, A.; Alfaqeeh, M.; Alshamsan, A. Prolonged exposure of colon cancer cells to 5-fluorouracil nanoparticles improves its anticancer activity. Saudi Pharm. J. 2017, 25, 206–213. [Google Scholar] [CrossRef]
- Aseichev, A.V.; Azizova, O.A.; Beckman, E.M.; Skotnikova, O.I.; Dudnik, L.B.; Shcheglovitova, O.N.; Sergienko, V.I. Effects of Gold Nanoparticles on Erythrocyte Hemolysis. Bull. Exp. Biol. Med. 2014, 156, 495–498. [Google Scholar] [CrossRef] [PubMed]
- Dobrovolskaia, M.A.; Patri, A.K.; Zheng, J.; Clogston, J.D.; Ayub, N.; Aggarwal, P.; Neun, B.W.; Hall, J.B.; McNeil, S.E. Interaction of colloidal gold nanoparticles with human blood: Effects on particle size and analysis of plasma protein binding profiles. Nanomedicine 2009, 5, 106–117. [Google Scholar] [CrossRef] [PubMed]
- Mohiyuddin, S.; Naqvi, S.; Packirisamy, G. Enhanced antineoplastic/therapeutic efficacy using 5-fluorouracil-loaded calcium phosphate nanoparticles. Beilstein J. Nanotechnol. 2018, 9, 2499–2515. [Google Scholar] [CrossRef] [PubMed]
- Su, J.; Cheng, H.; Zhang, D.; Wang, M.; Xie, C.; Hu, Y.; Chang, H.C.-W.; Li, Q. Synergistic Effects of 5-Fluorouracil and Gambogenic Acid on A549 Cells: Activation of Cell Death Caused by Apoptotic and Necroptotic Mechanisms via the ROS-Mitochondria Pathway. Biol. Pharm. Bull. 2014, 37, 1259–1268. [Google Scholar] [CrossRef]
- Kumar, U.S.; Matai, I.; Dubey, P.; Bhushan, B.; Sachdev, A.; Gopinath, P. Differentially cross-linkable core–shell nanofibers for tunable delivery of anticancer drugs: Synthesis, characterization and their anticancer efficacy. RSC Adv. 2014, 4, 38263–38272. [Google Scholar] [CrossRef]
- Bala, I.; Hariharan, S.; Kumar, M.R. PLGA nanoparticles in drug delivery: The state of the art. Crit. Rev. Ther. Drug Carrier Sys. 2004, 21, 387–422. [Google Scholar] [CrossRef]
- Matsumura, Y.; Maeda, H. A new concept for macromolecular therapeutics in cancer chemotherapy: Mechanism of tumoritropic accumulation of proteins and the antitumor agent smancs. Cancer Res. 1986, 46, 6387–6392. [Google Scholar]
- Stehle, G.; Sinn, H.; Wunder, A.; Schrenk, H.H.; Schütt, S.; Maier-Borst, W.; Heene, D.L. The loading rate determines tumor targeting properties of methotrexate albumin conjugates in rats. Anticancer Drugs 1997, 8, 667–672. [Google Scholar] [CrossRef]
- Kratz, F.; Warnecke, A.; Scheuermann, K.; Stockmar, C.; Schwab, J.; Lazar, P.; Druckes, P.; Esser, N.; Drevs, J.; Rognan, D. Probing, The cysteine-34 position of endogenous serum albumin with thiol-binding doxorubicin derivatives. Improved efficacy of an acid-sensitive doxorubicin derivative with specific albumin-binding properties compared to that of the parent compound. J. Med. Chem. 2002, 45, 5523–5533. [Google Scholar] [CrossRef]
- Zhang, X.; Lionberger, R.A.; Davit, B.M.; Yu, L.X. Utility of Physiologically Based Absorption Modeling in Implementing Quality by Design in Drug Development. AAPS J. 2011, 13, 59–71. [Google Scholar] [CrossRef]
- Fraile, R.J.; Baker, L.H.; Buroker, T.R.; Horwitz, J.; Vaitkevicius, V.K. Pharmacokinetics of 5-Fluorouracil Administered Orally, by Rapid Intravenous and by Slow Infusion. Cancer Res. 1980, 40, 2223–2228. [Google Scholar]
- Milano, G.; Chamorey, A.L. Clinical pharmacokinetics of 5-Fluorouracil with consideration of chronopharmacokinetics. Chronobiol. Int. 2002, 19, 177–189. [Google Scholar] [CrossRef]
- Buur, A.; Trier, L.; Magnusson, C.; Artursson, P. Permeability of 5-fluorouracil and prodrugs in Caco-2 cell monolayers. Int. J. Pharm. 1996, 129, 223–231. [Google Scholar] [CrossRef]
- Newton, D.W.; Kluza, R.B. pKa values of medicinal compounds in pharmacy practice. Ann. Pharm. 1978, 12, 546–554. [Google Scholar] [CrossRef]
- Ortiz, R.; Prados, J.; Melguizo, C.; Arias, J.L.; Ruiz, M.A.; Álvarez, P.J.; Caba, O.; Luque, R.; Segura, A.; Aránega, A. 5-Fluorouracil-loaded poly(ε-caprolactone) nanoparticles combined with phage E gene therapy as a new strategy against colon cancer. Int. J. Nanomed. 2012, 7, 95–107. [Google Scholar]
- Arias, J. Novel strategies to improve the anticancer action of 5-fluorouracil by using drug delivery systems. Molecules 2008, 13, 2340–2369. [Google Scholar] [CrossRef] [PubMed]
- Omura, K. Clinical implications of dihydropyrimidine dehydrogenase (DPD) activity in 5-FU-based chemotherapy: Mutations in the DPD gene and DPD inhibitory fluoropyrimidines. Int. J. Clin. Oncol. 2003, 8, 132–138. [Google Scholar] [CrossRef]


Publisher’s Note: MDPI stays neutral with regard to jurisdictional claims in published maps and institutional affiliations. |
© 2020 by the authors. Licensee MDPI, Basel, Switzerland. This article is an open access article distributed under the terms and conditions of the Creative Commons Attribution (CC BY) license (http://creativecommons.org/licenses/by/4.0/).