Article

Comparative Technical Process and Product Assessment of Catalytic and Thermal Pyrolysis of Lignocellulosic Biomass

1
Simreka, Padualaan 8, 3584 CH Utrecht, The Netherlands
2
Faculty of Science and Technology, University of Twente, P.O. Box 217, 7500 AE Enschede, The Netherlands
3
Department F.-A. Forel, Institute for Environmental Sciences, University of Geneva, 1205 Geneva, Switzerland
*
Author to whom correspondence should be addressed.
Processes 2020, 8(12), 1600; https://doi.org/10.3390/pr8121600
Submission received: 1 November 2020 / Revised: 2 December 2020 / Accepted: 3 December 2020 / Published: 4 December 2020
(This article belongs to the Special Issue Catalytic Liquefaction Processes of Biomass for Fuels and Chemicals)

Abstract

:
Availability of sustainable transportation fuels in future hinges on the use of lignocellulosic resources for production of biofuels. The process of biomass pyrolysis can be used to convert solid biomass resources into liquid fuels. In this study, laboratory experiments and process simulations were combined to gain insight into the technical performance of catalytic and thermal pyrolysis processes. Waste pinewood was used as a feedstock for the processes. The pyrolysis took place at 500 °C and employs three different catalysts, in the case of the catalytic processes. A process model was developed with Aspen Plus and a wide range of representative components of bio-oil were used to model the properties of the bio-oil blend. The results of the process model calculations show that catalytic pyrolysis process produces bio-oil of superior quality. Different technical process scenarios were explored based on the properties of the bio-oil after separation of water-soluble components, with the intention of producing a blendable or stand-alone product. It was found that—depending on the bio-oil requirements—sufficient hydrogen can be made available from the aqueous fraction to further treat the organic fraction to the desired extent. The resulting organic fractions are suitable candidates for blending with conventional fuels. The analysis results are used to provide guidance for catalyst development.

1. Introduction

Motorized mobility of persons has become an essential lifestyle feature across the globe and the transportation of goods over large distances is indispensable in today’s highly differentiated and globalized economy. Relying on fossil fuels, transportation times and costs have been significantly reduced in the past 100 years, which has led to more efficient use of human capital and financial capital (e.g., by just-in-time solutions). While substantial progress is being made towards electrification, especially of passenger cars, liquid fuels are likely to retain an important role (at least for trucks, airplanes, etc.). However, the extensive use of fossil fuels, currently forming the lion’s share of our transportation fuels [1], leads to resource depletion, global warming, and other important long-term sustainability challenges. In consideration of these drawbacks, there has been a policy push towards transportation fuels from renewable sources resulting in the increase of global biofuels from 367 PJ in 2000 to about 2100 PJ in 2009 [2].
Biofuels have been broadly classified into first generation (produced from food crops such as sugarcane, corn, palm, rapeseed, etc.) and second-generation biofuels (from lignocellulosic feedstock, e.g., corn stover, wheat straw, and wood). First-generation ethanol and biodiesel represent the majority of today’s biofuel production. By using readily available resources and existing knowledge of conversion processes, these have been “low hanging fruit” in the quest towards increasing production of biofuels. However, use of food resources for fuel production, especially in a world with increasing food demand, has led to controversies about the sustainability of first-generation biofuels. To address these issues, major research and development efforts are ongoing to enable a shift towards second-generation biofuels, which include a broader mix of fuel products derived from a range of widely available [3] renewable resources. In contrast to the sugar or starch-based first-generation feedstocks, biomass feedstocks containing whole cellulose, hemicellulose, and lignin fractions are classified as lignocellulosics. A recent IEA report shows that, worldwide, one quarter of the transportation fuels could be produced from second-generation feedstocks by 2050 [4].
Three prominent technology routes, biochemical conversion, gasification and thermal pyrolysis, are in principle available for conversion of these lignocellulosic resources to biofuels, next to numerous other combinations and routes [5]. As shown in Table 1, each of these three technologies has its own benefits and drawbacks considering a selection of aspects which are important for today and for the future [5,6,7,8]. While second-generation biochemical and gasification-based routes require relatively large scales, pyrolysis offers the potential advantages of medium scale and distributed liquid product generation thereby making transportation logistics favorable. In recent years, most attention has been paid to second-generation ethanol, with numerous demonstration plants in place and first commercial plants coming online [9]. In contrast, the large upfront investment costs appear to be an important barrier to gasification [10]. Research on pyrolysis has been ongoing for two decades, albeit with less intensity than the biochemical route. Thermal pyrolysis could be an interesting process option [8,11,12] wherein solid biomass is converted into liquids in the absence of oxygen, by rapid heating at moderate temperature around 450–550 °C [13].
The liquids produced by pyrolysis can be further treated in dedicated processes [8] or they can be fed to existing refineries. The liquid is normally termed “pyrolysis oil” or “bio-oil”. Figure 1 shows a total ion chromatogram and some representative components of bio-oil derived from thermal pyrolysis of pinewood (referred to as thermal pyrolysis bio-oil). This “virgin” bio-oil is a complex mixture of water and oxygenated components including carboxylic acids, aldehydes, ketones, (substituted)-furans, sugars, (substituted)-phenols, oligomer sugars and oligomer phenols with a wide range of molecular weights and boiling points. Explanations on the role of these components for the quality of bio-oil can be found elsewhere [14,15,16].
Large-scale pyrolysis facilities are almost non-existent due primarily to the complexities of the process, and uncertainty about the characterization and properties of bio-oil. KIOR, USA, had plans for production of renewable fuels based on wood chips [17]. A comparison of key properties of thermal pyrolysis bio-oil and fossil fuel oil is shown in Table 2. The main difference in the properties of the two oils is reflected in the elemental composition, where thermal pyrolysis bio-oil contains a large amounts of oxygen (35–40 wt.% of complete bio-oil) without accounting for the oxygen content of water. This has consequences on the energy content, acidity, water content and homogeneity of thermal bio-oil and causes problems for the direct use of thermal bio-oil in fuel applications, i.e., transportation sector. One solution to this issue is to remove oxygen from bio-oil using a catalytic deoxygenation method [12,14,15,18]. Many studies have been performed on the role of catalysts such as zeolites and mesoporous materials on the product distribution in bio-oil and its quality. So far, no catalyst has been found to solve all the problems associated with bio-oil at once [14,16,19,20,21,22,23].
The available techno-economic assessments of pyrolysis processes [8,24] have all focused on studying the potential of thermal pyrolysis and found the process to be an attractive option [5]. However, the literature is scarce on equivalent studies of catalytic pyrolysis processes. Moreover, the existing pyrolysis studies have mainly been performed based on a limited number of representative components for bio-oil [8,24,25]. This is only adequate for a one-off assessment of technology potential as opposed to iterative assessment meant to provide guidance for further development.
In this study, we explore the technical potential of catalytic pyrolysis and evaluate its potential in comparison with thermal (non-catalytic) pyrolysis. To this end, dedicated experiments on the catalytic and thermal pyrolysis of pinewood were executed at laboratory scale at Twente University in the Netherlands and detailed process modeling by application of the software Aspen Plus v7.0 was conducted at Utrecht University. The pyrolysis reactions were performed using three different catalysts including a cesium modified amorphous silica alumina (Cs/ASA) and a sodium supported on gamma alumina (Na/γ-Al2O3), which were developed at Twente University, as well as a commercial grade proton exchanged Faujasite zeolite (H-FAU). These catalysts were selected based on their previously reported performances for the catalytic pyrolysis of lignocellulose [14,15,16]. It should be noted that these materials are not necessarily the best catalysts for this process, but showed interesting results in favor of commercial applications and hence were used as an example. To enable effective comparison based on the experiments in this study, we have tried to limit the use of external literature data for process operations such as hydrogen production and hydrotreating by relying more on theoretical models and data in the process modeling. In this paper, we present the findings of this collaboration (in the context of the project CatchBio, www.catchbio.nl), and we present a comparative technical process analysis in order to obtain insight into the status of the technology and to provide specific recommendations for further development of pyrolysis catalysts. This article will be followed by another article in which the economic and life cycle environmental aspects are analyzed and used to provide further guidance for catalyst development.

2. Laboratory Experiments

The Cs/ASA and Na/γ-Al2O3 catalysts were prepared using a wet impregnation method of CsNO3 (Acros, 99.3%) and Na2CO3 (ACS reagent grade >99.5%) on ASA (Sasol) and γ-Al2O3 (Akzo Nobel) supports, respectively, to yield 10 wt.% of the corresponding metals on each catalyst (based on the total weight of the catalyst). The two catalysts were calcined at 600 °C in a flow of air. The commercial H-FAU catalyst was also calcined at 600 °C prior to the reaction. Pyrolysis reactions for both thermal and catalytic pyrolysis were performed on a bench-scale set-up consisting of a digital mass flow controller, a heating coil for heating carrier gas prior to the reactor, an infra-red (IR) oven for fast heating (1700 °C·min−1) of wood, an electrical oven for separate heating of the catalyst bed where deoxygenation reactions take place (in the case of thermal pyrolysis the reactor was filled with inert quartz sands), two sequential condensers (operating at −45 °C) for condensation of pyrolysis vapors and a gas bag for collection of gases products. A quartz tube (500 mm × 9 mm) was used as the reactor with a fixed bed of biomass followed by the catalyst. The temperatures of both the biomass bed and the catalyst bed were set and controlled (using thermocouples placed inside beds) at 500 °C. By raising the temperature in the IR oven, reactions were started and resulting biomass vapors were continuously carried through the catalytic bed by carrier gas (Ar, 70 mL·min−1); the condensable vapors leaving catalytic bed were collected in the condensers and the non-condensable gases (including permanent gases, CO2, CH4, C2 and C3 gases) were collected in the gas bag.
Compositional analyses of the liquid and gas products were performed using gas chromatography (GC) technique coupled with mass selective detector (MSD) and thermal conductivity detector (TCD), respectively (for more details on the analytics see [14]). In the case of the liquid fraction, all the GC separable components were detected using MSD and were later identified by matching with a library from National Institute of Standards and Technology, NIST 2010 library (supplied by Agilent). For this study, around 100 components which could be matched with 80% probability and above were selected. Quantitative analysis of the GC/MS detectable components is difficult when studying pyrolysis of the whole wood matrix since calibration of such a large number of components has inaccuracies. Large errors and data inconsistency were reported even when selected numbers of the GC/MS detectable components were quantified [26]. Therefore, a common semi-quantitative method using peak area percentage of total ion chromatogram (TIC) was employed to estimate the concentration of GC/MS detected components [21,27]. TIC peak area percentage of a certain component is linearly correlated with the concentration of the corresponding component. Hence, to determine semi-quantitative yields of each component/group of components, the corresponding TIC Peak area percentage was divided by initial weight of the biomass feed. This semi-quantitative analysis is valid only for the comparison of a certain component/group of components on different chromatograms [28]. Gas products were quantified using calibration curves of at least three different concentrations of respective standard gases.
Karl-Fischer titration was used for analysis of water content of bio-oil. Elemental composition of liquid products was determined using a Thermo Scientific (Flash 2000, Waltham, MA, USA) organic elemental analyzer instrument and was calculated on dry basis. The higher heating value (HHV) of bio-oil was calculated using Dulong equation (Equation (1)) based on the C, H, and O weight percentage obtained from elemental analysis.
H H V M J · kg 1 = 81.37 · C wt . % + 345 · H wt . % + 43.125 · 1 O wt . % · 0.004186
The temperature required for complete combustion of coke, which formed on the catalyst, was estimated using temperature-programmed oxidation of the coked catalyst (10 mg) from 30 °C to 800 °C (10 °C·min−1 increment) in a flow of air (30 mL·min−1). Thermal gravimetric analysis (TGA) was used to test the stability of the catalyst at the temperature of regeneration. In this regard, the pure catalyst (10 mg) was heated from 30 °C to 800 °C in a flow of air (30 mL·min−1) and the weight loss of the catalyst was recorded.
All the experimental values reported in this study represent the average value of at least two experiments (experimental errors were estimated at 95% confidence interval). Detailed explanation of the above-mentioned analytical methods, reaction procedure and catalyst preparation procedure can be found elsewhere [14].
As mentioned above, around 100 components have been identified in bio-oil. Since not all of the identified components are available in the Aspen property databases, for the purpose of process simulations, 41 representative components were selected based on functional groups, bond types and the number of carbon and oxygen atoms in the molecular structure (see Supplementary Materials Table S1). In addition to the 41 components, the simulation relies on 10 gaseous and 3 solid components. All the experimental data which were used for the process simulation in this study can be found in Supplementary Materials, Table S1.

3. Process Model

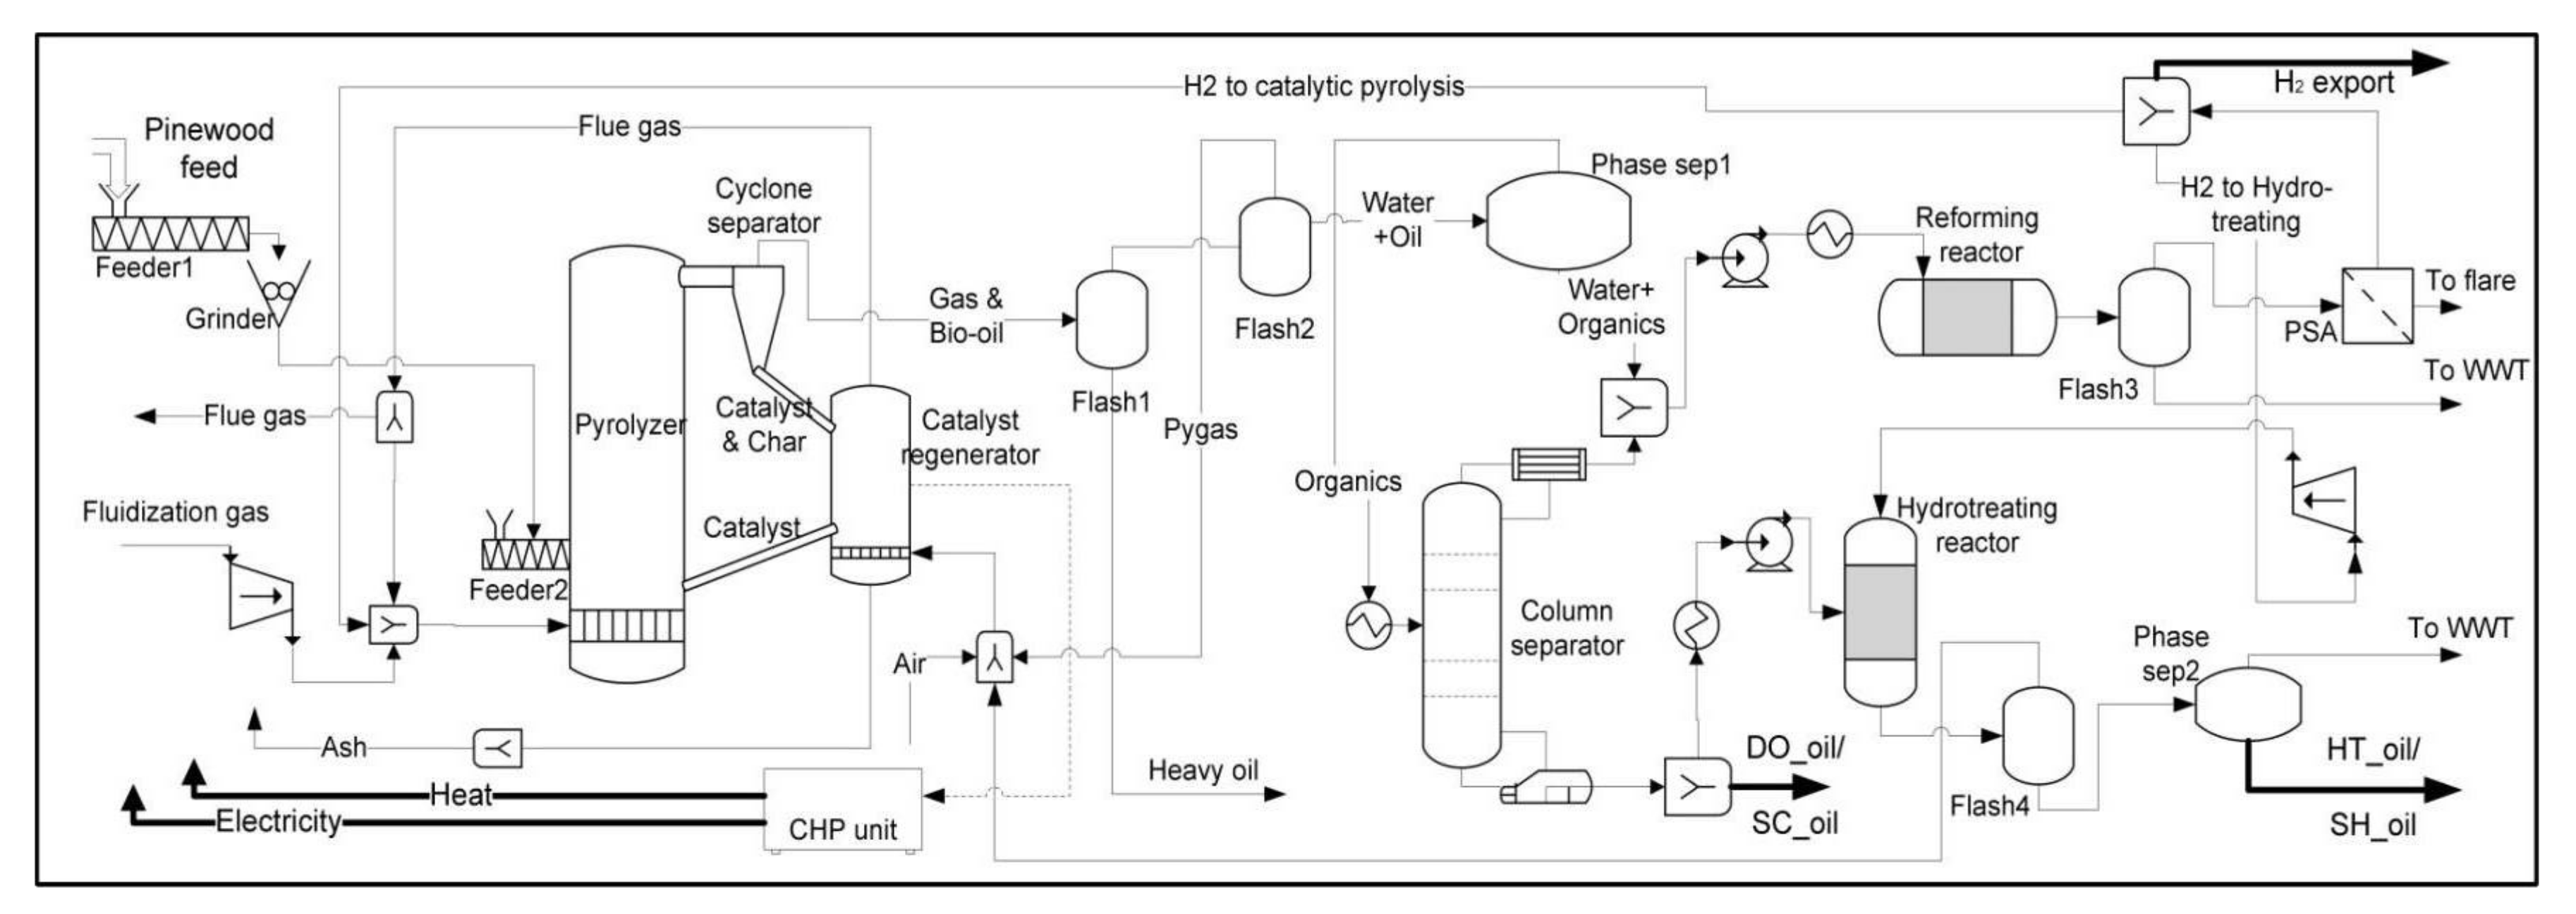
In addition to the data from laboratory experiments, the process simulation for catalytic and thermal processes is based on a combination of literature data and theoretical models based on the literature. The process modeling was carried out in Aspen Plus v7.0 software using a non-random two-liquid (NRTL) model as a property method for estimation of phase equilibrium. Figure 2 shows the complete process model. Using this process model in combination with a limited number of fuel specifications enabled us to explore different technical possibilities for fuel production from pyrolysis processes. It is important to note that these are early stage process models and hence involved assumptions in cases where relevant literature or experimental data is unavailable. The information provided by these models enables us to evaluate technology potentials and pinpoint areas for further improvement and experiments.

3.1. Feedstock and Pretreatment

With the intention of exploring lignocellulosic feedstocks and in line with the laboratory experiments, we model the process using pinewood as a feedstock. The facility was modeled to process 480 metric tonnes of biomass per day (20,000 kg·h−1). It is assumed that the feedstock is available as woodchips which have been dried to a moisture content of 3%. The properties of the raw feedstock used for the process simulation model are presented in Table 3 [14,29]. These properties are based on experiments for the specific biomass that was used for pyrolysis experiments and reported in Masoud et al. [14].
Moisture content and particle size of feedstock parameters affect the performance of the pyrolysis process. Since the moisture content of the delivered feedstock is 3%, no further drying is carried out within the process. Smaller diameter of biomass particles has the advantage of more efficient and improved heat transfer in the pyrolysis section but requires more electrical energy for comminution. Based on recommendations for maximum particle sizes [11], we model size reduction of pinewood to an average diameter of 2 mm. The grinding is carried out using a ball mill crusher and filter screen. The ground wood is then fed to the pyrolyzer.

3.2. Pyrolysis

The laboratory experiments were carried out with a fixed bed of catalyst. However, considering short catalyst deactivation times, we envision a fluidized catalytic cracker type configuration for this process [30]. The residence time in the fluidized bed reactor is adjusted to reach conditions similar to the fixed bed process. We use a residence time of 0.5 s based on the configuration used by KiOR [30]. As an alternative configuration, a moving bed of catalyst could be used; this, however, was not explored in this study. The pyrolysis process is carried out at 500 °C and 1 atm. As shown in Figure 2, the pyrolysis section includes a fluidized bed pyrolyzer, cyclone separators and a catalyst regeneration section. The catalyst regenerator is a combustor where char and coke on the catalyst is burned off. The modeled combustor operates at 870 °C [7]. Based on temperature programmed oxidation analysis of coke on the catalyst, the coke is completely combusted at 650 °C (Figure S1). Thermo gravimetric analysis of the fresh and coke free catalysts in air showed no weight loss of the catalyst up to 900 °C, implying that the catalyst is stable at high temperatures (results are not shown). In the thermal process the char and gases are combusted in a separate unit. The air inlet to the catalyst regeneration/combustion unit is determined by the oxygen requirement to ensure complete combustion. The ash is removed from the bottom of the catalyst regenerator and a mesh of appropriate size is envisioned to retain the catalyst particles in the system. A portion of the flue gas from the catalyst regenerator is used as a fluidizing medium, thus reducing the requirements for fresh nitrogen. Three kilogram of fluidizing medium is used per kg of biomass. Based on literature data [11], energy requirements for pyrolysis are estimated at 1 MJ·kg−1 biomass for both the catalytic and thermal processes.

3.3. Combined Heat and Power (CHP) Section

The hot flue gases from the catalyst regenerator/combustor are used in a CHP system which co-generates heat and electricity needed for the plant. Depending on the case, there is an excess of steam and electricity. Based on literature data for chemical plants [31] the CHP is modeled with the parameters in Table 4. The electricity factor is determined by the specific configuration of the CHP system and governs the distribution between heat and electricity output.

3.4. Separation

After the pyrolysis section, the gas and bio-oil vapors are sent to the separation section, where all the heavy components with boiling points above 280 °C are separated in a flash column (flash 1, operating at 280 °C). For this study, it is assumed that those higher boiling components which are not detected in the GC-MS are a waste stream due to unavailability of information about the properties. However, it is important to note that these heavy components can potentially be processed further (e.g., hydrotreating) and converted to fuels and other useful products. The quantity of these components was estimated using gravimetric analysis by heating up the total bio-oil (organics and water) up to 280 °C. To do this, bio-oil was loaded in a small crucible and was placed in a pre-heated (at 280 °C) cylindrical oven for 10 s. The very viscous materials remaining in the crucible are the heavy components of bio-oil and account for 11% and 20% of organics output fraction for catalytic and thermal reactions, respectively. Apart from the assumed flash separation method used here, methods such as distillation have been reported for the fractionation of bio-oil [32]. However, during distillation, different components are separated based on their boiling points by gradual temperature increment, followed by oligomerization and condensation reactions between some reactive components present in bio-oil [32]. Removal of this stream ensures that a stream with realistic properties and composition enters the subsequent process sections.
To separate the gaseous components from the mixture, the stream leaving flash 1 is sent to the second flash separator (operating at 25 °C). The low temperature has been selected to balance the cooling requirements in this step with the amount of components carried along with the gaseous stream from this flash. This decision also affects heat duty required in the subsequent distillation unit and the product yield and composition (the compounds that are not separated via the gaseous phase remain in the liquid phase and undergo further processing). As the flow of gaseous components from the second flash is relatively small in comparison to char and coke production, it does not justify a separate combustion unit. Hence the gaseous components are combusted within the catalyst regenerator/combustor, thereby making use of the excess heat in the form of steam. After the separation of gases, the cooled oil with a significant content of water is sent to phase separation. It was observed from experiments that for effective phase separation a minimum 40 wt.% of water in bio-oil is needed [33]. Hence, we ensure 45 wt.% water content in this step of the process model; if the incoming bio-oil contains less water, fresh process water is added. Different literature studies [33,34] have demonstrated phase separation of bio-oil and have documented the distribution of components in aqueous and organic phases. As the bio-oil composition is specific to each case and experiment, the bio-oil in our case studies differs from these studies. For the purpose of modeling, we base the phase separation model on the literature mentioned above and the octanol-water partition co-efficients of the different components [35,36] and assumptions regarding process conditions. The fact that components with low partition coefficient are more soluble in water [35,36] and that process inefficiencies prevent complete phase separation of components, forms the basis of the assumptions in the phase separation model. Thus, components with a partition coefficient below 1.32 have been modeled such that 95 wt.% end up in the aqueous stream and the remaining 5 wt.% remain in the organic stream. This split is reversed for the components with coefficients above 1.32, such that 95 wt.% ends up in the organic stream. The results from this separation model are in-line with the results presented in literature [33]. The underlying coefficients and the composition of aqueous and organic fractions after separation can be found in the Supplementary Materials Table S2. Past modeling studies reported in literature [7,8] directly divert the required fraction of complete bio-oil (combined aqueous and organic) for hydrogen production and use the remaining for hydro-treating or co-refining with conventional naphtha processing. By modeling phase separation, we take a different approach from these studies. This is for two reasons. The first reason is that recent literature [33,37] has shown that the smaller molecules actually end up as coke in the subsequent hydro-processing to refined fuels while with separation, these can form an excellent source for high value chemical production. The second reason is that in case of catalytic pyrolysis, phase separation followed by purification, can already yield an oil stream which can be used as a fuel without further hydro-processing. Following this approach, the organic fraction of bio-oil from phase separation is sent to the distillation column in order to further reduce the water content to trace quantities. It is important to note that—as indicated in literature [32]—some oil losses can be expected in the distillation step for thermal pyrolysis oils. Oil losses at this stage lead to proportionate reduction in final oil yield. However, this factor is heavily dependent on the specific composition of bio-oil which varies based on the pyrolysis conditions and the presence or absence of catalysts as well as the distillation conditions. These losses can only be reliably determined with pilot scale tests for specific cases in the absence of empirical relationship models that link such losses to components in oil. Given the uncertainty in determining losses (from both quantitative and component fate perspective) and the proportional effect on oil yield, these losses have not been built into the model. The aqueous distillate is mixed with the aqueous fraction from phase separation and sent to hydrogen production (see next section). Depending on the quality of bio-oil and considerations related to refinery co-processing, the bottom bio-oil can either be directly marketed as a product or further processed by hydrotreating.

3.5. Hydrogen Production

In this section, the aqueous stream containing organics is used to produce hydrogen via steam reforming. For this technical assessment, it is assumed that all of the organics result in production of hydrogen, which gives an estimate of the maximum possible hydrogen production. The CHO content of the organic fraction of aqueous stream is used for this calculation which follows the reforming reaction, Equation (2). As opposed to the use of experimental data from the literature [33,38] for modeling, this theoretical approach enables an analysis tailored with the input stream for a particular model. This ensures a fair comparison across the different options evaluated in this study while still helping to understand the technology potential. The hydrogen produced is available for export and internal use in hydrotreating as required.
C j H j O k + 2 i k · H 2 O i · CO 2 + 2 i + j 2 k · H 2

3.6. Hydrotreating Section

In this section, the bio-oil processed by distillation is envisioned to be hydrotreated using conventional hydrotreating catalysts, in order to produce an oil product with desired oxygen content. For the purpose of this technical assessment only the requirement for hydrogen and subsequent reductions in oil yields were considered. To enable a fair comparison of the different options evaluated, in the absence of relevant and tailored experimental information, a theoretical modeling approach was used. Hence, the C, H and O fractions of the bio-oil from separation are used as the input for these calculations. It is assumed that four ‘H’ atoms are added to the oil for removal of each ‘O’ atom (a minimum of two ‘H’ atoms are required). Thus, three ‘H2’ molecules are needed per oxygen atom removed (one ‘H2’ for water and two ‘H2’ added to the oil). The yield of oil from the process is assumed to be 98% of the theoretical yield. Having this factor makes it possible to estimate a maximum potential while still maintaining a yield factor in the model which can be varied for sensitivity analysis. Depending on the source of bio-oil, a variety of literature studies have reported hydrotreating yields to fuel products in the range 0.38–0.62 kg oil/kg bio-oil feed [8,24,38,39]. After hydrotreating the gases are separated by flashing and phase separation. A potentially appealing aspect of catalytic pyrolysis is that with the right catalysts, hydrotreating can be done in the pyrolysis reactor itself, to directly produce a usable oil product after separation.

3.7. Fuel Specifications and Properties

A limited number of fuel specifications (Table 5) based on EU regulations [40] have been used to study approximate conformity of the fuel products from this process.
It should be noted that considering the possibility of blending with conventional fuels, the oxygen content of any fuel product from the process does not necessarily have to remain within the limit on oxygen content according to Table 5. If the components contributing to the oxygen content are acceptable in a fuel, then higher oxygen content mainly affects the fraction of biofuel that can be blended. To account for these aspects, we considered some additional key fuel properties [41] (Table 6), which enables us to assess the quality of different potential fuels through the pyrolysis process and compare them with conventional gasoline and diesel fuels. The higher heating value is estimated using the Dulong correlation shown in Equation (1). For energy calculations, the higher heating value of hydrogen is taken as 141 MJ/kg.

3.8. Product Scenarios

Based on different potential process configurations leading to different products, four different scenarios were envisioned, which are applicable for both the catalytic and thermal pyrolysis processes.

3.8.1. Direct Oil (DO_Oil)

In this scenario, the bio-oil produced as a result of separation is directly considered as a product and is referred to as DO_oil. This direct production obviates the whole hydrotreating section. However, depending in the performance of the pyrolysis unit, this oil may not meet all the requirements of a fuel or blend component. In this case, further processing will be necessary which could be carried out at a centrally located facility or at an existing refinery. Hence, this is considered in three separate product scenarios (see below) and detailed product composition is analyzed for this scenario.

3.8.2. Hydrotreated Oil (HT_Oil)

For this scenario, the DO_oil is further hydrotreated, using the hydrogen produced internally, to an oxygen content of 3.7% in conformity with fuel requirements. Depending on the quality of the DO_oil, this can significantly reduce or even eliminate the export of hydrogen as a co-product from the process. Nevertheless, this scenario has the potential to produce a product which is in conformity with fuel specifications and can be flexibly used in an engine either directly or as a blend. Considering such a final product, and in absence of information about component specific conversions, the calculations based on the C, H, and O fractions of DO_oil provide adequate information for this technical assessment. Hence, detailed product composition is not analyzed for this scenario.

3.8.3. Selectively Hydrotreated Oil (SH_Oil)

In the HT_oil scenario, we aim to remove oxygen from DO_oil, regardless of the type of oxygen-containing molecule. As mentioned earlier, higher oxygen content, by itself, is not a cause of concern for a fuel product considering the possibility of blending with conventional fuels. In the case of pyrolysis oil products, one of the main concerns is the presence of acids, sugars, aldehydes, and ketones in the product. The presence of these components causes stability issues for the fuel products and can lead to severe limitations regarding the use of such products. Hence, one alternative approach is to develop hydrotreating catalysts which can selectively remove oxygen from the problematic components while preserving components such as furans and phenols. This can lead to lower hydrogen requirements for hydrotreating of the oil product. Contrary to the previous scenarios, it would not be possible to immediately implement this option because the required catalyst would still need to be developed.

3.8.4. Selectively Catalyzed Oil (SC_Oil)

This scenario is only applicable in the case of catalytic pyrolysis. The same principle as in case of SH_oil is followed, but specific hydrotreating catalysts are incorporated within the catalytic pyrolysis processes and hydrogen is fed to the pyrolysis section. Thus, the pyrolysis catalysts are engineered in a way that they selectively hydrotreat the problem components. Theoretically, the hydrogen requirements would be the same as SH_oil; however, this scenario would save hydrotreating costs and directly lead to a product that meets specific fuel requirements. This would require further specific catalyst development that builds on the proposed catalysts in literature [42,43].

4. Results and Discussion

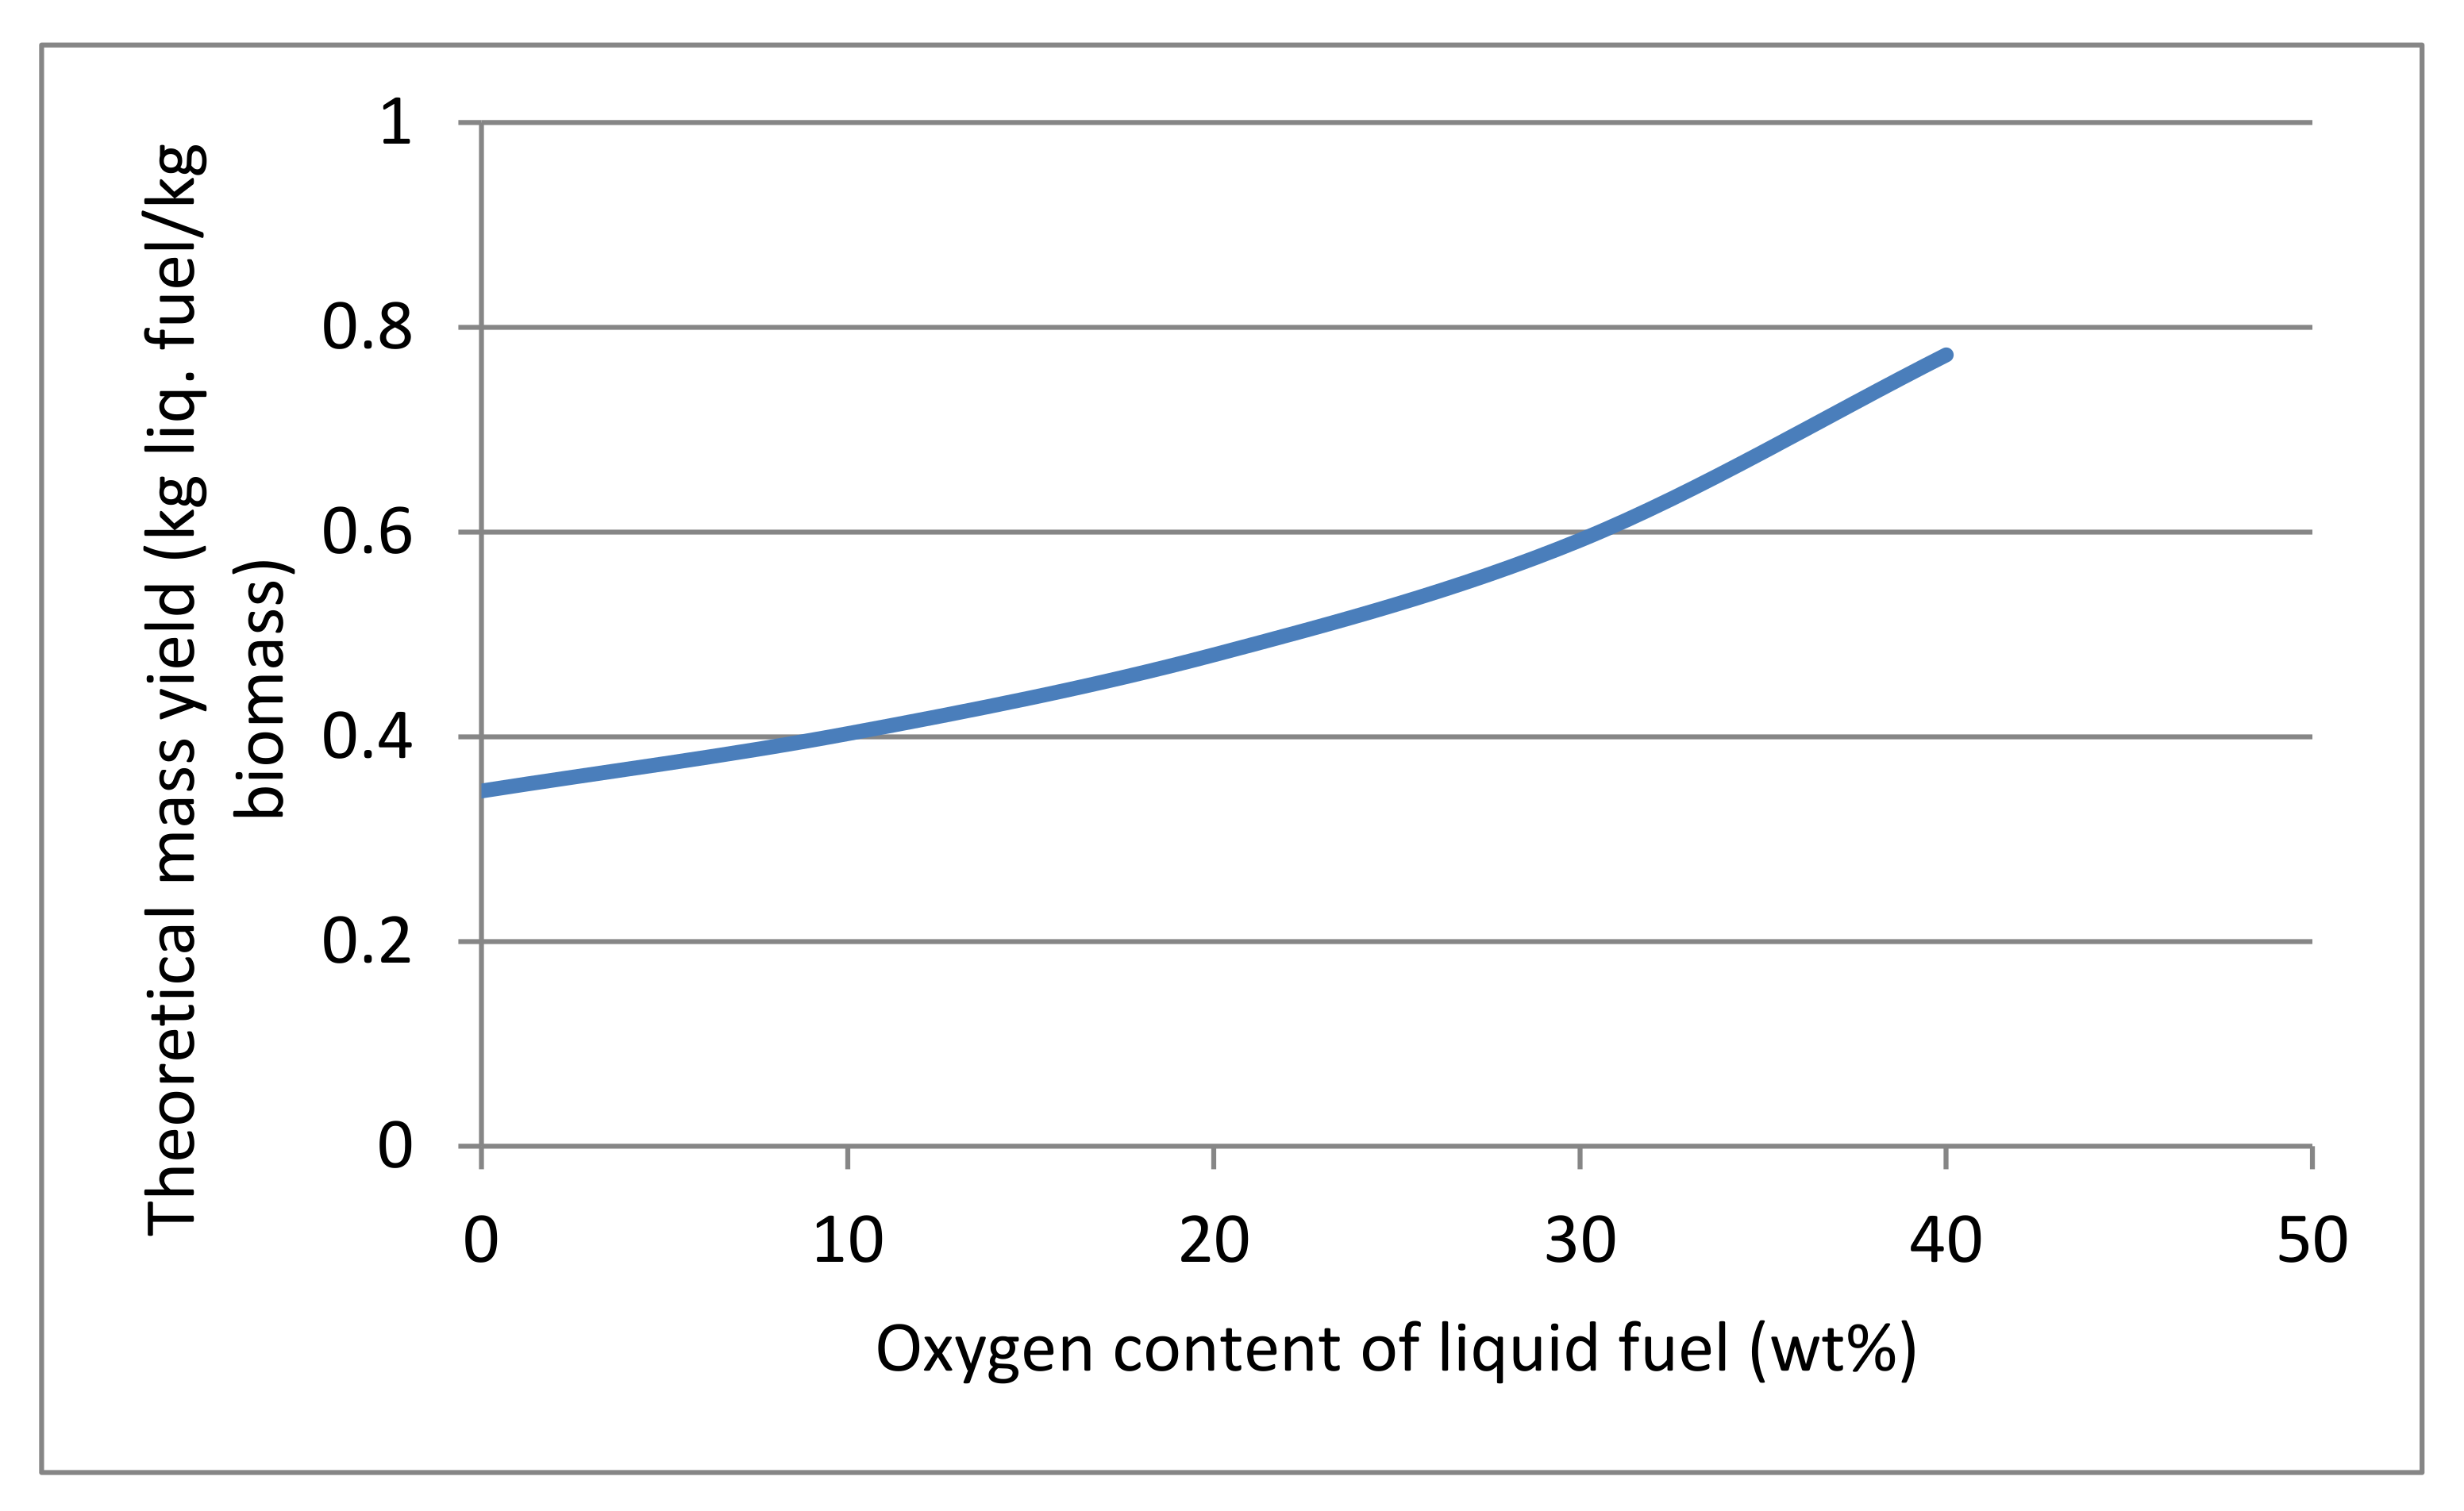
Waste pinewood contains 44.4 wt.% oxygen, which is normally removed by thermal pyrolysis in the form of CO2, CO, and H2O; catalytic deoxygenation can further enhance oxygen removal. However, this catalytic deoxygenation takes place at the expense of bio-oil mass yield. The goal of any biomass to liquid fuel conversion process is to maximize the energy yield from original biomass in the liquid fuel. Removal as H2O leads to a higher mass yield, while removal as CO2 leads to a higher energy yield in the liquid fuel. Thus, in the case of catalytic pyrolysis the holy grail is to use internally available carbon in biomass to remove all the oxygen as CO2. For a catalytic pyrolysis process with the waste pinewood feedstock, a maximum theoretical bio-oil yield of 34.7% is achieved with 100% accompanying energy yield, if all the oxygen is removed as CO2 (Figure 3). Practical yields are, however, subject to losses as char, coke and gases, removal of oxygen as water as well as the need to provide energy for the conversion process.
Table 7 summarizes the results for mass balances and properties of bio-oils obtained from laboratory experiments during thermal and catalytic pyrolysis reactions of waste pinewood. Further information on the mass flows in each of the scenarios is provided in supplementary information section Tables S3–S7. All three catalysts eliminate more oxygen from bio-oil compared to thermal reaction. Catalytic reactions show higher amount of gas and coke formation, as compared to thermal reactions. Because of these two fundamental differences, the yield of organic fractions is lower for all the three catalytic reactions (e.g., 10.30% of H-FAU vs. 44.09% of thermal) as was expected. Among the three catalysts, Na/γ-Al2O3 was the most active for deoxygenation of bio-oil, reducing the oxygen content of bio-oil to 25.08 wt.%, compared to 42.28 wt.% of the thermal oil, followed by the Cs/ASA catalyst (29.20 wt.%). These two catalysts have previously been reported to be beneficial for the pyrolysis of biomass to bio-oil [14,16]. It can also be seen from Table 7 that energy content of bio-oil was enhanced for all the catalytic reactions, compared to the thermal reaction and Na/γ-Al2O3 catalyst resulted in bio-oil with highest energy content. The lowest oxygen content of catalytic oil of 25.08% (Table 7) corresponds to a mass yield of about 12.5% (Table 7) and a theoretical maximum yield of 57.8% in the absence of losses to char, coke and gases (Figure 3). This difference indicates a very substantial improvement potential.
Table S1 shows the composition of bio-oil. The bio-oil obtained from the two most active catalysts, Na/γ-Al2O3 and Cs/ASA, contains substantial amounts of hydrocarbons (both bio-oils contain about 17 wt.% hydrocarbons). A larger fraction of hydrocarbons formed over Na/Al2O3 catalyst was aromatic (11.4 wt.% aromatic, 1.3 wt.% aliphatic and 5 wt.% polyaromatic), while in case of Cs/ASA catalysts, the majority of hydrocarbons formed were aliphatic (2.5 wt.% aromatic, 10.5 wt.% aliphatic and 4 wt.% polyaromatic). Another difference between the composition of bio-oil of Na/γ-Al2O3 and Cs/ASA catalysts was in acid and carbonyl (aldehyde and ketones) concentrations. No acid was observed in Na/γ-Al2O3 bio-oil indicating that this catalyst was active for elimination of acids. However, the Cs/ASA catalyst contained 3.5 wt.% acids. Regarding carbonyls, Cs/ASA catalyst was more active to reduce carbonyls compared to Na/γ-Al2O3 (9.5% vs. 13.5% of Na/γ-Al2O3). The influence of H-FAU zeolite catalyst and non-catalytic reaction on the composition of bio-oil are also compared in Table S1. The thermal and H-FAU bio-oil contain large amounts of acids (5 wt.% and 9.2 wt.%, respectively), and low amounts of fuel compatible components, i.e., hydrocarbons, alkylated phenols, and furans (e.g., hydrocarbons yield in traces amounts for thermal and about 2.5 wt.% for H-FAU bio-oil) (Table S1). In case of H-FAU bio-oil, the concentration of carbonyls (aldehyde and ketones), which are likewise detrimental to the quality of bio-oil [32], were also high (20 wt.%). Acids contribute to (i) low pH bio-oil and (ii) lower heating value of bio-oil since they have two oxygen atoms in their molecular structure; carbonyls are thought to be responsible for instability of bio-oil during aging time [32]. Acids and carbonyls can be converted to hydrocarbons via decarboxylation and decarbonylation reactions, respectively. Therefore, design and development of a catalyst which can selectively convert acids, aldehyde, and ketones to hydrocarbon would be beneficial for the bio-oil quality improvement. The Na/γ-Al2O3 catalyst removes more acids but yields more carbonyls, i.e., 14% [14,15]. The Cs/ASA catalyst in this study, on the other hand, shows activity for the reduction of carbonyls. Hence, a proposition can be made here that a catalyst containing both Na+ and Cs+ can reduce the negative effects of the acids and carbonyls on the quality of bio-oil.
So far, we have shown that none of the catalysts could solve all the problems associated with bio-oil at once and the bio-oil obtained over the best catalyst, Na/γ-Al2O3, still contains 25% oxygen and problem components for fuel use. Therefore, in the process model, we propose several possible processing steps through which the quality of bio-oil can be further improved. These process steps have been explained in experimental section and the results are discussed in the following sections.
In DO_oil scenario (refer to experimental section), the vapors leaving the reactor are passed through a series of separators, as depicted in Figure 2, with the following sequential order: heavy fraction separator (flash 1), gas separator (flash 2), water soluble separator (phase sep1) and finally a distillation column (column separator). This makes it possible to almost completely remove acids, carbonyls, and sugars, that are detrimental to the quality of bio-oil, resulting in a significantly lower oxygen content (Table 8). As can be seen in Table 8, the total amounts of detrimental components in bio-oil are lower and the total hydrocarbons are higher for catalytic reactions as compared to the thermal reaction. These result in lower oxygen content of catalytic bio-oils and consequently lead to an increase in higher heating value. The oxygen content of bio-oil obtained over Cs/ASA catalyst was the lowest (7.9 wt.%), and as a consequence, the energy content was the highest (41.05 MJ·kg−1), compared to other catalytic and thermal reactions (Table 8). Under the current laboratory conditions, the yield of bio-oil is very low in the case of catalytic processes due to the significantly higher formation of gases (CO, CO2), carbonaceous deposit, and water. Additionally, as indicated earlier in the description of separation model, a scale up from this process model might show further reduction in yields due potential bio-oil losses in distillation column. It is noteworthy to mention that the amount of carbonaceous deposit on the Cs/ASA catalyst is much lower compared to the Na/γ-Al2O3 or the H-FAU used in this study and also compared to other acid zeolite catalysts reported in literature [44]. From Table 8, it can be seen that higher amounts of char, carbonaceous deposits, and gas formed during catalytic reactions also increases energy available from combustion of these in the process scheme. Thus, the expected electricity and steam export are almost twice as high in the case of catalytic pyrolysis. As a larger fraction of biomass energy ends up in the CHP, the overall final energy efficiency including oil, H2, electricity, and steam (about 53%) is also lower for the catalytic processes (Table 8). However, a comparison of conventional fuel specifications and properties (Table 4 and Table 5) with DO_oil properties (Table 8) shows, in general, that the bio-oils produced via catalytic pyrolysis are of a higher quality. The aromatics content for catalytic pyrolysis oil is also higher, but still within the limits specified by fuel specifications (within 35%).
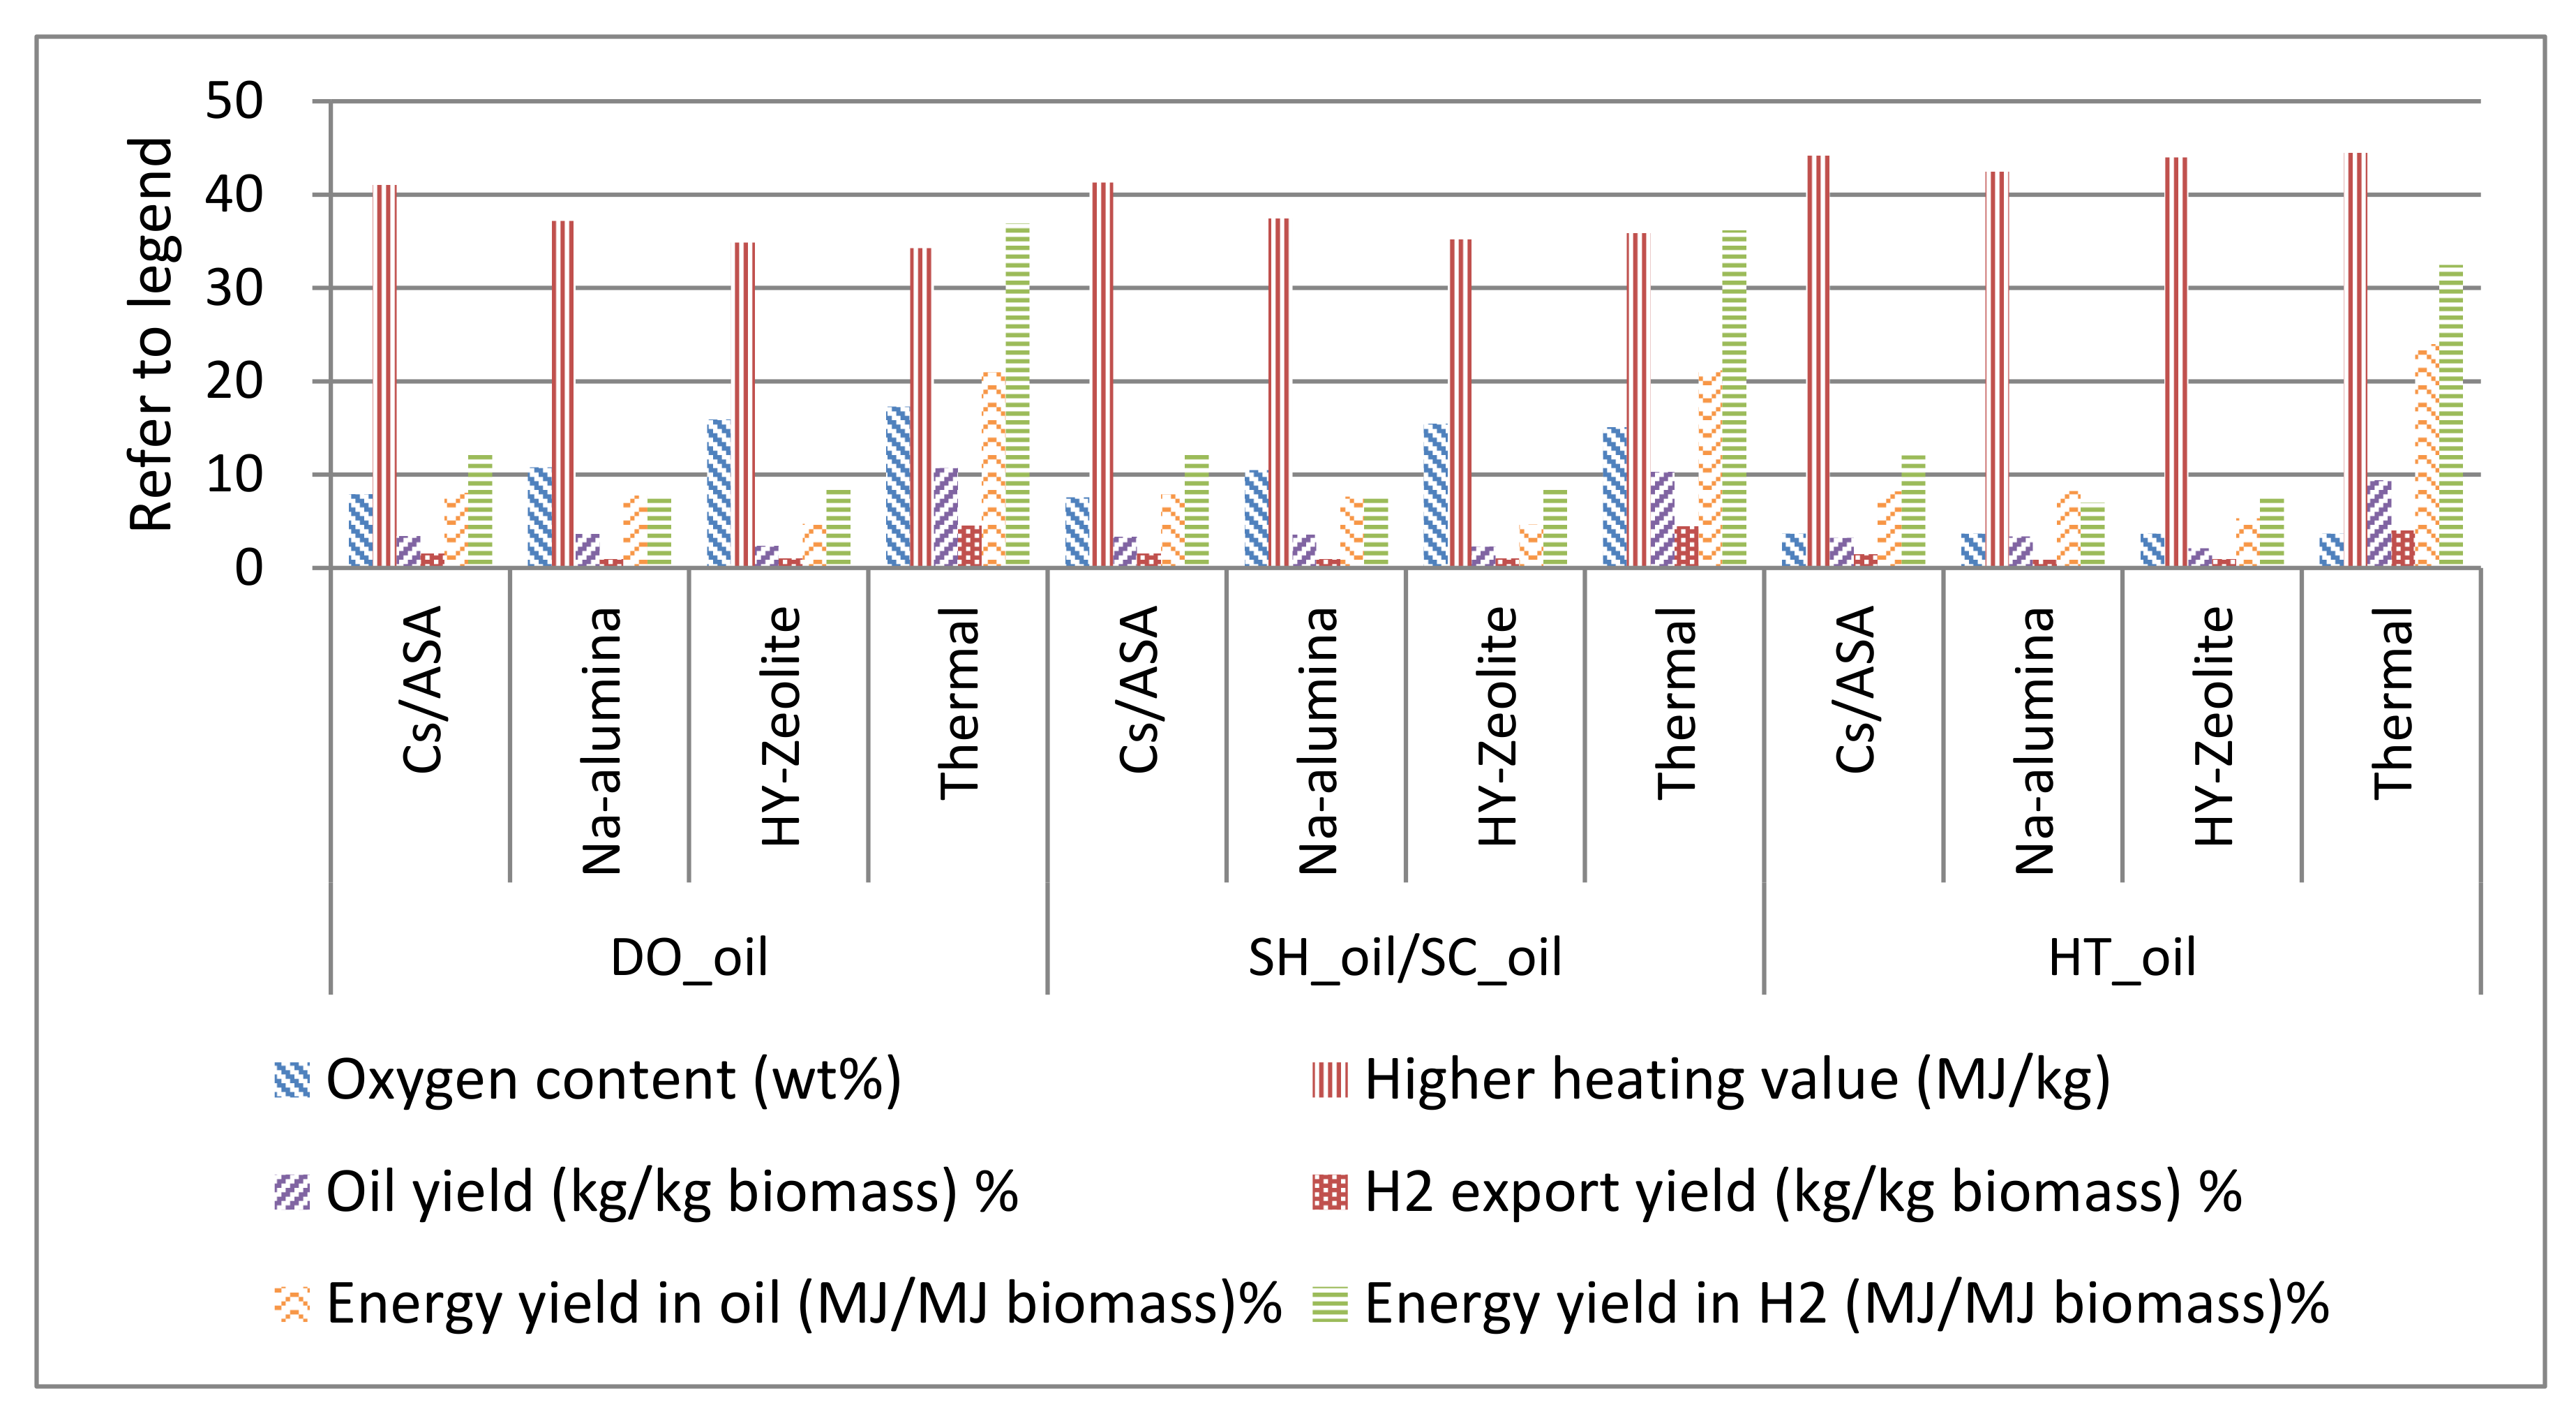
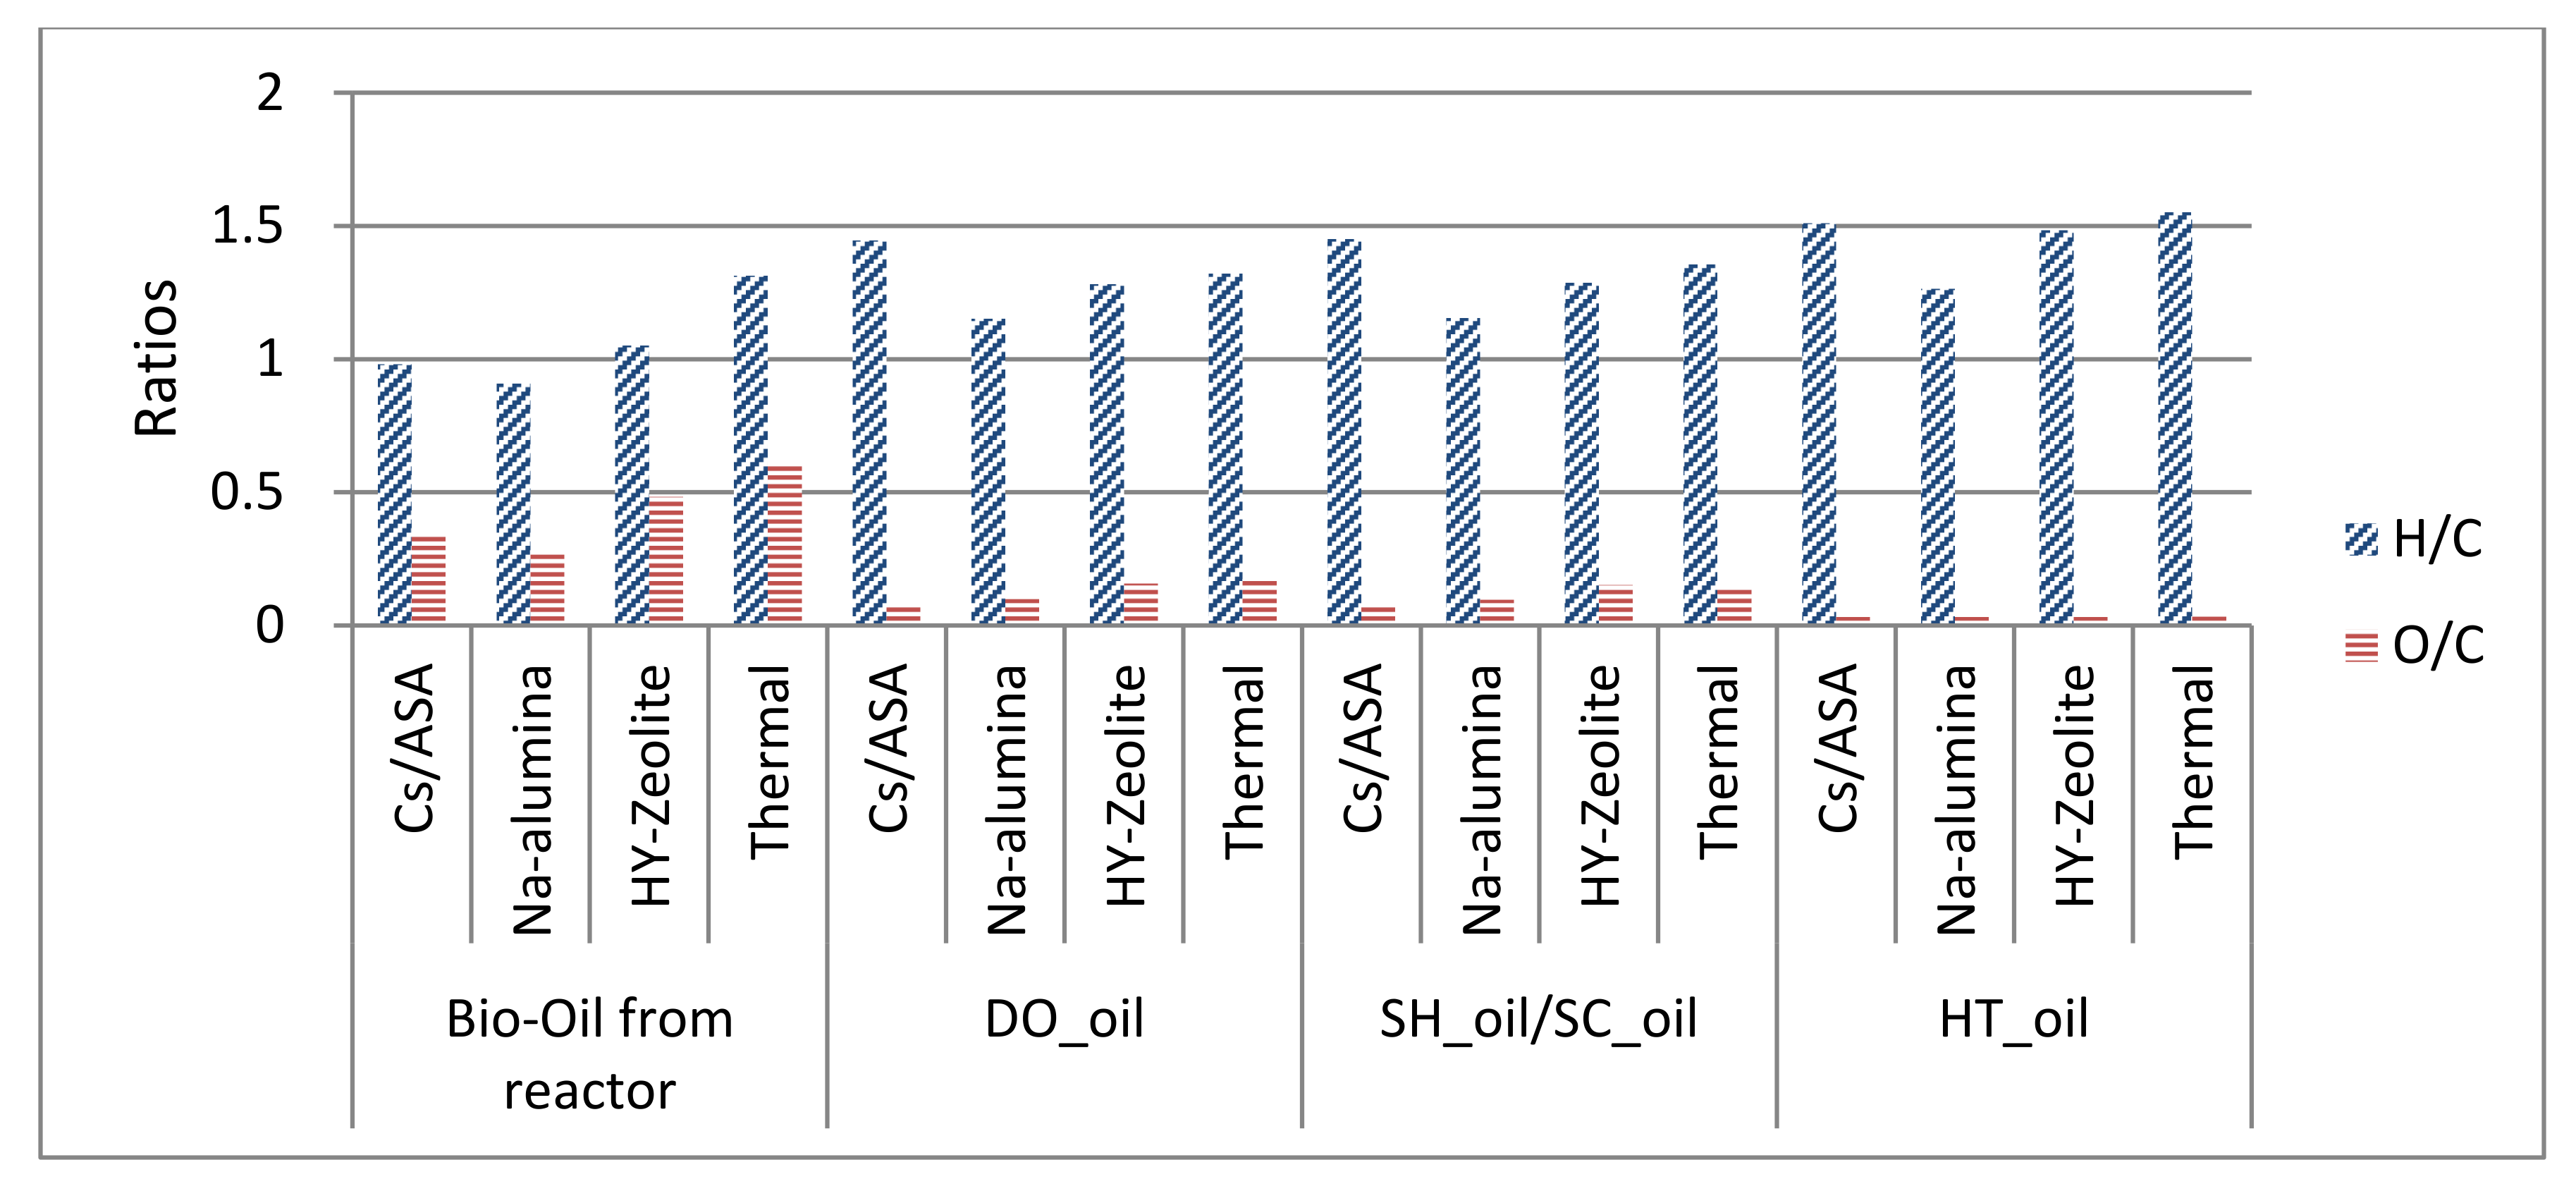
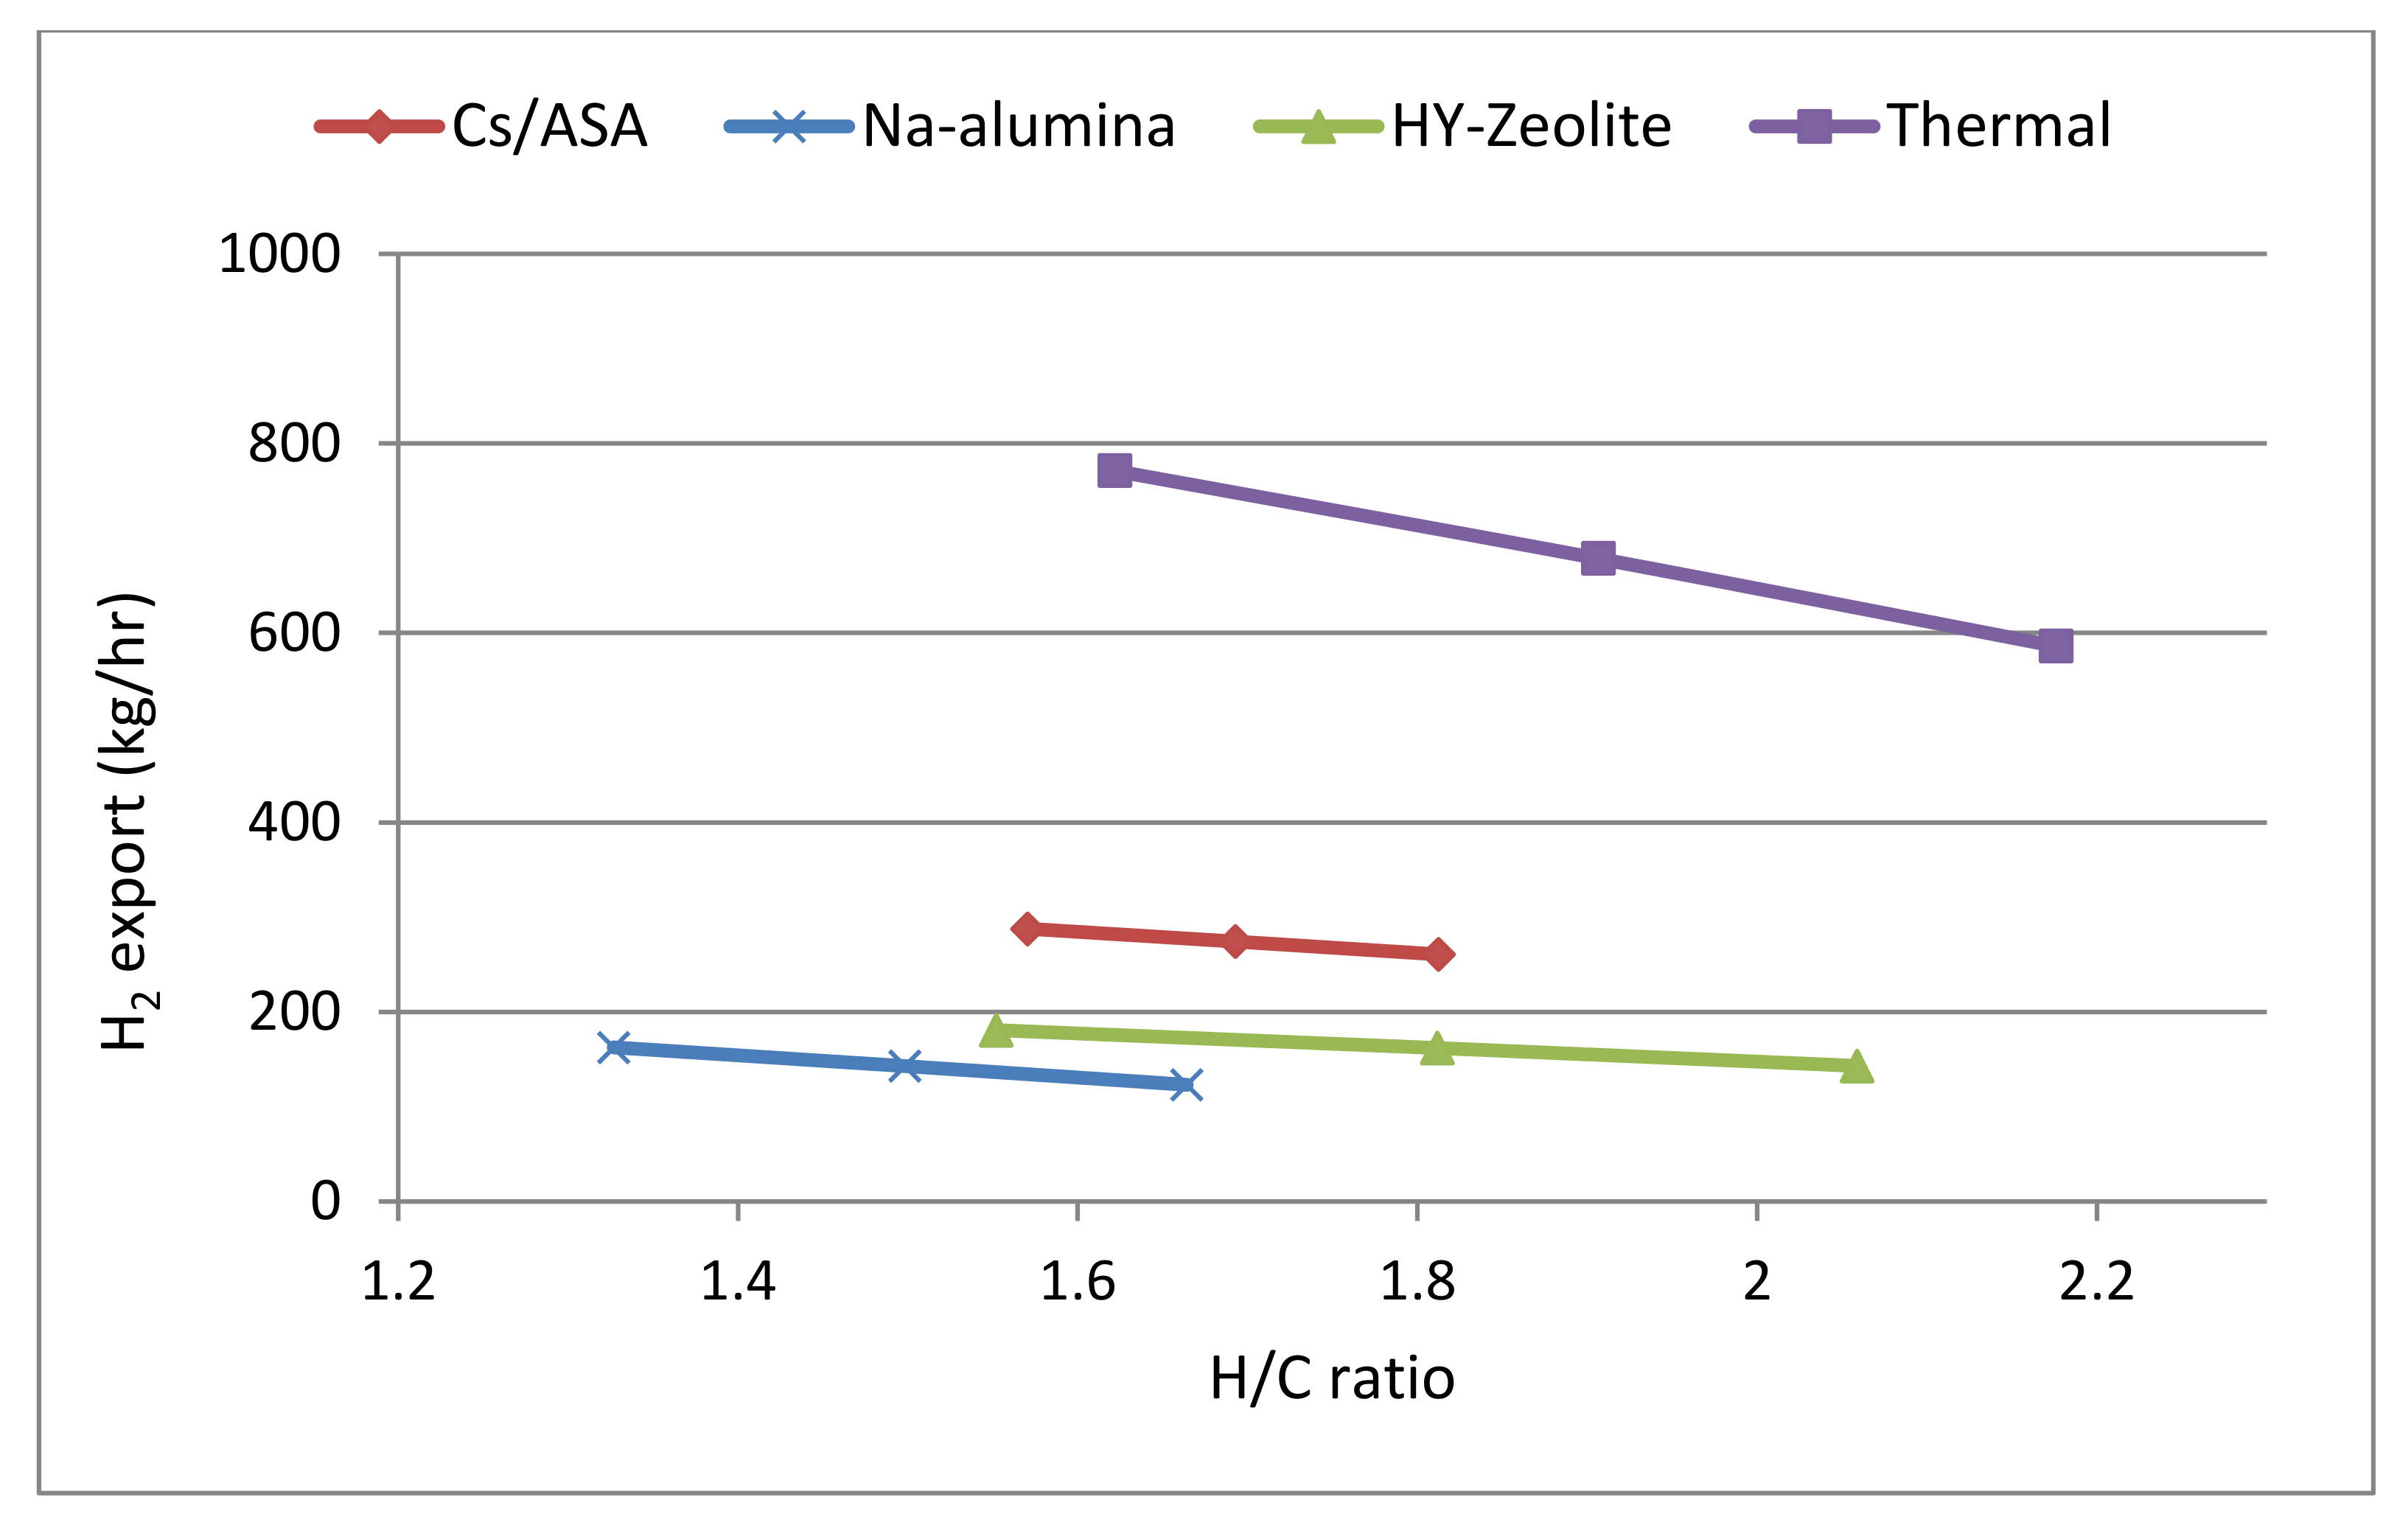
Figure 4, Figure 5 and Figure 6 show the technically analyzed parameter results for different scenarios of the catalytic and thermal processes. For these parameters that are estimated in this study, the results for SH_oil and SC_oil are same because the technical properties of the products will remain same. The overall energy yield reported in Table 8 is a ratio of all forms of final energy outputs (oil, hydrogen, electricity, steam) to that of the biomass energy input. In the case of all scenarios, the lowest oxygen content and highest heating value of bio-oil is obtained using the Cs/ASA catalyst. However, the bio-oil yield obtained using this catalyst is very low (3% vs. 10% of thermal bio-oil) and hence also the energy yield in bio-oil (8% vs. 21% of thermal bio-oil). The results for the HT_oil scenario in Figure 4 and Figure 5 show that a relatively higher fraction of produced hydrogen is required in the case of thermal process to reach 3.7% oxygen content in the product. We also observe a subsequent reduction in the differences in bio-oil yields. However, it is important to note that these are maximum possible yields from hydrotreating and the actual yields, although case specific, are expected to be lower. The amount of H2 added to the bio-oil for removal of oxygen plays an important role in the hydrotreating calculations and also governs the H/C ratio. The calculations are based on theoretical maximum hydrogen production; since the actual H2 production in the reforming process is expected to be 10–20% lower, the real H2 exports will be accordingly lower than depicted in Figure 6 [37].
As pointed out earlier, considering the possibility of blending, one option is to selectively hydrotreat and to reduce the oxygen associated with the problem components. This is explored with the SH_Oil scenario. As can be observed from Figure 4, this leads to higher internal hydrogen consumption for thermal process in comparison with the DO_Oil scenario which is reflected in the reduced hydrogen export. Despite this fact a relatively higher oxygen content of about 15% is left in the thermal oil as compared to, for example, 8% in the case of Cs/ASA catalyst. Selective reduction of acids, aldehydes, and ketones (as problematic components) over hydrogenation catalysts such as transition metals normally results in alcohols or a mixture of alcohols and alkanes [45,46]. To remove oxygen to the acceptable level of fuel requirements and yet minimizing the hydrogen consumption, a careful choice of a catalysts with higher selectivity towards alkanes production is necessary.
The results indicate that to obtain a product with comparable and acceptable fuel specifications, separate hydrotreating is necessary for thermal pyrolysis. The potential benefit of a catalytic process is that the hydrotreating can be done in situ, in the pyrolysis reactor, which obviates the whole hydrotreating section. A catalyst with selectivity for hydro-deoxygenation of the troublesome components would be an option in the in situ hydrotreating section. In this case, pre-reduction of the metal catalyst after regeneration by oxidation may have to be considered.

5. Conclusions

Technical assessments of the pyrolysis of waste pine wood for thermal and catalytic processes were carried out using the incorporation of experimental data into a process simulation model prepared using AspenPlus software. Thermal and catalytic processes were compared in different scenarios for the final products. Relying on a range of representative components the process simulation has offered a better understanding of pyrolysis product properties. The employed process configuration, as well as the use of catalytic or thermal processing, has a significant effect on the properties and yields of the products from this process.
Effective separation of heavy components and of water-soluble components can result in oil products with significantly better properties. With future research, these components can also be valorized into fuels and chemicals. As expected, the catalytic process produces an oil with better properties than the thermal process. This advantage of the catalytic process is stacked against a significantly higher oil production in the case of the thermal pyrolysis process. In the chosen process configuration of the carbonaceous deposit formed on the catalyst is continuously burned off for regeneration. Hence, in such a situation a catalyst that demonstrates slightly higher coke production along with increased oil production at the expense of char and gases can still be attractive. Further in-depth research on long-term catalyst stability at process conditions, specific pyrolysis energy use in different scenarios and variation with catalyst to biomass ratios is required. The high boiling fraction represents a significant proportion of the bio-oil. Further analysis of this stream will help pinpoint specific applications or strategies for conversion to low molecular weight components.
The results of the hydrotreating scenarios serve to highlight the potential differences in oil properties and help understand the important issue of hydrogen requirement for hydrotreating of bio-oil. Assuming different scenarios for the employed process scheme, it was found that—depending on the bio-oil requirements—sufficient hydrogen is available internally for further processing of the pyrolysis products, thereby improving the fuel properties. This can help to meet given fuel requirements and leads to products comparable with conventional fuels. However, it is important to note that the scenarios are rather optimistic, and the availability of hydrogen depends heavily on the yield of hydrogen from the reforming process and the performance of hydrotreating process.
When specifying the desired properties of oil products from a bio-based process, it is important to consider the possibility of blending with conventional fuels since products with reasonably good properties and devoid of potentially problematic components can be blended in appropriate quantities to satisfy engine requirements. To this end, highly selective catalysts would need to be developed which are able to perform component specific deoxygenation.
Thus, improved catalysts hold the potential to simplify the pyrolysis process and bring it on par with thermal pyrolysis in terms of energy yields while leading to oil products with better properties. Depending on conformity with fuel specifications these products can either be further treated in existing refineries or directly used as biofuels in blends with conventional fuels. To model the product properties, the approach based on detailed representative components, in combination with a process model, can be used to analyze the outputs and shape future research efforts. The success of these research efforts holds the key to developing a technically feasible process that converts second-generation biomass into liquid fuels via pyrolysis.
Further research is needed to understand economic and environmental implications of these catalytic and process developments. The feedback provided for further technical development can play an important role in making sustainable biofuels a significant fraction of our future transportation fuel mix.

Supplementary Materials

The following are available online at https://www.mdpi.com/2227-9717/8/12/1600/s1, Figure S1: Temperature-programmed oxidation of coke formed on the Cs/ASA catalyst, Table S1: Output data from pyrolysis reactions used for process simulations, Table S2: Data and assumptions for separation model, Table S3: Key stream names and descriptions for the streams reported in Tables S4–S7, Table S4: Stream flow data for pyrolysis using Cs/ASA catalyst, Table S5: Stream flow data for pyrolysis using Na-Alumina catalyst, Table S6: Stream flow data for pyrolysis using HY-Zeolite catalyst, Table S7: Stream flow data for thermal pyrolysis, Table S8: Data values for Figure 4 in the article.

Author Contributions

Each author has made substantial contributions to this work and approves the submitted version and is accountable for the contributions and questions. Conceptualization, A.D.P., K.S. and M.K.P.; Data curation, A.D.P. and M.Z.; Funding acquisition, M.K.P.; Investigation, A.D.P., M.Z., K.S., M.K.P.; Methodology, A.D.P.; Project administration, M.K.P.; Supervision, K.S.; Writing—original draft, A.D.P.; Writing—review & editing, M.Z., K.S. and M.K.P. All authors have read and agreed to the published version of the manuscript.

Funding

This research was supported through the CatchBio project by the SmartMix program of the Dutch government.

Conflicts of Interest

The authors declare no conflict of interest.

References

  1. International Energy Agency. World Energy Outlook 2012. Available online: https://www.iea.org/reports/world-energy-outlook-2012 (accessed on 3 December 2020).
  2. Lamers, P.; Hamelinck, C.; Junginger, M.; Faaij, A. International bioenergy trade—A review of past developments in the liquid biofuel market. Renew. Sustain. Energy Rev. 2011, 15, 2655–2676. [Google Scholar] [CrossRef]
  3. Perlack, R.D.; Stokes, B.J. US Billion-Ton Update: Biomass Supply for a Bioenergy and Bioproducts Industry; ORNL/TM-2011/224; Oak Ridge National Laboratory: Oak Ridge, TN, USA, 2011. [Google Scholar]
  4. Eisentraut, A. Sustainable Production of Second Generation Biofuels Potential and Perspectives in Major Economies and Developing Countries; IEA Energy Papers 2010/1; OECD Publishing: Paris, France, 2010. [Google Scholar]
  5. Anex, R.P.; Aden, A.; Kazi, F.K.; Fortman, J.; Swanson, R.M.; Wright, M.M.; Satrio, J.A.; Brown, R.C.; Daugaard, D.E.; Platon, A.; et al. Techno-economic comparison of biomass-to-transportation fuels via pyrolysis, gasification, and biochemical pathways. Fuel 2010, 89 (Suppl. 1), S29–S35. [Google Scholar] [CrossRef]
  6. Meerman, J.C.; Ramírez, A.; Turkenburg, W.C.; Faaij, A.P.C. Performance of simulated flexible integrated gasification polygeneration facilities. Part A: A technical-energetic assessment. Renew. Sustain. Energy Rev. 2011, 15, 2563–2587. [Google Scholar] [CrossRef]
  7. Humbrid, D.; Davis, R.; Tao, L.; Kinchin, C.; Hsu, D.; Aden, A.; Schoen, P.; Lukas, J.; Olthof, B.; Worley, M.; et al. Process Design and Economics for Biochemical Conversion of Lignocellulosic Biomass to Ethanol; NREL/TP-5100-47764; NREL: Golden, CO, USA, 2011. [Google Scholar]
  8. Wright, M.M.; Daugaard, D.E.; Satrio, J.A.; Brown, R.C. Techno-economic analysis of biomass fast pyrolysis to transportation fuels. Fuel 2010, 89 (Suppl. 1), S2–S10. [Google Scholar] [CrossRef] [Green Version]
  9. Lane, J. Biofuels Digest. Available online: https://www.biofuelsdigest.com/bdigest/author/jmldigest/ (accessed on 3 December 2020).
  10. Meerman, J.C.; Ramírez, A.; Turkenburg, W.C.; Faaij, A.P.C. Performance of simulated flexible integrated gasification polygeneration facilities, Part B: Economic evaluation. Renew. Sustain. Energy Rev. 2012, 16, 6083–6102. [Google Scholar] [CrossRef]
  11. Ringer, M.; Putsche, V.; Scahill, J. Large-Scale Pyrolysis Oil Production: A Technology Assessment and Economic Analysis; NREL/TP-510-37779; National Renewable Energy Laboratory: Golden, CO, USA, 2006. [Google Scholar]
  12. Kersten, S.R.A.; van Swaaij, W.P.M.; Lefferts, L.; Seshan, K. Options for Catalysis in the Thermochemical Conversion of Biomass into Fuels. In Catalysis for Renewables; Wiley-VCH Verlag GmbH & Co. KGaA: Weinheim, Germany, 2007; pp. 119–145. [Google Scholar]
  13. Bridgwater, A.V. Biomass fast pyrolysis. Therm. Sci. 2004, 8, 21. [Google Scholar] [CrossRef]
  14. Zabeti, M.; Nguyen, T.S.; Lefferts, L.; Heeres, H.J.; Seshan, K. In situ catalytic pyrolysis of lignocellulose using alkali-modified amorphous silica alumina. Bioresour. Technol. 2012, 118, 374–381. [Google Scholar] [CrossRef] [Green Version]
  15. Nguyen, T.S.; Zabeti, M.; Lefferts, L.; Brem, G.; Seshan, K. Catalytic upgrading of biomass pyrolysis vapours using faujasite zeolite catalysts. Biomass Bioenergy 2013, 48, 100. [Google Scholar] [CrossRef]
  16. Nguyen, T.S.; Zabeti, M.; Lefferts, L.; Brem, G.; Seshan, K. Conversion of lignocellulosic biomass to green fuel oil over sodium based catalysts. Bioresour. Technol. 2013, 142, 353–360. [Google Scholar] [CrossRef]
  17. KiOR. KiOR Ships First Cellulosic Diesel: World’s First Renewable Diesel En Route to American Vehicles; KiOR: Pasadena, TX, USA, 2013. [Google Scholar]
  18. Bulushev, D.A.; Ross, J.R.H. Catalysis for conversion of biomass to fuels via pyrolysis and gasification: A review. Catal. Today 2011, 171, 1–13. [Google Scholar] [CrossRef]
  19. Carlson, T.R.; Tompsett, G.A.; Conner, W.C.; Huber, G.W. Aromatic production from catalytic fast pyrolysis of biomass-derived feedstocks. Top. Catal. 2009, 52, 241–252. [Google Scholar] [CrossRef] [Green Version]
  20. Ateay, F.; Miskolczi, N.; Borsodi, N. Comparision of real waste (MSW and MPW) pyrolysis in batch reactor over different catalysts. Part I: Product yields, gas and pyrolysis oil properties. Bioresour. Technol. 2013, 133, 443–454. [Google Scholar]
  21. Pattiya, A.; Titiloye, J.O.; Bridgwater, A.V. Fast pyrolysis of cassava rhizome in the presence of catalysts. J. Anal. Appl. Pyrolysis 2008, 81, 72–79. [Google Scholar] [CrossRef]
  22. Huber, G.W.; Iborra, S.; Corma, A. Synthesis of transportation fuels from biomass: Chemistry, catalysts, and engineering. Chem. Rev. 2006, 106, 4044–4098. [Google Scholar] [CrossRef] [PubMed] [Green Version]
  23. Babich, I.V.; van der Hulst, M.; Lefferts, L.; Moulijn, J.A.; OConnor, P.; Seshan, K. Catalytic pyrolysis of microalgae to high-quality liquid bio-fuels. Biomass Bioenergy 2011, 35, 3199–3207. [Google Scholar] [CrossRef]
  24. Jones, S.B.; Valkenburg, C.; Walton, C.W.; Elliot, D.; Holladay, J.E.; Stevens, D.J.; Kinchin, C.; Czernik, S. Production of Gasoline and Diesel from Biomass Via Fast Pyrolysis, Hydrotreating and Hydrocracking: A Design Case; PNNL-18284; Pacific Northwest National Lab.(PNNL): Richland, WA, USA, 2009. [Google Scholar]
  25. Li, B.; Ou, L.; Dang, Q.; Meyer, P.; Jones, S.; Brown, R.; Wright, M. Techno-economic and uncertainty analysis of in situ and ex situ fast pyrolysis for biofuel production. Bioresour. Technol. 2015, 196, 49–56. [Google Scholar] [CrossRef] [Green Version]
  26. Collard, F.; Blin, J.; Bensakhria, A.; Valette, J. Influence of impregnated metal on the pyrolysis conversion of biomass constituents. J. Anal. Appl. Pyrolysis 2012, 95, 213–226. [Google Scholar] [CrossRef]
  27. Wang, S.; Guo, X.; Liang, T.; Zhou, Y.; Luo, Z. Mechanism research on cellulose pyrolysis by Py-GC/MS and subsequent density functional theory studies. Bioresour. Technol. 2012, 104, 722–728. [Google Scholar] [CrossRef]
  28. Lu, Q.; Yang, X.; Dong, C.; Zhang, Z.; Zhang, X.; Zhu, X. Influence of pyrolysis temperature and time on the cellulose fast pyrolysis products: Analytical Py-GC/MS study. J. Anal. Appl. Pyrolysis 2011, 92, 430–438. [Google Scholar] [CrossRef]
  29. Phyllis2: Database for Biomass and Waste; Energy Research Centre of the Netherlands: Patten, The Netherlands, 5 February 2013. Available online: https://phyllis.nl/ (accessed on 3 December 2020).
  30. O’Connor, P.; Cerqueira, H.S.; Bartek, R.; Yanik, S. Biomass Catalytic Conversion Process and Apparatus for Use Therein. U.S. Patent 8524959, 3 September 2013. [Google Scholar]
  31. Patel, M.K.; Crank, M.; Dornburg, V.; Hermann, B.; Roes, L.; Hüsing, B.; Overbeek, L.; Terragni, F.; Recchia, E. Medium and Long-Term Opportunities and Risks of the Biotechnological Production of Bulk Chemicals from Renewable Resources; UU CHEM NW&S (Copernicus): Uthrecht, The Netherlands, 2006. [Google Scholar]
  32. Oasmaa, A.; Czernik, S. Fuel oil quality of biomass pyrolysis oils: State of the art for the end users. Energy Fuels 1999, 13, 914–921. [Google Scholar] [CrossRef]
  33. Vispute, T.P.; Huber, G.W. Production of hydrogen, alkanes and polyols by aqueous phase processing of wood-derived pyrolysis oils. Green Chem. 2009, 11, 1433–1445. [Google Scholar] [CrossRef] [Green Version]
  34. Song, Q.; Nie, J.; Ren, M.; Guo, Q. Effective Phase Separation of Biomass Pyrolysis Oils by Adding Aqueous Salt Solutions. Energy Fuels 2009, 23, 3307–3312. [Google Scholar] [CrossRef]
  35. Miller, M.M.; Wasik, S.P.; Huang, G.L.; Shiu, W.Y.; Mackay, D. Relationships between octanol-water partition coefficient and aqueous solubility. Environ. Sci. Technol. 1985, 19, 522. [Google Scholar] [CrossRef] [PubMed]
  36. Meylan, W.M.; Howard, P.H.; Boethling, R.S. Improved method for estimating water solubility from octanol/water partition coefficient. Environ. Toxicol. Chem. 1996, 15, 100. [Google Scholar] [CrossRef]
  37. De Vlieger, D.J.M.; Thakur, D.B.; Lefferts, L.; Seshan, K. Carbon nanotubes: A promising catalyst support material for supercritical water gasification of biomass waste. ChemCatChem 2012, 4, 2068–2074. [Google Scholar] [CrossRef]
  38. Elliott, D.C.; Hart, T.R.; Neuenschwander, G.G.; Rotness, L.J.; Zacher, A.H. Catalytic hydroprocessing of biomass fast pyrolysis bio-oil to produce hydrocarbon products. Environ. Prog. Sustain. Energy 2009, 28, 441. [Google Scholar] [CrossRef]
  39. Zacher, A.H.; Olarte, M.V.; Santosa, D.M.; Elliott, D.C.; Jones, S.B. A review and perspective of recent bio-oil hydrotreating research. Green Chem. 2013, 16, 885–896. [Google Scholar] [CrossRef]
  40. European Union. Directive 2009/30/EC of the European Parliament and of the Councilof 23 April 2009, amending Directives 98/70/EC and 1999/32/EC and repealing Directive 93/12/EEC 2009, Brussels, Belgium. 5 June 2009. Available online: https://eur-lex.europa.eu/legal-content/EN/TXT/?uri=celex:32009L0030 (accessed on 3 December 2020).
  41. Martinez, J.D.; Lapuerta, M.; Garcia-Contreras, R.; Murillo, R.; Garcia, T. Fuel Properties of Tire Pyrolysis Liquid and its Blends with Diesel Fuel. Energy Fuel. 2013, 27, 3296–3305. [Google Scholar] [CrossRef]
  42. Marker, T.; Felix, L.; Linck, M.; Roberts, M.; Ortiz-Toral, P. Integrated hydropyrolysis and hydroconversion (IH) for the direct production of gasoline and diesel fuels or blending components from biomass, Part 2: Continuous testing. Environ. Prog. Sustain. Energy 2013, 33, 762–768. [Google Scholar] [CrossRef]
  43. Eschenbacher, A.; Saraeian, A.; Shanks, B.; Jensen, P.; Li, C.; Duus, J.; Hansen, A.B.; Mentzel, U.V.; Henriksen, U.B.; Ahrenfeldt, J.; et al. Enhancing bio-oil quality and energy recovery by atmospheric hydrodeoxygenation of wheat straw pyrolysis vapors using Pt and Mo-based catalysts. Sustain. Energy Fuels 2020, 4, 1991–2008. [Google Scholar] [CrossRef]
  44. Triantafyllidis, K.S.; Iliopoulou, E.F.; Antonakou, E.V.; Lappas, A.A.; Wang, H.; Pinnavaia, T.J. Hydrothermally stable mesoporous aluminosilicates (MSU-S) assembled from zeolite seeds as catalysts for biomass pyrolysis. Microporous Mesoporous Mater. 2007, 99, 132–139. [Google Scholar] [CrossRef]
  45. Ebbesen, S.D.; Mojet, B.L.; Lefferts, L. Effect of pH on the nitrite hydrogenation mechanism over Pd/Al2O3 and Pt/Al2O3: Details obtained with ATR-IR spectroscopy. J. Phys. Chem. C 2010, 115, 1186–1194. [Google Scholar] [CrossRef]
  46. Hong, X.; Li, B.; Wang, Y.; Lu, J.; Hu, G.; Luo, M. Stable Ir/SiO2 catalyst for selective hydrogenation of crotonaldehyde. Appl. Surf. Sci. 2013, 270, 388–394. [Google Scholar] [CrossRef]
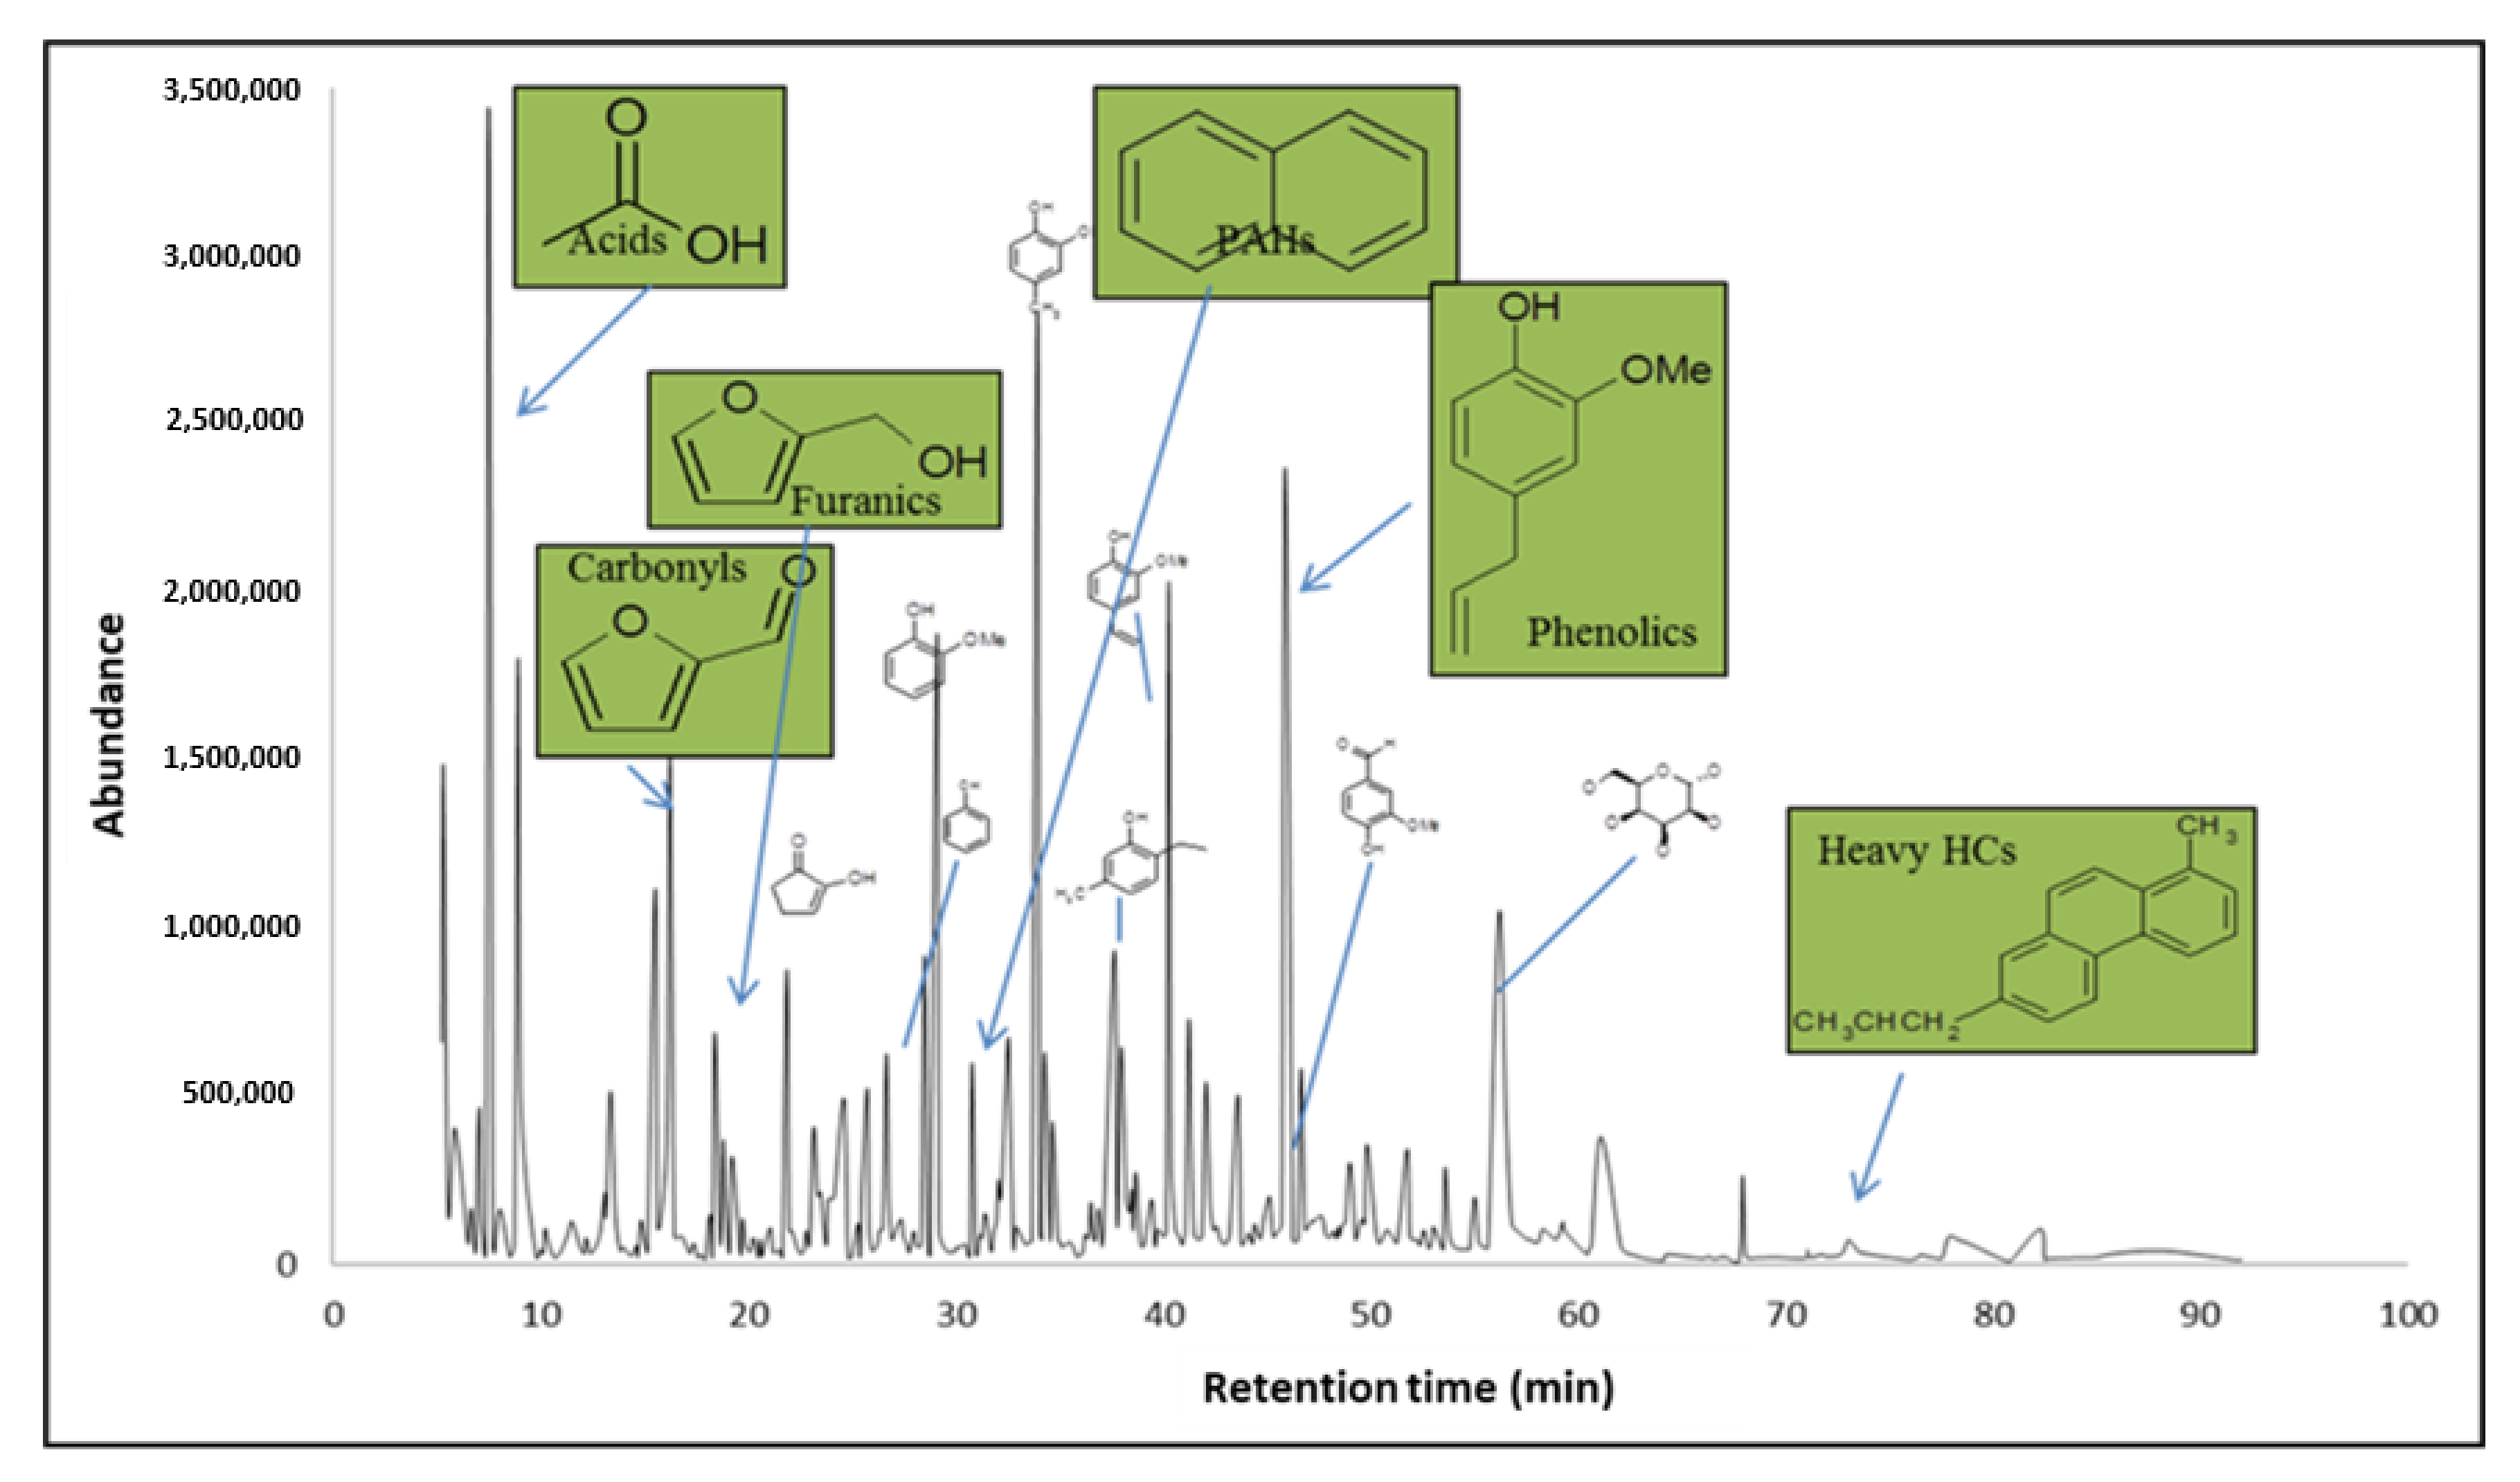
Figure 1. Ion-chromatogram of virgin bio-oil produced by thermal pyrolysis (without further treatment).
Processes 08 01600 g001
Figure 2. Process flow diagram for catalytic pyrolysis.
Processes 08 01600 g002
Figure 3. Variation in theoretical mass yield of liquid fuel from biomass with variation in the final oxygen content of the fuel after biomass conversion (for theoretical mass yield, zero losses to char, coke and gases are assumed and all oxygen is assumed to be removed as CO2).
Processes 08 01600 g003
Figure 4. Comparison of product properties and yields for different scenarios of catalytic and thermal pyrolysis processes. Data values for this graph are provided in the Supplementary Materials, Table S8.
Processes 08 01600 g004
Figure 5. Hydrogen to Carbon (H/C) and Oxygen to Carbon (O/C) ratios for oil at different stages/scenarios in the process.
Processes 08 01600 g005
Figure 6. Correlation between H/C ratio and H2 export; H/C ratio is estimated based on the assumption for number of moles of H2 added to oil per molecule of ‘O’ removed. The values in the graph are calculated for 0% target oxygen content in final hydrotreated oil.
Processes 08 01600 g006
Table 1. Technology routes for second-generation biofuels.
TechnologyFuel TypeFeasible Processing Scale and InfrastructureFeedstock LogisticsFuel LogisticsEnergy Yield in Fuel
BiochemicalEthanol, Butanol—
Blendable with gasoline to a certain extent
Medium- to large-scale process and new infrastructureTransportation of solid biomass over long distancesBlendable fuel—Needs partly new transport infrastructureLow
GasificationAlkane chains produced via Fischer Tropsch—
Direct use in existing engines.
Very large-scale process and new infrastructureTransportation of solid biomass over long distancesDrop-in fuel—Existing transport infrastructure can be usedHigh
PyrolysisMix of oxygen containing organics—
Can be blended after treatment
Medium-scale process Existing oil processing infrastructure can be usedTransportation of solid biomass over shorter distances due to smaller processing capacityBlendable or drop in after treatment—Existing infrastructure can be partially usedMedium
Table 2. Comparison of thermal pyrolysis bio-oil and fuel oil.
Characteristics.Thermal Pyrolysis Bio-OilFossil Fuel Oil
Water content (wt.%)15–350.1
H (wt.%)5.2–7.085.0
C (wt.%)50–6411.1
O (wt.%)35–401.0
N (wt.%)0.05–0.400.3
S (wt.%)0.05–0.302.3
Heating value (MJ·kg−1)16–1940.0
Viscosity (cP at 50 °C)40–150180.0
pH2.4-
Table 3. Biomass feedstock properties.
Waste Pinewood Properties
Moisture content (wt.% as received)3.00
Volatile matter (wt.% dry)79.38
Fixed carbon (wt.% dry)11.34
Ash (wt.% dry)9.28
C (wt.% dry ash free)50.15
H (wt.% dry ash free)5.41
O (wt.% dry ash free)44.37
N (wt.% dry ash free)0.06
S (wt.% dry ash free)0.01
Cl (wt.% dry ash free)0.00
Heating value (HHV) (MJ/kg as received)17.50
Average diameter (mm)10.00
Table 4. Characteristic of the CHP unit used in this process simulation.
CHP ParametersValue
Overall efficiency72.0%
Electricity factor0.613
Losses for maintenance (heat/steam prod.)7.5%
Table 5. Specifications for gasoline based on European Union standards.
Upper Limit
Oxygen content3.70 wt.%
Benzene1.10 wt.%
Aromatics35.00 v.%
Olefins18.00 v.%
Table 6. Properties of conventional fossil fuels.
GasolineDieselFuel Oil
Carbon content (wt.%)878685.3
Hydrogen content (wt.%)131411.5
Oxygen content (wt.%)001
H/C molar ratio1.791.951.62
Higher heating value (MJ/kg)47.3044.8040
Average molecular weight (g)114.23 (Octane)169.83 (Hexadecane)422 (based on C30 alkane) (C7 to >C50)
Average boiling point (°C)38–204>150121–600
Acid-sugar-carbonyl content (wt.%)000
Table 7. Overall mass balance of the process and elemental composition of the bio-oil obtained from laboratory experiments (before separation of heavy and water-soluble components); elemental analyses are reported on dry basis.
Pyrolysis Yields (without Further Treatment)Cs/ASANa/γAl2O3HY-ZeoliteThermal
Organics (wt.%)15.7912.4810.3044.09
Water (H2O) (wt.%)32.0629.1233.0421.51
Char + Coke (wt.%)18.5525.1328.4411.43
Gases (wt.%)24.6124.2719.2213.98
Ash (wt.%)9.009.009.009.00
Organic fraction properties
Carbon content (wt.%)65.4569.6557.7552.03
Hydrogen content (wt.%)5.355.275.065.69
Oxygen content (wt.%)29.2025.0837.1942.28
Heating value (MJ/kg)24.9226.9820.4418.49
Table 8. Oil properties and process results for the DO_oil scenario.
DO_Oil Table
Flow RatesCs/ASANa-AluminaHY-ZeoliteThermal
Oil production (kg/hr)6857314742141
H2 export (kg/hr) a308192209910
Combustion energy (Char+coke+gases) (MJ/h)187,660212,923223,145133,078
Electricity export (kW) b11,85513,78714,5687682
Steam export (MJ/hr) b68,58280,82085,96228,888
Overall energy yield (MJ/MJ biomass)% c52.553.153.074.3
Oil Properties
Carbon content (wt.%)82.281.375.974.5
Hydrogen content (wt.%)9.97.88.18.2
Oxygen content (wt.%)7.910.815.917.3
Higher heating value (MJ/kg)41.0537.1934.8634.28
H/C molar ratio1.451.151.281.32
O/C molar ratio0.070.100.160.17
O/H molar ratio0.050.090.120.13
Average molecular weight (g)139.81122.04140.79146.66
Average boiling point (deg C)202.42200.04215.04220.49
Acids (wt.%)0.000.000.030.97
Sugars (wt.%)0.000.000.002.16
Carbonyls (wt.%)1.411.702.022.80
Total problem components (wt.%)1.421.702.045.92
Benzene (wt.%)0.000.000.000.00
Aromatics (vol%)19.9029.251.220.74
Olefins (vol%) d11.564.011.382.24
a All of the H2 produced is exported, no internal consumption; b After pinch analysis; c Includes final energy output in oil, H2, electricity and steam. d Olefins are not hydrocarbons and are mainly oxygenated components with double bonds.
Publisher’s Note: MDPI stays neutral with regard to jurisdictional claims in published maps and institutional affiliations.