Economic Analysis of a New Business for Liposome Manufacturing Using a High-Pressure System

 ,
,  ,
, 

Abstract
:1. Introduction
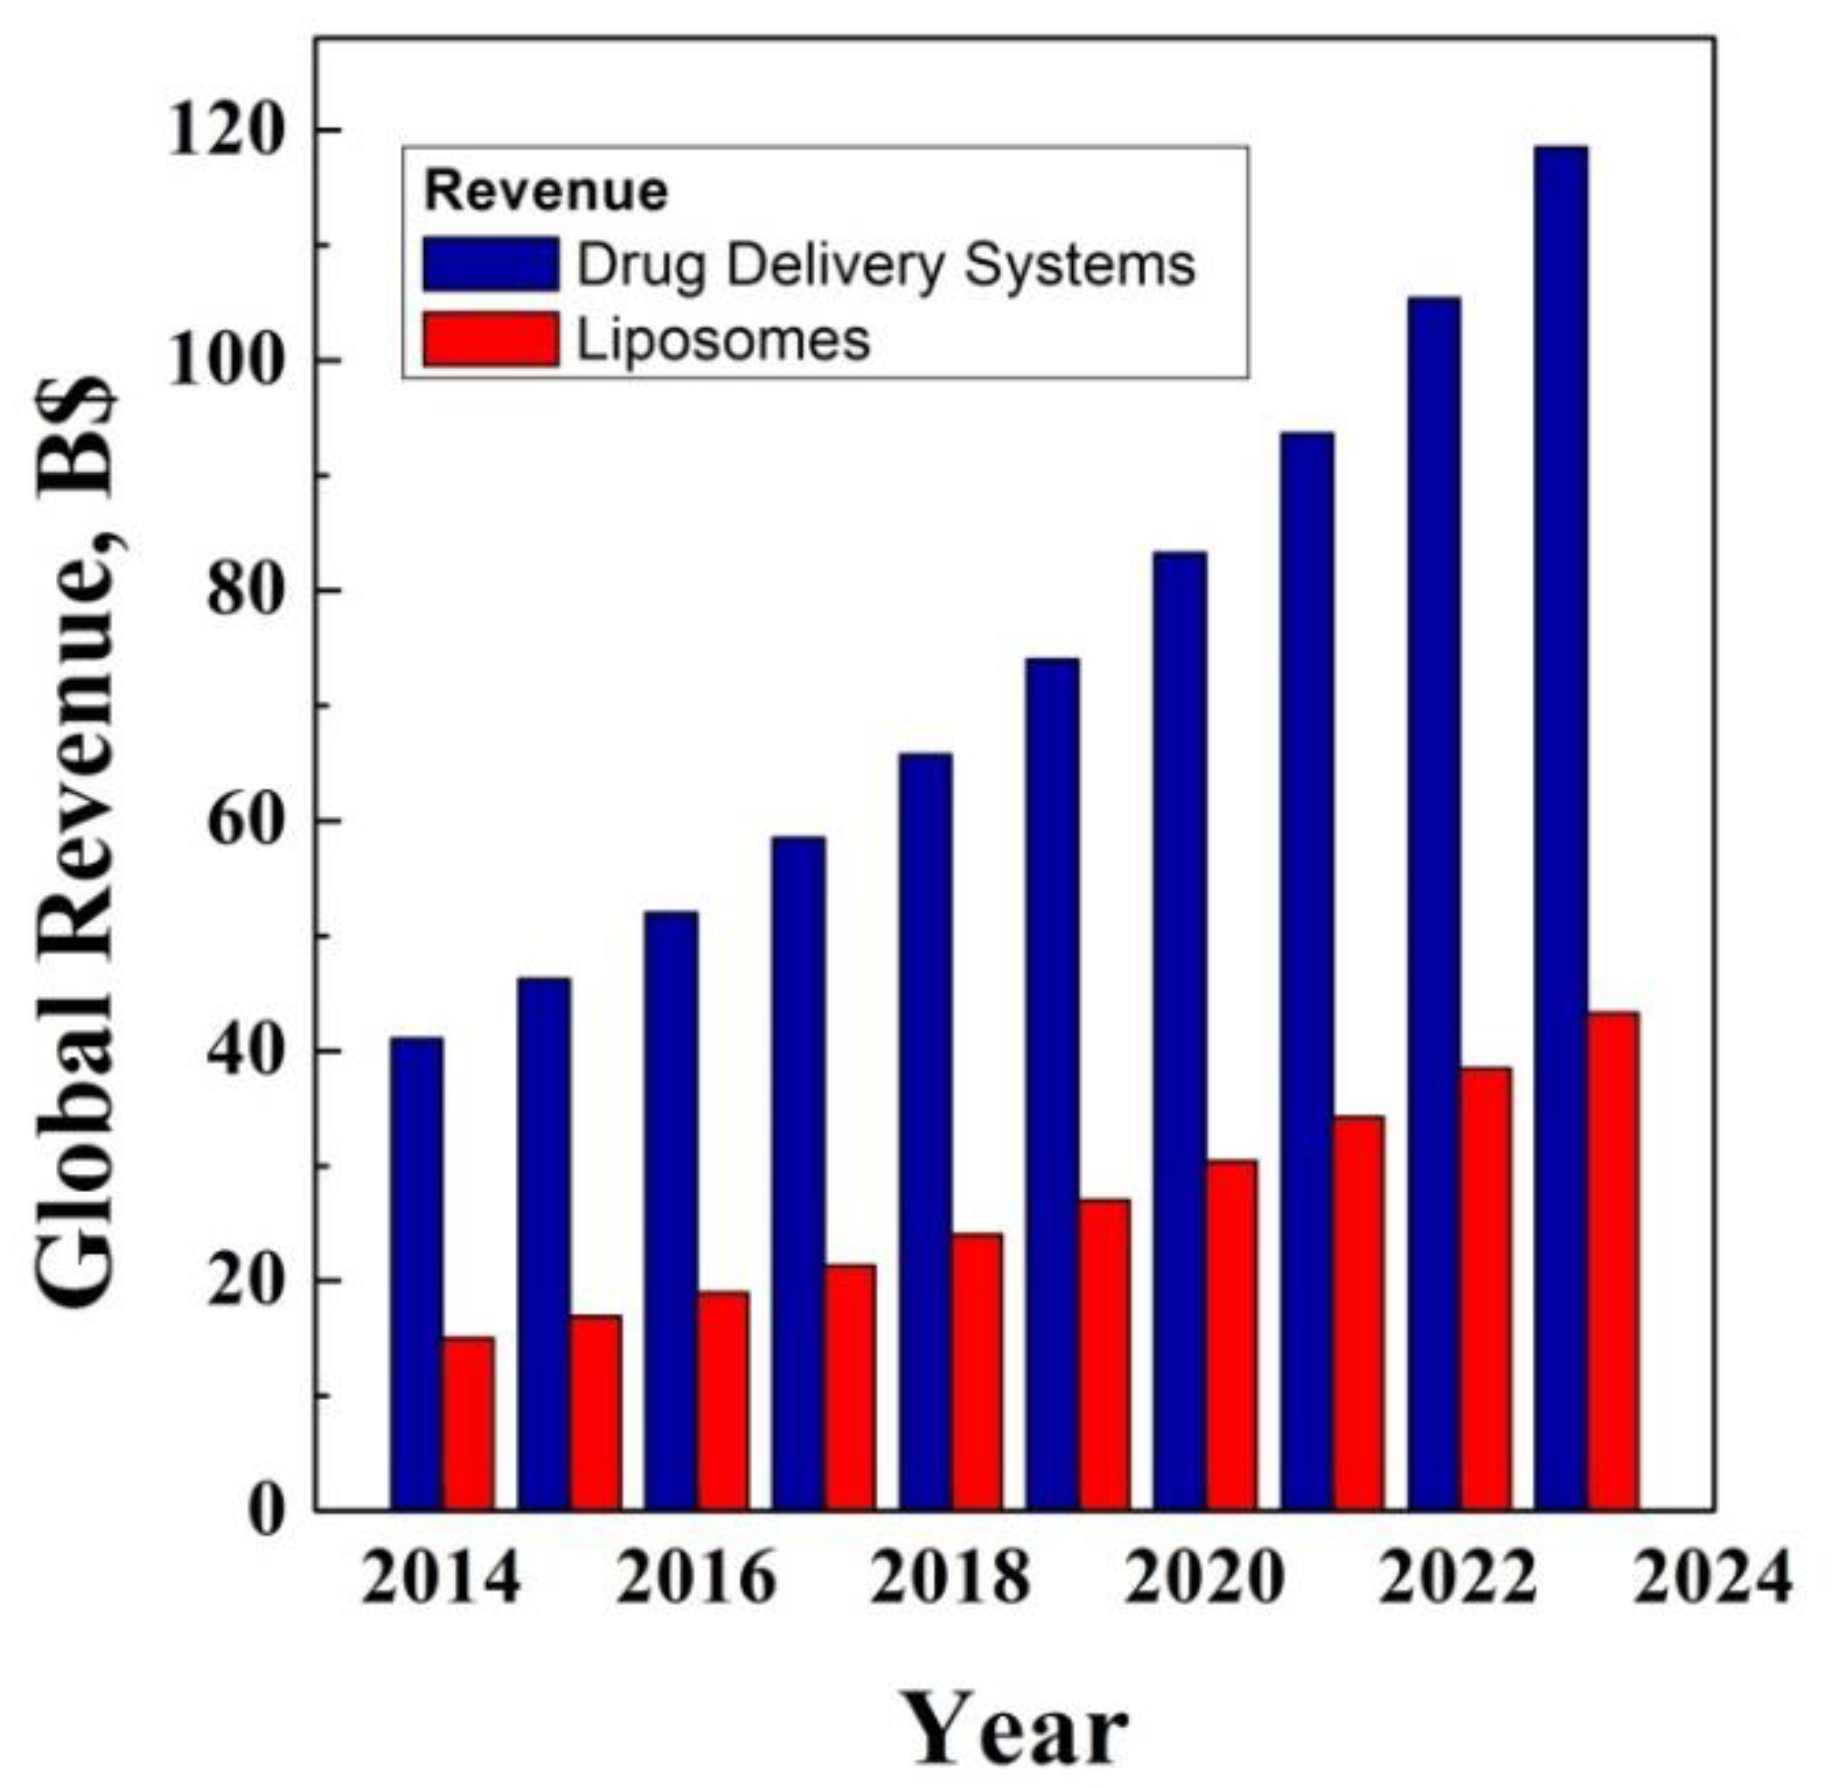
2. Economic Analysis: First Reference Market
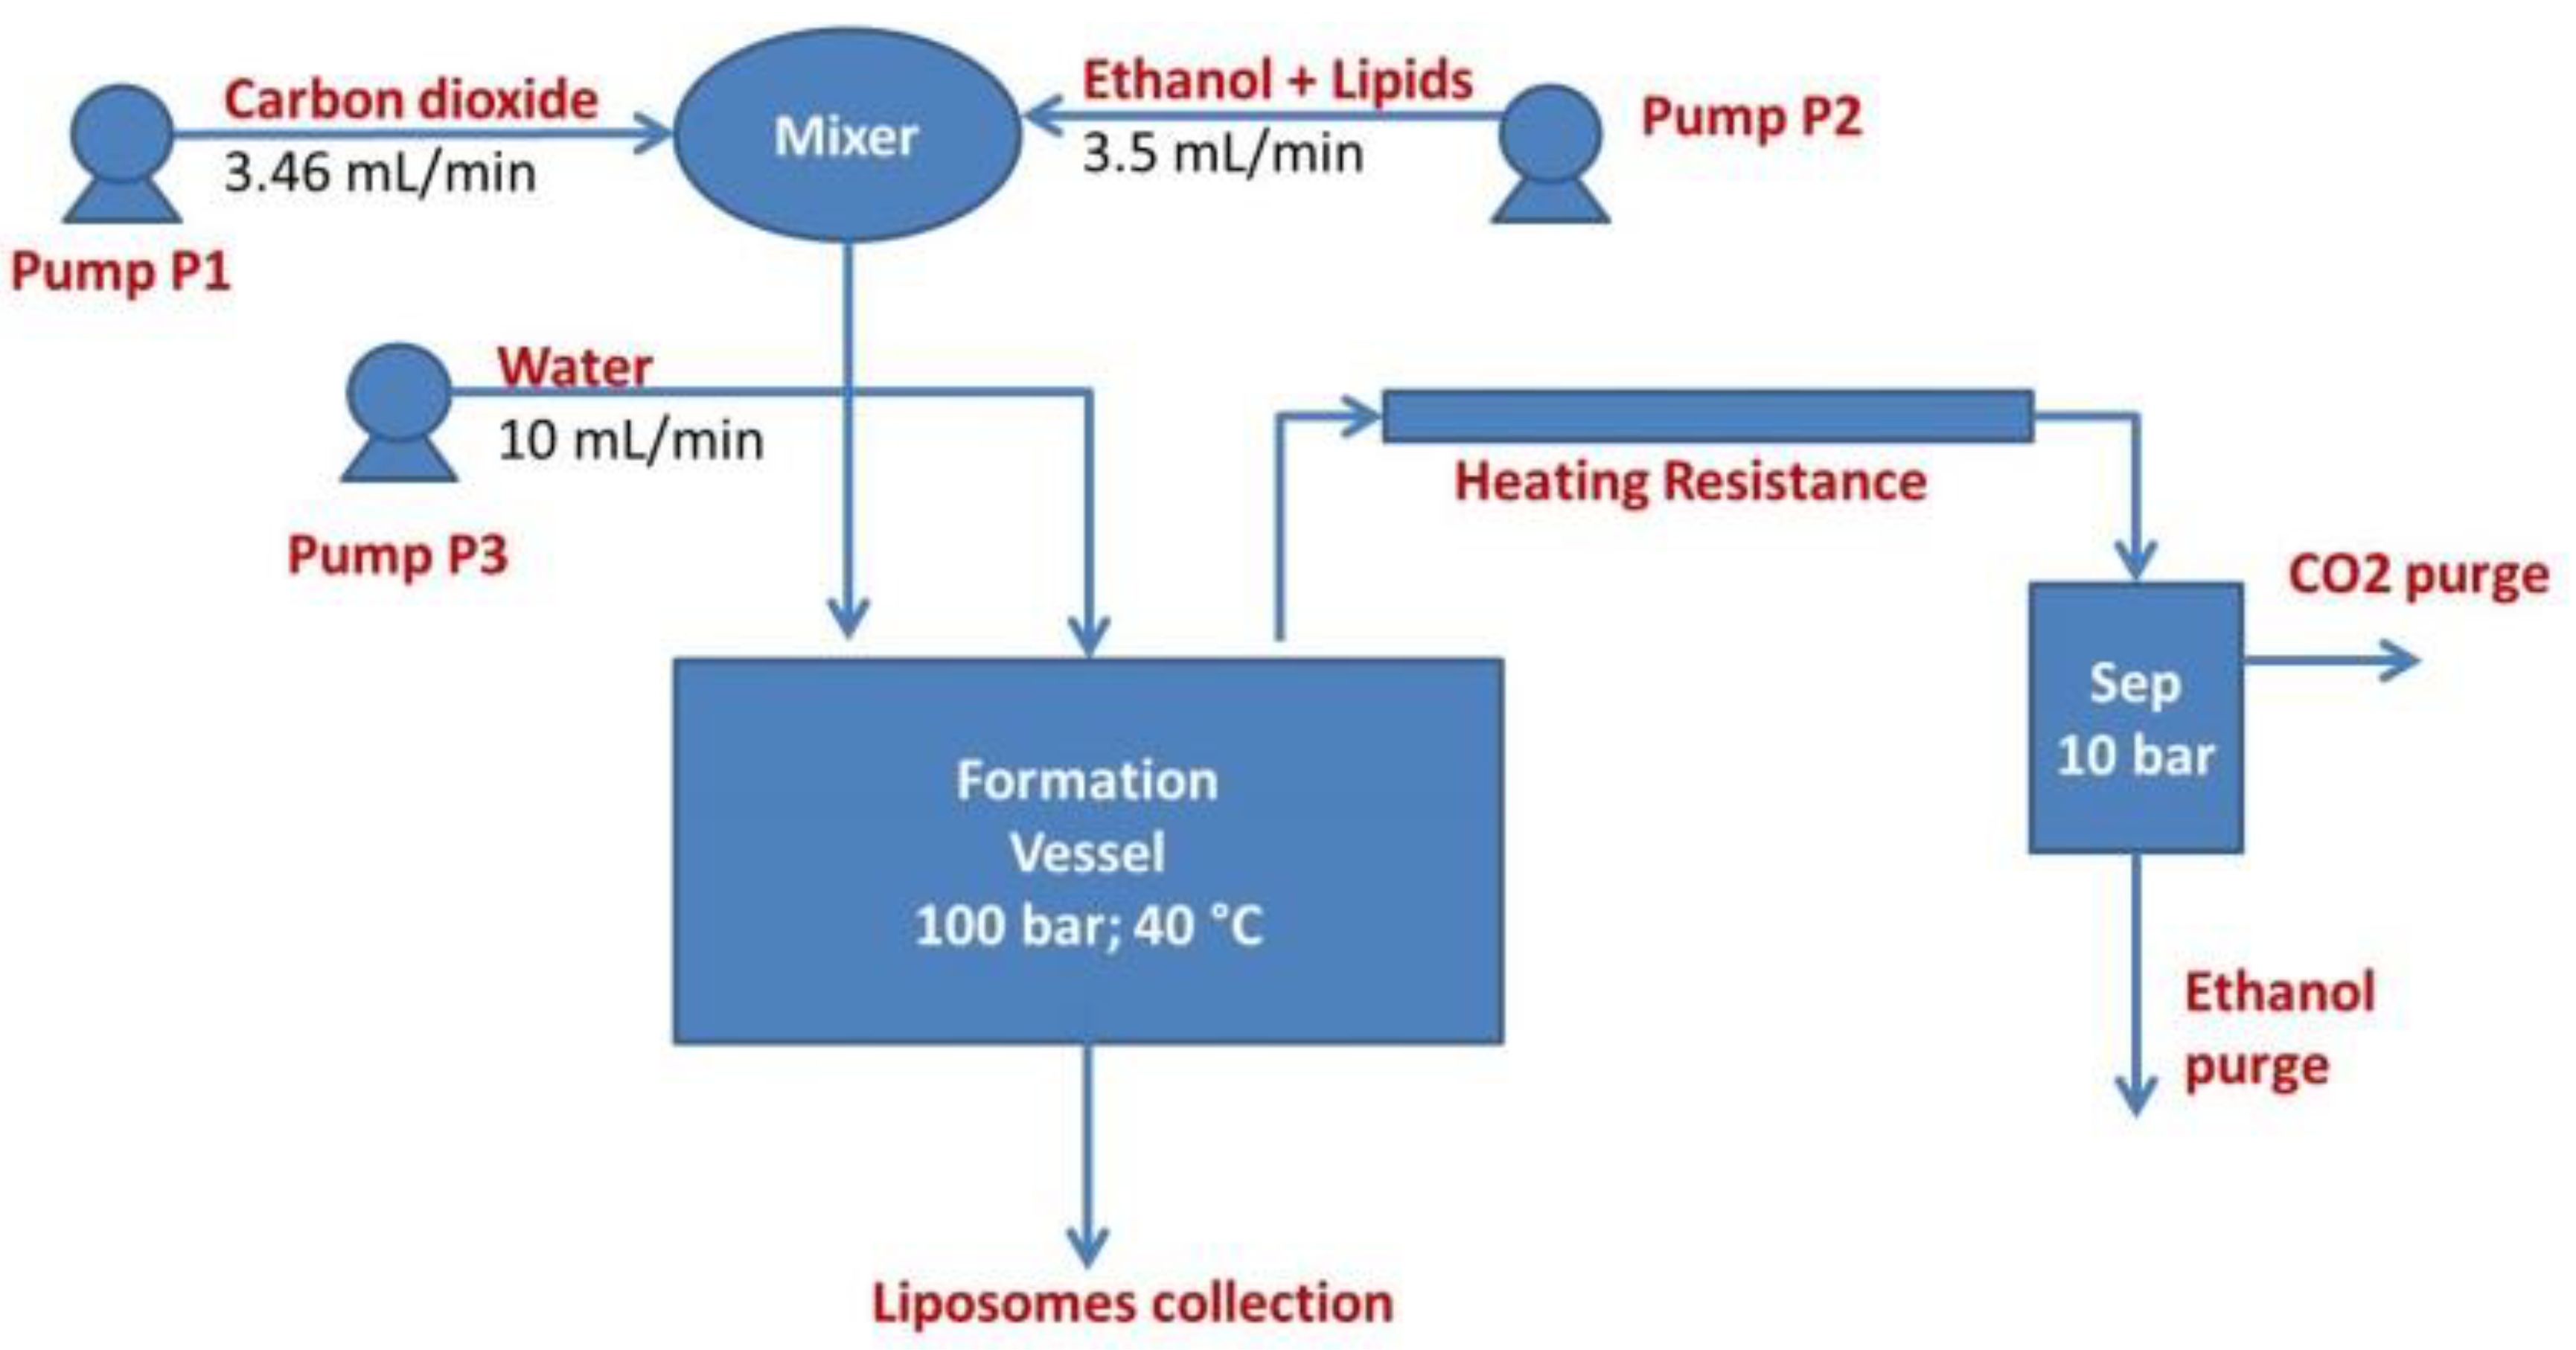
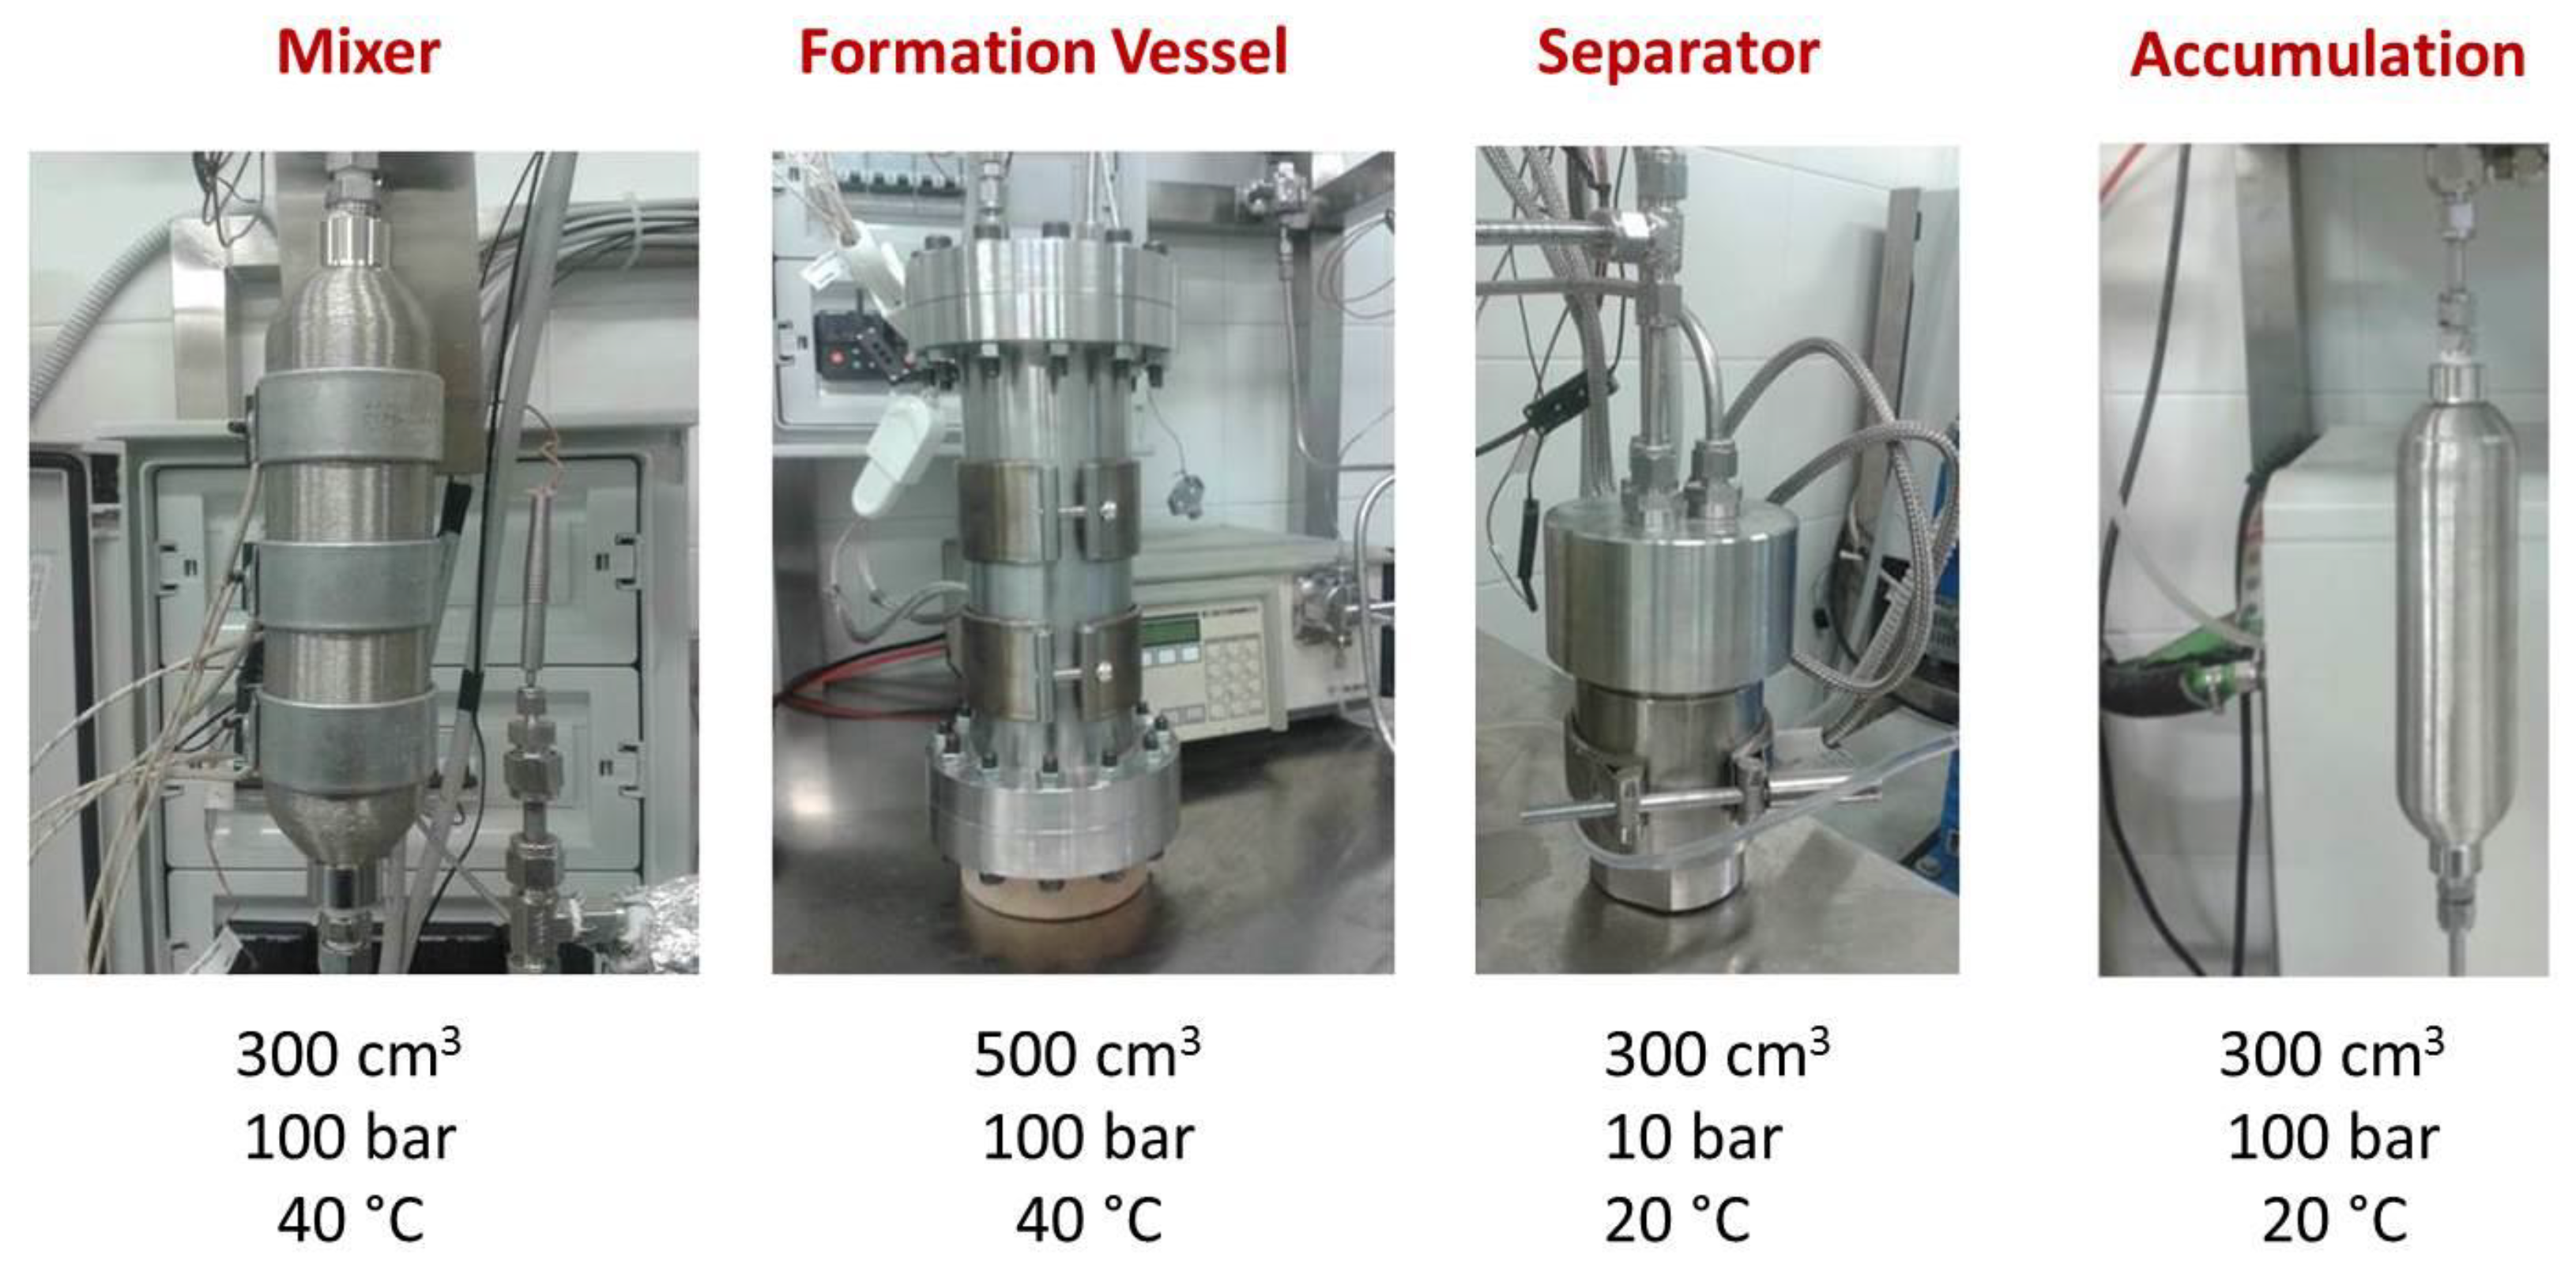
3. Proposal of A Business Model
4. S.W.O.T. Analysis
5. Financial Analysis
6. Conclusions and Future Perspectives
Author Contributions
Funding
Acknowledgments
Conflicts of Interest
Abbreviation
| TRL | Technology Readiness Level |
| CF | Cash Flow |
| CFO | Operating Cash Flow |
| ROI | Return on Interest |
| ROS | Return on Sales |
| SuperLip | Supercritical assisted Liposome formation |
| S.W.O.T. | Strength, Weaknesses, Opportunities, Treats |
| CAPEX | Capital Expenditures |
| OPEX | Operative Expenditures |
| PDI | Polydispersity Index |
| FDA | Food and Drug Administration |
References
- Pattni, B.S.; Chupin, V.V.; Torchilin, V.P. New Developments in Liposomal Drug Delivery. Chem. Rev. 2015, 15, 10938–10966. [Google Scholar] [CrossRef] [PubMed]
- Noble, G.T.; Stefanick, J.F.; Ashley, J.D.; Kiziltepe, T.; Bilgicer, B. Ligand-targeted liposome design: Challenges and fundamental considerations. Trends Biotechnol. 2014, 32, 32–45. [Google Scholar] [CrossRef] [PubMed]
- Kalhapure, R.S.; Suleman, N.; Mocktar, C.; Seedat, N.; Govender, T. Nanoengineered drug delivery systems for enhancing antibiotic therapy. J. Pharm. Sci. 2015, 104, 872–905. [Google Scholar] [CrossRef] [PubMed]
- Liu, W.; Ye, A.; Liu, W.; Liu, C.; Han, J.; Singh, H. Behaviour of liposomes loaded with bovine serum albumin during in vitro digestion. Food Chem. 2015, 175, 16–24. [Google Scholar] [CrossRef]
- Wu, S.Y.; McMillan, N.A.J. Lipidic systems for in vivo siRNA delivery. AAPS J. 2009, 11, 639–652. [Google Scholar] [CrossRef] [Green Version]
- Bonechi, C.; Donati, A.; Tamasi, G.; Leone, G.; Consumi, M.; Rossi, C.; Lamponi, S.; Magnani, A. Protective effect of quercetin and rutin encapsulated liposomes on induced oxidative stress. Biophys. Chem. 2018, 233, 55–63. [Google Scholar] [CrossRef]
- McNamara, K.P.; Rosenzweig, Z. Dye-encapsulating liposomes as fluorescence-based oxygen nanosensors. Anal. Chem. 1998, 70, 4853–4859. [Google Scholar] [CrossRef]
- Keller, B.C. Liposomes in nutrition. Trends Food Sci. Technol. 2001, 12, 25–31. [Google Scholar] [CrossRef]
- Allen, T.M.; Chonn, A. Large unilamellar liposomes with low uptake into the reticuloendothelial system. FEBS Lett. 1987, 223, 42–46. [Google Scholar] [CrossRef] [Green Version]
- Elizondo, E.; Moreno, E.; Cabrera, I.; Córdoba, A.; Sala, S.; Veciana, J.; Ventosa, N. Liposomes and other vesicular systems: Structural characteristics, methods of preparation, and use in nanomedicine. Prog. Mol. Biol. Transl. Sci. 2011, 104, 1–52. [Google Scholar] [CrossRef]
- Mozafari, M.R. Liposomes: An overview of manufacturing techniques. Cell. Mol. Biol. Lett. 2005, 10, 711–719. [Google Scholar] [PubMed]
- Osaki, T.; Kamiya, K.; Kawano, R.; Takeuchi, S. Batch release of monodisperse liposomes triggered by pulsed voltage stimulation. In Proceedings of the IEEE International Conference on Micro Electro Mechanical Systems (MEMS), San Francisco, CA, USA, 26–30 January 2014; pp. 257–258. [Google Scholar] [CrossRef]
- Ong, S.G.M.; Chitneni, M.; Lee, K.S.; Ming, L.C.; Yuen, K.H. Evaluation of extrusion technique for nanosizing liposomes. Pharmaceutics 2016, 8, 36. [Google Scholar] [CrossRef] [PubMed]
- Tirado, D.F.; Palazzo, I.; Scognamiglio, M.; Calvo, L.; Della Porta, G.; Reverchon, E. Astaxanthin encapsulation in ethyl cellulose carriers by continuous supercritical emulsions extraction: A study on particle size, encapsulation efficiency, release profile and antioxidant activity. Supercrit. Fluids 2019, 150, 128–136. [Google Scholar] [CrossRef]
- Sofia, D.; Giuliano, A.; Gioiella, F. Air quality monitoring network for tracking pollutants: The case study of Salerno city center. Chem. Eng. Trans. 2018, 68, 1–6. [Google Scholar]
- Levin, M. Pharmaceutical Process Scale-Up; Metropolitan Computing Corporation: New York Basel, NY, USA, 2005. [Google Scholar]
- Zheng, S.; Alkan-Onyuksel, H.; Beissinger, R.L.; Wasan, D.T. Liposome microencapsulations without using any organic solvent. J. Dispers. Sci. Technol. 1999, 20, 1189–1203. [Google Scholar] [CrossRef]
- Mufamadi, M.S.; Pillay, V.; Choonara, Y.E.; Du Toit, L.C.; Modi, G.; Naidoo, D.; Ndesendo, V.M. A review on composite liposomal technologies for specialized drug delivery. J. Drug Deliv. 2010, 2011, 1–19. [Google Scholar] [CrossRef]
- Barenholz, Y.; Lasic, D.D. An overview of liposome scaled-up production and quality control. In Handbook of Nonmedical Applications of Liposomes: Volume III: From Design to Microreactors; CRC Press: Boca Raton, FL, USA, 1996; Volume 996, pp. 2–355. [Google Scholar]
- Lapinski, M.M.; Castro-Forero, A.; Greiner, A.J.; Ofoli, R.Y.; Blanchard, G. Comparison of liposomes formed by sonication and extrusion: Rotational and translational diffusion of an embedded chromophore. J. Langmuir 2007, 23, 11677–11683. [Google Scholar] [CrossRef]
- Hadian, Z.; Sahari, M.A.; Moghimi, H.R.; Barzegar, M. Formulation, Characterization and Optimization of Liposomes Containing Eicosapentaenoic and Docosahexaenoic Acids; A Methodology Approach. Iran. J. Pharm. Res. 2014, 13, 393–404. [Google Scholar]
- Daraee, H.; Etemadi, A.; Kouhi, M.; Alimirzalu, S.; Akbarzadeh, A. Application of liposomes in medicine and drug delivery. Artif. Cells. Nanomed. Biotechnol. 2016, 44, 381–391. [Google Scholar] [CrossRef]
- Egbaria, K.; Weiner, N. Liposomes as a topical drug delivery system. Advanced Drug Delivery Reviews 1990, 5, 287–300. [Google Scholar] [CrossRef] [Green Version]
- Vishvakrama, P.; Sharma, S. Liposomes: An overview. J. Drug Deliv. Ther. 2014, 47–55. [Google Scholar] [CrossRef]
- Campardelli, R.; Trucillo, P.; Reverchon, E. A supercritical fluid-based process for the production of fluorescein-loaded liposomes. J. Supercrit. Fluids 2019, 55, 5359–5365. [Google Scholar] [CrossRef]
- Trucillo, P.; Campardelli, R.; Reverchon, E. Liposomes: From Bangham to Supercritical Fluids. Processes 2020, 8, 1022. [Google Scholar] [CrossRef]
- Nolte, W.L.; Kennedy, B.M.; Dziegiel, R.J. Technology Readiness Level Calculator, Air Force Laboratory. White Pap. Air Force Res. Lab. 2003, 13, 1–16. [Google Scholar]
- Straub, J. In search of technology readiness level (TRL) 10. Aerosp. Sci. Technol. 2015, 46, 312–320. [Google Scholar] [CrossRef]
- Trucillo, P.; Campardelli, R.; Reverchon, E. Production of liposomes loaded with antioxidants using a supercritical CO2 assisted process. Powder Technol. 2018, 323, 155–162. [Google Scholar] [CrossRef]
- Trucillo, P.; Campardelli, R.; Reverchon, E. Encapsulation of Hydrophilic and Lipophilic Compounds in Nanosomes Produced with a Supercritical Based Process. Adv. Bionanomater. 2017, 23–35. [Google Scholar] [CrossRef]
- Trucillo, P.; Campardelli, R.; Scognamiglio, M.; Reverchon, E. Control of liposomes diameter at micrometric and nanometric level using a supercritical assisted technique. J. CO2 Util. 2019, 32, 119–127. [Google Scholar] [CrossRef]
- Mozafari, M.R. Nanoliposomes: Preparation and analysis. Liposomes. Hum. Press 2010, 29–50. [Google Scholar] [CrossRef]
- Gross, J.; Sayle, S.; Karow, A.R.; Bakowsky, U.; Garidel, P. Nanoparticle tracking analysis of particle size and concentration detection in suspensions of polymer and protein samples: Influence of experimental and data evaluation parameters. Eur. J. Pharm. Biopharm. 2010, 104, 30–41. [Google Scholar] [CrossRef]
- Chutich, M.J.; Kaminski, E.J.; Miller, D.A.; Lautenschlager, E.P. Risk assessment of the toxicity of solvents of gutta-percha used in endodontic retreatment. J. Endod. 1998, 24, 213–216. [Google Scholar] [CrossRef]
- Soleimanifar, M.; Jafari, S.M.; Assadpour, E. Encapsulation of olive leaf phenolics within electrosprayed whey protein nanoparticles; production and characterization. Food Hydrocoll. 2020, 101, 105572. [Google Scholar] [CrossRef]
- Andre, P.; Long, D.; Ajdari, A. Electrophoretic mobility of heterogeneous vesicles. EPL (Europhys. Lett.) 1999, 46, 530–536. [Google Scholar] [CrossRef]
- Niu, M.; Lu, Y.; Hovgaard, L.; Wu, W. Liposomes containing glycocholate as potential oral insulin delivery systems: Preparation, in vitro characterization, and improved protection against enzymatic degradation. Int. J. Nanomed. 2011, 6, 1155–1166. [Google Scholar] [CrossRef] [Green Version]
- Carugo, D.; Bottaro, E.; Owen, J.; Stride, E.; Nastruzzi, C. Liposome production by microfluidics: Potential and limiting factors. Sci. Rep. 2016, 6, 1–15. [Google Scholar] [CrossRef] [Green Version]
- Michelon, M.; Huang, Y.; de la Torre, L.G.; Weitz, D.A.; Cunha, R.L. Single-step microfluidic production of W/O/W double emulsions as templates for β-carotene-loaded giant liposomes formation. Chem. Eng. J. 2019, 366, 27–32. [Google Scholar] [CrossRef]
- Worsham, R.D.; Thomas, V.; Farid, S.S. Potential of continuous manufacturing for liposomal drug products. Biotechnol. J. 2018, 14, 1–8. [Google Scholar] [CrossRef] [Green Version]
- Mak, I.W.Y.; Evaniew, N.; Ghert, M. Lost in translation: Animal models and clinical trials in cancer treatment. Am. J. Transl. Res. 2014, 6, 114–118. [Google Scholar]
- Spiro, A.; Buttriss, J.L. Vitamin D: An overview of vitamin D status and intake in Europe. Nutr. Bull. 2014, 39, 322–350. [Google Scholar] [CrossRef] [Green Version]
- Coppens, P.; Da Silva, M.F.; Pettman, S. European regulations on nutraceuticals, dietary supplements and functional foods: A framework based on safety. Toxicology 2006, 221, 59–74. [Google Scholar] [CrossRef]
- Mura, S.; Nicolas, J.; Couvreur, P. Stimuli-responsive nanocarriers for drug delivery. Nat. Mater. 2013, 12, 991–1003. [Google Scholar] [CrossRef] [PubMed]
- Hamidi, M.; Rostamizadeh, K.; Shahbazi, M.A. Intelligent Nanomaterials: Processes, Properties, and Applications. In Hydrogel Nanoparticles in Drug Delivery; Wiley: Hoboken, NJ, USA, 2012; Volume 60, pp. 583–624. [Google Scholar]
- Liechty, W.B.; Kryscio, D.R.; Slaughter, B.V.; Peppas, N.A. Polymers for drug delivery systems. Annu. Rev. Chem. Biomol. Eng. 2010, 1, 149–173. [Google Scholar] [CrossRef] [PubMed] [Green Version]
- Mundargi, R.C.; Babu, V.R.; Rangaswam, V.; Patel, P.; Aminabhavi, T.M. Nano/micro technologies for delivering macromolecular therapeutics using poly (D, L-lactide-co-glycolide) and its derivatives. J. Controlled Release 2008, 125, 193–209. [Google Scholar] [CrossRef] [PubMed]
- Sahoo, S.K.; Labhasetwar, V. Nanotech approaches to drug delivery and imaging. Drug Discov. Today 2003, 8, 1112–1120. [Google Scholar] [CrossRef]
- Shahidi, F. Nutraceuticals, functional foods and dietary supplements in health and disease. J. Food Drug Anal. 2012, 20, 226–230. [Google Scholar] [CrossRef]
- Infelise, L.; Kazimierczak, J.; Wietecha, J.; Kopania, E. GINEXTRA®: A Small-Scale Multipurpose Modular and Integrated Biorefinery Technology. In Biorefinery; Springer: Cham, Switzerland, 2019; pp. 593–614. [Google Scholar] [CrossRef]
- Sarmiento Vargas, I.; García Calva, A.L.; Hernández Camacho, J. Business Model Canvas. Cienc. Huasteca Boletín Científico Esc. Super. Huejutla 2015, 3, 5. [Google Scholar] [CrossRef]


| General Drawbacks of Other Liposomes Processes | SuperLip Process Advantages | SuperLip Potential Application |
|---|---|---|
| Production of vesicles at micrometric level (0.5–50 µm) [33] | Production of vesicles at nanometric level (100–300 nm) | Pharmaceutical formulations |
| Polydisperse samples PDI > 0.2 [34] | Monodispersed samples PDI < 0.2 | |
| Solvent Residue over FDA threshold Use of toxic solvents [35] | Low solvent residue: a green process Use of carbon dioxide (not toxic) | Food industry for the production of additives and dietary supplements |
| Low encapsulation efficiencies Waste increased [36] | Molecule Encapsulation efficiencies higher than 95% Cost reduction | Encapsulation of markers, genes and high weight proteins |
| Vesicles aggregation/instability [37] | Vesicles stability | Long-circulating liposomes |
| Possible drug degradation [38] | Drug protection from heat and oxidation | Cosmetic industries for skin penetration products |
| Post-production steps required [39] | 1-step production of vesicles | Production of liposome-based vaccines in short times |
| Discontinuous processes [40] | Continuous process | Large-scale production |
| Key Partners | Key Activities | Value Propositions | Customer Relationships | Customer Segments |
|---|---|---|---|---|
| Department of Industrial Engineering, University of Salerno, Italy Local low consultant | Production of liposomes on demand | A green and continuous technology. 1-shot production Replicability of the products Solvent-free High versatility and encapsulation efficiency | Continuous dialog with customers with request of feedback Transparency of contracts | Factories Laboratories Academies Research Groups Multinationals |
| Key Resources | Channels | |||
| An innovative production technology High qualified personnel | Internet and Social Fairs and Events Word of Mouth | |||
| Cost Structure | Revenue Streams | |||
| Personnel, Legal consultancy Marketing, Reagents purchasing Operating (power) cost Shipping of products | Selling of liposomes formulations on demand | |||
| Strengths | Weaknesses |
|---|---|
| Liposomes produced using SuperLip showed an encapsulation efficiency higher than 95% of drugs. | The high potential of SuperLip could not be readily understood by medical doctors and sanitary system. |
| Possibility to tune drug release, activated by external stimuli on demand. | |
| Competitive cost compared to average market price. | Several are still linked to conventional methods for the production of liposomes. |
| Opportunities | Threats |
| Fast growth of the liposomal market | SuperLip process has not been patented. However, SuperLip products can be still patented. |
| ASSET | Cost 1 Unit [€] | Unit Number | Total [€] |
|---|---|---|---|
| Pumps | 10,000 | 3 | 30,000 |
| heat exchangers | 2000 | 3 | 6000 |
| On/Off valves | 100 | 4 | 400 |
| micrometric valves | 400 | 1 | 400 |
| backpressure valves | 2500 | 1 | 2500 |
| glass burette | 200 | 2 | 400 |
| stainless steel piping elements | 50 | 15 | 750 |
| stainless steel main vessel | 2000 | 1 | 2000 |
| stainless steel separator | 1000 | 1 | 1000 |
| thermocouples | 500 | 1 | 500 |
| compressed gas tank | 5000 | 1 | 5000 |
| manometers | 150 | 3 | 450 |
| flow meter | 200 | 1 | 200 |
| heaters elements | 100 | 2 | 200 |
| stainless steel plant backbone | 1500 | 1 | 1500 |
| laboratory extractor hood | 6000 | 1 | 6000 |
| Laboratory desks | 200 | 5 | 1000 |
| computers for instrumentations | 800 | 3 | 2400 |
| sample stock fridge | 2000 | 1 | 2000 |
| maintenance elements | 6270 | ||
| TOTAL Plant CAPEX | 68,970 |
| Price/Year [€] | |||||||||||
|---|---|---|---|---|---|---|---|---|---|---|---|
| Service | 2020 | 2021 | 2022 | 2023 | 2024 | 2025 | 2026 | 2027 | 2028 | 2029 | 2030 |
| Power supply | 4560 | 4651 | 4744 | 4839 | 4936 | 5035 | 5135 | 5238 | 5343 | 5450 | 5559 |
| Reagents | 24,000 | 24,480 | 24,970 | 25,469 | 25,978 | 26,498 | 27,028 | 27,568 | 28,120 | 28,682 | 29,256 |
| Water supply | 3800 | 3876 | 3954 | 4033 | 4113 | 4196 | 4279 | 4365 | 4452 | 4541 | 4632 |
| Total | 32,360 | 33,007 | 33,667 | 34,341 | 35,028 | 35,728 | 36,443 | 37,171 | 37,915 | 38,673 | 39,447 |
| Price/Year [€] | |||||||||||
|---|---|---|---|---|---|---|---|---|---|---|---|
| Role | 2020 | 2021 | 2022 | 2023 | 2024 | 2025 | 2026 | 2027 | 2028 | 2029 | 2030 |
| SM * | 33,600 | 33,768 | 33,937 | 34,107 | 34,277 | 34,448 | 34,621 | 34,794 | 34,968 | 35,143 | 35,318 |
| PM ** | 31,200 | 31,200 | 31,200 | 31,200 | 31,200 | 31,200 | 31,200 | 31,200 | 31,200 | 31,200 | 31,200 |
| Operator 1 | 28,800 | 28,944 | 29,089 | 29,234 | 29,380 | 29,527 | 29,675 | 29,823 | 29,972 | 30,122 | 30,273 |
| Operator 2 | 28,800 | 28,944 | 29,089 | 29,234 | 29,380 | 29,527 | 29,675 | 29,823 | 29,972 | 30,122 | 30,273 |
| LS *** | 26,400 | 26,532 | 26,665 | 26,798 | 26,932 | 27,067 | 27,202 | 27,338 | 27,475 | 27,612 | 27,750 |
| Administration | 21,600 | 21,708 | 21,817 | 21,926 | 22,035 | 22,145 | 22,256 | 22,367 | 22,479 | 22,592 | 22,705 |
| Total | 170,400 | 171,096 | 171,795 | 172,498 | 173,205 | 173,915 | 174,629 | 175,346 | 176,066 | 176,791 | 177,519 |
| Price/Year [€] | |||||||||||
|---|---|---|---|---|---|---|---|---|---|---|---|
| Service | 2020 | 2021 | 2022 | 2023 | 2024 | 2025 | 2026 | 2027 | 2028 | 2029 | 2030 |
| Internet services | 1200 | 1224 | 1248 | 1273 | 1299 | 1325 | 1351 | 1378 | 1406 | 1434 | 1463 |
| Air quality monitoring | 2000 | 2040 | 2081 | 2122 | 2165 | 2208 | 2252 | 2297 | 2343 | 2390 | 2438 |
| Plant insurance | 3880 | 3958 | 4037 | 4117 | 4200 | 4284 | 4370 | 4457 | 4546 | 4637 | 4730 |
| Software license | 1800 | 1836 | 1873 | 1910 | 1948 | 1987 | 2027 | 2068 | 2109 | 2151 | 2194 |
| Rentals | 24,000 | 24,480 | 24,970 | 25,469 | 25,978 | 26,498 | 27,028 | 27,568 | 28,120 | 28,682 | 29,256 |
| Total | 32,880 | 33,538 | 34,208 | 34,893 | 35,590 | 36,302 | 37,028 | 37,769 | 38,524 | 39,295 | 40,081 |
| Profit/Loss Statement | 2020 | 2021 | 2022 | 2023 | 2024 | 2025 | 2026 | 2027 | 2028 | 2029 | 2030 |
|---|---|---|---|---|---|---|---|---|---|---|---|
| Sold products [%] | 20% | 25% | 30% | 50% | 60% | 62% | 67% | 70% | 70% | 75% | 75% |
| Sold products | 158,400 | 198,000 | 237,600 | 396,000 | 475,200 | 491,040 | 530,640 | 554,400 | 554,400 | 594,000 | 594,000 |
| Sum of cost | 235,640 | 237,641 | 239,671 | 241,732 | 243,823 | 245,945 | 248,099 | 250,286 | 252,505 | 254,759 | 257,046 |
| Depreciation (10%) | 6897 | 6897 | 6897 | 6897 | 6897 | 6897 | 6897 | 6897 | 6897 | 6897 | 6897 |
| Fixed tax (4%) | 6336 | 7920 | 9504 | 15,840 | 19,008 | 19,642 | 21,226 | 22,176 | 22,176 | 23,760 | 23,760 |
| Tax on profit (26%) | 0 | 0 | 0 | 102,960 | 123,552 | 127,670 | 137,966 | 144,144 | 144,144 | 154,440 | 154,440 |
| CFO * | −90,473 | −54,458 | −18,472 | 28,571 | 81,920 | 90,886 | 116,452 | 130,897 | 128,678 | 154,144 | 151,857 |
| Cash Flow | 2020 | 2021 | 2022 | 2023 | 2024 | 2025 | 2026 | 2027 | 2028 | 2029 | 2030 |
|---|---|---|---|---|---|---|---|---|---|---|---|
| CFO | −90,473 | −54,458 | −18,472 | 28,571 | 81,920 | 90,886 | 116,452 | 130,897 | 128,678 | 154,144 | 151,857 |
| Asset Depreciation | 6897 | 6897 | 6897 | 6897 | 6897 | 6897 | 6897 | 6897 | 6897 | 6897 | 6897 |
| 1st-year Investment * | 68,970 | 0 | 0 | 0 | 0 | 0 | 0 | 0 | 0 | 0 | 0 |
| Grant and Loan | 0 | 0 | 0 | 0 | 0 | 0 | 0 | 0 | 0 | 0 | 0 |
| Cash Flow | −152,546 | −47,561 | −11,575 | 35,468 | 88,817 | 97,783 | 123,349 | 137,794 | 135,575 | 161,041 | 158,754 |
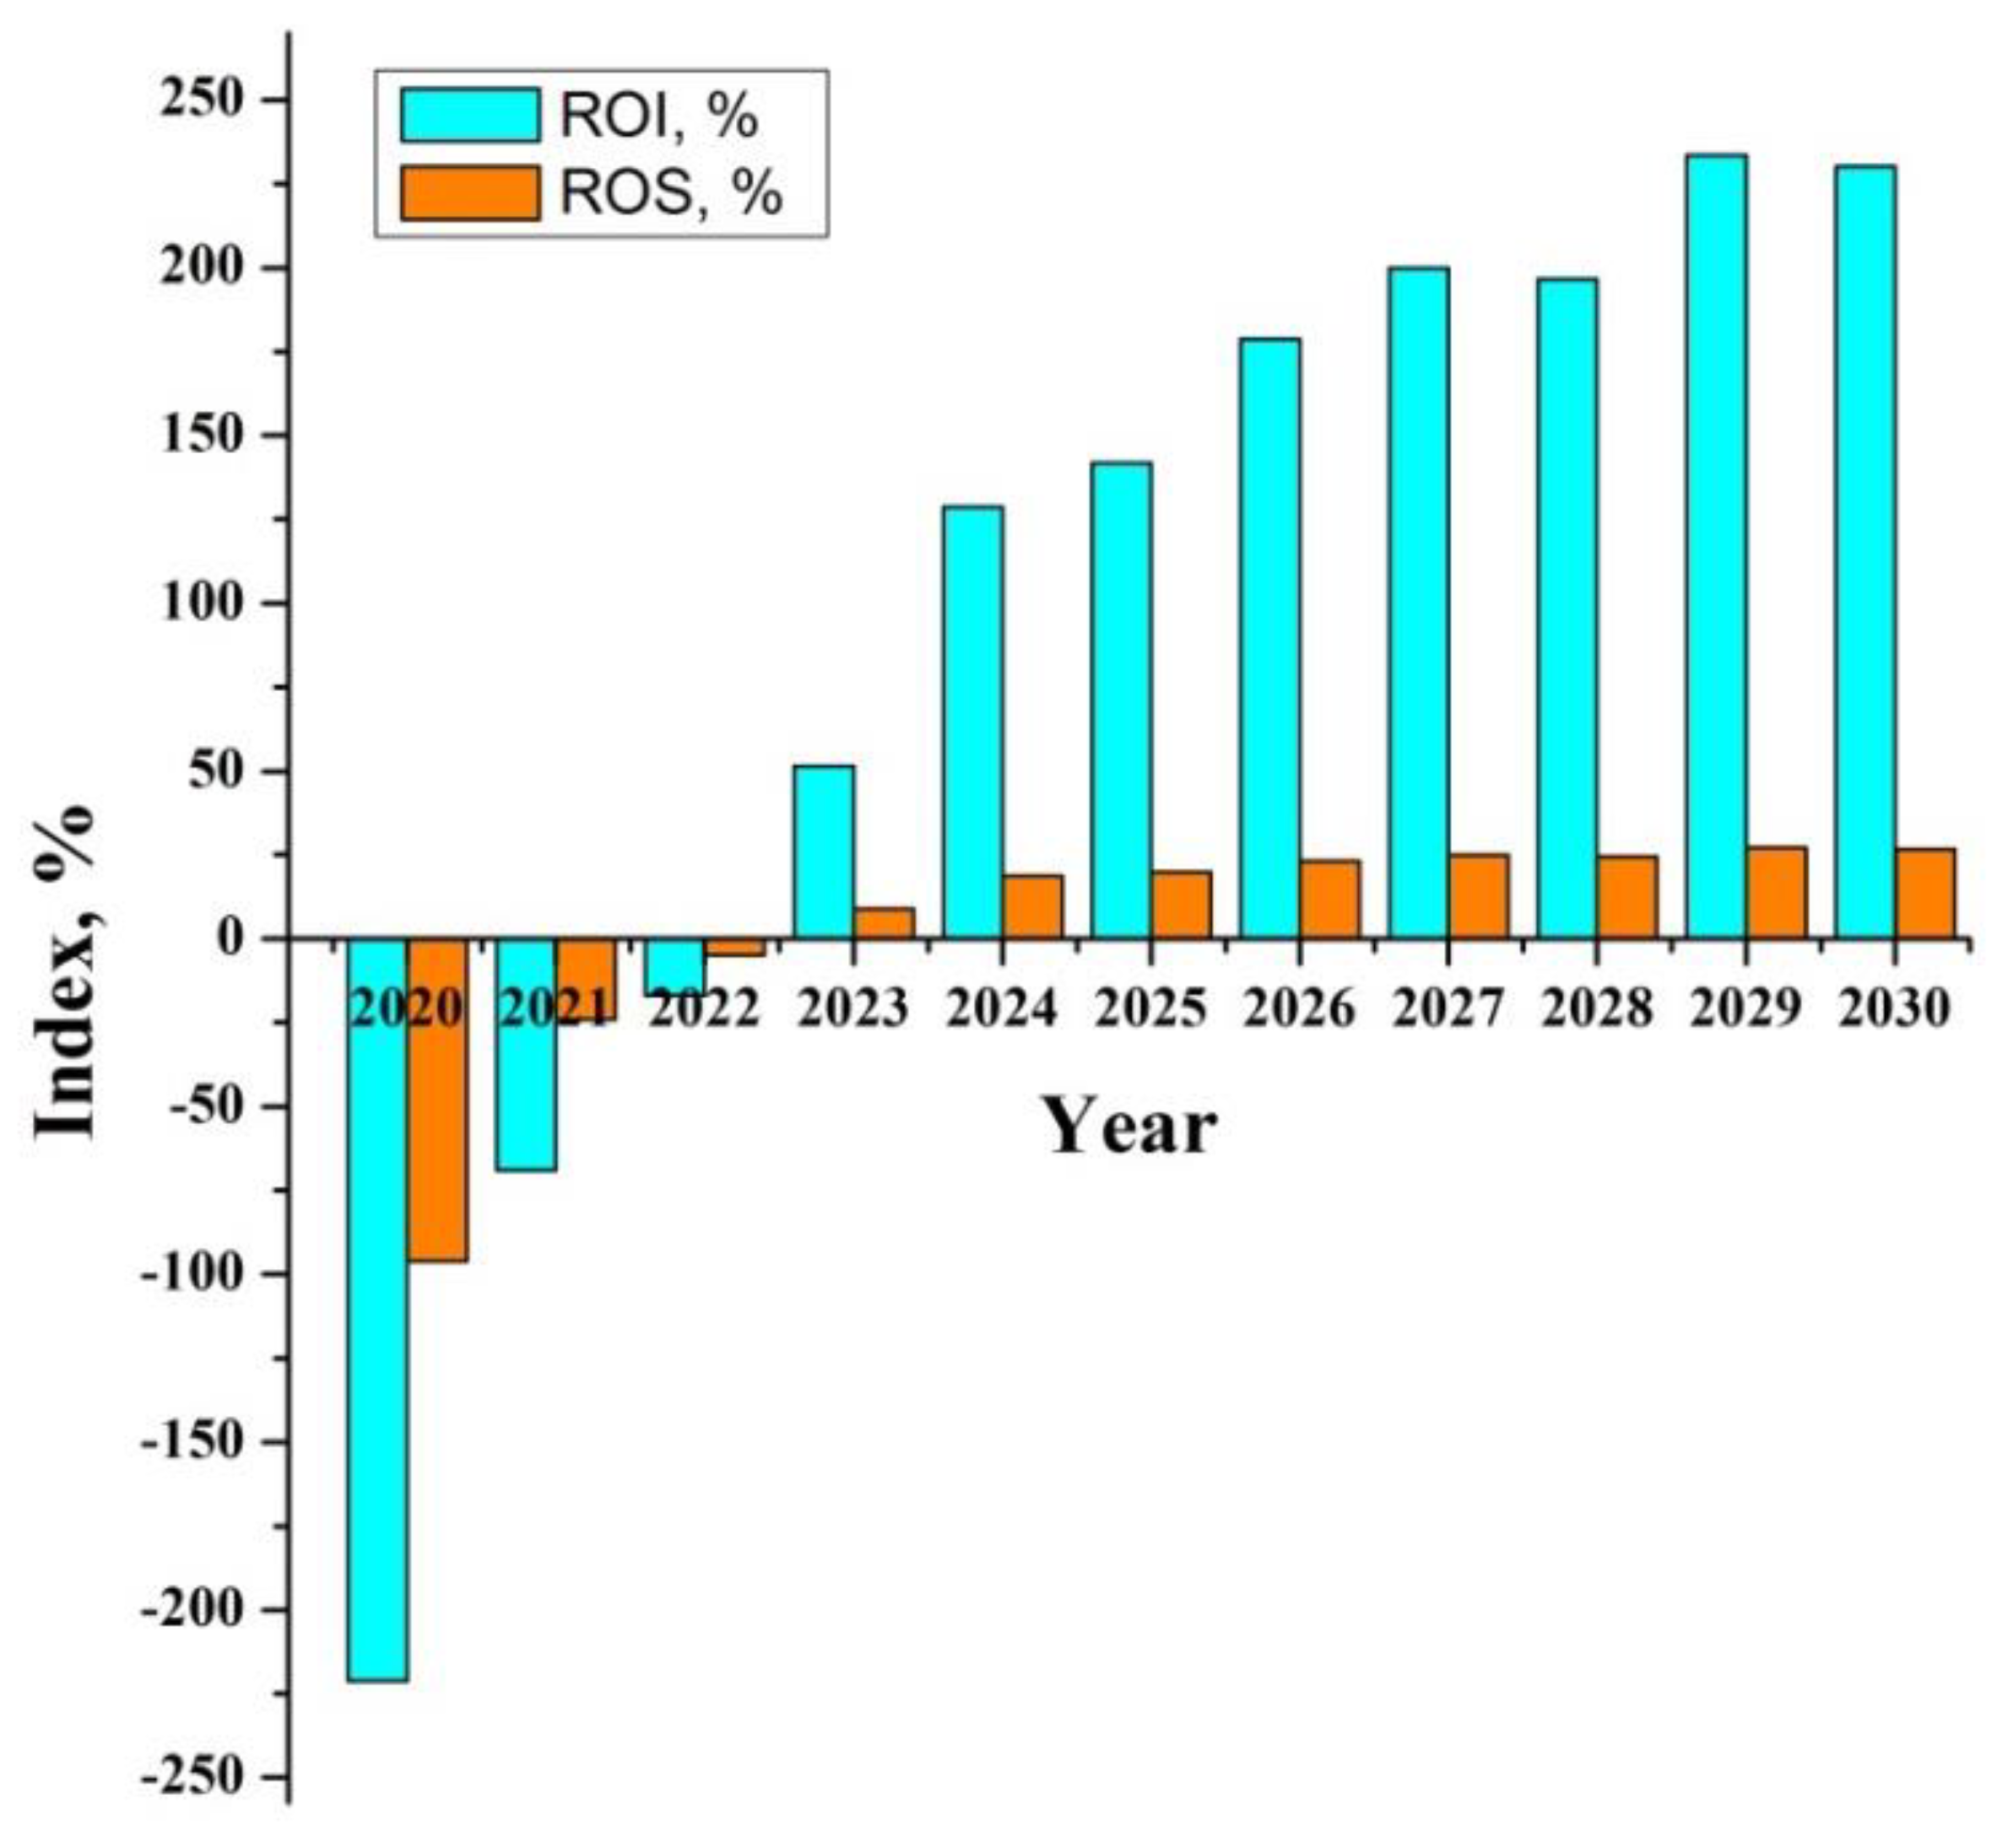
| Index, [%] | 2020 | 2021 | 2022 | 2023 | 2024 | 2025 | 2026 | 2027 | 2028 | 2029 | 2030 |
|---|---|---|---|---|---|---|---|---|---|---|---|
| ROI | −221.2 | −69 | −16.8 | 51.4 | 128.8 | 141.8 | 178.8 | 199.8 | 196.6 | 233.5 | 230.2 |
| ROS | −93.6 | −24 | −4.9 | 9.0 | 18.7 | 19.9 | 23.2 | 24.9 | 24.5 | 27.1 | 26.7 |
Publisher’s Note: MDPI stays neutral with regard to jurisdictional claims in published maps and institutional affiliations. |
© 2020 by the authors. Licensee MDPI, Basel, Switzerland. This article is an open access article distributed under the terms and conditions of the Creative Commons Attribution (CC BY) license (http://creativecommons.org/licenses/by/4.0/).
Share and Cite
Trucillo, P.; Campardelli, R.; Iuorio, S.; De Stefanis, P.; Reverchon, E. Economic Analysis of a New Business for Liposome Manufacturing Using a High-Pressure System. Processes 2020, 8, 1604. https://doi.org/10.3390/pr8121604
Trucillo P, Campardelli R, Iuorio S, De Stefanis P, Reverchon E. Economic Analysis of a New Business for Liposome Manufacturing Using a High-Pressure System. Processes. 2020; 8(12):1604. https://doi.org/10.3390/pr8121604
Chicago/Turabian StyleTrucillo, Paolo, Roberta Campardelli, Silvia Iuorio, Paolo De Stefanis, and Ernesto Reverchon. 2020. "Economic Analysis of a New Business for Liposome Manufacturing Using a High-Pressure System" Processes 8, no. 12: 1604. https://doi.org/10.3390/pr8121604
APA StyleTrucillo, P., Campardelli, R., Iuorio, S., De Stefanis, P., & Reverchon, E. (2020). Economic Analysis of a New Business for Liposome Manufacturing Using a High-Pressure System. Processes, 8(12), 1604. https://doi.org/10.3390/pr8121604