Electrochemical Mineralization of Ibuprofen on BDD Electrodes in an Electrochemical Flow Reactor: Numerical Optimization Approach

 ,
,  , , ,
, , ,
Abstract
:
1. Introduction
2. Materials and Methods
2.1. Synthetic Solution of Ibuprofen
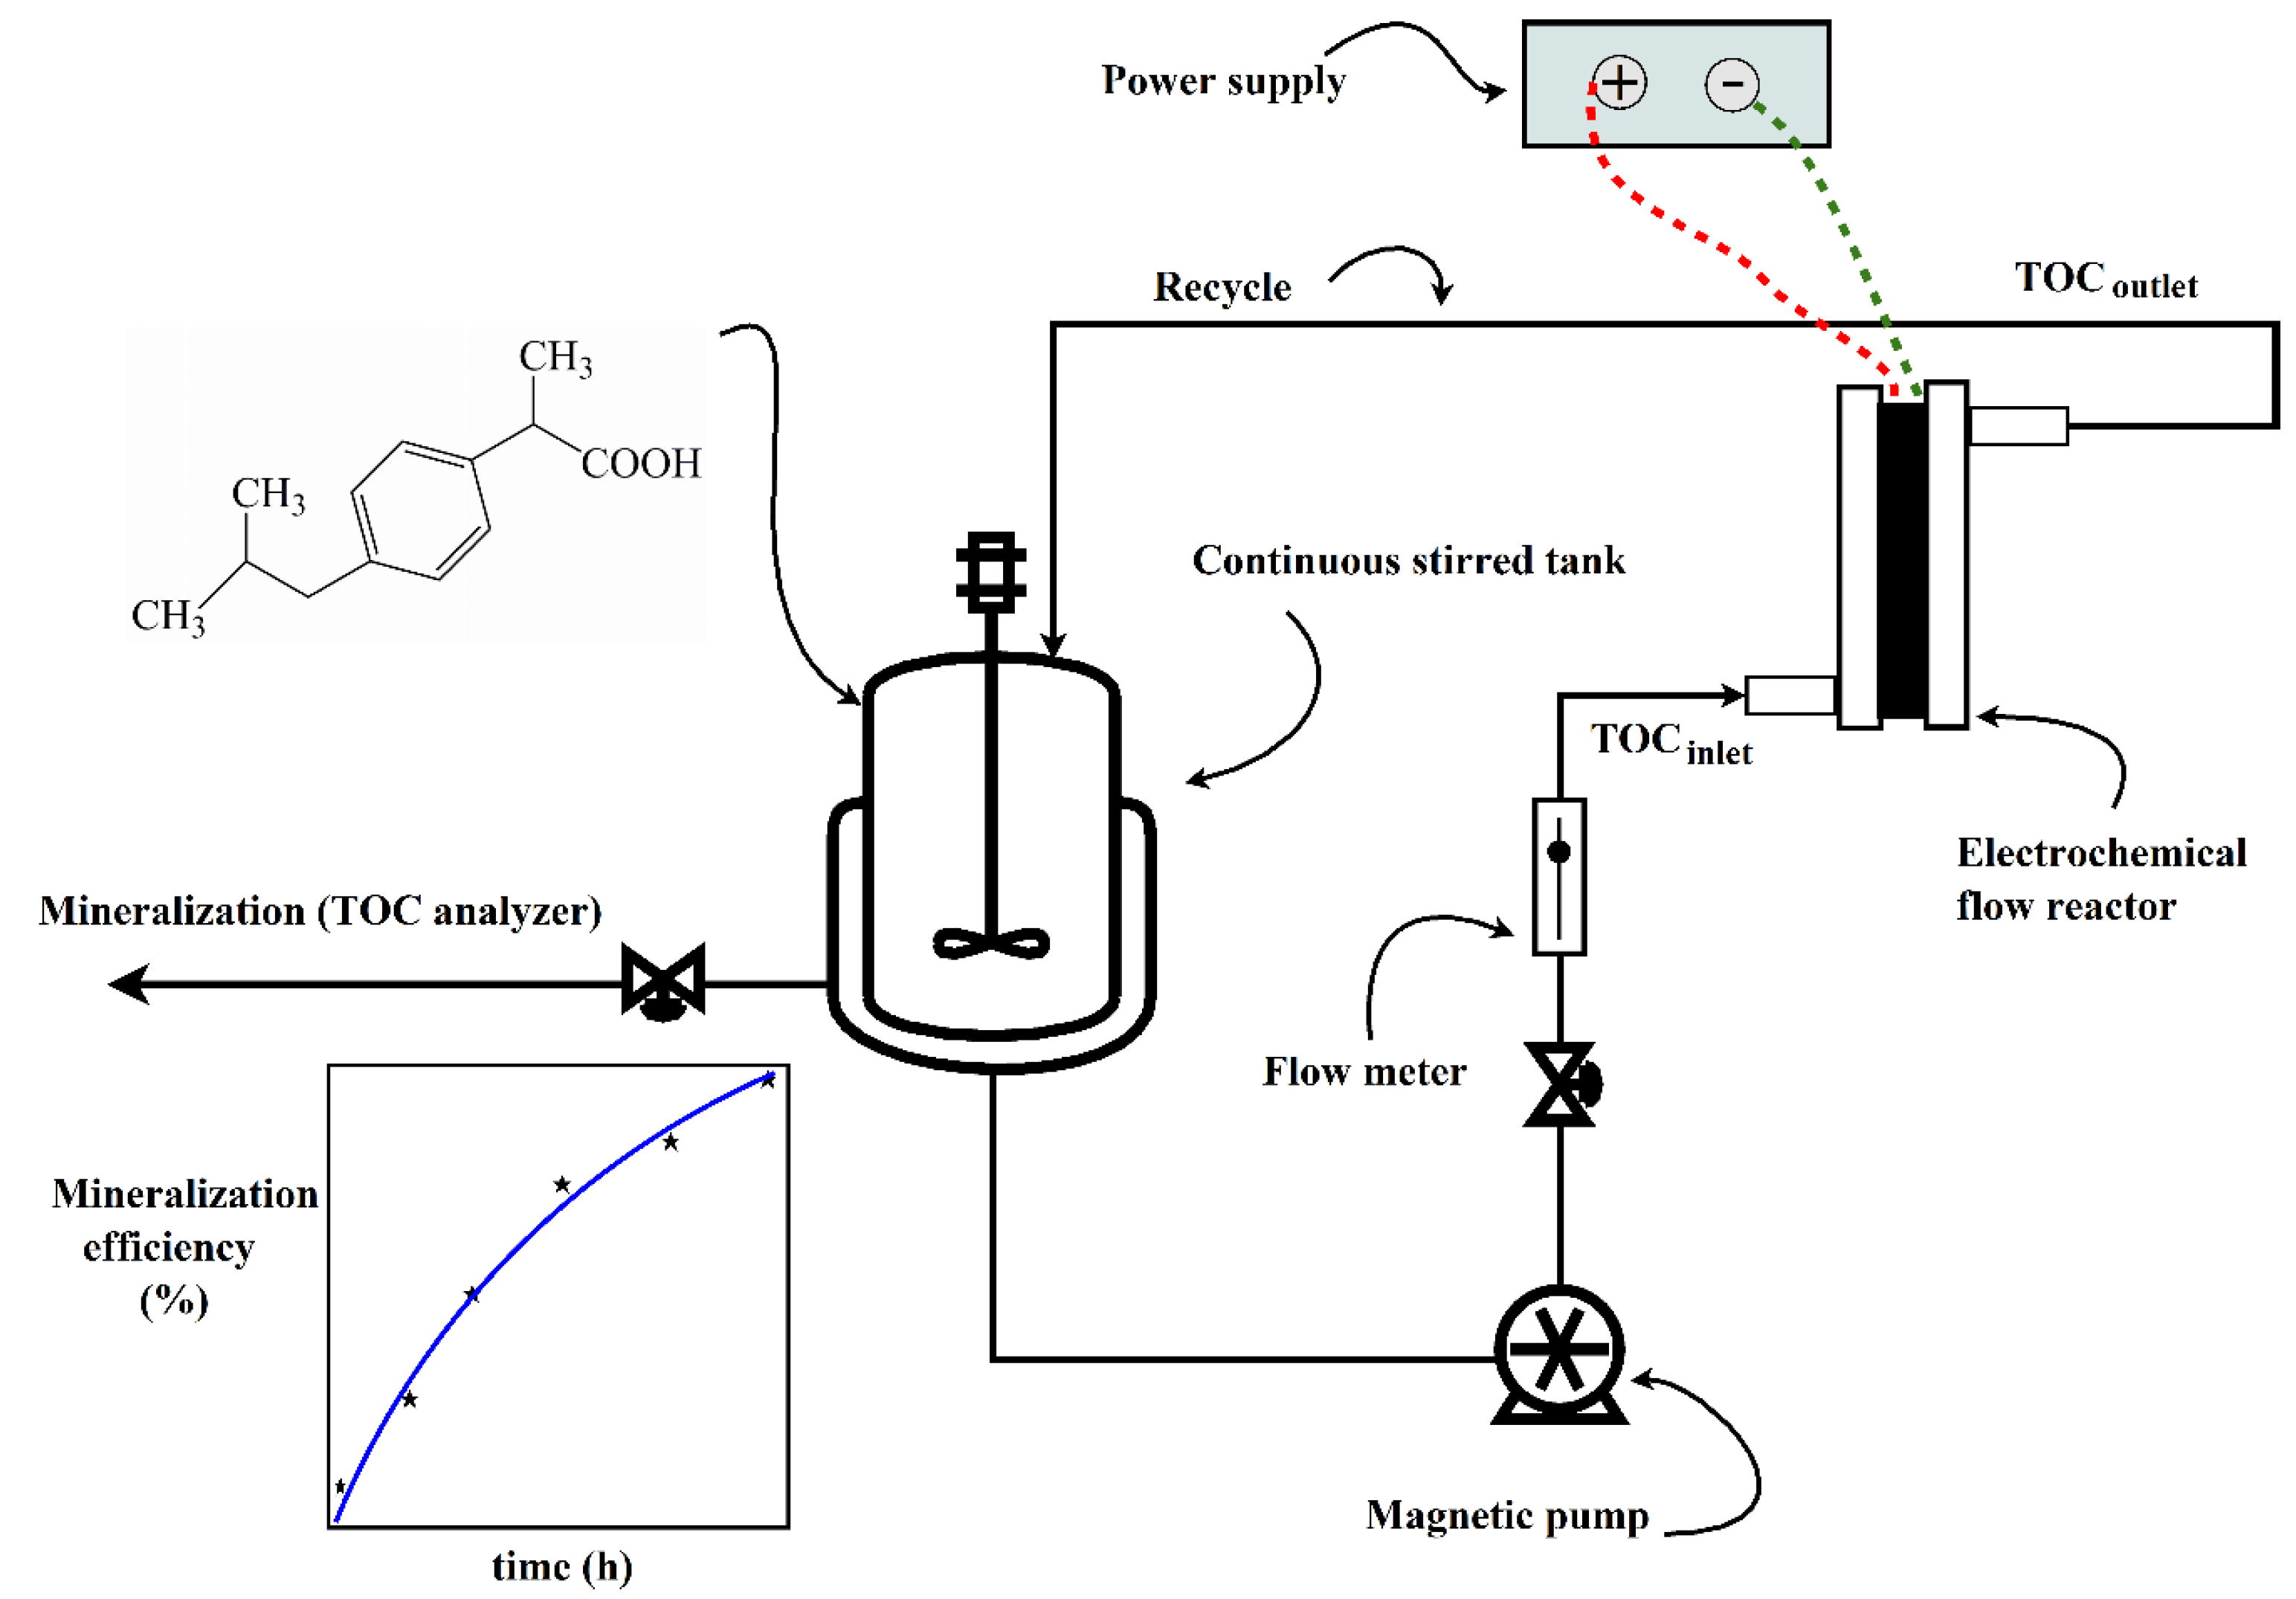
2.2. Experimental Setup
2.3. Electrochemical Mineralization of IBU
2.4. Optimization Process
2.5. Analytic Procedure
3. Results and Discussion
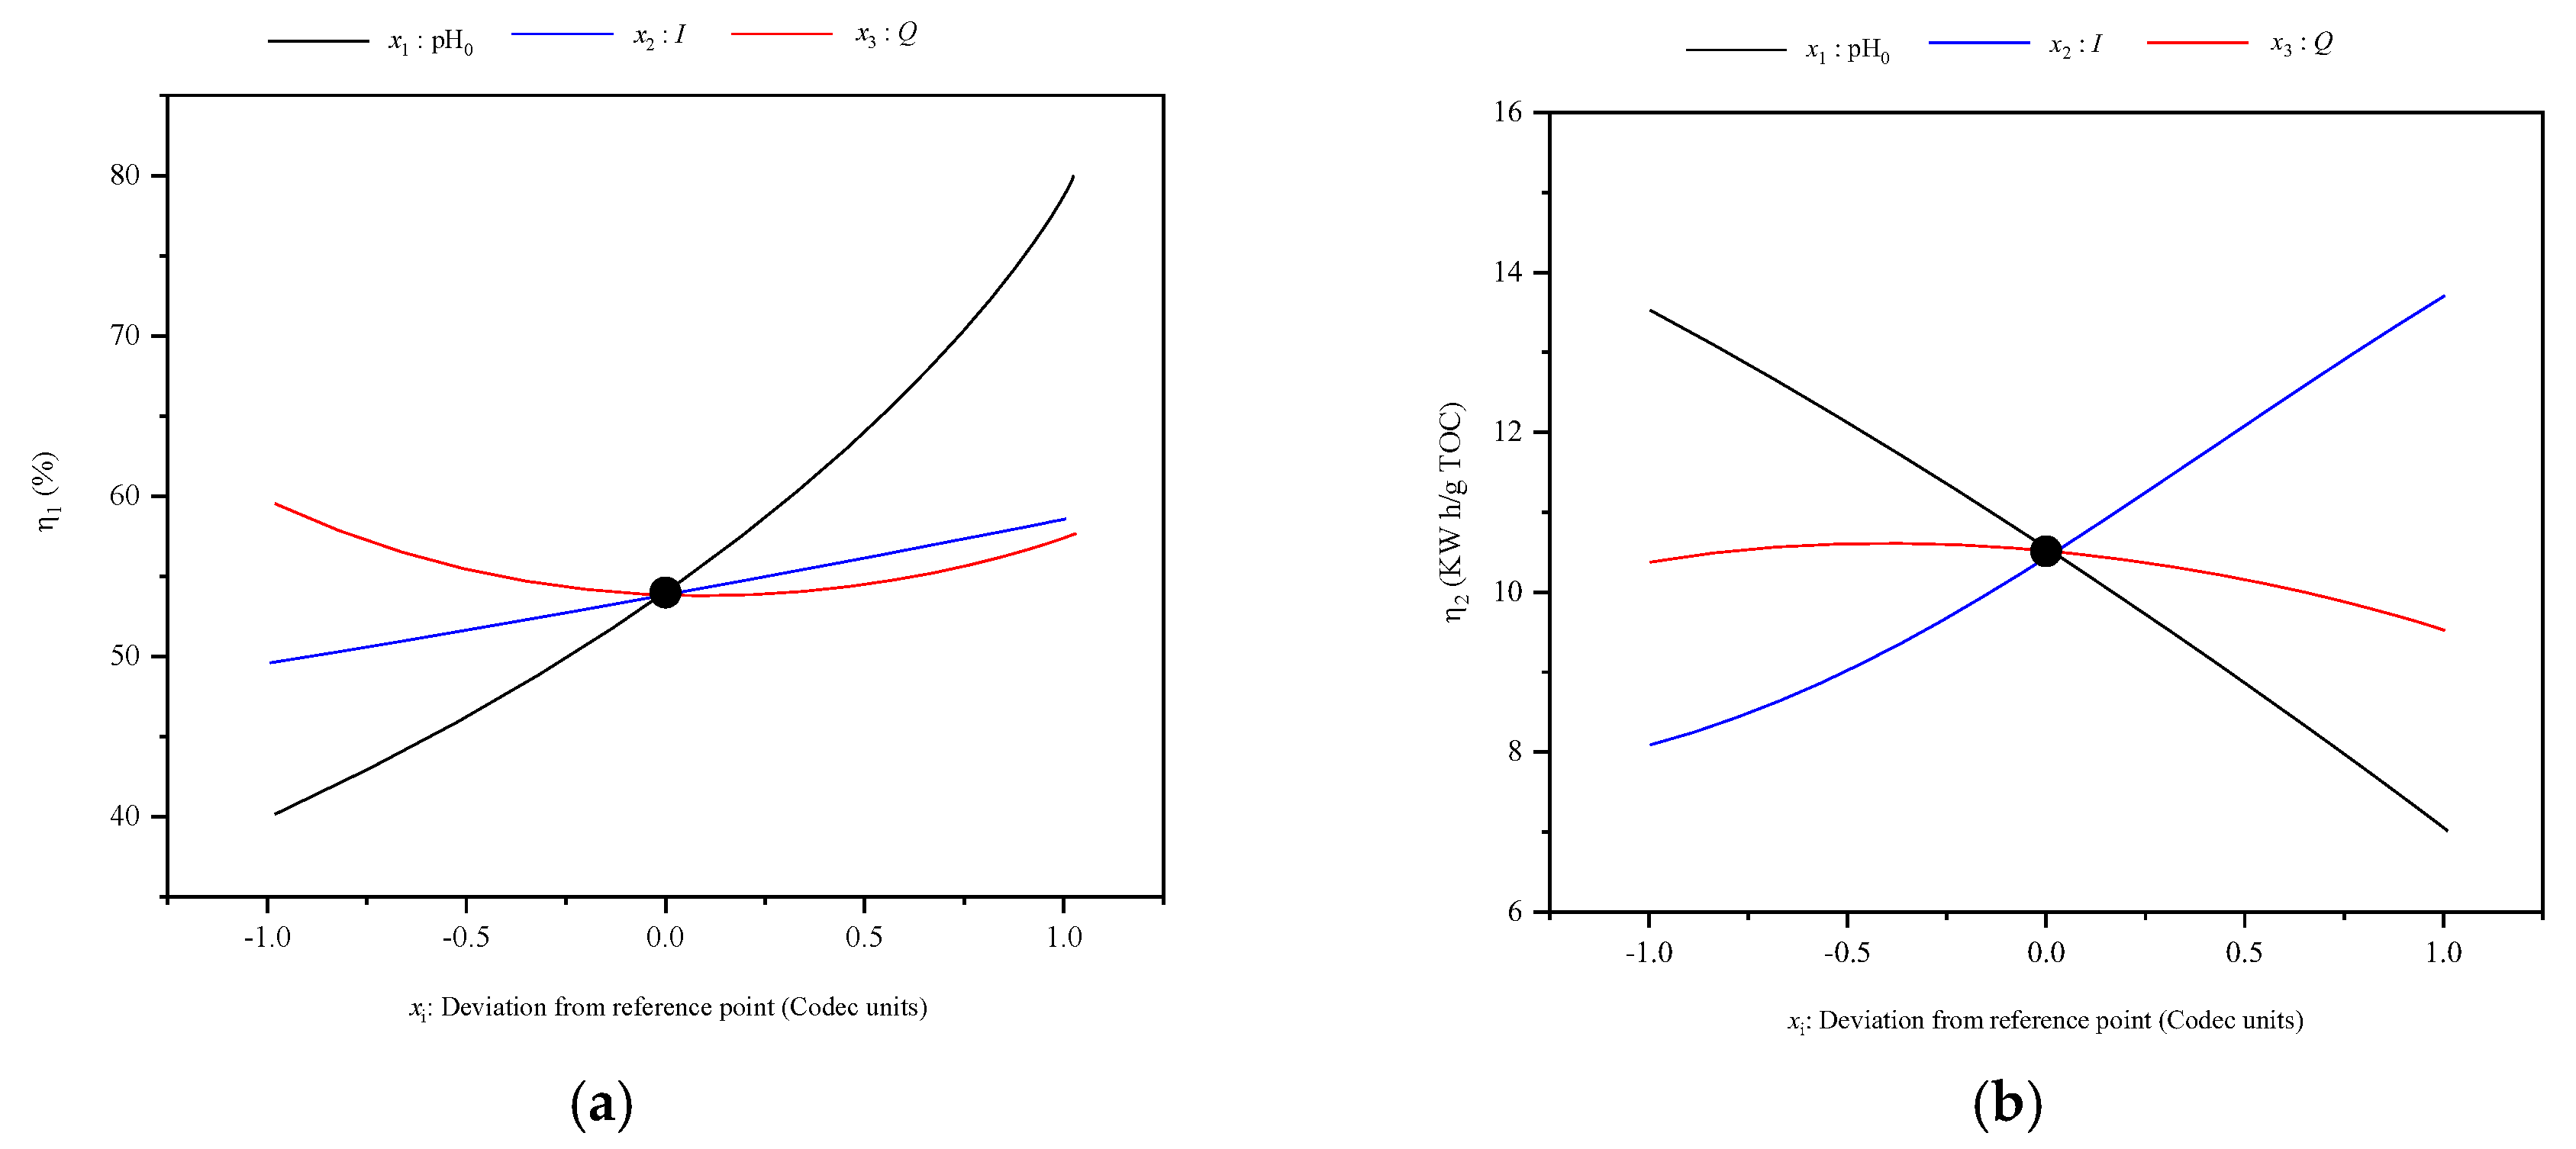
3.1. Assessment of Experimental Results with Design-Expert ®
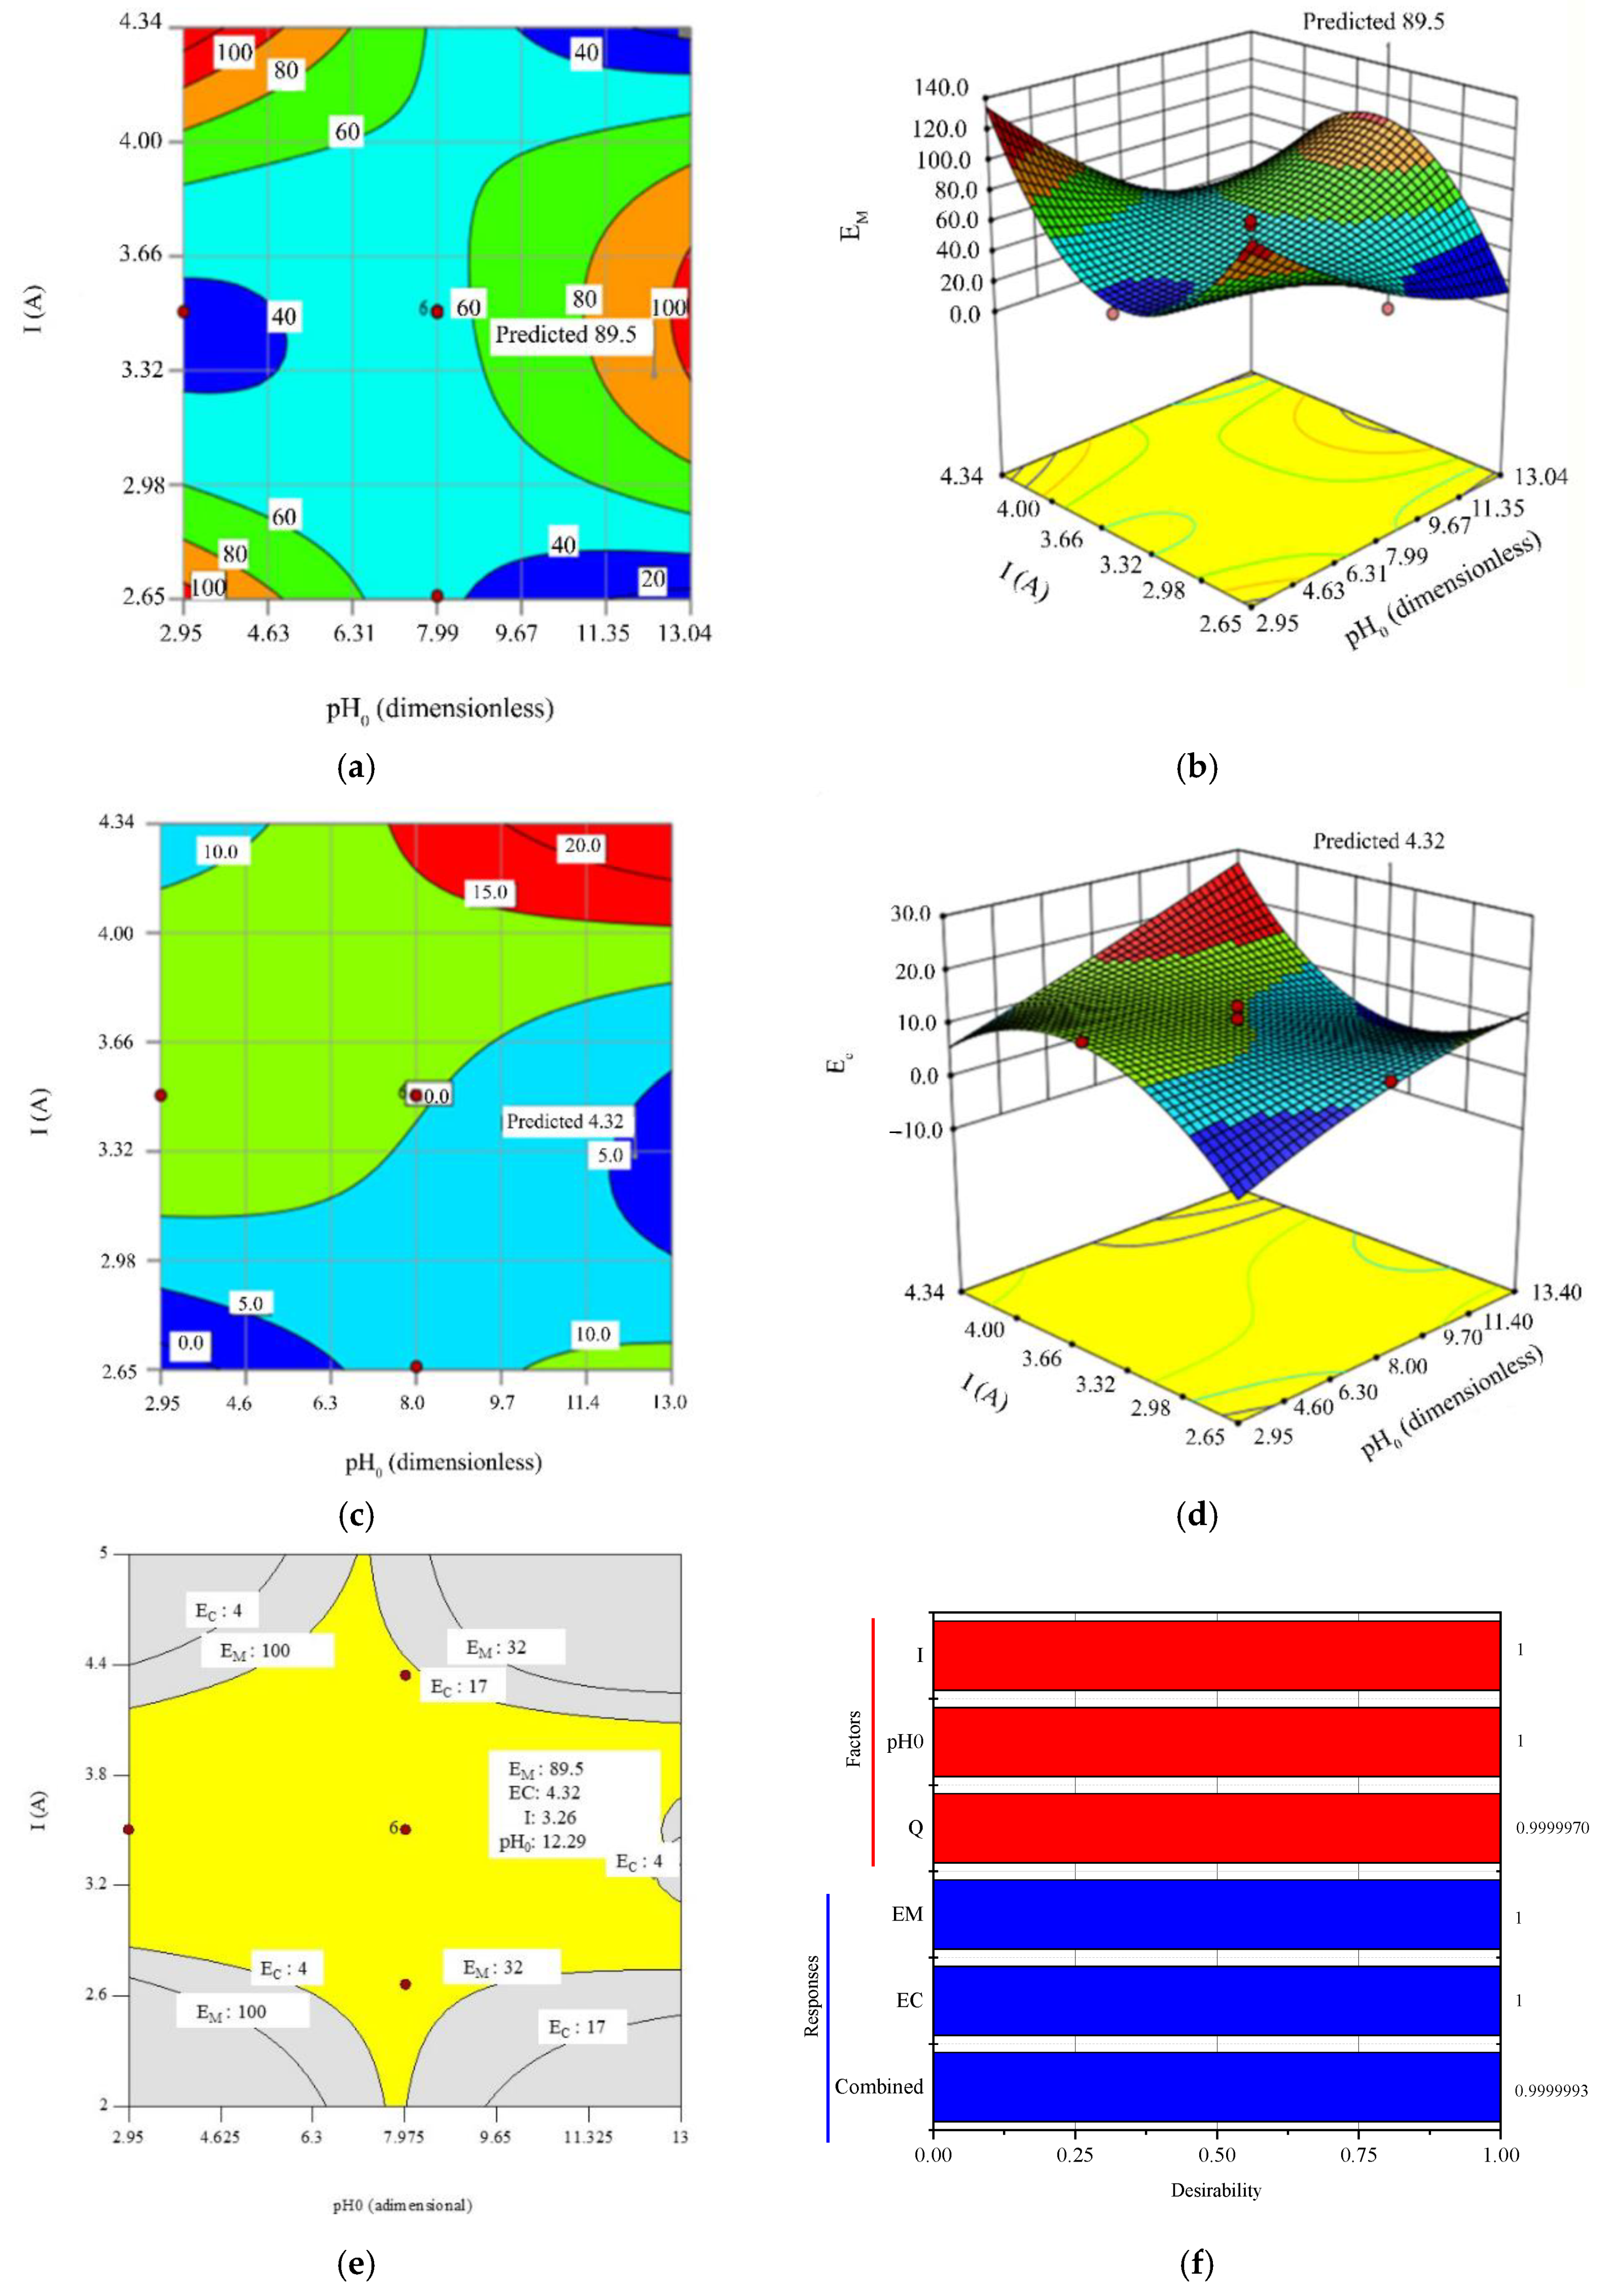
3.2. Optimization for Mineralization Efficiency and Energy Comsumption
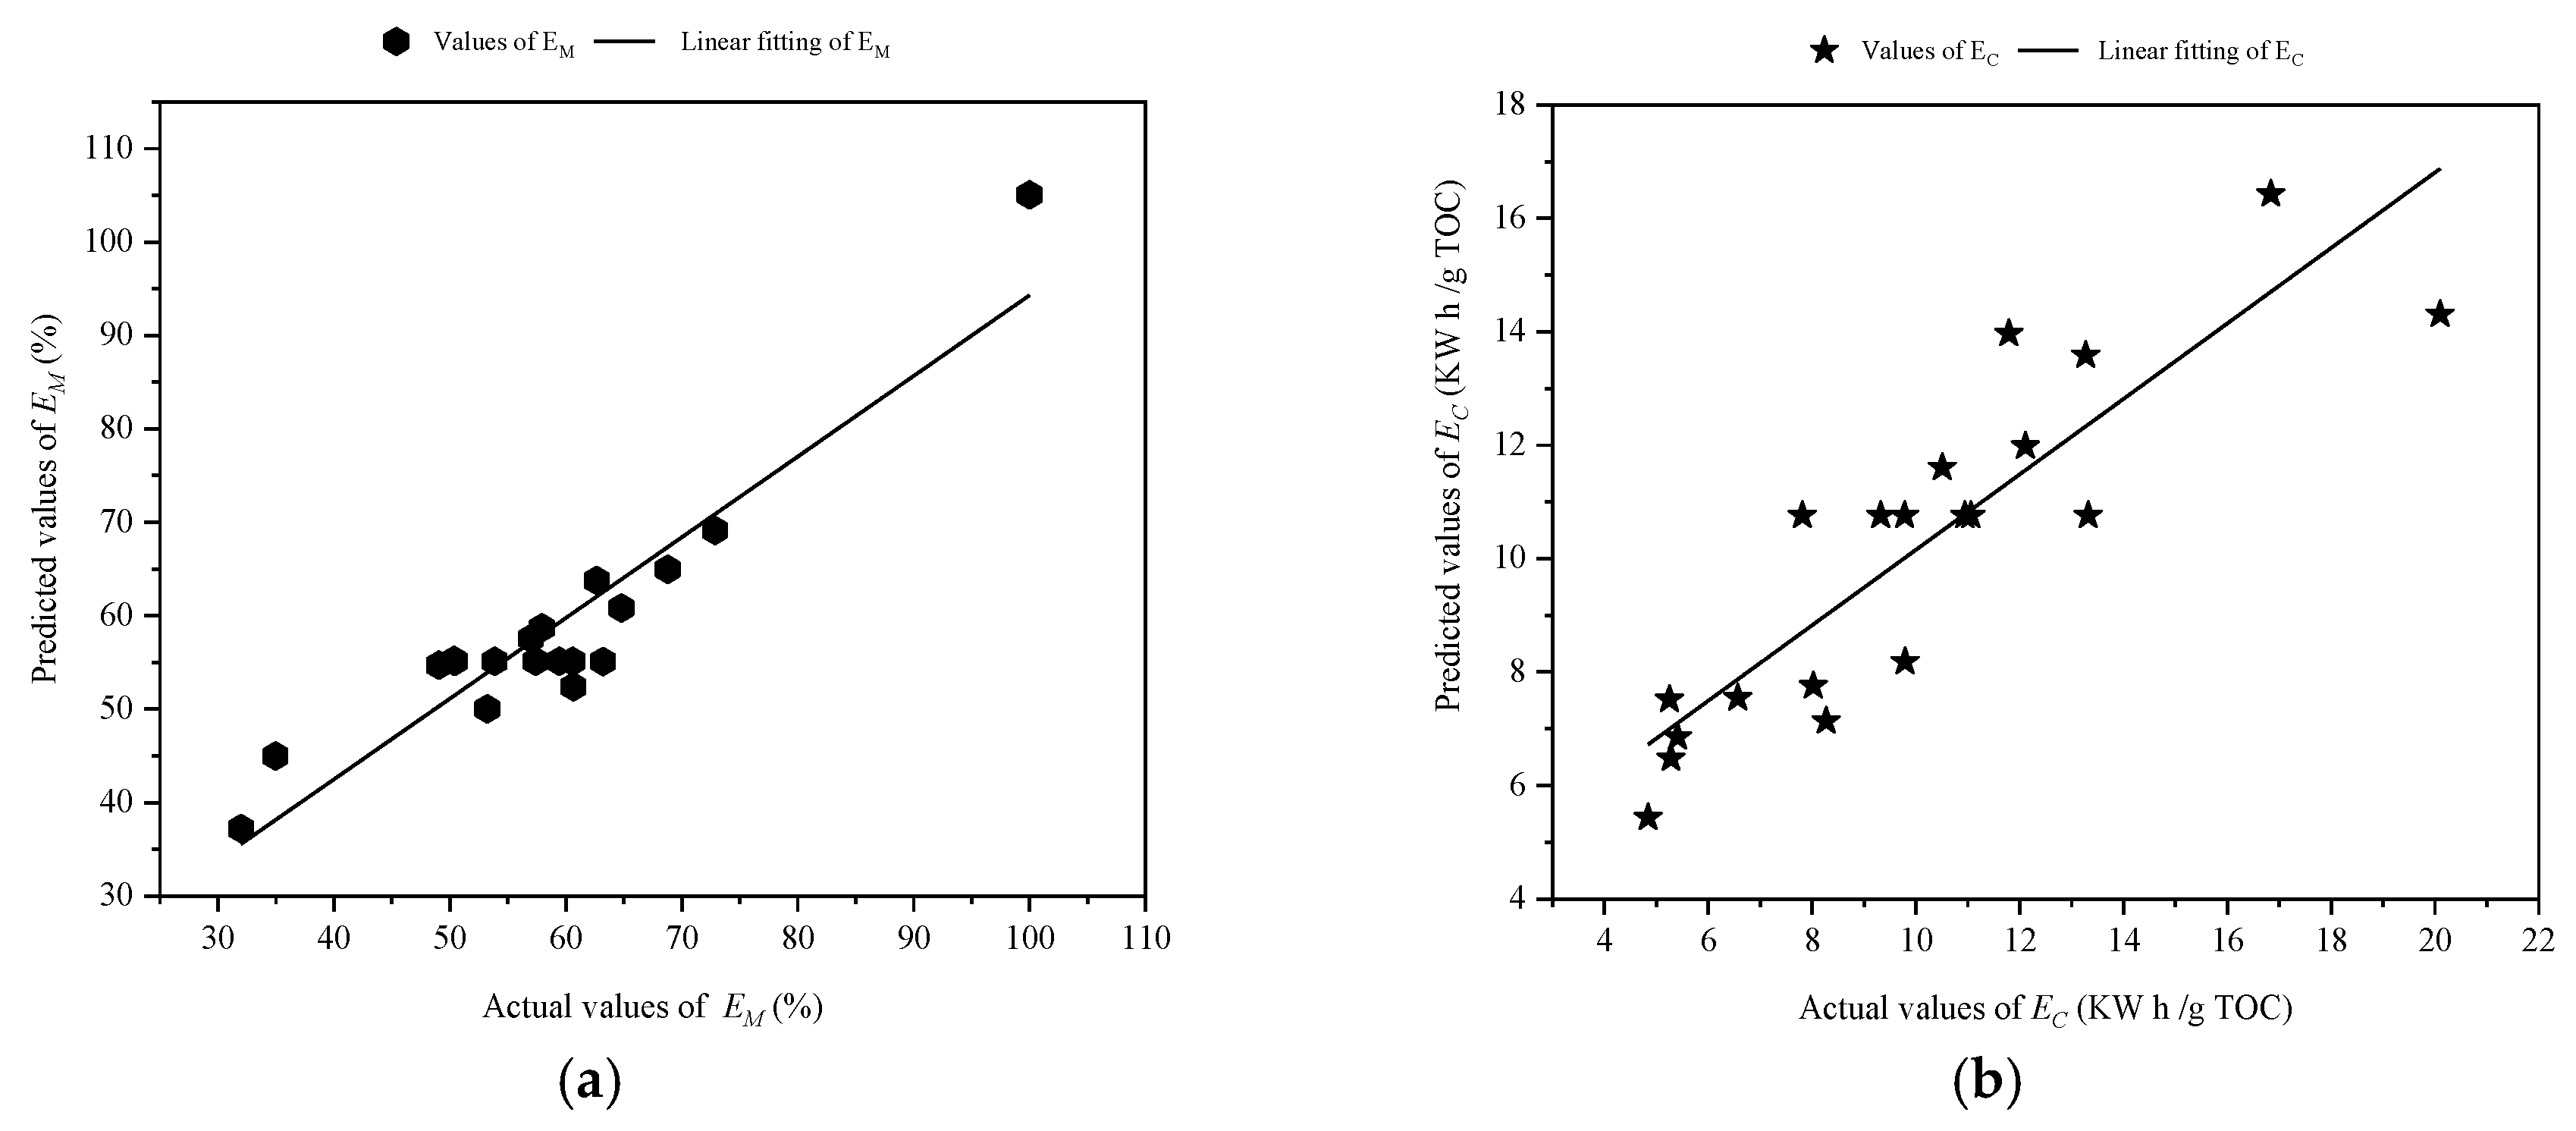
3.3. Model Validation
3.4. Kinetics of IBU Mineralization
4. Conclusions
Author Contributions
Funding
Conflicts of Interest
Nomenclature
| Symbol | Meaning |
| A | Electrode area, 32 cm2 |
| C | Concentration of ibuprofen, mg/L |
| Cost | Operation cost of the continuous electrochemical flow reactor, US$/L |
| EM | Mineralization efficiency, % |
| EC | Specific energy consumption, KW h/g of TOC |
| Ecell | Average cell potential, V |
| F | Faraday constant, 96,487 C/mol |
| I | Current intensity, A |
| J | Current density, mA/cm2 |
| Kow | Octanol–water partition coefficient, dimensionless |
| km | Medium mass transfer coefficient, m/s |
| ne | Number of electrons, 66 |
| pH | Logarithmic scale of acidity or basicity, dimensionless |
| xi | Codec operating parameters, dimensionless |
| pKa | Negative base-10 logarithm of the acid dissociation constant, mg/L |
| Q | Volumetric flow rate, L/min |
| t | Time, h |
| te | Electrolysis time, h |
| Vs | Total volume of the treated solution in batch mode, L |
| Greek letters | |
| β | Coefficients of the statistical model |
| γ | Stoichiometric coefficient, 24 |
| δ | Stoichiometric coefficient, 66 |
| ε | Error |
| η | Responses |
| λ | Wavelength of adsorbate molecule, nm |
| φ | Stoichiometric coefficient, 13 |
| Acronyms | |
| ANOVA | Analysis of variance |
| AOPs | Advanced Oxidation Processes |
| AgZMWCNT | Silver-modified zeolite–multiwalled-carbon nanotubes |
| BDD | Boron-doped diamond |
| CCR | Central composite rotatable |
| CV | Coefficient of variance |
| EC | Emergent contaminant |
| EAOPs | Electrochemical advanced oxidation processes |
| EFR | Electrochemical flow reactor |
| F | Fisher distribution |
| IBU | Ibuprofen |
| MWCNT | Multiwalled-carbon nanotubes |
| M | Electroactive site of BDD electrode where the hydroxyl radicals are formed |
| PAA | Polyacrylic acid |
| PAH | Polyallylamine hydrochloride |
| R | Organic compound to be mineralized |
| RSM | Response surface methodology |
| RMSE | Reduced root-mean-square error |
| TOC | Total organic carbon |
| TiO2 | Titanium dioxide |
| UVC | Medium pressure Hg vapor lamp |
| Xi | Operating parameters |
| ZnO | Zinc oxide |
| •OH | Hydroxyl radical |
| Subscripts | |
| Appl | Applied |
| Exp | Experimental |
| i | Variable number |
| j | Variable different to i |
| k | Operating factor |
| l | Response number, 1 or 2 |
| Lim | Limit |
| m | Variable different to i and j |
| Pred | Predicted |
| 0 | Initial |
| max | Maximum |
References
- Skoczko, I.; Ofman, P.; Szatylowicz, E. Using Artificial Neural Networks for Modeling Wastewater Treatment in Small Wastewater Treatment Plant. Annu. Set Environ. Prot. 2016, 8, 493–506. [Google Scholar]
- Daughton, C.G. Non-Regulated Water Contaminants: Emerging Research. Environ. Impact Assess. Rev. 2004, 24, 711–732. [Google Scholar] [CrossRef]
- Ambuludi, S.L.; Panizza, M.; Oturan, N.; Özcan, A.; Oturan, M.A. Kinetic Behavior of Anti-Inflammatory Drug Ibuprofen in Aqueous Medium during Its Degradation by Electrochemical Advanced Oxidation. Environ. Sci. Pollut. Res. 2013, 20, 2381–2389. [Google Scholar] [CrossRef]
- Chang, C.-F.; Chen, T.-Y.; Chin, C.-J.M.; Kuo, Y.-T. Enhanced Electrochemical Degradation of Ibuprofen in Aqueous Solution by PtRu Alloy Catalyst. Chemosphere 2017, 175, 76–84. [Google Scholar] [CrossRef]
- Comber, S.; Gardner, M.; Sörme, P.; Leverett, D.; Ellor, B. Active Pharmaceutical Ingredients Entering the Aquatic Environment from Wastewater Treatment Works: A Cause for Concern? Sci. Total Environ. 2018, 613–614, 538–547. [Google Scholar] [CrossRef]
- Phasuphan, W.; Praphairaksit, N.; Imyim, A. Removal of Ibuprofen, Diclofenac, and Naproxen from Water Using Chitosan-Modified Waste Tire Crumb Rubber. J. Mol. Liq. 2019, 294, 111554. [Google Scholar] [CrossRef]
- Marchlewicz, A.; Guzik, U.; Smułek, W.; Wojcieszyńska, D. Exploring the Degradation of Ibuprofen by Bacillus Thuringiensis B1(2015b): The New Pathway and Factors Affecting Degradation. Molecules 2017, 22, 1676. [Google Scholar] [CrossRef]
- Quero-Pastor, M.J.; Garrido-Perez, M.C.; Acevedo, A.; Quiroga, J.M. Ozonation of Ibuprofen: A Degradation and Toxicity Study. Sci. Total Environ. 2014, 466–467, 957–964. [Google Scholar] [CrossRef]
- Su, R.; Chai, L.; Tang, C.; Li, B.; Yang, Z. Comparison of the Degradation of Molecular and Ionic Ibuprofen in a UV/H2O2 System. Water Sci. Technol. 2018, 77, 2174–2183. [Google Scholar] [CrossRef]
- Méndez-Arriaga, F.; Esplugas, S.; Giménez, J. Degradation of the Emerging Contaminant Ibuprofen in Water by Photo-Fenton. Water Res. 2010, 44, 589–595. [Google Scholar] [CrossRef]
- Sahmi, A.; Omeiri, S.; Bensadok, K.; Trari, M. Electrochemical Properties of the Scheelite BaWO4 Prepared by Co-Precipitation: Application to Electro-Photocatalysis of Ibuprofen Degradation. Mater. Sci. Semicond. Process. 2019, 91, 108–114. [Google Scholar] [CrossRef]
- Ciríaco, L.; Anjo, C.; Correia, J.; Pacheco, M.J.; Lopes, A. Electrochemical Degradation of Ibuprofen on Ti/Pt/PbO2 and Si/BDD Electrodes. Electrochim. Acta 2009, 54, 1464–1472. [Google Scholar] [CrossRef]
- Motoc, S.; Remes, A.; Pop, A.; Manea, F.; Schoonman, J. Electrochemical Detection and Degradation of Ibuprofen from Water on Multi-Walled Carbon Nanotubes-Epoxy Composite Electrode. J. Environ. Sci. 2013, 25, 838–847. [Google Scholar] [CrossRef]
- Thokchom, B.; Kim, K.; Park, J.; Khim, J. Ultrasonically Enhanced Electrochemical Oxidation of Ibuprofen. Ultrason. Sonochem. 2015, 22, 429–436. [Google Scholar] [CrossRef] [PubMed]
- Van Hege, K.; Verhaege, M.; Verstraete, W. Electro-Oxidative Abatement of Low-Salinity Reverse Osmosis Membrane Concentrates. Water Res. 2004, 38, 1550–1558. [Google Scholar] [CrossRef] [PubMed]
- Zhou, M.; Liu, L.; Jiao, Y.; Wang, Q.; Tan, Q. Treatment of High-Salinity Reverse Osmosis Concentrate by Electrochemical Oxidation on BDD and DSA Electrodes. Desalination 2011, 277, 201–206. [Google Scholar] [CrossRef]
- Garcia-Segura, S.; Keller, J.; Brillas, E.; Radjenovic, J. Removal of Organic Contaminants from Secondary Effluent by Anodic Oxidation with a Boron-Doped Diamond Anode as Tertiary Treatment. J. Hazard. Mater. 2015, 283, 551–557. [Google Scholar] [CrossRef]
- Abolhasani, S.; Ahmadpour, A.; Rohani Bastami, T.; Yaqubzadeh, A. Facile Synthesis of Mesoporous Carbon Aerogel for the Removal of Ibuprofen from Aqueous Solution by Central Composite Experimental Design (CCD). J. Mol. Liq. 2019, 281, 261–268. [Google Scholar] [CrossRef]
- Vebber, M.C.; da Silva Crespo, J.; Giovanela, M. Self-Assembled Thin Films of PAA/PAH/TiO2 for the Photooxidation of Ibuprofen. Part I: Optimization of Photoactivity Using Design of Experiments and Surface Response Methodology. Chem. Eng. J. 2019, 360, 1447–1458. [Google Scholar] [CrossRef]
- Rastkari, N.; Eslami, A.; Nasseri, S.; Piroti, E.; Asadi, A. Optimizing Parameters on Nanophotocatalytic Degradation of Ibuprofen Using UVC/ZnO Processes by Response Surface Methodology. Polish J. Environ. Stud. 2017, 26, 785–794. [Google Scholar] [CrossRef]
- Mohammadi, H.; Bina, B.; Ebrahimi, A. A Novel Three-Dimensional Electro-Fenton System and Its Application for Degradation of Anti-Inflammatory Pharmaceuticals: Modeling and Degradation Pathways. Process Saf. Environ. Prot. 2018, 117, 200–213. [Google Scholar] [CrossRef]
- Tran, N.; Drogui, P.; Nguyen, L.; Brar, S.K. Optimization of Sono-Electrochemical Oxidation of Ibuprofen in Wastewater. J. Environ. Chem. Eng. 2015, 3 Pt A, 2637–2646. [Google Scholar] [CrossRef]
- Das, S.K.; Kahali, N.; Bose, A.; Khanam, J. Physicochemical Characterization and in Vitro Dissolution Performance of Ibuprofen-Captisol® (Sulfobutylether Sodium Salt of β-CD) Inclusion Complexes. J. Mol. Liq. 2018, 261, 239–249. [Google Scholar] [CrossRef]
- Fröhlich, A.C.; Ocampo-Pérez, R.; Diaz-Blancas, V.; Salau, N.P.G.; Dotto, G.L. Three-Dimensional Mass Transfer Modeling of Ibuprofen Adsorption on Activated Carbon Prepared by Sonication. Chem. Eng. J. 2018, 341, 65–74. [Google Scholar] [CrossRef]
- Regalado-Méndez, A.; Mentado-Morales, J.; Vázquez, C.E.; Martínez-Villa, G.; Cordero, M.E.; Zárate, L.G.; Skogestad, S.; Peralta-Reyes, E. Modeling and Hydraulic Characterization of a Filter-Press-Type Electrochemical Reactor by Using Residence Time Distribution Analysis and Hydraulic Indices. Int. J. Chem. React. Eng. 2018, 16, 1–15. [Google Scholar] [CrossRef]
- Zhang, C.; Yang, L.; Rong, F.; Fu, D.; Gu, Z. Boron-Doped Diamond Anodic Oxidation of Ethidium Bromide: Process Optimization by Response Surface Methodology. Electrochim. Acta 2012, 64, 100–109. [Google Scholar] [CrossRef]
- Wei, J.; Zhu, X.; Ni, J. Electrochemical Oxidation of Phenol at Boron-Doped Diamond Electrode in Pulse Current Mode. Electrochim. Acta 2011, 56, 5310–5315. [Google Scholar] [CrossRef]
- Yahiaoui, I.; Aissani-Benissad, F.; Fourcade, F.; Amrane, A. Response Surface Methodology for the Optimization of the Electrochemical Degradation of Phenol on Pb/Pbo2 Electrode. Environ. Prog. Sustain. Energy 2012, 31, 515–523. [Google Scholar] [CrossRef]
- Zhou, M.; Särkkä, H.; Sillanpää, M. A Comparative Experimental Study on Methyl Orange Degradation by Electrochemical Oxidation on BDD and MMO Electrodes. Sep. Purif. Technol. 2011, 78, 290–297. [Google Scholar] [CrossRef]
- Maldonado, S.; Rodrigo, M.; Cañizares, P.; Roa, G.; Barrera, C.; Ramirez, J.; Sáez, C. On the Degradation of 17-β Estradiol Using Boron Doped Diamond Electrodes. Processes 2020, 8, 710. [Google Scholar] [CrossRef]
- Viana, D.F.; Salazar-Banda, G.R.; Leite, M.S. Electrochemical Degradation of Reactive Black 5 with Surface Response and Artificial Neural Networks Optimization Models. Sep. Sci. Technol. 2018, 53, 2647–2661. [Google Scholar] [CrossRef]
- Brillas, E.; Sirés, I.; Oturan, M.A. Electro-Fenton Process and Related Electrochemical Technologies Based on Fenton’s Reaction Chemistry. Chem. Rev. 2009, 109, 6570–6631. [Google Scholar] [CrossRef]
- Barrera-Díaz, C.E.; Frontana-Uribe, B.A.; Rodríguez-Peña, M.; Gomez-Palma, J.C.; Bilyeu, B. Integrated Advanced Oxidation Process, Ozonation-Electrodegradation Treatments, for Nonylphenol Removal in Batch and Continuous Reactor. Catal. Today 2018, 305, 108–116. [Google Scholar] [CrossRef]
- Rheem, S.; Rheem, I.; Oh, S. Response Surface Methodology Using a Fullest Balanced Model: A Re-Analysis of a Dataset in the Korean Journal for Food Science of Animal Resources. Korean J. Food Sci. Anim. Resour. 2017, 37, 139–146. [Google Scholar] [CrossRef] [Green Version]
- Muhamad, M.H.; Abdullah, S.R.S.; Mohamad, A.B.; Abdul Rahman, R.; Hasan Kadhum, A.A. Application of Response Surface Methodology (RSM) for Optimisation of COD, NH3–N and 2,4-DCP Removal from Recycled Paper Wastewater in a Pilot-Scale Granular Activated Carbon Sequencing Batch Biofilm Reactor (GAC-SBBR). J. Environ. Manag. 2013, 121, 179–190. [Google Scholar] [CrossRef]
- Aziz, S.Q.; Aziz, H.A.; Yusoff, M.S.; Bashir, M.J.K. Landfill Leachate Treatment Using Powdered Activated Carbon Augmented Sequencing Batch Reactor (SBR) Process: Optimization by Response Surface Methodology. J. Hazard. Mater. 2011, 189, 404–413. [Google Scholar] [CrossRef]
- Regalado-Méndez, A.; Báez-González, J.G.; Peralta-Reyes, E.; Trujillo-Tapia, M.N. Problem Based Learning: Obtaining Enzyme Kinetics Parameters Integrating Linear Algebra, Computer Programming and Biochemistry Curriculum. In Technological Developments in Networking, Education and Automation; Springer Science and Business Media LLC: Philadelphia, PA, USA, 2010. [Google Scholar] [CrossRef]
- Sivarajasekar, N.; Mohanraj, N.; Sivamani, S.; Prakash Maran, J.; Moorthy, I.G.; Balasubramani, K. Statistical Optimization Studies on Adsorption of Ibuprofen onto Albizialebbeck Seed Pods Activated Carbon Prepared Using Microwave Irradiation. Mater. Today Proc. 2018, 5 Pt 2, 7264–7274. [Google Scholar] [CrossRef]
- Hazime, R.; Nguyen, Q.H.; Ferronato, C.; Huynh, T.K.X.; Jaber, F.; Chovelon, J.-M. Optimization of Imazalil Removal in the System UV/TiO2/K2S2O8 Using a Response Surface Methodology (RSM). Appl. Catal. B Environ. 2013, 132–133, 519–526. [Google Scholar] [CrossRef]
- Wu, F.-C. Optimization of Correlated Multiple Quality Characteristics Using Desirability Function. Qual. Eng. 2004, 17, 119–126. [Google Scholar] [CrossRef]
- Amdoun, R.; Khelifi, L.; Khelifi-Slaoui, M.; Amroune, S.; Asch, M.; Assaf-Ducrocq, C.; Gontier, E. The Desirability Optimization Methodology; a Tool to Predict Two Antagonist Responses in Biotechnological Systems: Case of Biomass Growth and Hyoscyamine Content in Elicited Datura Starmonium Hairy Roots. Iran. J. Biotechnol. 2018, 16, e1339. [Google Scholar] [CrossRef] [Green Version]
- Wang, C.; Yu, Y.; Yin, L.; Niu, J.; Hou, L.-A. Insights of Ibuprofen Electro-Oxidation on Metal-Oxide-Coated Ti Anodes: Kinetics, Energy Consumption and Reaction Mechanisms. Chemosphere 2016, 163, 584–591. [Google Scholar] [CrossRef] [PubMed]
- Amado-Piña, D.; Roa-Morales, G.; Barrera-Díaz, C.; Balderas-Hernandez, P.; Romero, R.; Martín del Campo, E.; Natividad, R. Synergic Effect of Ozonation and Electrochemical Methods on Oxidation and Toxicity Reduction: Phenol Degradation. Fuel 2017, 198, 82–90. [Google Scholar] [CrossRef]


| Method | Volume Treated (mL) | Removal Efficiency (%) | Reference |
|---|---|---|---|
| Physicochemical | 100 | 50 | [6] |
| Biological | 130 | 83.3 | [7] |
| Ozonation | 200 | 99.0 | [8] |
| Ultraviolet/H2O2 | 450 | 98.8 | [9] |
| Photo-Fenton | 80 | 40 | [10] |
| Property | Value | Molecule of Ibuprofen |
|---|---|---|
| Molar weight (g/mol) | 206.29 | 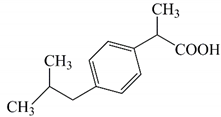 |
| Melting point (°C) | 70–78 | |
| pKa (water at 20 °C) | 4.91 | |
| Log (Kow) | 3.5 | |
| Water solubility (g/L) at 25 °C | 0.049 | |
| Constant of Henry’s law (atm/m3 mol) | 1.5 × 10⁻⁷ | |
| λmax (nm) | 221 | Chemical formula: C13H18O2 |
| Operating Factors | Levels | ||||
|---|---|---|---|---|---|
| −α | −1 | 0 | +1 | +α | |
| X1: pH0 | 2.95 | 5.0 | 8.0 | 11.0 | 13.04 |
| X2: I (A) | 2.66 | 3.0 | 3.5 | 4.0 | 4.34 |
| X3: Q (L/min) | 0.16 | 0.5 | 1.0 | 1.5 | 1.84 |
| Run | Authentic Values of Parameters | Coded Values of Parameters | Responses (η) | |||||
|---|---|---|---|---|---|---|---|---|
| X1 | X2 | X3 | x1 | x2 | x3 | EM (%) | EC (KW h/g TOC) | |
| 1 | 5.0 | 3.0 | 0.5 | −1 | −1 | −1 | 60.67 | 5.25 |
| 2 | 11.0 | 3.0 | 0.5 | +1 | −1 | −1 | 68.80 | 5.41 |
| 3 | 5.0 | 4.0 | 0.5 | −1 | +1 | −1 | 57.94 | 12.11 |
| 4 | 11.0 | 4.0 | 0.5 | +1 | +1 | −1 | 64.79 | 11.79 |
| 5 | 5.0 | 3.0 | 1.5 | −1 | −1 | +1 | 53.22 | 8.27 |
| 6 | 11.0 | 3.0 | 1.5 | +1 | −1 | +1 | 63.22 | 5.28 |
| 7 | 5.0 | 4.0 | 1.5 | −1 | +1 | +1 | 72.86 | 10.51 |
| 8 | 11.0 | 4.0 | 1.5 | +1 | +1 | +1 | 62.66 | 13.27 |
| 9 | 2.95 | 3.5 | 1.0 | −α | 0 | 0 | 32.00 | 20.10 |
| 10 | 13.04 | 3.5 | 1.0 | +α | 0 | 0 | 100.00 | 4.84 |
| 11 | 8.0 | 2.66 | 1.0 | 0 | −α | 0 | 34.97 | 8.02 |
| 12 | 8.0 | 4.34 | 1.0 | 0 | +α | 0 | 57.00 | 16.84 |
| 13 | 8.0 | 3.5 | 0.16 | 0 | 0 | −α | 49.06 | 9.79 |
| 14 | 8.0 | 3.5 | 1.84 | 0 | 0 | +α | 50.36 | 6.57 |
| 15 | 8.0 | 3.5 | 1.0 | 0 | 0 | 0 | 50.45 | 11.06 |
| 16 | 8.0 | 3.5 | 1.0 | 0 | 0 | 0 | 59.45 | 9.78 |
| 17 | 8.0 | 3.5 | 1.0 | 0 | 0 | 0 | 50.36 | 13.32 |
| 18 | 8.0 | 3.5 | 1.0 | 0 | 0 | 0 | 57.40 | 7.81 |
| 19 | 8.0 | 3.5 | 1.0 | 0 | 0 | 0 | 53.87 | 10.94 |
| 20 | 8.0 | 3.5 | 1.0 | 0 | 0 | 0 | 60.59 | 9.32 |
| Source | Sum of Squares | Degree of Freedom | Mean Square | F-Value | Prob > F | Remark |
|---|---|---|---|---|---|---|
| Mineralization efficiency (EM), η1 (%) | ||||||
| Model | 312.03 | 10 | 321.20 | 5.81 | 0.0071 | significant |
| 2312 | 1 | 2312.00 | 41.83 | 0.0001 | ||
| 180.07 | 1 | 180.07 | 3.26 | 0.1046 | ||
| 0.34 | 1 | 0.34 | 0.00 | 0.9394 | ||
| 56.60 | 1 | 56.60 | 1.02 | 0.3379 | ||
| 28.05 | 1 | 28.04 | 0.51 | 0.4900 | ||
| 82.04 | 1 | 82.05 | 1.48 | 0.2541 | ||
| 468.62 | 1 | 468.62 | 8.48 | 0.0173 | ||
| 27.20 | 1 | 27.20 | 0.49 | 0.5007 | ||
| 0.05 | 1 | 0.05 | 0.00 | 0.9742 | ||
| 1121.16 | 1 | 1121.16 | 20.28 | 0.0015 | ||
| Residual | 497.45 | 9 | 55.27 | |||
| Lack-of-fit | 397.88 | 4 | 99.47 | 4.99 | 0.5370 | not significant |
| Pure error | 99.57 | 5 | 19.91 | |||
| Total | 3709.48 | 19 | ||||
| Energy consumption (EC), η2 (KW h/g TOC) | ||||||
| Model | 185.59 | 9 | 20.62 | 6.14 | 0.0044 | significant |
| 51.61 | 1 | 51.61 | 15.38 | 0.0029 | ||
| 39,07 | 1 | 39.07 | 11.64 | 0.0066 | ||
| 0.51 | 1 | 0.51 | 0.15 | 0.7052 | ||
| 3.46 | 1 | 3.46 | 1.03 | 0.3340 | ||
| 2.43 | 1 | 2.43 | 0.72 | 0.4148 | ||
| 3.33 | 1 | 3.33 | 0.99 | 0.3429 | ||
| 15.16 | 1 | 15.16 | 4.52 | 0.0595 | ||
| 0.31 | 1 | 0.31 | 0.09 | 0.7667 | ||
| 29.29 | 1 | 29.29 | 8.73 | 0.0144 | ||
| Residual | 33.56 | 10 | 3.36 | |||
| Lack-of-fit | 16.12 | 10 | 3.22 | 0.92 | 0.5334 | not significant |
| Pure error | 17.44 | 5 | 3.49 | |||
| Total | 219.16 | 19 | ||||
| Limits | |||||
|---|---|---|---|---|---|
| Response | Objective | Min | Max | Unit | Importance |
| pH0 | Is in range | 2.95 | 13.040 | dimensionless | +++ |
| I | Is in range | 2.65 | 4.334 | A | +++ |
| Q | Set at 1 | 0.50 | 1.840 | L/min | ++ |
| EM | Maximize | 32.00 | 100.000 | % | +++ |
| EC | Minimize | 4.84 | 16.860 | KW h/g TOC | +++ |
| Operating Environments | Main Results | Reference | |||||
|---|---|---|---|---|---|---|---|
| Optimal | Best | ET | V (L) | TOC (%) | EC (kW h/L) | Cost (US$/L) | |
| 40 mg/L, pH of 12.29, I of 3.26 A, Q of 1 L/min and te of 7 h, flow reactor and batch recirculation mode | --- | BDD | 2.50 | 91.6 | 0.012 | 0.002 | This work |
| --- | 20 mg/L, pH of 6.0, J of 10 mA/cm2, te of 1 h, batch reactor | 1 | 0.03 | 93.2 | 0.013 | --- | [42] |
| --- | 20 mg/L, pH of 3.0, J of 500 mA/cm2, te of 8 h, batch reactor | BDD | 0.20 | 96.0 | --- | --- | [3] |
| --- | 361 mg/L, J of 30 mA/cm2, te of 6 h, batch reactor | 2 | 0.20 | 87.0 | --- | --- | [12] |
| --- | 2 mg/L, I of 2.3 mA, te of 2 h, batch reactor | 3 | 0.7 | 67.2 | --- | --- | [13] |
| 10 mg/L, pH of 6.6, I of 5 A, te of 2 h, Q of 0.1 L/min, batch reactor coupled with ultrasonication and batch recirculation mode | --- | 4 | 3.0 | 84.0 | 0.057 | 0.003 | [22] |
| --- | 50 mg/L, J of 50 mA/cm2, T of 298 K, te of 2 h, batch reactor | PtRu | 0.1 | 82.0 | --- | --- | [4] |
Publisher’s Note: MDPI stays neutral with regard to jurisdictional claims in published maps and institutional affiliations. |
© 2020 by the authors. Licensee MDPI, Basel, Switzerland. This article is an open access article distributed under the terms and conditions of the Creative Commons Attribution (CC BY) license (http://creativecommons.org/licenses/by/4.0/).
Share and Cite
Regalado-Méndez, A.; Ruiz, M.; Hernández-Servín, J.A.; Natividad, R.; Romero, R.; Cordero, M.E.; Estrada-Vázquez, C.; Peralta-Reyes, E. Electrochemical Mineralization of Ibuprofen on BDD Electrodes in an Electrochemical Flow Reactor: Numerical Optimization Approach. Processes 2020, 8, 1666. https://doi.org/10.3390/pr8121666
Regalado-Méndez A, Ruiz M, Hernández-Servín JA, Natividad R, Romero R, Cordero ME, Estrada-Vázquez C, Peralta-Reyes E. Electrochemical Mineralization of Ibuprofen on BDD Electrodes in an Electrochemical Flow Reactor: Numerical Optimization Approach. Processes. 2020; 8(12):1666. https://doi.org/10.3390/pr8121666
Chicago/Turabian StyleRegalado-Méndez, Alejandro, Martín Ruiz, José A. Hernández-Servín, Reyna Natividad, Rubi Romero, Mario E. Cordero, Carlos Estrada-Vázquez, and Ever Peralta-Reyes. 2020. "Electrochemical Mineralization of Ibuprofen on BDD Electrodes in an Electrochemical Flow Reactor: Numerical Optimization Approach" Processes 8, no. 12: 1666. https://doi.org/10.3390/pr8121666