Abstract
The solid-layer growth kinetics and resulting crystal purity for a well-mixed p-xylene (PX) melt with impurity of o-xylene (OX) or ethylbenzene (EB) were studied in this work at various cooling temperatures. A correlation based on the energy balance was adopted to describe the dependence of growth rate on the temperature gradient between melt and cooling medium. An empirical equation based on the mass balance was proposed to relate the effective distribution coefficient with growth rate, mass transfer coefficient, and impurity mole fraction. By fitting the proposed empirical equation with the experimental effective distribution coefficients, the mass transfer coefficients for the PX/OX and PX/EB mixtures were retrieved respectively.
1. Introduction
Solid-layer melt crystallization is an important separation and purification technique employed for obtaining pure organic compounds without addition of solvents [1,2,3,4,5]. This technology is effective in separating the isomeric compounds with close boiling points. It is also recognized as an efficient alternative to distillation for the heat sensitive materials. It has an advantage over traditional suspension crystallization, because no slurry handling is required in the equipment. Besides, no incrustation problems are encountered, since the incrustations are the solid-layer products.
In practical applications, a crystal layer growing perpendicular to a cooled wall is produced from the melt based on the phase change in solid-layer melt crystallization. The high purity of the crystal layer is achieved due to a lower impurity concentration distributed in the crystal layer, compared to that in the melt. Traditionally, two modes, including the static melt crystallization and falling film melt crystallization, have been widely applied in industries. A number of studies have been published to model the crystal layer growth and impurity distribution processes for various types of solid-layer melt crystallization [6,7,8,9,10,11,12,13,14,15,16]. Basically, in these models, the fundamental energy balance and mass balance equations at the moving crystal layer surface are developed to determine the increase of the solid layer thickness and impurity distribution along the time with sufficient thermal property data. Consequently, the growth rate parameters and impurity distribution coefficients are retrieved by comparing the experimental data and the model predictions.
Xylenes have very broad applications in chemical industries. The mixed xylenes produced mainly consist of p-xylene (PX), m-xylene (MX), o-xylene (OX) and ethylbenzene (EB). Due to the close boiling points among these isomers (i.e., , , and ), it is usually difficult to separate them by distillation. Various crystallization techniques have been applied to separate the mixed xylenes, including melt crystallization [17,18] and stripping crystallization [19,20,21,22]. As understanding the influence of impurity distribution on crystal purity is important in crystallization, the objective of this study is to investigate the dependence of an effective distribution coefficient on layer growth rate and a mass transfer coefficient for a well-mixed PX melt with impurity (OX or EB) in solid-layer melt crystallization. These results are important in the design of a solid-layer melt crystallizer for industrial application.
2. Theory
For solid-layer melt crystallization in Figure 1, if the cooling medium maintained at is circulated very fast and the solid crystal layer on the cooled surface is thin, the crystallization heat released at the crystal-melt interface can be quickly removed by the cooling medium. According to the van ’t Hoff equation for the solid-liquid equilibrium [23,24], one obtains
where is the mole fraction of the crystallized substance in melt, the equilibrium temperature for melt with , the heat of melting for the crystallized substance and the melting temperature for the crystallized substance.
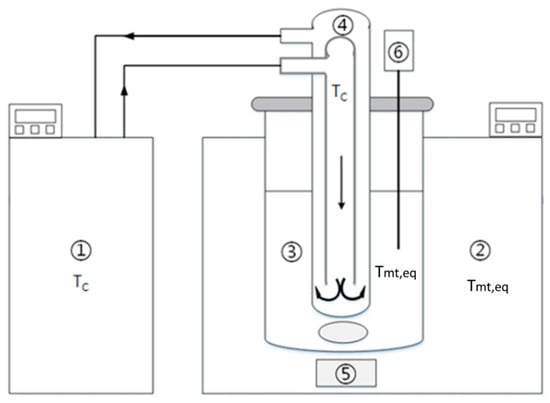
Figure 1.
Schematic diagram of the experimental apparatus: (1) water bath for the cooling finger, (2) water bath for the crystallizer, (3) melt, (4) cooling finger with water inlet and outlet, (5) magnetic stirrer and (6) temperature probe.
For a well-mixed melt with maintained at in contact with the cooling medium at , the empirical layer growth rate is often related to the supercooling as [7]:
where and are the two coefficients that can be experimentally determined. Note that the driving force for crystal growth is expressed as .
As shown in Figure 2, the impurity mole fraction in the mass transfer boundary layer along the direction perpendicular to the crystal-melt interface for a well-mixed melt can be expressed as [6,7,25,26]
where is the diffusivity of impurity in the melt and the layer crystal growth rate. As the term can be neglected for a thin boundary layer [7,25], Equation (3) reduces to
with the boundary conditions
where is the impurity mole fraction in melt and the impurity mole fraction in melt at the crystal-melt interface. Note that for binary mixtures.
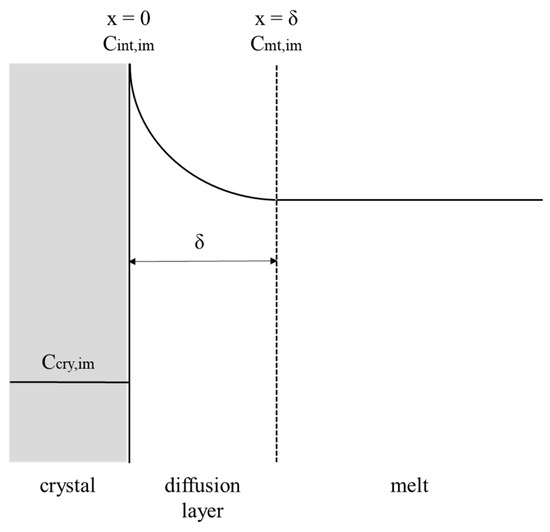
Figure 2.
Schematic diagram of the impurity concentration in the mass transfer boundary layer along the direction perpendicular to the crystal-melt interface.
By solving Equation (4), subject to Equations (5) and (6), the mole fraction profile of impurity in the boundary layer is [7,25]
Substituting into Equation (7) yields
where the mass transfer coefficient is defined as [1].
The effective distribution coefficient between melt and crystal is defined as [2,3]
The value of is between zero for the ideal separation and one if no separation occurs. The smaller the , the better is the removal for that particular impurity. As similar to the empirical form of in terms of , and adopted in the literature [13,27], an empirical form of is proposed in this study as
where and are two coefficients. Taking the log of both sides, Equation (10) reduces to
Thus, , and can be determined by fitting Equation (12) with the data of versus for various . Once is determined, can be determined from Equation (8) for each condition.
3. Experimental
Solid-layer melt crystallization experiments were performed for a well-mixed PX melt with an impurity of OX or EB in a 1300 mL crystallizer with a cooling finger as the cooled surface shown in Figure 1. The crystallizer was immersed in a water bath and was equipped with a magnetic stirrer with a constant stirring rate of 130 rpm.
PX (99%, ECHO, Miaoli, Taiwan); OX (99%, ACROS, Miaoli, Taiwan) and EB (99%, Riedel-de Haen, Seelze, Germany) were used to prepare 1000mL the binary PX/OX and PX/EB mixtures with various . Chemical structures of PX, OX and EB are illustrated in Figure 3. As listed in Table 1 and Table 2, was determined from Equation (1) using and for PX. The prepared well-mixed melt in the crystallizer was maintained at for a given during the experiments.
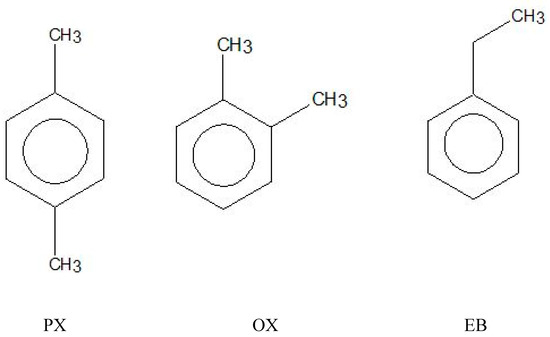
Figure 3.
Chemical structures of p-xylene (PX), o-xylene (OX) and ethylbenzene (EB).

Table 1.
The experimentally measured data of and for operated at from the binary PX/OX mixture.
Table 2.
The experimentally measured data of and for operated at from the binary PX/EB mixture.
At the beginning of the experiments, the cooling finger with the coolant with a high circulation rate at 253 k was submerged into the melt for 3 s to initiate nucleation on the cooled surface of the cooling finger. Then, the cooling finger was removed from the melt to insure no further growth on the formed crystal surface. Afterwards, the coolant was quickly switched to a selected , and the cooling finger was submerged into the melt again. Subsequently, the crystal layer gradually grew on the surface of the cooling finger at the selected during the experiments.
Each experimental run was finished in 300 s. At the end of the experiments, the overall crystal layer on the surface of the cooling finger was melted and weighed. The impurity concentration of the crystal layer, , was determined by GC using China Chromatograph 2000 with a stainless steel capillary column (Bentone 34/DNDP SCOT, 50ft*0.02in (ID), SUPELCO, Bellefonte, PA, USA).
It is difficult to experimentally measure the outer radius of the crystal layer on the surface of the cooling finger, R, at the end of the experiments. As shown in Figure 4, one can derive for the overall crystal volume on the surface of the cooling finger
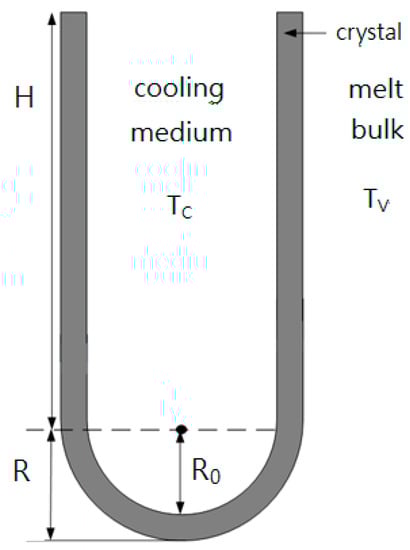
Figure 4.
Schematic diagram of the crystal layer on the cooled cylindrical tube of the cooling finger ( and ).
As the overall crystal mass on the surface of the cooling finger, , was measured at the end of the experiment, can be determined from Equation (12) using , and . The growth rate is given by
where is the total growth time for the crystal layer during the experiments. Note that the crystal layer was generally smaller than at for all the experiments performed in this work. As was negligible compared to the initial mass of melt, was kept unchanged during each experiment. Furthermore, as the crystal layer was thin and cooled with the coolant with a high circulation rate, it was reasonable to assume a constant growth rate with a uniform distribution of impurity within the crystal layer during each experiment.
4. Results and Discussion
Figure 5 shows the increase of the crystal layer with increasing time for the binary PX/OX mixture, with operating at . The crystal layer increased linearly in the early operating time of 200 s to 400 s. The increasing trend of the crystal layer gradually slowed down in the latter operating time, due to the increasing heat transfer resistance from the increasing crystal layer. Furthermore, the growth rate of the crystal layer was nearly not influenced by the stirring rate of the melt in the range 50–300 rpm. Similar results were obtained for the binary PX/EB mixture. Thus, the melt was stirred at 130 rpm and the total growth time for the crystal layer was taken as 300 s for the following experiments.
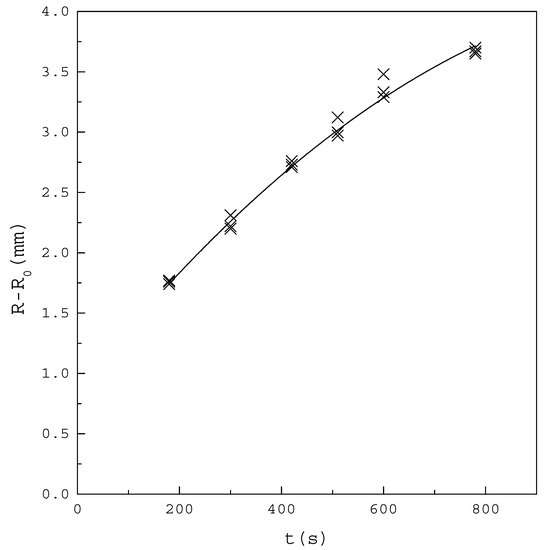
Figure 5.
The increase of the crystal layer with increasing time for the binary PX/OX mixture with . The points represent the experimental results and the line represent the fitted increasing trend of the crystal layer.
Table 1 and Table 2 list the experimentally measured data of and for operated at from the binary PX/OX and PX/EB mixtures, respectively, where represents the mole fraction of impurity (OX or EB). Figure 6 shows that increases with increasing for both mixtures. All the data in Figure 6 fitted to Equation (2) lead to
where the line represents the fitted correlation with the correlation coefficient .
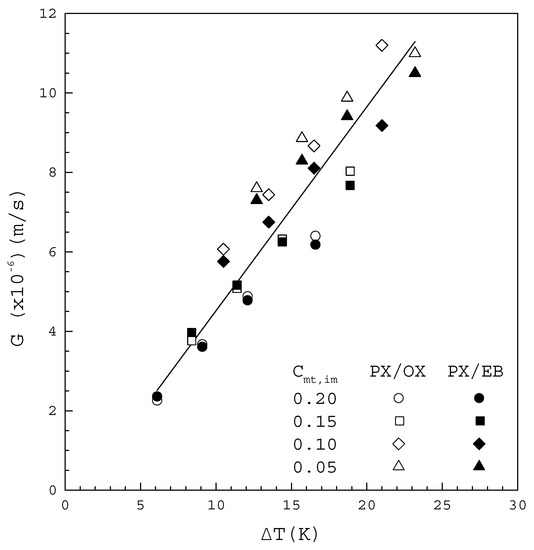
Figure 6.
plotted against for the PX/OX and PX/EB mixtures.
Figure 7 and Figure 8 show the experimental results of versus for each from the PX/OX and PX/EB mixtures, respectively, based on the measured data of using Equation (9). In both figures, decreases with decreasing at each , and is generally smaller for a lower at a given . This trend for the dependence of on and is consistent with the finding for melt crystallization of caprolactam containing differential water concentrations as impurities [28]. The data for the PX/OX mixture in Figure 7 fitted to Equation (10) lead to
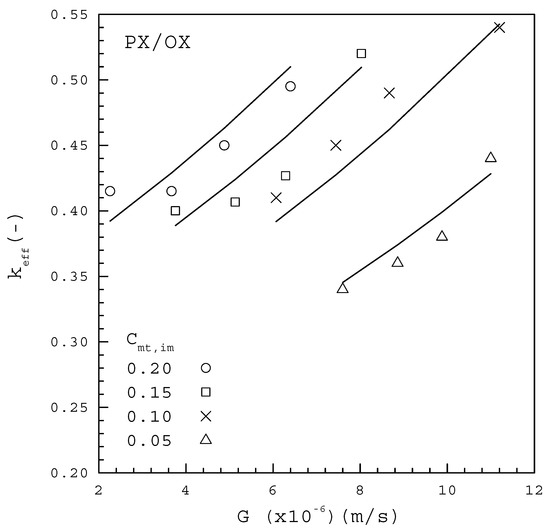
Figure 7.
The dependence of on G from the PX/OX mixture for various Cmt,im.
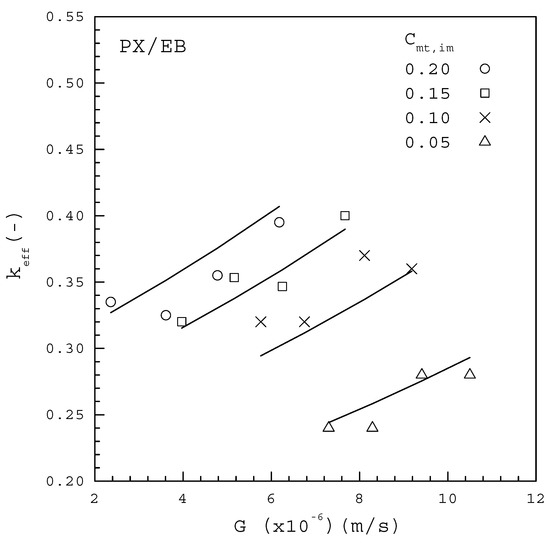
Figure 8.
The dependence of on G from the PX/EB mixture for various Cmt,im.
The data for the PX/EB mixture in Figure 8 fitted to Equation (10) lead to
Note that each line represents the fitted correlation for each .
Table 3 lists the comparison between the computed F values and the corresponding critical F values for Equations (15) and (16) based on the 99% confidence interval, according to the global F-test. As both of the computed values greatly exceed the critical value of 6.70, it is concluded that Equations (15) and (16) are useful for predicting . The fitting between Equations (15) and (16) and the data points for each in Figure 7 and Figure 8 are considered quite satisfactory. Thus, the empirical form of Equation (10) can be effectively adopted to describe the dependence of on , and in melt crystallization. The fitted results indicate for the PX/OX mixture and for the PX/EB mixture, which are consistent with the range of to for the single PX crystal growing in a C8-aromatic mixture reported by de Goede and van Rosmalen [29,30].
Table 3.
The computed F values and the corresponding critical F values for Equations (15) and (16) based on the 99% confidence interval according to the global F-test.
Figure 9 displays versus for the PX/OX and PX/EB mixtures, where listed in Table 1 and Table 2 is calculated from Equation (8) using the corresponding determined in this work. It should be noted for each condition that is higher than , while is lower than , leading to in Figure 2. In Figure 9, each line represents the clear increasing trend of with increasing for the PX/OX and PX/EB mixtures, respectively. In other words, the mole fraction of OX or EB incorporated into the PX crystal lattice is proportional to the impurity mole fraction in the melt at the crystal-melt interface. Although is similar for the same from both mixtures, from the PX/OX mixture is higher than that from the PX/EB mixture for the same at the crystal-melt interface. This is attributed to the reason that, as the molecular structure of OX, compared to the molecular structure of EB, more closely resembles that of PX, OX is more easily incorporated into the PX crystal lattice than EB. Consequently, for the PX/EB mixture is smaller than that for the PX/OX mixture at a given for each in Figure 7 and Figure 8. Therefore, solid-layer melt crystallization is more effectively applied for the removal of EB from the PX/EB mixture than for the removal of OX from the PX/OX mixture.
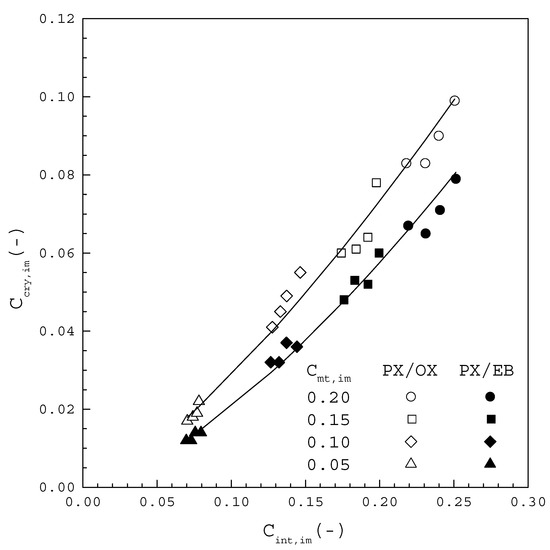
Figure 9.
plotted against Cint,im at the crystal-melt interface for the PX/OX and PX/EB mixtures.
5. Conclusions
The layer growth kinetics and resulting crystal purity for a well-mixed PX melt with impurity (OX or EB) were studied in a solid-layer melt crystallizer with a cooling finger as the cooled surface at various cooling temperatures. The results indicate that the growth rate is nearly linearly dependent on the heat transfer rate between melt and the cooling medium for both the PX/OX and PX/EB mixtures. The effective distribution coefficient increases with the increasing growth rate and increasing impurity mole fraction in the melt for both the PX/OX and PX/EB mixtures. Furthermore, the effective distribution coefficient for the PX/OX mixture is greater than that for the PX/EB mixture at a given growth rate for the same impurity mole fraction in the melt.
An empirical equation based on the fundamental mass balance was proposed to relate the effective distribution coefficient with the growth rate, mass transfer coefficient and impurity mole fraction in the melt. The experimental effective distribution coefficients are fitted well to the proposed empirical equations for both the PX/OX and PX/EB mixtures. The retrieved mass transfer coefficients are for the PX/OX mixture and for the PX/EB mixture.
Funding
The author would like to thank the Ministry of Science and Technology of Taiwan (MOST108-2221-E-182-034-MY2) and the Chang Gung Memorial Hospital (CMRPD2G0242) for their financial support of this research.
Acknowledgments
The author expresses his gratitude to Meng-Han Chiang, Yi-Chih Ke, Kun-Yen Liu and Che-Chun Liao for their experimental work.
Conflicts of Interest
The author declares no conflicts of interest.
Notation
| impurity mole fraction in crystal layer | |
| impurity mole fraction at the crystal-melt interface | |
| impurity mole fraction at the position in the boundary layer | |
| impurity mole fraction in melt | |
| mole fraction of the crystallized substance in melt | |
| diffusivity | |
| growth rate | |
| height of the crystal layer on the cooling finger | |
| heat of melting | |
| mass transfer coefficient | |
| effective distribution coefficient | |
| mass of total crystal layer | |
| outer radius of the cooling finger | |
| outer radius of the crystal layer on the cooling finger | |
| ideal gas constant | |
| cooling temperature of the cooling medium | |
| melting temperature | |
| equilibrium temperature of the melt | |
| temperature gradient between melt and cooling medium | |
| time | |
| total growth time | |
| distance perpendicular to the crystal-melt interface |
Greek Letters
| crystal density | |
| thickness of the boundary layer |
References
- Mullin, J.W. Crystallization; Butterworth-Heinemann: Oxford, UK, 1993. [Google Scholar]
- Arkenbout, G.J. Melt Crystallization Technology; Technomic Publishing Company Inc.: Lancaster, PA, USA, 1995. [Google Scholar]
- Ulrich, J.; Glade, H. Melt Crystallization: Fundamentals, Equipment and Applications; Shaker Aachen: Düren, Germany, 2003. [Google Scholar]
- Jiang, X.; Li, M.; He, G.; Wang, J. Research process and model development of crystal layer growth and impurity distribution in layer melt crystallization: A review. Ind. Eng. Chem. Res. 2014, 53, 13211–13227. [Google Scholar] [CrossRef]
- Wang, T.; Lu, H.; Wang, J.; Xiao, Y.; Zhou, Y.; Bao, Y.; Hao, H. Recent progress of continuous crystallization. J. Ind. Eng. Chem. 2017, 54, 14–29. [Google Scholar] [CrossRef]
- Chianese, A.; Santilli, N. Modelling of the solid layer growth from melt crystallization-the integral formulation approach. Chem. Eng. Sci. 1998, 53, 107–111. [Google Scholar] [CrossRef]
- Parisi, M.; Chianese, A. The crystal layer growth from a well-mixed melt. Chem. Eng. Sci. 2001, 56, 4245–4256. [Google Scholar] [CrossRef]
- Kim, K.J.; Ulrich, J. Impurity distribution in a solid-liquid interface during static layer crystallization. J. Colloid Interface Sci. 2002, 252, 161–168. [Google Scholar] [CrossRef]
- Jiang, X.; Hou, B.; He, G.; Wang, J. Falling film melt crystallization (I): Model development, experimental validation of crystal layer growth and impurity distribution process. Chem. Eng. Sci. 2012, 84, 120–133. [Google Scholar] [CrossRef]
- Zhou, L.; Su, M.; Benyahia, B.; Singh, A.; Barton, P.I.; Trout, B.; Myerson, A.S.; Braatz, R.D. Mathematical modeling and design of layer crystallization in a concentric annulus with and without recirculation. AIChE J. 2013, 59, 1308–1321. [Google Scholar] [CrossRef]
- Beierling, T.; Osiander, J.; Sadowski, G. Melt crystallization of isomeric long-chain aldehydes from hydroformylation. Sep. Purif. Technol. 2013, 118, 13–24. [Google Scholar] [CrossRef]
- Beierling, T.; Gorny, R.; Sadowski, G. Modeling growth rates in static layer melt crystallization. Cryst. Growth Des. 2013, 13, 5229–5240. [Google Scholar] [CrossRef]
- Beierling, T.; Micovic, J.; Lutze, P.; Sadowski, G. Using complex layer melt crystallization models for the optimization of hybrid distillation/melt crystallization processes. Chem. Eng. Process. 2014, 85, 10–23. [Google Scholar] [CrossRef]
- Yazdanpanah, N.; Myerson, A.; Trout, B. Mathematical modeling of layer crystallization on a cold column with recirculation. Ind. Eng. Chem. Res. 2016, 55, 5019–5029. [Google Scholar] [CrossRef]
- Fukui, K.; Fujikawa, T.; Satone, H.; Yamamoto, T.; Maeda, K. Application of solute distribution theory to melt crystallization of fatty acids. Chem. Eng. Sci. 2016, 143, 114–121. [Google Scholar] [CrossRef]
- Ioannou, I.S.; Kontos, S.S.; Koutsoukos, P.G.; Paraskeva, C.A. Mathematical modeling and experimental coupling of solution layer crystallization on a vertically cold surface. Sep. Purif. Technol. 2018, 197, 8–17. [Google Scholar] [CrossRef]
- Patience, D.B.; Rawlings, J.B.; Mohameed, H.A. Crystallization of p-xylene in scraped-surface crystallizers. AIChE J. 2001, 47, 2441–2451. [Google Scholar] [CrossRef]
- Mohameed, H.A.; Jdayil, B.A.; Takrouri, K. Separation of para-xylene from xylene mixture via crystallization. Chem. Eng. Process. 2007, 46, 25–36. [Google Scholar] [CrossRef]
- Shiau, L.D.; Wen, C.C.; Lin, B.S. Separation and purification of p-xylene from the mixture of m-xylene and p-xylene by distillative freezing. Ind. Eng. Chem. Res. 2005, 44, 2258–2265. [Google Scholar] [CrossRef]
- Shiau, L.D.; Wen, C.C.; Lin, B.S. Application of distillative freezing in the separation of o-xylene and p-xylene. AIChE J. 2006, 52, 1962–1967. [Google Scholar] [CrossRef]
- Shiau, L.D.; Wen, C.C.; Lin, B.S. Separation of p-xylene from the multicomponent xylene system by stripping crystallization. AIChE J. 2008, 54, 337–342. [Google Scholar] [CrossRef]
- Shiau, L.D.; Liu, K.F. Investigations into the effects of the cooling rate on stripping crystallization. Ind. Eng. Chem. Res. 2013, 52, 1716–1722. [Google Scholar] [CrossRef]
- Smith, J.M.; Van Ness, H.C.; Abbott, M.M. Introduction to Chemical Engineering Thermodynamics, 6th ed.; McGraw-Hill: Singapore, 2001. [Google Scholar]
- Sandler, S.I. Chemical, Biochemical, and Engineering Thermodynamics, 4th ed.; John Willey & Sons: Hoboken, NJ, USA, 2006. [Google Scholar]
- Burton, J.A.; Prim, R.C.; Slichter, W.P. The distribution of solute in crystals grown from the melt. Part I. Theoretical. J. Chem. Phys. 1953, 21, 1987–1991. [Google Scholar] [CrossRef]
- Burton, J.A.; Kolb, E.D.; Slichter, W.P.; Struthers, J.D. Distribution of solute in crystals grown from the melt. Part II. Experimental. J. Chem. Phys. 1953, 21, 1991–1996. [Google Scholar] [CrossRef]
- Wellinghoff, G.; Wintermantel, K. Schmelzkristallisation-theoretische Voraussetzungen und technische Grenzen. Chem. Ing. Tech. 1991, 63, 881–891. [Google Scholar] [CrossRef]
- Guardani, R.; Neiro, S.M.S.; Bulau, H.; Ulrich, J. Experimental comparison and simulation of static and dynamic solid layer melt crystallization. Chem. Eng. Sci. 2001, 56, 2371–2379. [Google Scholar] [CrossRef]
- De Goede, R.; van Rosmalen, G.M. Modelling of crystal growth kinetics: A simple but illustrative approach. J. Cryst. Growth 1990, 104, 392–398. [Google Scholar] [CrossRef]
- De Goede, R.; van Rosmalen, G.M. Crystal growth phenomenon of paraxylene crystals. J. Cryst. Growth 1990, 104, 399–410. [Google Scholar] [CrossRef]


© 2020 by the author. Licensee MDPI, Basel, Switzerland. This article is an open access article distributed under the terms and conditions of the Creative Commons Attribution (CC BY) license (http://creativecommons.org/licenses/by/4.0/).