1. Introduction
Every year, municipal solid wastes (MSW) are generated in large amounts. Only in the EU, in 2018, over 250,000 thousand tons of waste were generated, while in Romania in the same year, 5296 thousand tones were generated [
1]. The amount of waste generated in Romania decreased from 313 kg per capita in 2010 to 272 kg per capita in 2017 following the same decreasing tendency observed also at the European Union level (from 503 kg per capita in 2010 to 487 kg per capita in 2017) [
1,
2]. In 2018, according to [
1] 272 kg solid waste per capita was generated in Romania and it is assumed that on average Europeans generate 488 kg per capita [
1]. It can be observed that waste generation indicators in Romania are just over half of the European average and possible explanations would be low consumption of products, underestimation of waste amounts by the sanitation operators, a large part of the landfills are nonconforming, many of them without weighing [
2]. Over time it was determined that the organic fraction has the highest percentage from the EU MSW composition and according to [
3] in Europe, the main fraction of municipal solid waste is food waste (45%). In Romania, the authors of [
4] conducted a study for determination of MSW composition in the North –East region (which includes six counties) of the country and established that organic waste represents the fraction with the highest percentage (59.2%–64.4% for 2009–2010). Bio-waste represents the largest fraction from the composition of household and similar waste (57.9% as average) [
2,
5]. Although the amount of municipal waste is continuously decreasing, biodegradable waste does not follow the same trend.
At the European level, composting and anaerobic digestion of bio-waste, which includes food waste among the other biodegradable waste, are encouraged [
6]. Food wastes are biodegraded by microorganisms under aerobic conditions during the composting process and a humus material, that can be used for soil improvement, is obtained [
7]. The composting process can take place under natural or controlled conditions and is influenced by various physico-chemical parameters like pH, electrical conductivity, moisture, C/N ratio, temperature, aeration and particle size [
8]. Besides compost, through the bio-waste anaerobic digestion, biogas is also obtained. Both processes are considered environmentally friendly and used extensively in order to divert organic materials from landfills [
3,
9,
10]. Regarding the treatment of municipal biodegradable waste in Romania, the main method used is composting. At present, in Romania, there is no anaerobic digestion plant for municipal waste in operation. In 2016, 22 composting plants with a total capacity of approx. 180,000 tons/year existed. At a national level, there are 45 composting plants that are under construction or are under implementation, out of which 22 are in operation, 18 are or are being implemented by projects, not yet in operation and five are authorized composting plants, which are not currently working. According to [
2] in 2014, the material recycling rate was about 5% and the composting rate was8%. Currently, the amount of biodegradable municipal waste composted is very low. In municipal waste composting facilities, only green waste from parks and gardens is currently being used. Thus, it can be appreciated that the utilization of food waste through composting is insignificant [
2].
In this context, it is important to study the composting process of food waste, in particular fruits and vegetable waste, which, according to [
11], contributes to almost half of the total food waste generated by households. In 2010, the amount of fruit and vegetables purchased in the EU were 52 and 71 kg per person and year, respectively, from which 14 kg of fruit were wasted (9 kg unavoidable waste or inedible fractions and 5 kg avoidable waste), while 21 kg of vegetables were wasted (12 kg unavoidable and 9 kg avoidable waste). The fruit and vegetable waste is highly perishable products, relatively cheap commodities, and have inedible components. For example, the inedible fractions (in % of fresh fruits/vegetables) are apples 12%, bananas 35%, kiwis 18%, oranges 24%, cabbages 20%, carrots 19%, and potatoes 16%. Average EU consumption of fresh fruits is apples 47.70 g/person/day, bananas 18.70 g/person/day, kiwi 4.24 g/person/day, and oranges 13.42 g/person/day, while the average EU consumption of fresh vegetables is cabbages 5.90 g/person/day, carrots 13.86 g/person/day, and potatoes 78.27 g/person/day [
11]. If, for unavoidable food waste, treatment processes based on organic biodegradation should be applied, for generation of avoidable waste, waste preventive measures should be taken starting from people education in order to change their behavior, habits, and attitudes [
10,
12].
In the literature, there are different types of reactors used for solid waste composting and various experimental designs. For example, in [
13] composting of four different samples containing vegetable wastes in various proportions was performed in PET containers. They performed manual aeration once per day over 35 days. Five different mixture of waste samples were composted in plastic reactors by [
14]. The experiments were conducted for 21 days. A reactor from polyvinyl chloride was used by [
15] for food waste composting. Approximately 3 kg of raw materials was put inside the reactor at the beginning of composting and two different runs, A and B, were performed. The authors of [
16] used three plastic drums (125 L capacity) with different configurations for food composting. In order to facilitate the natural aeration, they provided holes for two drums and studied the composting process for 60 days. The turning of waste sample was performed only in one drum and a higher degradation rate for this one was observed. In another study, the authors of [
17] investigated the food waste composting over 60 days in different drums with 140 L capacity (two drums with holes, perforated PVC pipe, and turning and only one drum with inoculum addition). The waste was turned once in six days. For this study plastic containers were chosen, which were modified in order to perform natural aeration.
According to [
3], food waste composting depends on source of waste, composition, high moisture content (74%–90%), volatile solids to total solids ratio (80%–97%) and C/N ratio (14.7–36.4). Therefore, it is important before the beginning of the composting process, to determine the food waste composition (especially the nitrogen and carbon contents, moisture, but also other parameters such as pH and electrical conductivity) and to establish the proportion of different food waste types for obtaining the desired C/N ratios. After physico-chemical parameter determination, the regression analysis can be successfully used to establish the quantities of each type of waste in order to obtain the desired C/N ratios [
18]. The development of microorganisms during the composting process is particularly influenced by the C/N ratio which plays a crucial role because it represents the carbon and nitrogen sources necessary for their growth. At the beginning of the composting process the C/N ratio should be around 25–30, but many authors have used different C/N ratios with values between 20 and 50 [
3]. Determination of relation between microorganisms and physico-chemical indicators helps for a better understanding of the composting process, its improvement, and the proper selection of the types of waste subject to composting.
In this context, the aim of this paper was to obtain compost at laboratory level from fruit (apples, bananas, kiwis, and oranges) and vegetable (cabbages, carrots, and potatoes) waste collected from different Romanian households and one canteen. The composting process was monitored over 10 weeks, while physico-chemical and microbiological analyses were performed and the relation between microorganisms and physico-chemical indicators was determined.
2. Materials and Methods
The composting process was carried out at laboratory level within the Faculty of Food Engineering, Stefan cel Mare University of Suceava, Romania during the period March–June 2018.
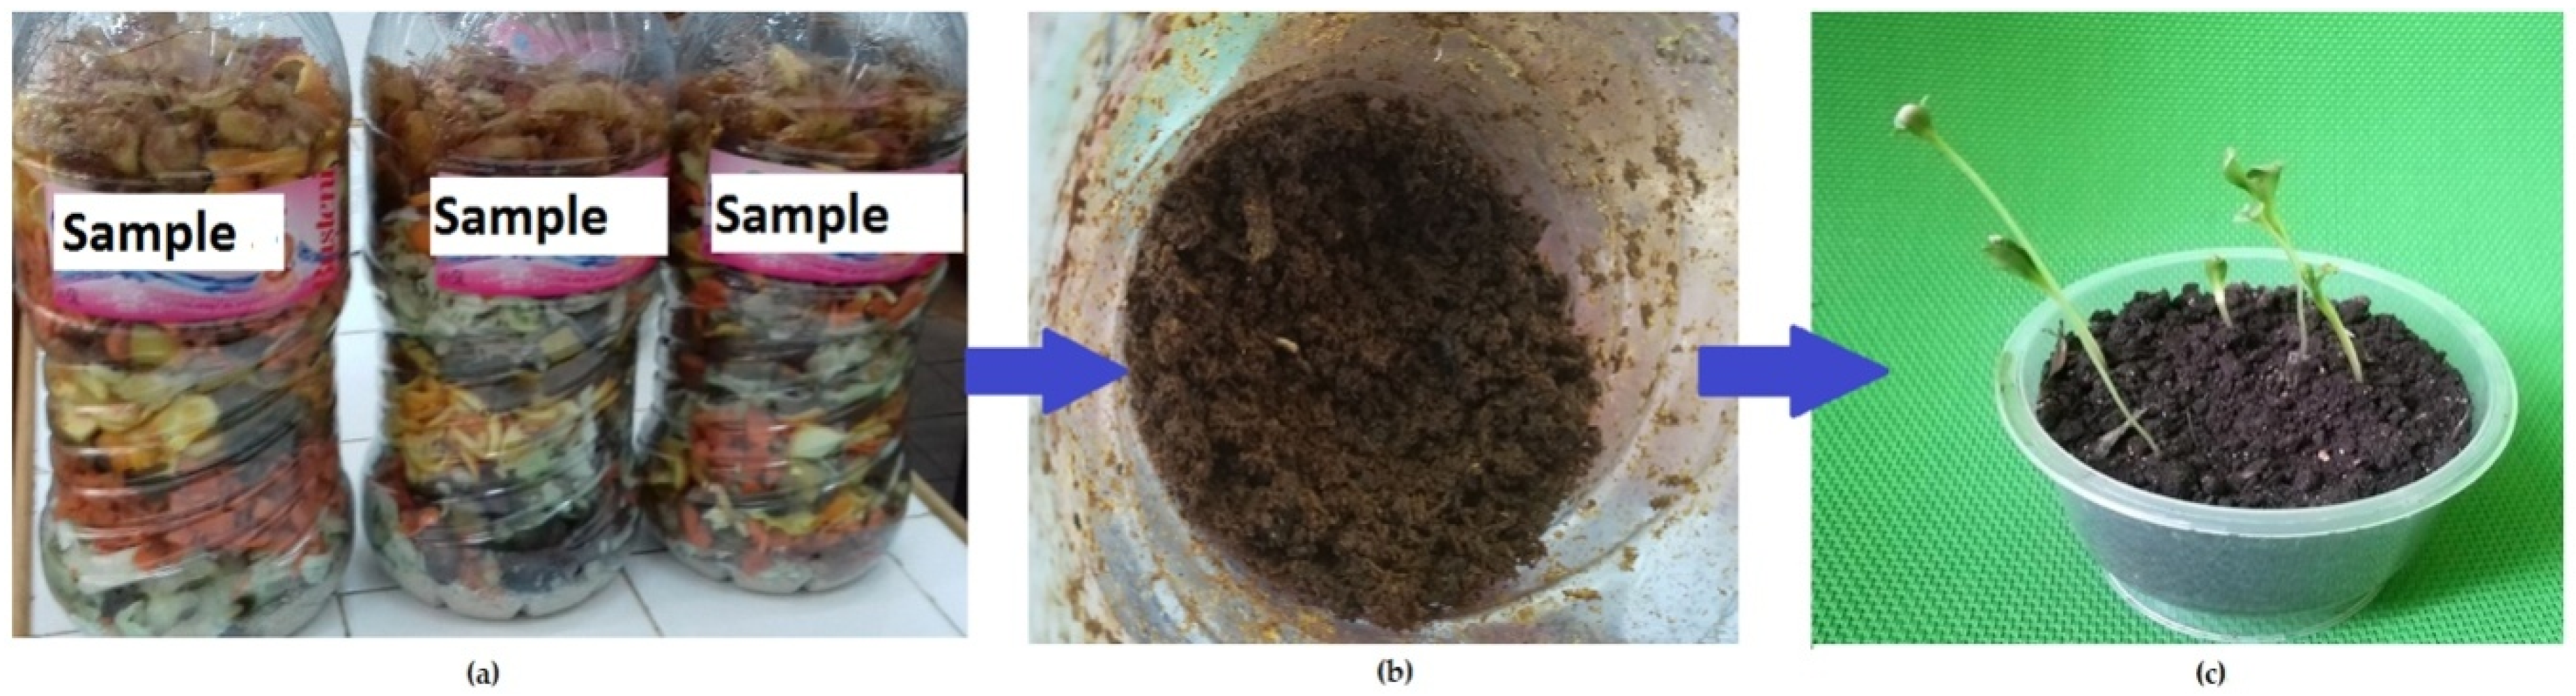
Food wastes were collected from the canteen of Stefan cel Mare University of Suceava and from different households. The wastes were selectively collected, prepared (shredded, weighed) in the laboratory, and placed in plastic containers (
Figure 1a). The plastic containers were modified by providing two layers of holes in order to facilitate the natural air circulation. The composting process was monitored over 10 weeks. During the composting, the return and mixing of samples once at six days was carried out. After this period compost was obtained (
Figure 1b) which can be used as fertilizer for soil.
Figure 1c illustrates plant growth on our compost.
The composition of the three samples analyzed in this study is presented in
Figure 2. The amounts of sawdust were calculated based on the equation proposed by [
18].
pH and electrical conductivity (EC) were measured with a pH meter IQ240 and CyberScan CON 510 Conductivity Meter (Eutech Instruments, Vernon Hills, Illinois, USA). Moisture (M) was determined by oven drying (105 °C for 24 h up to constant weight), while ash content was obtained by burning food waste samples at 550 °C for 4 h. An oven manufactured by Nabertherm (Nabertherm, Lilienthal, Germany) was used. The nitrogen content was determined by applying the Kjeldahl method and using DK Series Kjeldahl Digestion Units—VELP Scientifica (VELP ScientificaSrl, Usmate, Italy). The carbon content was determined by ignition at 550 °C and calculated according to [
18]. For determination of heavy metals content from obtained compost, a mass spectrometer with inductively coupled plasma mass spectrometry (ICP-MS) Agilent Technologies 7500 Series (Agilent, Santa Clara, CA, USA) was used.
For microbiological assessments, spread plate techniques were used. Samples were collected from several places of the compost material and thoroughly mixed to achieve a mean sample, and then 5 g were placed in a bag with 45 mL of sterile distilled water and homogenized using a BagMixer (InterScience, Saint-Nom-la-Bretèche, France). Dilutions were made in sterile saline solution (0.9%
w/v NaCl) based on the method described by [
19,
20]. Under sterile conditions, 1 mL of filtered and serially diluted (1/1000) homogenate was spread onto medium plates. Mediums used for cultivation were Potato Dextrose Agar (PDA) for yeast and mold counting, Plate Count Agar (PCA) for total aerobic counts, deMan, Rogosa, Sharpe (MRS) Agar for lactic bacteria counts, Coliform Agar for coliform counts. All mediums were purchased from Sigma Aldrich (Taufkirchen, Germany) as ready-made plates and incubated under producer specifications, using AnaeroCult system (Sigma Aldrich, Germany) for lactic acid bacteria cultivation. The PDA plates were incubated for 4 days at 25 °C, while PCA plates at 37 °C for 24 h. Over 3 days MRS plates were incubated at 35 °C, under anaerobic conditions, while Coliform Agar plates were incubated for 48 h at 37 °C. The authors of [
21] incubated the Petri plates at 37 °C (24 h) for counting of
Escherichia Coli, Cellulolytic, Amylolytic, and Nitrogen fixing bacteria. In [
22] the authors incubated the plates at 30 and 55 °C, respectively. In [
23] the authors determined the total counts of mesophilic bacteria and fungi after incubation at 28 °C, and after incubation at 50 °C for thermophilic bacteria. The authors of [
24] performed incubation at 25 °C for mesophilic bacteria and at 55 °C for thermophilic bacteria.
After incubation, colonies were counted, and results were calculated taking into account the dilution factor and the weight of the sample used and expressed as colony forming units (CFU)/gram of compost. For each compost variant, three plates from each type of medium were used and results expressed as means +/− standard deviations.
The obtained data were analyzed with Minitab 17 statistical software. Pearson’s correlation matrix of heavy metals concentrations in the compost samples was determined. In order to observe if there is any correlation between physico-chemical and microbiological parameters Pearson correlation was used. Principal component analysis was also performed. Poisson Regression Analysis was applied to find a mathematical relation between microorganisms and physico-chemical parameters.
3. Results
pH, electrical conductivity, moisture, and ash content were measured every week, while nitrogen and carbon contents were determined at the beginning, in the middle, and the end of the composting period. Experiments were performed in triplicate.
The pH will always decrease at the start of the aerobic degradation process due to the production of fatty acids, CO
2, and nitrification, but will increase again with the decomposition of organic matter by microorganisms [
25]. Changes in pH values may be an important indicator of microbiological activity. The authors of [
25] stated that there exists a correlation between lactic acid bacteria high concentration and low pH in the first phases of composting.
It is considered that during the composting process a pH between 7.5 and 8.5 supports microbial decomposition of organic matter. In the first week of our study the pH was acidic for all three samples (
Figure 3a). However, a low pH and the appearance of unwanted odors due to the generation of fermentation products indicate the need for oxygen, so to raise pH values and to prevent the development of anaerobic conditions, a more efficient aeration was achieved, and a certain amount of sawdust was added. It can be seen that pH values increased starting with the second week for all three samples (
Figure 3a). Anaerobic conditions may occur at any stage of composting if the aeration is insufficient to negatively influence the composting process, therefore continuous aeration is required to avoid the occurrence of anaerobic microorganisms. In general, the pH value should be between 7 and 8 [
26,
27], and from
Figure 3c it can be seen that the values are within this pH range. For sample S1 the mean value of pH is 7.9, while for S2 and S3 the pH mean values are around 8.2 (
Figure 3c).
p-values for samples 2 and 3 are lower than the significance level of 0.05 which means that the data do not follow the distribution.
pH and electrical conductivity are parameters that influence the growth of bacteria and fungi. The variations of electrical conductivity depend on the amount of mineral salts dissolved in suspension, over time, for the three samples. In the first week the electrical conductivity was between 830 and 859 μS/cm (
Figure 3b). There was a decrease of electrical conductivity values until the end of the experiment to the following values: 368 μS/cm for S1, 299 μS/cm for S2, and 362 μS/cm for S3 (
Figure 3b). All samples had anEC under 1000 μS/cm due to the fruit and vegetable waste according to [
28].
Figure 3d illustrates the probability plot for EC of the three samples (the EC mean values were 617.4 μS/cm for S1, 654.3 μS/cm for S2, and 612.9 μS/cm for S3). The
p-values of EC for all samples are larger than the significance level, but we cannot conclude that the data follow the distribution.
According to [
29] the compost must meet some minimum quality criteria such as pH ≥ 4 and ≤ 9 and EC ≤ 190 mS/m. The target values for pH proposed by [
30] may vary between 6 and 8, with an upper limit of 9. The pH values obtained for our compost samples are between these values (7.20 for compost obtained from S1, 8.85 (S2) and 7.99 (S3)). pH values of 7.7 for home compost and 7.9 for industrial compost were determined by [
31]. Regarding the EC values for our compost samples it can be observed that they are lower than the value proposed by [
29,
30] (target value <600 μS/cm and an upper limit of 1500 μS/cm).
In the first week of food waste composting, samples S1 and S2 had a moisture content of approximately 83%, while for the other sample a 72.4% moisture content was determined (
Figure 4a). It was observed that the moisture content for S1 decreased until the fifth week, then remained constant until the seventh week, and by the tenth week decreased again until 40.9%. During the second week of composting S3 had a moisture content of about 74%, and then increased to approximately 81% in the third week, followed then by a few fluctuations, and eventually decreased to 41% in the last week. Additionally, for the second sample, a decrease in the moisture content was registered, some fluctuations being recorded during the composting process. In the tenth week the value of moisture for S2 was around 42%. The mean values of moisture for S1 and S2 were around 70% according to
Figure 4a (
p-value < 0.05), while for S3 the mean value was 68.97% (
p-value < 0.05) (
Figure 4c). Moisture content of compost must be, according to [
30], between 35% and 40% with an upper limit of 50%. The authors of [
31] obtained a value of 44% of moisture for home composts and 31% for industrial composts, while the composts obtained by us had a moisture content between 40% and 42%. During the composting, a higher amount of ash may be noted for S2 followed by S1 and S3 (
Figure 4b). In
Figure 4d the ash content is illustrated, the mean values are around 7.5% for S1 and S2 (
p-value > 0.05) and 6.9% for S3 (
p-value < 0.05).
Apple and banana peel composition and amount influences the C and N contents from S1, while cabbage and potatoes peels are the main contributors to the C and N percentages determined in sample 3. In S2, the higher C percentage is due to orange and banana peel quantities, while the amounts of orange and carrot peels mainly contributes to N percentage. From
Figure 5a it can be observed that the carbon content decreases during the composting process of the three samples. The highest decrease in carbon content is recorded for S1 from 55.25% at the beginning of the composting process to 39.23% at the end of the process. Carbon contents decreased continuously, since organic materials were decomposed, until a stable value [
32]. The nitrogen contents of all samples decreased during the first five weeks of the composting process, then began to increase slightly (
Figure 5b). This was also observed by [
32] who considered that nitrogen is lost in the early stage through volatilization. In our study at the beginning of composting the C/N ratios determined were 50.22 for S1, 45.20 for S2, and 30.62 for S3, which are very close to those obtained through our calculation of 49.61 (S1), 44.9 (S2), and 31.42 (S3). These C/N ratios were used before also by other authors: 30.58 by [
33], 49–53 by [
34], ≈50 by [
35]. The authors of [
36] recommended adoption of initial C/N values between 25 and 40 or even 50 for composting. During the composting process, the C/N values are decreasing [
37]. In our study the C/N ratios remained roughly constant over the first five weeks for all samples and decreased until the last week as follows: 28.02 for S1, 20.05 for S2, and 18.25 for S3 (
Figure 5c). The target value for compost C/N ratio is < 20 according to [
31]. It can be observed in our case that only the compost obtained from S3 has the C/N ratio value lower (18) than the target value, while the values of C/N ratio for compost obtained from S2 and S1 are around 20 and 28, respectively. In [
38,
39], values of 18 and 20 for C/N ratios in final compost were obtained, respectively.
The highest concentration of Cr is in sample 3 (19.42 ± 0.29 mg/kg dry weight (DW)), while in samples 2 and 1 Cr concentrations are 11.63 ± 0.05 mg/kg DW and 11.34 ± 0.08 mg/kg DW, respectively. From
Table 1, it can be observed that the Cr concentrations in all samples do not exceed the limit values. Cobalt concentrations range between 0.45 and 2.18 mg/kg (mean values), with the highest concentration detected in sample 3 (2.18 mg/kg DW) and lowest concentration registered in sample 2 (0.45 mg/kg DW). All three samples exceed, in this case, the limit values since in accordance with EU regulation in the compost composition, cobalt should not be found at all. In this study, the amount of Cu varied from 3.49 to 5.9 mg/kg DW. The maximum accumulation of cooper was found in sample 3, followed by samples 2 and 1. The Cu concentrations do not exceed the limit values and it was observed that very low values were recorded compared to the admissible limit values. The highest concentration of Ni was obtained for sample 3 (2.78 ± 0.05 mg/kg DW), while the lowest concentration was detected in sample 1 (1.05 ± 0.01 mg/kg DW). The Zn concentration decreases in the following order: S3 > S2 > S1. Both the Ni and Zn concentrations determined in this study do not exceed the limits allowed by the legislation (
Table 1). From
Table 2, it can be observed that there is a strong positive correlation between all the heavy metals (r > 0.5), which may suggest according to [
40] that they have the same origin.
Results showed that the concentrations of Ca in the obtained compost decreased in the following order: S3 > S2 > S1 (1163.46 ± 0.32, 998.61 ± 0.36, and 736.08 ± 0.62 mg/kg DW). The highest Mg concentration was observed in compost obtained from S3 (493.41 ± 0.3 mg/kg DW), followed by compost from S2 (356.03 ± 0.58 mg/kg DW) and by compost from S1 (328.19 ± 0.11 mg/kg DW). Na concentrations in the obtained compost decrease in the following order: S2 > S3 > S1 (511.4 ± 0.35, 415.4 ± 0.33, and 364.48 ± 0.29 mg/kg DW).
Mesophilic bacteria grow in the mesophilic and thermophilic stages, when intense degradation of organic matter occurs. During the composing process the microbial communities are constantly changing [
42]. According to [
43] an increase of microorganism number represents more extensive and rapid biodegradation during composting, while decreasing of microorganism number at the end of the process means that the compost is mature and stable. For the first sample the higher number of microorganisms is registered in week two for mesophilic aerobic bacteria (MAB), followed by yeasts and molds (YM) and lactic bacteria (LB). From
Figure 6a it can be observed that the number of MAB is increasing in the first two weeks of composting and then decreased, the number of LB fluctuates during the composting process, while the number of yeasts and molds is decreasing. The number of coliform bacteria (CB) is decreasing during the composting process. The same tendency of the microorganism number and type was observed during the composting of the other two samples (
Figure 6b,c). On the second week of the composting process, the MAB counts for samples were 3.64 × 10
7 CFU/g (S3), 8.28 × 10
7 CFU/g (S2), and 1.08 × 10
8 CFU/g (S1), respectively. The number of MAB decreased in the five weeks to 5.96 × 10
7 CFU/g for S1, 6.39 × 10
7 CFU/g for S2, and increased for S3 (5.00 × 10
7 CFU/g) and then followed a downward trend until the end of composting. This tendency of increasing and decreasing of MAB number during the composting process was also observed by [
42]. In [
44] the authors counted in the first 10 days of composting 1.7–2.84 × 10
9 CFU/g MAB, having a larger number of aerobic bacteria than us. The authors of [
44] also observed a decrease in the MAB number to 10
7 CFU/g in the seventh week, until 10
6–10
5 CFU/g in the maturation phase. The same tendency was also observed in our case. The highest decrease in the number can be seen in the case of CB. The results show that the CB reduction obtained was from 4.77 × 10
6 CFU/g to 2.20 × 10
1 CFU/g (S1), from 6.48 × 10
6 CFU/g to 1.10 × 10
1 CFU/g (S2), and from 4.32 × 10
6 CFU/g to 4.00 × 10
1 CFU/(S3). The microorganism counts were transformed to log values (
Figure 6).
From
Table 3, it can be observed that the Pearson correlation between pH and EC is 0.543 which indicates that is a moderate positive relationship between these two variables and a strongly negative relationship between pH and LB (−0.702) (
p-value < 0.05). A strongly positive relationship can be observed between EC and CB (0.846) and YM (0.770) (
p-value < 0.05), so it is considered that all variables increase when one of these three variables is increasing. It was observed that strongly positive relationships are between M and MAB (0.963), M and CB (0.944), and M and YM (0.852) (
p-value = 0.000) (
Table 3). Moderate negative relationships are between N and MAB, N and YM, and N and CB.
The principal component analysis was performed, and it was observed that the first two components have eigenvalues greater than 1 (
Table 4). The first component has a proportion of 0.626, which means that it explains 62.6% of the variability in the data and the second component has 23.7% and can both be included in the evaluation, while the other components have lower proportions and may not be important enough to be included into the evaluation. The first component has a positive association with CB (0.389), M (0.377), and MAB (0.371), while the second component has a large negative association with pH (−0.497) and N (−0.444).
Food waste composition directly influences the activity of microorganisms. Poisson regression analysis was applied in order to find the relation between microorganisms and physico-chemical indicators. After examination of goodness-of-fit results it was observed that is no statistically significant evidence of lack-of-fit (
p > 0.9). The obtained Akaike information criterion (AIC) values were 59.35, 58.86, 56.04, and 51.97. The model fits the data better if the AIC has smaller values. The variance inflation factor (VIF) is between 1 and 5 for pH, EC, and M, which means that these indicators are moderately correlated, while for N, C, and C/N exceeds a value of 5 which means they are highly correlated. The deviance (R
2) is 95.78% for MAB, 85.03% for LB, 87.15% for YM, and 97.78% for CB. The following regression equations were obtained:
when MAB = exp (Y’)
when LB = exp (Y’)
when YM = exp (Y’)
when CB = exp (Y’)
Deviance residual plots for CB are illustrated in
Figure 7. It can be observed that one point is away from the line, but after the Grubbs’ test it was concluded that this point is furthest from the rest, but not a significant outlier (
p > 0.05).


