Abstract
Twenty fluorescent Pseudomonas isolates were tested for their ability to produce siderophores on chrome azurol S (CAS) agar plates and their antagonistic activity against six plant pathogenic fungal isolates was assessed. Scaling-up production of siderophores from the promising isolates, P. aeruginosa F2 and P. fluorescens JY3 was performed using batch and exponential fed-batch fermentation. Finally, culture broth of the investigated bacterial isolates was used for the preparation of two economical bioformulations for controlling Fusarium oxysporum and Rhizoctonia solani. The results showed that both isolates yielded high siderophore production and they were more effective in inhibiting the mycelial growth of the tested fungi compared to the other bacterial isolates. Exponential fed-batch fermentation gave higher siderophore concentrations (estimated in 10 µL), which reached 67.05% at 46 h and 45.59% at 48 h for isolates F2 and JY3, respectively, than batch fermentation. Formulated P. aeruginosa F2 and P. fluorescens JY3 decreased the damping-off percentage caused by F. oxysporum with the same percentage (80%), while, the reduction in damping-off percentage caused by R. solani reached 87.49% and 62.5% for F2 and JY3, respectively. Furthermore, both formulations increased the fresh and dry weight of shoots and roots of wheat plants. In conclusion, bio-friendly formulations of siderophore-producing fluorescent Pseudomonas isolates can be used as biocontrol agents for controlling some plant fungal diseases.
1. Introduction
Siderophores are a group of low-molecular-weight molecules (400–1500 Da) with a high affinity to ferric ions. These molecules are secreted by different microorganisms in response to low-iron conditions; a siderophore molecule forms a Fe-siderophore complex, which is recognized by membrane-receptor proteins within the microorganism. After that, Fe-siderophore complex is transported into cell periplasm, wherever it facilitates iron uptake [1,2]. Siderophores are iron chelators that have many applications, such as iron chelation therapy, antibiotic carriers, inhibitors of metalloenzymes, promotion of plant growth, biocontrol of plant and fish pathogens, biocontrol of algal blooms, removal of petroleum hydrocarbons from the marine environment, soil bioremediation, recovery of unusual earth elements and modification of surfaces [3]. The role of siderophore production in the biocontrol of Erwinia carotovora was demonstrated by Kloepper et al., 1980, who were the first to use pseudobactin-producing Pseudomonas fluorescens, a type of siderophore, as a biocontrol agent. Several species of fluorescent pseudomonads are able to secrete siderophores such as P. aeruginosa, P. fluorescens and P. syringae [4,5]. P. fluorescens, which secretes a hydroxamate-type siderophore revealed a high efficiency against Macrophomina phaseolina, the pathogen causing peanut charcoal rot [6], while a catechol-type siderophore produced by P. syringae had inhibitory effects on spore germination and mycelium morphology of Fusarium oxysporum [7]. Maximization of siderophore production from fluorescent pseudomonad isolates is performed in the bioreactor using different fermentation strategies [8,9,10]. There are three common operational modes of fermentation process: batch, fed-batch and continuous fermentation [11]. Batch fermentation is a very simple process, where all the medium components are sterilized in the vessel of bioreactor; however, some sensitive components might be sterilized separately and then added after sterilization to the bioreactor. Then, the organism is inoculated into the vessel and its growth is maintained inside this closed system until the end of the run without any further modification. The main objective of the fermentation process is maximizing production of the biological product or biomass, so that the process ends when the yield or products are achieved, when consumption of nutrients and minerals has occurred, or when toxic products accumulate [11,12]. Fed-batch fermentation is started with a batch phase and accomplished with a fed-batch phase by adding a carbon source or any other nutrients to the bioreactor at the end of the exponential phase of the culture growth (after consumption of the initial carbon source) without any removal of the fermentation products until the end of the fermentation process. The medium components could be added to the vessel according to designated feed rate (according model) to avoid the inhibitory effect of the initial high concentration of any medium component that occurs in batch fermentation. This ensures that the fed-batch fermentation process achieves high concentrations of the desired products [13]. There are different types of fed-batch fermentation according to the feeding strategy: constant [12], exponential [14,15], linear [16], pulse [12], and feeding based on other models [17]. Both batch and fed-batch strategies have been used for maximizing pyocyanin production from P. aeruginosa JY21 [12], and to improve the production of biosurfactant from P. aeruginosa USM AR2 and MR01 [18,19]. In addition, these strategies have also been used for increasing the production of acetyl esterase from Pseudomonas sp. ECU1011 [20]. Radha et al., 2014 enhanced the production of alkaline protease using batch and fed-batch fermentation strategies from a mixed culture of P. putida and Staphylococcus aureus. They reported1.18-fold increases in the activity of alkaline protease when the enzyme was produced in a fed-batch fermentation compared to batch fermentation process [21]. Siderophores, which have high affinity to ferric irons, are naturally produced by microorganisms under low-iron conditions. The resulting Fe-siderophore complex becomes unavailable to other organisms, but the producing strain can uptake this complex via a very specific receptor in its outercellular membrane [22,23]. By this strategy, siderophores producing fluorescent Pseudomonas can restrict the growth of plant pathogens in the rhizospher of plants. This mechanism is known as competition for iron nutrition, which is one of the most important mechanisms of biological control of plant pathogens. Pyoverdin, a siderophore produced by P. putida WCS358, was effective in controlling radish fusarium wilt disease, which is caused by F. oxysporum f. sp. raphani [24]. In addition, P. fluorescens strains SPs9 and SPs20 that produced siderophores were effective in the inhibition of tomato wilt pathogen, F. oxysporum f. sp. lycopersici [5]. Siderophores play an imperative role in iron nutrition of plants, and consequently, promote plant growth. Iron uptake by plants is usually enhanced by microbial siderophores, when the plant is able to recognize the bacterial ferric-siderophore complex. Plants take in iron from bacterial siderophores by means of different mechanisms, for example, chelation and release of iron, the direct uptake of siderophore-Fe complexes, or by aligand exchange reaction [25]. Arabidopsis thaliana took up Fe-pyoverdine complex synthesized by P. fluorescens C7, resulting in an increase in iron concentration inside the plant, and hence, improved plant growth [26]. The main goal of our study is maximizing the production of siderophores from two Pseudomonas species, P. aeruginosa and P. fluorescens using batch and exponential fed-batch fermentation strategies. We then test the ability of siderophore-producing fluorescent pseudomonads to act as biocontrol agents against soil-borne fungi such as F. oxysporum and Rhizoctonia solani, the major agents of damping off and root rot diseases for many different plant crops that cause severe loss in the productivity of food and feed crops.
2. Materials and Methods
2.1. Bacterial and Fungal Isolates
2.1.1. Isolation of Fluorescent Pseudomonas Isolates
Isolation was carried out by the serial dilution method from forty soil samples of wheat, corn, eggplant, cotton, pepper and clover collected from Alexandria, Monufia and Sohag in Egypt. Ten grams of soil were suspended in 90 mL of sterile double distilled water and shaken for 1 h at 200 rpm. Next, 200 µL of 10−5 and 10−6 dilutions were spread onto King’s B medium plates. After inoculation, plates were incubated at 28 to 30 °C for 1 to 2 days. Fluorescent Pseudomonas isolates were recognized by the formation of green fluorescence pigments in and around the colonies when exposed to ultraviolet light. Fluorescent Pseudomonas cultures were purified using the single colony technique and examined under light microscope after staining by Gram stain to confirm their purity.
2.1.2. Bacterial and Fungal Isolates from Culture Collection
Four fluorescent pseudomonad isolates, P. fluorescens JY3, JY7, JY8 and JY13 (GenBank accession number, KF922490, KF922494, KF922495 and KF922500, respectively) (Table 1), and six fungal isolates, Alternaria spp., F. culmorum, F. oxysporum isolate A, F. oxysporum isolate B, F. solani and R. solani used in the current study were kindly provided by the City of Scientific Research and Technological Applications (SRTA-City).

Table 1.
Fluorescent Pseudomonas isolates used in the current study.
2.2. Screening for Siderophores Production Using CAS Assay
2.2.1. Qualitative Assay
All fluorescent Pseudomonas isolates were checked for their capability to secrete siderophores. Detection of siderophores was performed on chrome azurol S CAS agar plates [27] where the detection depends on the high affinity of siderophores to chelate iron, so that, in the presence of siderophores the colure of medium changes from greenish blue to orange. Pseudomonas isolates were grown in succinic medium contained 4 g succinic acid; 6 g KH2PO4; 4 g K2HPO4; 0.2 g MgSO47H2O; 1 g (NH4)2SO4 and dH2O up to 1000 mL [28] for 24 h at 200 rpm and 30 °C. Next, 10 mL of each culture was centrifuged at 10,000 rpm for 10 min and then the supernatant was filtrated throughout a 0.2 µ syringe filter. Five wells were made in each CAS agar plate and each well was filled with 80 µL of culture filtrate. Plates were then incubated at 30 °C for 24 h and the presence of siderophores was detected visually.
2.2.2. Quantitative Assay
Pseudomonas isolates were cultured in succinic medium for 24 h at 200 rpm and 30 °C. A 1.5 mL volume of each culture was centrifuged at 10,000 rpm for 10 min. The relative level of siderophores was measured in a fixed volume of supernatant (10 µL) using the CAS assay method according to Schywan and Neilands (1987) [27]. Next, a 0.5 mL CAS assay solution was added to 10 µL of culture supernatant and mixed well, then 10 µL of Shuttle solution was added, mixed, and the mixture was left at room temperature for few minutes. The disappearance of the blue color relates to the presence of siderophores. The absorbance was measured at 630 nm using the media as blank. The relative level of siderophores was calculated based on the following formula:
Relative level of siderophores % = Ar − As/Ar × 100
Ar refers to absorption of CAS solution plus media plus shuttle solution whereas, As refers to absorption of CAS solution plus culture supernatant plus shuttle solution.
2.3. Antagonistic Effect of Fluorescent Pseudomonad Isolates (Dual Culture Method)
Antagonistic effects of all fluorescent pseudomonad isolates were tested against Alternaria spp., F. culmorum, F. oxysporum isolate A, F. oxysporum isolate B, F. solani and R. solani using the dual culture method according to Toure et al., 2004 [29]. Antagonistic isolates were streaked as a streak line with a loopfull of 2 day-old culture on potato dextrose agar plates, and incubated for 48 h prior inoculation by any tested fungus. A mycelial disc (5 mm in diameter) of an actively growing culture of the checked fungus was placed in the center at a standard distance close the other edge of the Petri plate and incubated at 30 °C for 3–7 days. Inhibition zones (the distance among the edge of antagonistic bacterial growth and the edge of fungal growth) were measured. All experiments were carried out in three replicates for each fungus.
2.4. Molecular Identification of Bacterial Isolates
Total DNA was extracted according to Istock et al., 2001 [30] from fluorescent Pseudomonas isolates F2, F7 and F8, which produced a higher percentage of siderophores production than the other Pseudomonas isolates that were isolated in the current investigation. The complete length of the 16S rRNA gene was amplified according to Matar et al., 2009 [31] using two universal primers, Start (forward) 5′ AGAGTTTGATCMTGGCTCAG 3′ and End (reverse) 5′ TACGGYACCTTGTTACGACTT 3′. The amplified 16S rRNA gene of Pseudomonas isolates was purified and sequenced based on enzymatic chain terminator technique by the use of a Big Dye terminator sequencing kit. After that, the nucleotide sequences were aligned with pseudomonad 16S rRNA gene sequences obtained from GenBank database (http://www.ncbi.nlm.nih.gov). The phylogenetic tree was constructed with the UPGMA method using MEGA software version 5 and the number of bootstraps replications was 2000.
2.5. Fermentation Experiments
2.5.1. Bioreactor
Fermentation experiments were carried out in a 10-L bench-top bioreactor (Cleaver, Saratoga, CA, USA) [26]. Temperature was monitored at 25 °C while the pH was adjusted to 7 by adding HCl 2 N and NaOH 2 N using feeding pumps. Aeration was performed using sterilized air that was supplied at 0.5 VVM (air volume per broth volume per minute). Agitation speed ranged between 200 to 600 rpm to keep the percentage of dissolved oxygen more than 30%. DO percentage and pH values were recorded automatically using the online module.
2.5.2. Batch Fermentation
P. aeruginosa F2 and P. fluorescens JY3 (GenBank accession number, MG210480 and KF922490), which have the greatest percentage of siderophores, were cultivated in the bioreactor using a volume of 5 L of optimized medium for siderophore production. The medium contained 20 mL glycerol; 14.5 g glucose; 1 g glutamic acid; 4 g sodium succinate; 5 g asparagine; 0.1 g urea; 1 g (NH4)2SO4; 1 g kH2PO4; 3.5 g K2HPO4; 1 g MgSO4; 0.5 µM FeCl3 and dH2O up to 1000 mL, pH 7 for P. aeruginosa F2 [27]. However, P. fluorescens JY3 was cultivated on optimized medium contained 10 mL glycerol; 1 g glucose; 0.5 g glutamic acid, 3.14 g sodium succinate; 1 g asparagine; 0.1 g urea; 0.1 g (NH4)2SO4; 6 g kH2PO4; 4 g K2HPO4; 0.1 g MgSO4; 0.62 µM FeCl3 and dH2O up to 1000 mL, pH 7 [32]. Cultivation of P. aeruginosa F2 and P. fluorescens JY3 in the bioreactor started with optical density (O.D600nm) of 0.3 as an inoculum size by inoculation from seed culture of LB broth of each strain. Several samples from each culture were taken at time intervals for the determination of relative level of siderophores, biomass, glucose and glycerol.
2.5.3. Fed-Batch Fermentation
Fed-batch fermentation was initiated with batch phase using 5 L of optimized medium as previously described. At the end of exponential phase, a feeding step was created by adding the feeding medium of that every 1-L of optimized medium, including 10-fold of each medium component except kH2PO4 and K2HPO4, which were added with original weights shown in the optimized media and without 10-fold increase . The feeding strategy for each strain was accomplished using a exponential programmed feed rate that was initialized with a rate of 1.5 mL min−1 to finish at rate of 22.5 mL min−1 [15].
2.6. Analytical Procedures
2.6.1. Relative Level of Siderophores
Relative level of siderophores was determined by CAS assay method according to Schywan and Neilands (1987) as mentioned before [27].
2.6.2. Biomass Estimation
Dry cell weight was estimated according to Van Dam-Mieras et al., 1992 [33].
2.6.3. Glucose Estimation
Glucose concentration was estimated using enzymatic colorimetric kit (Diamond Diagnostics, Egypt).
2.6.4. Glycerol Estimation
Glycerol concentration was estimated by the method developed by Bok and Demain (1977) [34]. One mL of supernatant containing glycerol was added to 1 mL of 15 mM sodium metaperiodate in 0.12 M HCl in a test tube and incubated at room temperature for 10 min. After oxidation of periodate, 2 mL of 0.1% (w/v) L-rhamnose solution was added to the test tube in order to remove the excessive periodate ions. After mixing, 4 mL of Nash reagent containing ammonium acetate (150 g mL−1), acetic acid (0.2%, v/v) and acetylacetone (0.2%, v/v) were added. The color of the mixture was allowed to develop for 15 min in a water bath at 53 °C. After cooling, the optical density of the mixture was measured at 412 nm using a spectrophotometer and converted into glycerol concentration (g L−1) according to a calibration curve (ranging from 0 to 40 mg L−1).
2.7. Application of Siderophores-Producing Pseudomonas Isolates as Biocontrol Agents
2.7.1. Formulation Experiment
Culture broth of P. aeruginosa F2 and P. fluorescens JY3 obtained from fed-batch fermentation containing 2.0×10⁹cfu mL−1 was formulated using talc powder (TP) as a carrier with some other additives that include glycerol or glucose as a carbon source and carboxymethylcellulose (CMC) as an adhesive. Also, calcium carbonate was added to the mixture for adjusting the pH to 7 [35].
2.7.2. Fungal Inoculum Preparation
Inoculums of F. oxysporum and R. solani were prepared using sorghum/coarse sand/water (2:1:2 v/v/m) medium. All components were combined, packed and sterilized for 2 h. Agar discs, obtained from the edge of 5-day-old culture of each investigated fungus were inoculated into the sterilized medium. After two weeks of incubation at 30 °C, fungal inoculums became available for soil infestation [36].
2.7.3. Soil Infestation
Inoculums of F. oxysporum and R. solani were added independently to the soil surface of each pot at the rate of 2% w/w, and then coated with a thin film of autoclaved soil. The infested pots were irrigated and reserved for 7 days before sowing.
2.7.4. Disease Assessment
Disease assessment was estimated as a percentage of damping-off (pre- and post-emergence) after 7 and 21 days from sowing, respectively, using the following formula:
% Pre-emergence = No. of non-emerged seedlings/No. of sown seeds × 100
% Post-emergence = No. of dead emerged seedlings/No. of sown seeds × 100
% Damping-off = % Pre-emergence + % Post-emergence
2.7.5. Greenhouse Experiment
A pots experiment was performed to study the effect of the formulated P. aeruginosa F2 and P. fluorescens JY3 for the biocontrol of F. oxysporum isolate A and R. solani. Pots (18 × 18 cm diameter) containing sterilized soil infested as previously declared. Nine treatments were performed as follows: (1) F. oxysporum; (2) R. solani; (3) untreated and uninfected control (healthy); (4) P. aeruginosa F2 formulation; (5) P. fluorescens JY3 formulation; (6) F2 formulation + F. oxysporum; (7) JY3 formulation + F. oxysporum; (8) F2 formulation + R. solani and (9) JY3 formulation + R. solani. Five wheat seeds were sown per pot, three replicate (pots) were used for each treatment. Seeds of wheat were treated with the formulations as seed drench at a dose of 10 g kg−1 of seeds. Formulations were applied twice at a dose of 3 kg acre−1, 15 and 30 days after seed sowing as a soil drench.
2.8. Statistical Analysis
Analysis of variance (ANOVA) was used to analyze the results achieved in this study using CoStat software. The least significant difference (LSD) at P ≤ 0.05 level of probability was utilized for detecting significant differences among treatments.
3. Results
3.1. Isolation of Fluorescent Pseudomonas Isolates
Sixteen fluorescent Pseudomonas isolates were isolated using King’s B medium (Table 1). The green fluorescent colonies were picked up under UV light, and further purified by repeated streaking (single colony) on the same medium, and examined under light microscope.
3.2. Screening for Siderophores Production
All bacterial isolates were screened qualitatively and quantitatively for siderophore production.
In a primary step, qualitative screening has been performed using CAS agar plates. All isolates that formed a yellow to orange zone around the pure colony indicated a positive siderophore production. In addition, in the agar well diffusion method, when cell-free supernatant of each culture was applied to the wells of CAS agar plates, a yellow to orange halo was observed around the wells that indicates the production of siderophores (Figure 1A). In order to confirm previously obtained results, siderophores produced by all bacterial isolates were quantitatively measured in liquid cultures. P. fluorescens JY3 and P. aeruginosa F2 showed the highest production of siderophores (1.758% and 1.749%, respectively). Also, P. aeruginosa F7 and F8 that were isolated in the current work gave a high percentage of siderophore production but P. fluorescens JY8 showed the lowest production of siderophores (0.011%) in a fixed 10 µL using succinic medium (Figure 1B).
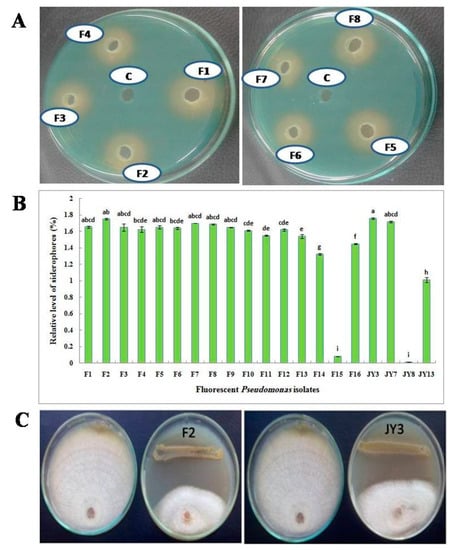
Figure 1.
(A) Qualitative assay of siderophore production on chrome azurol S (CAS) agar plates using supernatant of some fluorescent Pseudomonas isolates; (B) Relative level of siderophores produced by fluorescent Pseudomonas isolates grown on succinic medium using CAS assay and (C) antagonistic effect of Pseudomonas aeruginosa F2 and Pseudomonas fluorescens JY3 against Fusarium solani, plate on the left in each photo is the corresponding control without the antagonist (data are presented in Table 2).
3.3. Antagonistic Effect of Fluorescent Pseudomonad Isolates (Dual Culture Method)
This experiment aimed to investigate the antagonistic effect of the experimental Pseudomonas isolates on the growth of some tested plant pathogenic fungi using dual culture technique. Isolate F2 was the most efficient isolate in inhibiting the mycelial growth of all tested pathogens. On the other hand, isolates F14, F15, F16, JY7, JY8 and JY13 showed a weak antagonistic activity (Table 2). All tested Pseudomonas isolates showed antagonistic activity against Alternaria sp. except Pseudomonas isolates F14, F15, F16 and JY13. Pseudomonas isolate F5 followed by isolates F2, F9 and F10, which showed no significant differences among each other, were the most effective isolates in inhibiting the mycelial growth of Alternaria sp. Meanwhile, F2 had more antagonistic activity than the other fluorescent Pseudomonas isolates on F. calmorum. All Pseudomonas isolates showed antagonistic activity against F. oxysporum isolate A except F16, JY7, JY8 and JY13, where Pseudomonas isolate F1 had a more-antagonistic effect on F. oxysporum isolate A compared to the other isolates followed by F7. Pseudomonas isolates F1 and F2 followed by F4 and F5 followed by F7 and F8 were the most effective isolates in inhibiting the mycelial growth of F. oxysporum isolate B, but Pseudomonas isolate F2 had more antagonistic activity than the other fluorescent Pseudomonas isolates on F. solani and R. solani (Figure 1C).
Table 2.
Antagonistic effects of fluorescent Pseudomonas isolates against growth of some phytopathogenic fungi using the dual culture method.
3.4. Molecular Identification of Bacterial Isolates
Pseudomonas isolates F2, F7 and F8, which produced a higher percentage of siderophore production than the other Pseudomonas isolates isolated in the current study, were identified based on sequencing of 16S rRNA gene. A database search to identify the bacterial isolates was achieved in BLAST search at the National Center for Biotechnology Information site (http://www.ncbi.nlm.nih.gov). Blast results revealed that sequences of isolates F2, F7 and F8 were almost similar to several P. aeruginosa strains with homology percentage of 99%. Pseudomonas isolates F2, F7 and F8 were identified as P. aeruginosa with accession numbers of MG210480, MG076939 and MG210481, respectively (Table 1). A phylogenetic tree of the 16S rRNA gene that was generated using the nucleotide sequences of the fluorescent Pseudomonas isolates F2, F7 and F8 (obtained in the current investigation) and other pseudomonad 16S rRNA gene sequences (obtained from GenBank database) revealed that two major clusters exist. Cluster 1 included Cellvibrio ostraviensis, while all fluorescent Pseudomonas isolates obtained in this study and provided from GenBank database were clustered in cluster 2. This cluster is divided into two groups: the first group included P. aeruginosa F2, F7 and F8 with the other P. aeruginosa strains provided from GenBank; while the second group contained P. fluorescens, P. putida, P. chlororaphis, P. syringae and P. meliae (Figure 2).
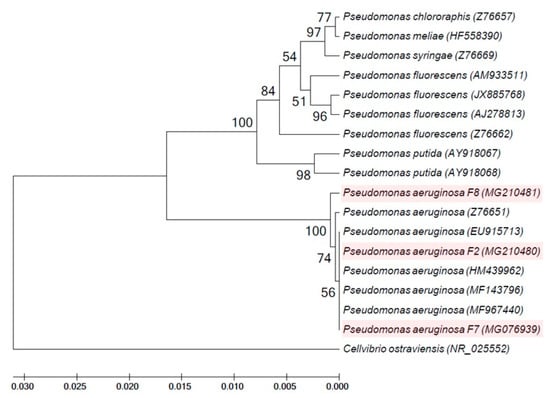
Figure 2.
Phylogenetic tree of fluorescent Pseudomonas isolates F2, F7 and F8 obtained in the current study and validly described members of the genus Pseudomonas based on the nucleotide sequences of the 16S rRNA gene. Phylogenetic tree was constructed with UPGMA method using MEGA version 5 and the number of bootstraps replications is 2000.
3.5. Batch Fermentation
Batch fermentation technique in the bioreactor was used in this study to enhance siderophores production from P. aeruginosa F2 and P. fluorescens JY3 compared to cultivation in shake flasks, which produced a low relative level of siderophores in our previous study. Batch fermentation was performed using P. aeruginosa F2 and P. fluorescens JY3 in a 10-L bench-top bioreactor (Cleaver, Saratoga, CA, USA), where both isolates produced a higher percentage of siderophores production than the other Pseudomonas isolates that were screened in the current work. Figure 3A shows the relative level of siderophores, cell biomass, glucose and glycerol concentrations of the culture broth of P. aeruginosa F2 plotted against time. Cell biomass of P. aeruginosa F2 increased slowly during lag phase, which continued for 5 h. After that, the culture entered exponential phase (log phase) where the biomass increased rapidly with a constant specific growth rate, µ of 0.043 h−1. The dissolved oxygen decreased as a result of the increasing demand for O2 that is required for bacterial growth (Figure 3B). To assure sufficient oxygen provided, oxygen was maintained at over 30% by increasing the agitation rate. After 41 h the dissolved oxygen was increased gradually until the end of the run. The maximum biomass achieved was 10.3 g L−1 at 38 h. Relative level of siderophores reached 1.91% at 12 h but it accomplished its maximum value of 31.9% at 40 h. Glycerol concentration decreased slowly and it was not fully consumed as its value reached 4.5 g L−1 at 50 h but glucose concentration decreased rapidly and it was fully consumed at 26 h. Relative level of siderophores, biomass and glycerol concentration in the culture broth of P. fluorescens JY3 against time are shown in Figure 4A, where relative level of siderophores achieved was 1.97% at 12 h, reaching its maximum value of 23.9% at 48 h. Moreover, the maximum biomass achieved was 5.2 g L−1 at 24 h and glycerol concentration decreased gradually to reach 0.25 g L−1 at 52 h. P. fluorescens JY3 cell biomass increased exponentially with specific growth rate, µ of 0.096 h−1. The dissolved oxygen decreased rapidly and reached 30% in the first hour, so that, motor speed was increased and accordingly agitation rate increased until 6 h, consequently, dissolved oxygen increased rapidly as a result of increasing agitation speed (Figure 4B).
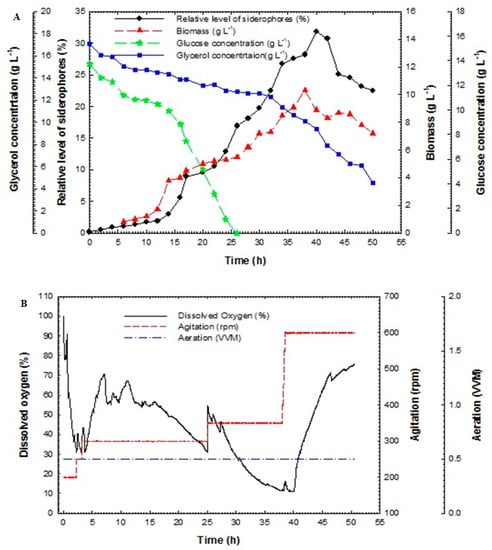
Figure 3.
(A) Relative level of siderophores, biomass, glucose concentration and glycerol concentration as a function of time for batch fermentation culture broth of Pseudomonas aeruginosa F2 and (B) dissolved oxygen, agitation and aeration as a function of time during batch fermentation of Pseudomonas aeruginosa F2.
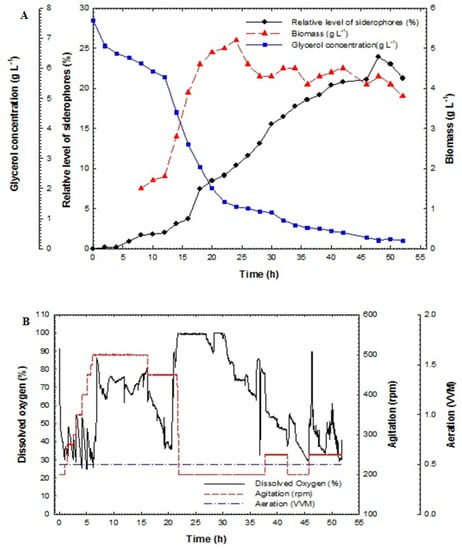
Figure 4.
(A) Relative level of siderophores, biomass and glycerol concentration as a function of time for batch fermentation culture broth of Pseudomonas fluorescens JY3 and (B) dissolved oxygen, agitation and aeration as a function of time during batch fermentation of Pseudomonas fluorescens JY3.
3.6. Fed-Batch Fermentation
Maximization of siderophores production from P. aeruginosa F2 and P. fluorescens JY3 was completed using fed-batch technique. Fed-batch fermentation was carried out in a 10-L bench-top bioreactor (Cleaver, Saratoga, USA) using P. aeruginosa F2 and P. fluorescens JY3, which produced the highest percentage of siderophores production compared to other Pseudomonas isolates screened in this study. The fed-batch process was started with a batch phase and completed using a fed-batch phase using exponential feed rate. The fed-batch stage initiated with the addition of the feeding medium using an exponential feeding type of prearranged feed rate. The feeding started with an initial rate of 1.5 mL min−1 until it reached the final rate of 22.5 mL min−1. Figure 5A illustrates relative level of siderophores, biomass and glucose/glycerol concentration of the culture broth of P. aeruginosa F2 as a function of time. During the batch step, the culture grew exponentially with a constant specific growth rate. Dissolved oxygen decreased quickly during the exponential phase due to the increasing demand for O2 that is required for the growing cell mass. The oxygen was held in reserve at above 30% by controlling motor speed and consequently agitation rate (Figure 5B).
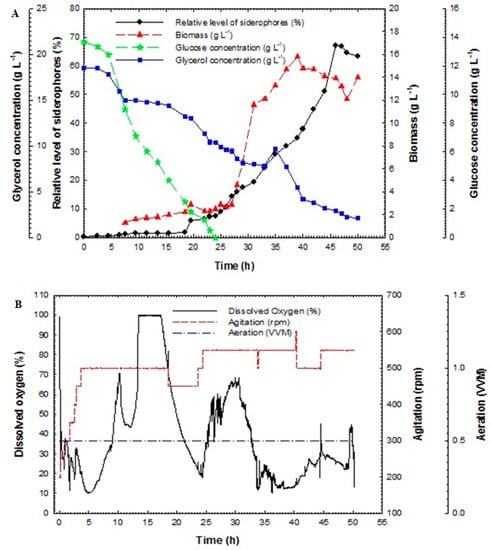
Figure 5.
(A) Relative level of siderophores, biomass, glucose concentration and glycerol concentration as a function of time for fed-batch fermentation culture broth of Pseudomonas aeruginosa F2 and (B) dissolved oxygen, agitation and aeration as a function of time during fed-batch fermentation of Pseudomonas aeruginosa F2.
The relative level of siderophores reached 1.8% at 18 h and then increased rapidly to achieve 37.8% at 40 h but it reached its maximum value of 67.05% at 46 h. The maximum biomass was 15.8 g L−1 at 39 h. Glucose concentration decreased rapidly and it was fully consumed at 24 h. In addition, glycerol concentration decreased slowly and was not fully consumed at 24 h; its value reached 10.36 g L−1. After feeding, the glycerol concentration increased for a short period and then decreased rapidly to near zero at the end of the run.
In thecase of P. fluorescens JY3, cell biomass increased exponentially with a specific growth rate. The relative level of siderophores, biomass and glycerol concentration against time are shown in Figure 6A. The relative level of siderophores reached 1.92% at 16 h and increased rapidly to reach 19.24% at 36 h, achieving its maximum value of 45.59% at 48 h. The maximum biomass achieved was 13.7 g L−1 at 44 h. Glycerol concentration decreased gradually and reached 2.89 g L−1 at 24 h. After feeding, glycerol concentration increased gradually for some time to reach 4.75 g L−1 at 42 h and decreased again to reach 2.85 g L−1 at the end of the process. The dissolved oxygen decreased rapidly, therefore the concentration of oxygen was restricted to a value of 30% by increasing the speed of motor to the desired agitation rate. The rise of the agitation rate resulted in an increase in the dissolved oxygen concentration in the medium until 8 h; after this point dissolved oxygen increased gradually. Once feeding starts, the dissolved oxygen decreased rapidly, and consequently the agitation speed was increased gradually (Figure 6B). The fed-batch fermentation technique produced the highest percentage of relative level of siderophores of all methods, so cultures of P. aeruginosa F2 and P. fluorescens JY3 obtained by fed-batch fermentation were used for the preparation of talc formulations to be utilized as biocontrol agents.
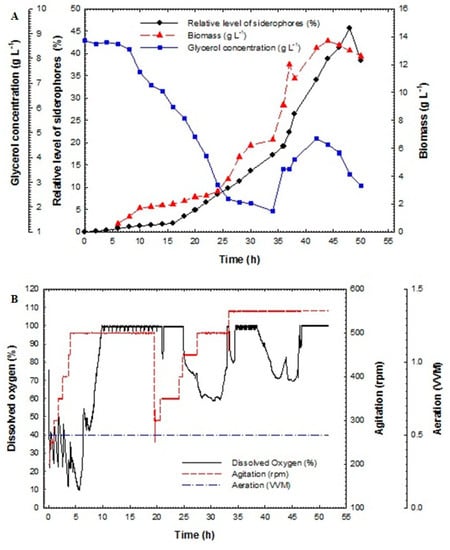
Figure 6.
(A) Relative level of siderophores, biomass and glycerol concentration as a function of time for fed-batch fermentation culture broth of Pseudomonas fluorescens JY3 and (B) dissolved oxygen, agitation and aeration as a function of time during fed-batch fermentation of Pseudomonas fluorescens JY3.
3.7. In-Vivo Antagonistic Effect of P. aeruginosa F2 and P. fluorescens JY3 against Some Phytopathogenic Fungi
Formulations of siderophores-producing Pseudomonas isolates using talc powder as a carrier were applied as biocontrol agents in a soil infested with F. oxysporum and R. solani. Wheat seeds were treated with the formula and sown after seven days of soil infestation. Damping-off percentage and reduction percentage were evaluated. In addition, fresh and dry weights of shoots and roots were weighed. Formulations of P. aeruginosa F2 and P. fluorescens JY3, which produced a higher percentage of siderophores production than other Pseudomonas isolates used in this work, were effective in reducing damping-off caused by F. oxysporum and R. solani compared to the control infested with plant pathogens. Damping-off percentage caused by F. oxysporum and R. solani reached 33.3% and 53.3%, respectively. Meanwhile, treatments using formulations of F2 and JY3 in a soil infected with F. oxysporum were effective in reducing damping-off percentage, which was decreased to reach 6.67% with a reduction percentage of 80%. Formulation of P. aeruginosa F2 in a soil infected with R. solani was more effective in reducing damping-off percentage compared to the formulation of P. fluorescens JY3, as the damping-off percentage recorded 6.67% and 20% with a reduction percentage of 87.49% and 62.5%, respectively (Table 3). Both formulations stimulated the growth of wheat plants in a soil infected with F. oxysporum and R. solani compared to the other control treatments inoculated with each fungus alone. Fresh and dry weights of shoots and roots increased significantly in treatments with formulations of P. aeruginosa F2 and P. fluorescens JY3 in a soil infected with plant pathogenic fungi. Treatment using formulation of F2 in a soil infected with F. oxysporum increased the fresh weights of shoots and roots of wheat plants, which reached 3.77 g and 3.3 g with increase percentages of 45.09% and 49.39%, respectively. Whereas, there was a 3.33 g and 2.93 g increase in fresh weights of shoots and roots, with increased percentage to 37.84% and 43%, respectively, in the case of treatment using JY3 formulation. In comparison with F. oxysporum treatment alone, fresh weights of shoots and roots reached 2.07 g and 1.67 g, respectively. Fresh weights of shoots were 3.53 g and 3.27 g with increase percentage of 72.52% and 70.34% in treatments using F2 and JY3 formulation in a soil infected with R. solani, respectively, compared to treatment using the fungus alone that recorded 0.97 g. The fresh weights of roots reached 3.1 g and 2.83 g with an increased percentage of 80.65% and 78.8% using the same formulations in comparison with treatment using the fungus alone that reached 0.6 g (Table 4). The results of dry weights of shoots and roots obtained in this study elucidated the efficiency of treatments using formulations of P. aeruginosa F2 and P. fluorescens JY3 in increasing the dry weights of shoots in a soil infected with F. oxysporum and R. solani. The increase in shoot dry weight reached 2.83 g, 2.47 g, 2.63 g and 2.37 g, with increased percentage of 63.6%, 58.3%, 87.45% and 86.08%, respectively while the dry weights of shoots in the case of treatments using F. oxysporum and R. solani reached 1.03 g and 0.33 g, respectively. The dry weights of roots recorded 2.3 g, 2.03 g, 2.2 g and 1.83 g, with increase percentage of 55.22%, 49.26%, 91.82% and 90.16%, respectively. Whereas treatments using F. oxysporum and R. solani recorded 1.03 g and 0.18 g, respectively (Table 4).
Table 3.
Effect of culture formulations of Pseudomonas aeruginosa F2 and Pseudomonas fluorescens JY3 on damping-off of wheat plants caused by Fusarium oxysporum and Rhizoctonia solani.
Table 4.
Effect of culture formulations of Pseudomonas aeruginosa F2 and Pseudomonas fluorescens JY3 on fresh and dry weight of shoots and roots of wheat plants.
4. Discussion
Siderophores are produced by several microorganisms such as Pseudomonas, Enterobacter and Escherichia coli [5,8,37,38]. In our study, twenty siderophores-producing Pseudomonas isolates were evaluated as biocontrol agents for their in-vitro antagonistic effect against the growth of some plant pathogenic fungi (Alternaria spp., F. culmorum, F. oxysporum isolate A, F. oxysporum isolate B, F. solani and R. solani). P. aeruginosa isolate F2 was more effective in significantly inhibiting the mycelial growth of all the tested fungi than other Pseudomonas isolates. These results are in harmony with the results obtained by Pàez et al., 2005 who reported that P. aeruginosa was more efficient than P. fluorescens in inhibiting some plant pathogenic fungi [39]. Also, Sasirekha and Srividya (2016) reported that siderophores-producing P. aeruginosa FP6 had antagonistic activity against R. solani [40]. Also, Islam et al., 2018 showed that P. aeruginosa RKA5 inhibited mycelia growth of F. oxysporum f. sp. cucumerinum [41]. On the other hand, Ahmedzedah et al., 2006 reported that 13 out of 47 fluorescent Pseudomonas isolates showed antagonistic effects against Fusarium sp. and R. solani [42].
The optimal performance of the upstream processing using on-line and off-line sensors in the two basic types of fermentation (batch, and fed-batch) was studied. Batch and fed-batch fermentation processes were accomplished to enhance the cell biomass and to achieve high concentrations of siderophores. In batch fermentation of P. aeruginosa F2 and P. fluorescens JY3, cells grew rapidly after the lag phase, which continued for 5 h. Biomass was subsequently increased exponentially with a constant specific growth rate of 0.043 h−1 and 0.096 h−1, respectively, within the exponential phase. Batch fermentation of isolates F2 and JY3 in the bioreactor produced the highest concentration of biomass and siderophores. In isolate F2, maximum values of 10.3 g L−1 at 38 h and 31.9% at 40 h, respectively, were reached, while values of 5.2 g L−1 at 42 h and 23.9% at 48 h were recorded for isolate JY3, respectively. On the other hand, maximum biomass of P. aeruginosa PAO1 and P. fluorescens NCIM5096 was 1.6 and 1.96 g L−1, respectively [8,43]. Maximization of biomass and siderophores concentration in the bioreactor may be related to optimal conditions of pH, agitation, and aeration, which are provided by the bioreactor for cell growth and production of siderophores. Batch fermentation could not obtain high cell density and high concentration of product because cells suffer from substrate inhibition and catabolite repression. Accumulation of by-products such as acetic acid and propionic acid during batch fermentation was documented [9,44,45]. High partial pressure of CO2, high concentration of carbon source and high specific growth rate might be responsible for the accumulation of by-products that cause suppression of bacterial growth and production of products [46]. So, to obtain high cell density and high concentrations of siderophores, fed-batch fermentation is favored to reduce by-products production and to get rid of substrate suppression. Exponential fed-batch fermentation of P. aeruginosa F2 and P. fluorescens JY3 gave higher cell mass and siderophores concentration than batch fermentation. Biomass and siderophore estimation of P. aeruginosa F2 reached its maximum value of 15.8 g L−1 at 39 h and 67.05% at 46 h, respectively while they reached 13.7 g L−1 at 44 h and 45.59% at 48 h by P. fluorescens JY3, respectively. Sarma et al., 2010, obtained high cell density from fluorescent pseudomonad R81 using fed-batch fermentation [9].
The fact that P. aeruginosa is classified as a risk group 2 biological agent that rarely represents a serious health threat to human is evident [47,48,49]. In addition, the fact that this organism was isolated from the rhizosphere of edible plants from agricultural fields, as a member of the natural microflora found in the native soil, gave us confidence to continue working with this microorganism. Therefore, the current study used P. aeruginosa, as an effective biocontrol agent. Formulations of siderophores-producing Pseudomonas isolates, which were used as biocontrol agents in a soil infected with F. oxysporum and R. solani, were efficient in decreasing damping-off. The biocontrol mechanism of siderophores-producing fluorescent pseudomonads could be explained by their ability to chelate and reduce the amount of ferric ions available in rhizosphere (competition for iron nutrition). By this means, siderophores-producing fluorescent pseudomonads may restrict plant pathogens in the rhizosphere and reduce their ability to colonize plant roots. In addition, siderophores-producing fluorescent pseudomonads can induce plant systemic resistance, which reduces the pathogen infection. Other mechanisms, in addition to siderophores production by fluorescent pseudomonads, were reported that may help in suppressing and controlling fungal pathogens, such as the production of antifungal compounds and lytic enzymes. Solans et al., 2016 studied the role of siderophores as biocontrol agents [50] whereas Arya et al., 2018 revealed that tomato seedlings inoculated with P. fluorescens strains SPs9 and SPs20, which are able to produce siderophores in the soil infected with F. oxysporum, succeeded in controlling wilt disease with high efficiency [5]. Leeman et al., 1996 reported that siderophore-producing P. fluorescens induced systemic resistance against Fusarium wilt of radish [51]. Formulation of siderophores-producing P. aeruginosa F2 and P. fluorescens JY3 were sufficient in increasing fresh and dry weights of shoots and roots of wheat plants. These results may due to the ability of both isolates to induce the plant to produce some phytohormones such as auxin, cytokinin, and gibberellins. Also, may be related to the capability of plant to recognize the microbial Fe-siderophores complex and consequently iron uptake from this complex (iron nutrition). In an agreement with the current findings, Sharma et al., 2003 showed increasing iron, chlorophyll a, and chlorophyll b concentrations of Vigna radiate plants when they were inoculated with siderophore-producing Pseudomonas strain GRP3 [52]. Additionally, our results were in agreement with Sayyed et al., 2005 and Manwar et al., 2000, who documented that inoculation with P. fluorescens enhanced seed germination, shoot and root length of wheat [8,53]. Arya et al., 2018, reported that siderophores-producing P. fluorescens strain SPs9 and SPs20 were effective in increasing fresh and dry weight of tomato plants in a soil infected with F. oxysporum [5]. The same results were obtained by inoculating Triticum aestivum with fluorescent pseudomonad R62 [54].
5. Conclusions
In this study, scaling-up production of siderophores from fluorescent pseudomonads was accomplished using fermentation technology. Exponential fed-batch fermentation of P. aeruginosa F2 and P. fluorescens JY3 gave higher concentrations of siderophores and biomass than batch fermentation. Formulations of siderophores-producing fluorescent pseudomonads were effective in controlling soil-borne fungi and for stimulation of plant growth. These formulations can therefore be utilized as plant growth promoters and biocontrol agents.
Author Contributions
G.A.A.-Z. planned and designed the research; A.S.A. performed the experiments; G.A.A.-Z. and A.S.A. wrote the manuscript; N.A.-M.S., E.E.E.-S., S.M.M. and S.A.-F.S. revised the manuscript. All authors have read and agreed to the published version of the manuscript.
Funding
This research received no external funding.
Acknowledgments
The authors would like to thank the City of Scientific Research and Technological Applications for housing and facilitating this work. The authors also thank Kenawy, A.M. of the City of Scientific Research and Technological Applications, Alexandria, Egypt for critical reading and revision.
Conflicts of Interest
Authors declare there is no conflict of interest.
References
- Neilands, J.B. Microbial iron compounds. Annu. Rev. Biochem. 1981, 50, 715–731. [Google Scholar] [CrossRef] [PubMed]
- Hider, R.C.; Kong, X. Chemistry and biology of siderophores. Nat. Prod. Rep. 2010, 27, 637–657. [Google Scholar] [CrossRef] [PubMed]
- Kurth, C.; Kage, H.; Nett, M. Siderophores as molecular tools in medical and environmental applications. Org. Biomol. Chem. 2016, 14, 8212–8227. [Google Scholar] [CrossRef] [PubMed]
- Kloepper, J.W.; Leong, J.; Teintze, M.; Schroth, M.N. Enhancing plant growth by siderophores produced by plant growth-promoting rhizobacteria. Nature 1980, 286, 885–886. [Google Scholar] [CrossRef]
- Arya, N.; Rana, A.; Rajwar, A.; Sahgal, M.; Sharma, A.K. Biocontrol efficacy of siderophore producing indigenous pseudomonas strains against fusarium wilt in tomato. Natl. Acad. Sci. Lett. 2018, 41, 133–136. [Google Scholar] [CrossRef]
- Gupta, C.P.; Dubey, R.C.; Maheshwari, D.K. Plant growth enhancement and suppression of Macrophomina phaseolina causing charcoal rot of peanut by fluorescent Pseudomonas. Biol. Fertil. Soils 2002, 35, 399–405. [Google Scholar]
- Yu, S.; Teng, C.; Liang, J.; Song, T.; Dong, L.; Bai, X.; Jin, Y.; Qu, J. Characterization of siderophore produced by Pseudomonas syringae BAF.1 and its inhibitory effects on spore germination and mycelium morphology of Fusarium oxysporum. J. Microbiol. 2017, 55, 877–884. [Google Scholar] [CrossRef]
- Sayyed, R.Z.; Badgujar, M.D.; Sonawane, H.M.; Mhaske, M.M.; Chincholkar, S.B. Production of microbial iron chelators (Siderophores) by fluorescent Pseudomonads. Ind. J. Biotechnol. 2005, 4, 484–490. [Google Scholar]
- Sarma, M.; Saharan, K.; Kumar, L.; Gautam, A.; Kapoor, A.; Srivastava, N.; Sahai, V.; Bisaria, V. Process optimization for enhanced production of cell biomass and metabolites of fluorescent pseudomonad r81. Int. J. Biomed. Biol. Eng. 2010, 4, 388–392. [Google Scholar]
- Shaikh, S.; Wani, S.; Sayyed, R. Statistical-based optimization and scale-up of siderophore production process on laboratory bioreactor. 3 Biotech 2016, 6, 69. [Google Scholar] [CrossRef]
- Paulová, L.; Patáková, P.; Brányik, T. Advanced fermentation processes. In Engineering Aspects of Food Biotechnology; Teixeira, J., Vincente, A.A., Eds.; Taylor & Francis Group: Milton Park, UK, 2016; pp. 90–99. [Google Scholar]
- Abo-Zaid, G.A.; Wagih, E.E.; Matar, S.M.; Ashmawy, N.A.; Hafez, E.E. Scaling-up production of pyocyanin from Pseudomonas aeruginosa JY21 as biocontrol agent against certain plant pathogenic fungi. Int. J. ChemTech Res. 2015, 8, 213–224. [Google Scholar]
- Shuler, M.L.; Kargi, F. Bioprocess Engineering Basic Concepts, 2nd ed.; Prentice-Hall PTR: Upper Saddle River, NJ, USA, 2002. [Google Scholar]
- Matar, S.M.; El-Kazzaz, S.A.; Wagih, E.E.; El-Diwany, A.I.; Moustafa, H.E.; El-Saadani, M.A.; Abo-Zaid, G.A.; Hafez, E.E. Bioprocessing and scaling-up cultivation of Bacillus subtilis as a potential antagonist to certain plant pathogenic fungi, III. Biotechnology 2009, 8, 138–143. [Google Scholar] [CrossRef][Green Version]
- Huang, H.; Ridgway, D.; Moo-Young, T.G.M. Enhanced amylase production by Bacillus subtilis using a dual exponential feeding strategy. Bioprocess Biosyst. Eng. 2004, 27, 63–69. [Google Scholar] [CrossRef] [PubMed]
- Luli, G.W. The Influence of Glucose Metabolism on High Cell Density Fermentation. Ph.D. Thesis, Ohio State University, Columbus, OH, USA, 1988. [Google Scholar]
- Lee, J.H.; Hong, J.; Lim, H.C. Experimental optimization of fed-batch culture for poly-β-hydroxybutyric acid production. Biotechnol. Bioeng. 1997, 56, 697–705. [Google Scholar] [CrossRef]
- Salwa, M.S.; Asshifa, M.N.N.; Amirul, A.A.; Yahya, A.R.M. Different feeding strategy for the production of biosurfactant from Pseudomonas aeruginosa USM AR2 in modified bioreactor. Biotechnol. Bioprocess Eng. 2009, 14, 763–768. [Google Scholar] [CrossRef]
- Lotfabad, T.B.; Tayyebi, S.; Roostaazad, R. Kinetic Measurements for Pseudomonas aeruginosa MR01 during biosurfactant production in two-phase system and developing a double-exponential model for viable cell profile. World Appl. Sci. J. 2013, 22, 809–816. [Google Scholar]
- Ju, X.; Yu, H.L.; Pan, J.; Xu, J.H. Improved production of Pseudomonas sp. ECU1011 acetyl esterase by medium design and fed-batch fermentation. Bioprocess Biosyst. Eng. 2012, 35, 323–331. [Google Scholar] [CrossRef]
- Radha, S.; Prasad, T.H.; Devi, N.S.; Mamata, S. Fed batch and batch submerged fermentation for alkaline protease production from mixed consortium of Pseudomonas putida and Staphylococcus aureus. Adv. Appl. Sci. Res. 2014, 5, 315–324. [Google Scholar]
- Buyer, J.S.; Leong, J. Iron transport-mediated antagonism between plant growth-promoting and plant-deleterious Pseudomonas strains. J. Biol. Chem. 1986, 261, 791–794. [Google Scholar]
- Kenawy, A.; Dailin, D.J.; Abo-Zaid, G.A.; Abd Malek, R.; Ambehabati, K.K.; Zakaria, K.H.; Sayyed, R.Z.; Enshasy, H.A. Biosynthesis of antibiotics by PGPR and their roles in biocontrol of plant diseases. In Plant Growth Promoting Rhizobacteria for Sustainable Stress Management; Sayyed, R.Z., Ed.; Springer: Singapore, 2019; pp. 1–36. [Google Scholar]
- De Boer, M.; Bom, P.; Kindt, F.; Keurentjes, J.J.B.; van der Sluis, I.; Van Loon, L.C.; Bakker, P.A. Control of Fusarium wilt of radish by combining Pseudomonas putida strains that have different disease-suppressive mechanisms. Phytopathology 2003, 93, 626–632. [Google Scholar] [CrossRef]
- Schmidt, W. Mechanisms and regulation of reduction-based iron uptake in plants. New Phytol. 1999, 141, 1–26. [Google Scholar] [CrossRef]
- Vansuyt, G.; Robin, A.; Briat, J.F.; Curie, C.; Lemanceau, P. Iron acquisition from Fe-pyoverdine by Arabidopsis thaliana. Mol. Plant Microbe Interact. 2007, 20, 441–447. [Google Scholar] [CrossRef] [PubMed]
- Schywn, B.; Neilands, J.B. Universal chemical assay for the detection and determination of siderophores. Anal. Biochem. 1987, 160, 47–56. [Google Scholar] [CrossRef]
- Meyer, J.M.; Abdallah, M.A. The fluorescent pigment of Pseudomonas fluorescens: Biosynthesis, purification and physicochemical properties. J. Gen. Microbiol. 1978, 107, 319–328. [Google Scholar] [CrossRef]
- Toure, Y.; Ongena, M.; Jacques, P.; Guiro, A.; Thonart, P. Role of lipopeptides produced by Bacillus subtilis GA1 in the reduction of grey mould disease caused by Botrytis cinerea on apple. J. Appl. Microbiol. 2004, 96, 1151–1160. [Google Scholar] [CrossRef] [PubMed]
- Istock, C.A.; Ferguson, N.; Istock, N.L.; Duncan, K.E. Geographical diversity of genomic lineages in Bacillus subtilis (Ehrenberg) Cohn sensulato. Org. Divers. Evol. 2001, 1, 179–191. [Google Scholar] [CrossRef]
- Matar, S.M.; El-Kazzaz, S.A.; Wagih, E.E.; El-Diwany, A.I.; Hafez, E.E.; Moustafa, H.E.; Abo-Zaid, G.A.; Serour, E.A. Molecular characterization and batch fermentation of Bacillus subtilis as biocontrol agent II. Biotechnology 2009, 8, 35–43. [Google Scholar] [CrossRef]
- Abo-Zaid, G.A.; Abdullah, A.S.; Soliman, N.A.; El-Sharouny, E.E.; Sabry, S.A. Optimization of siderophores production from fluorescent pseudomonads using statistical experimental designs. Biosci. Res. 2018, 15, 3040–3051. [Google Scholar]
- Van Dam-Mieras, M.C.E.; Jeu, W.H.; Vries, J.; Currell, B.R.; James, J.W.; Leach, C.K.; Patmore, R.A. Techniques Used in Bioproduct Analysis; Butterworth-Heinemann Ltd.: Oxford, UK, 1992. [Google Scholar]
- Bok, S.H.; Demain, A.L. An Improved Calorimetric Assay for Polyols. Anal. Biochem. 1977, 81, 18–20. [Google Scholar] [CrossRef]
- Vidhyasekaran, P.; Muthamilan, M. Development of formulation of Pseudomonas fluorescens for control of chickpea wilt. Plant Dis. 1995, 79, 782–786. [Google Scholar] [CrossRef]
- Hussien, Z.N.; Mahmoud, E.Y.; Metwaly, A.H.; Sobhy, H.M. Effect of some antagonistic bacteria in reducing of peanut damping-off, root and pod rot incidence caused by Rhizoctonia solani. J. Plant Prot. Pathol. 2012, 3, 1173–1187. [Google Scholar]
- Omidvari, M.; Sharifi, R.A.; Ahmadzadeh, M.; Dahaji, P.A. Role of fluorescent pseudomonads siderophore to increase bean growth factors. J. Agric. Sci. 2010, 2, 242–247. [Google Scholar] [CrossRef]
- Sulochana, M.B.; Jayachandra, S.Y.; Kumar, S.K.A.; Dayanand, A. Antifungal attributes of siderophore produced by the Pseudomonas aeruginosa JAS-25. J. Basic Microbiol. 2014, 54, 418–424. [Google Scholar] [CrossRef] [PubMed]
- Páez, M.; Martínez-Nieto, P.; Bernal-Castillo, J. Siderophores producing Pseudomonas as pathogenic Rhizoctonia solani and Botrytis cinerea antagonistis. Univ. Sci. 2005, 10, 65–74. [Google Scholar]
- Sasirekha, B.; Srividya, S. Siderophore production by Pseudomonas aeruginosa FP6, a biocontrol strain for Rhizoctonia solani and Colletotrichum gloeosporioides causing diseases in chilli. Agric. Nat. Res. 2016, 50, 250–256. [Google Scholar] [CrossRef]
- Islam, M.A.; Nain, Z.; Alam, M.K.; Banu, N.A.; Islam, M.R. In vitro study of biocontrol potential of rhizospheric Pseudomonas aeruginosa against Fusarium oxysporum f. sp. cucumerinum. Egypt. J. Biol. Pest Control 2018, 28, 90. [Google Scholar] [CrossRef]
- Ahmadzadeh, M.; Afsharmanesh, H.; Nikkhah, M.J.; Tehrani, A.S. Identification of some molecular traits in fluorescent pseudomonads with antifungal activity. Iran. J. Biotechnol. 2006, 4, 245–253. [Google Scholar]
- Sabra, W.; Kim, E.J.; Zeng, A.P. Physiological responses of Pseudomonas aeruginosa PAO1 to oxidative stress in controlled microaerobic and aerobic cultures. Microbiology 2002, 148, 3195–3202. [Google Scholar] [CrossRef]
- Park, Y.S.; Kai, K.; Lijima, S.; Kobayashi, T. Enhanced β-galactosidase production by high cell-density culture of recombinant Bacillus subtilis with glucose concentration control. Biotechnol. Bioeng. 1992, 40, 686–696. [Google Scholar] [CrossRef]
- Yee, L.; Blanch, H.W. Recombinant trypsin production in high cell density fed-batch cultures in Escherichia coli. Biotechnol. Bioeng. 1993, 41, 781–790. [Google Scholar] [CrossRef]
- Lee, S.Y. High cell-density culture of Escherichia coli. Trends Biotechnol. 1996, 14, 98–105. [Google Scholar] [CrossRef]
- Chosewood, L.C.; Wilson, D.E. Biosafety in Microbiological and Biomedical Laboratories, 5th ed.; HHS Publication: Washington, DC, USA, 2009; pp. 9–19. [Google Scholar]
- OECD. Bacteria: Pathogenicity factors. In Safety Assessment of Transgenic Organisms in the Environment; OECD Consensus Documents; OECD Publishing: Paris, France, 2016; Volume 5, pp. 27–79. [Google Scholar]
- Blacksell, S.D.; Robinson, M.T.; Newton, P.N.; Ruanchaimun, S.; Salje, J.; Wangrangsimakul, T.; Wegner, M.D.; Abdad, M.Y.; Bennett, A.M.; Richards, A.L.; et al. Biosafety and biosecurity requirements for Orientia spp. diagnosis and research: Recommendations for risk-based biocontainment, work practices and the case for reclassification to risk group 2. BMC Infect. Dis. 2019, 19, 1044. [Google Scholar] [CrossRef] [PubMed]
- Solans, M.; Scervino, J.M.; Messuti, M.I.; Vobis, G.; Wall, L.G. Potential biocontrol actinobacteria: Rhizospheric isolates from the argentine pampas lowlands legumes. J. Basic Microbiol. 2016, 56, 1289–1298. [Google Scholar] [CrossRef] [PubMed]
- Leeman, M.; Den Ouden, F.M.; Van Pelt, J.A.; Dirkx, F.P.M.; Steijl, H.; Bakker, P.A. Iron availability affects induction of systemic resistance to Fusarium wilt of radish by Pseudomonas fluorescens. Phytopathology 1996, 86, 149–155. [Google Scholar] [CrossRef]
- Sharma, A.; Johri, B.N.; Sharma, A.K.; Glick, B.R. Plant growth-promoting bacterium Pseudomonassp. strain GRP3 influences iron acquisition in mung bean (Vigna radiataL. Wilzeck). Soil Biol. Biochem. 2003, 35, 887–894. [Google Scholar] [CrossRef]
- Manwar, A.V.; Vaigankar, P.D.; Bhonge, L.S.; Chincholker, S.B. In vitro suppression of plant pathogens by siderophores of fluorescent Pseudomonads. Ind. J. Microbiol. 2000, 40, 109–112. [Google Scholar]
- Saharan, K.; Sarma, M.V.; Srivastava, R.; Sharma, A.K.; Johri, B.N.; Prakash, A.; Sahai, V.; Bisaria, V.S. Development of non-sterile inorganic carrier-based formulations of fluorescent pseudomonad R62 and R81 and evaluation of their efficacy on agricultural crops. Appl. Soil Ecol. 2010, 46, 251–258. [Google Scholar] [CrossRef]


© 2020 by the authors. Licensee MDPI, Basel, Switzerland. This article is an open access article distributed under the terms and conditions of the Creative Commons Attribution (CC BY) license (http://creativecommons.org/licenses/by/4.0/).