Article

A Study on the Water/Polymer Co-Flooding Seepage Law and Reasonable Polymer Injection Volume in Offshore Oilfields

1
Petroleum Exploration and Production Research Institute, SINOPEC, Beijing 100083, China
2
Institute of Unconventional Oil and Gas Science & Technology, China University of Petroleum, Beijing 102249, China
3
MOE Key Laboratory of Enhanced Oil Recovery, Northeast Petroleum University, Daqing 163318, China
*
Authors to whom correspondence should be addressed.
Processes 2020, 8(5), 515; https://doi.org/10.3390/pr8050515
Submission received: 25 March 2020 / Revised: 22 April 2020 / Accepted: 24 April 2020 / Published: 27 April 2020

Abstract

:
To analyze the water/polymer co-flooding seepage law in offshore oilfields, we took the Jinzhou 9-3 oilfield as an example, analyzed the dynamic characteristics of water/polymer co-flooding, and then applied streamline simulation and tracer simulation technology to obtain the water/polymer co-flooding seepage law. The interference degree of the water/polymer co-flooding was quantified, and the accuracy of the seepage law was tested. Finally, a reasonable polymer injection volume was obtained using the economic law. The results demonstrated that the water-cut of the Jinzhou 9-3 oilfield in the water/polymer co-flooding stage was high, the annual decrease of polymer store ratio increased by 2.02 times, and the swept area of polymer was limited to some extent. Mutual interference existed in the water/polymer flooding, and the oil increment of per ton polymer decreased by 36.5%. In the late stage of the water/polymer co-flooding, the utilization rate of water and polymer was low, and the plane swept area and vertical swept volume were small. If the oil price was 50 dollars/bbl, when the output-input ratio was set at 1, the reasonable polymer injection volume was 0.59 PV, and the continuous polymer injection volume was 0.29 PV in the water/polymer co-flooding stage. The study results could improve the development benefit of the Jinzhou 9-3 oilfield, and they could also provide the references for the development of the same type oilfield.

1. Introduction

According to the “13th Five-Year Plan for Petroleum Development” jointly formulated by the National Development and Reform Commission and the Energy Bureau in 2017, in China, we continue to strengthen old oilfields, develop new ones, and make breakthroughs in offshore oilfields [1]. At present, the old onshore oil fields have entered the stage of high water-cut and super high water-cut, successively, and the new geological reserves of the oil fields have been decreasing year by year; therefore, people are paying more attention to the exploration and development of offshore oil fields. The oil fields in Bohai bay have been the primary offshore oil fields due to their abundant reserves [2,3,4]. The Jinzhou 9-3 oilfield in Bohai bay is the key offshore oilfield that is presently developed.
Polymer flooding is one of the most promising techniques for the recovery of remaining oil. Wu et al. [5] reported a bench-scale development of new PAM-based polymers. Cleverson et al. [6] found that CWI was a promising enhanced oil recovery technique. Water soluble polymers were used to enhance the viscosity of displacing fluid and to improve the sweep efficiency [7]. Schneider et al. [8] considered that polymer solution can reduce reservoir permeability and improve the sweep efficiency. Sheng et al. [9] provided an update on the status of polymer-flooding technology, focusing more on field applications than on theoretical and laboratory research. The Jinzhou 9-3 oilfield adopted the development method of water/polymer co-flooding, which means, at the same time, for the same block and same reservoir, there are both water flooding and polymer flooding. Feng [10] used numerical simulation technology to study and obtain a reasonable ratio of water injection to polymer injection in the water/polymer co-flooding contact zone of second-class reservoirs in the Daqing oilfield, and he thought the well spacing and the interspaced wells affected the ratio of water injection to polymer injection. Zhao et al. [11] divided the wells connection relationship into two types in Daqing Oilfield and then obtained the reasonable ratio of water injection to polymer injection. They thought that the reasonable ratio of water injection to polymer injection is 1 in the transition area of the water/polymer co-flooding. Song et al. [12] derived a new model to represent the viscosity change law in the process of polymer seepage and obtained a reasonable development mode of the water/polymer co-flooding of a block in Daqing Oilfield. This model was more realistic and reasonable with higher accuracy, but the calculation process is complicated, and the considered factors are uncertain. Yan [13] considered the interference problem in water/polymer co-flooding and obtained the optimal development mode of class II reservoir in Daqing Oilfield. The optimal polymer injection concentration was 900 mg/L, the polymer injection rate was 0.16 PV/year, the water injection rate was 0.14 PV/year. Pang [14] found that, when the injection-production ratio was relatively low in the water/polymer co-flooding, it would have a certain impact on water injection wells, and we should reduce the impact in the development process. Xu et al. [15] found that there must be interference between water molecules and polymer molecules in the water/polymer co-flooding. In the process of development, it was necessary to reduce the influence degree in time. Only in this way could we keep a good development effect. Yu [16] believed that the water/polymer co-flooding was the best development mode, and if the pressure balance was kept balanced, the interference between the water molecules and the polymer molecules would not occur. However, the law of mutual interference between the water and polymer is not clear in the water/polymer co-flooding, which limits the flooding ability of the polymer to some extent. The streamline simulation technology and tracer simulation technology were adopted to analyze the flow characteristics and seepage law of the water/polymer co-flooding and judge the interference degree, and combined with the economic analysis method, a reasonable volume of polymer injection in the stage of water/polymer co-flooding was obtained.
In the study, the interference degree of the water/polymer co-flooding was quantified, and the accuracy of the seepage law was tested. A reasonable polymer injection volume was obtained using the economic law. The study results can improve the development benefit of the Jinzhou 9-3 oilfield, and they can also provide the references for the development of the same type of oilfield.
The Jinzhou 9-3 oilfield is located in the northern sea area of Liaodong bay, Bohai bay, and belongs to the northern part of the Liaodong bay depression-Liaoxi low uplift. It is a long and narrow northeastward distribution semi-anticlinal structure with large faults as the boundary on the northwest side, dominated by the delta deposition [17,18]. The reservoir rock cements loosely, and the reservoir has a strong heterogeneity. The porosity is high, and is mainly distributed between 22–36%. The permeability is mainly distributed between 10–5000 × 10−3 μm2. The average oil saturation is 59.4%. The reservoir temperature is 57 °C, and the reservoir initial pressure is 17.1 MPa. The OWC is relatively obvious, and the formation water total salinity is between 6401–9182 mg/L. The crude oil has a high density, high content of colloid asphalt, low freezing point, low sulfur content, low wax content, and medium viscosity [19]. The physical properties comparison of different oilfields are shown in Table 1. The Jinzhou 9-3 oilfield was put into development in 1999. The original well network was an inverted nine-spot well network (Figure 1a). Eight injection wells in the basic well network were successively put into use from the year 2000 to 2006, converted to polymer injection wells in 2008, and converted to polymer/surfactant binary systems successively from 2010 to 2013. From 2015 to 2016, the well pattern of this block was adjusted, and 12 interspaced wells were drilled successively. The well pattern was adjusted from the inverted nine-spot well pattern to a row pattern (Figure 1b).

2. Dynamic Characteristics of the Water/Polymer Co-Flooding

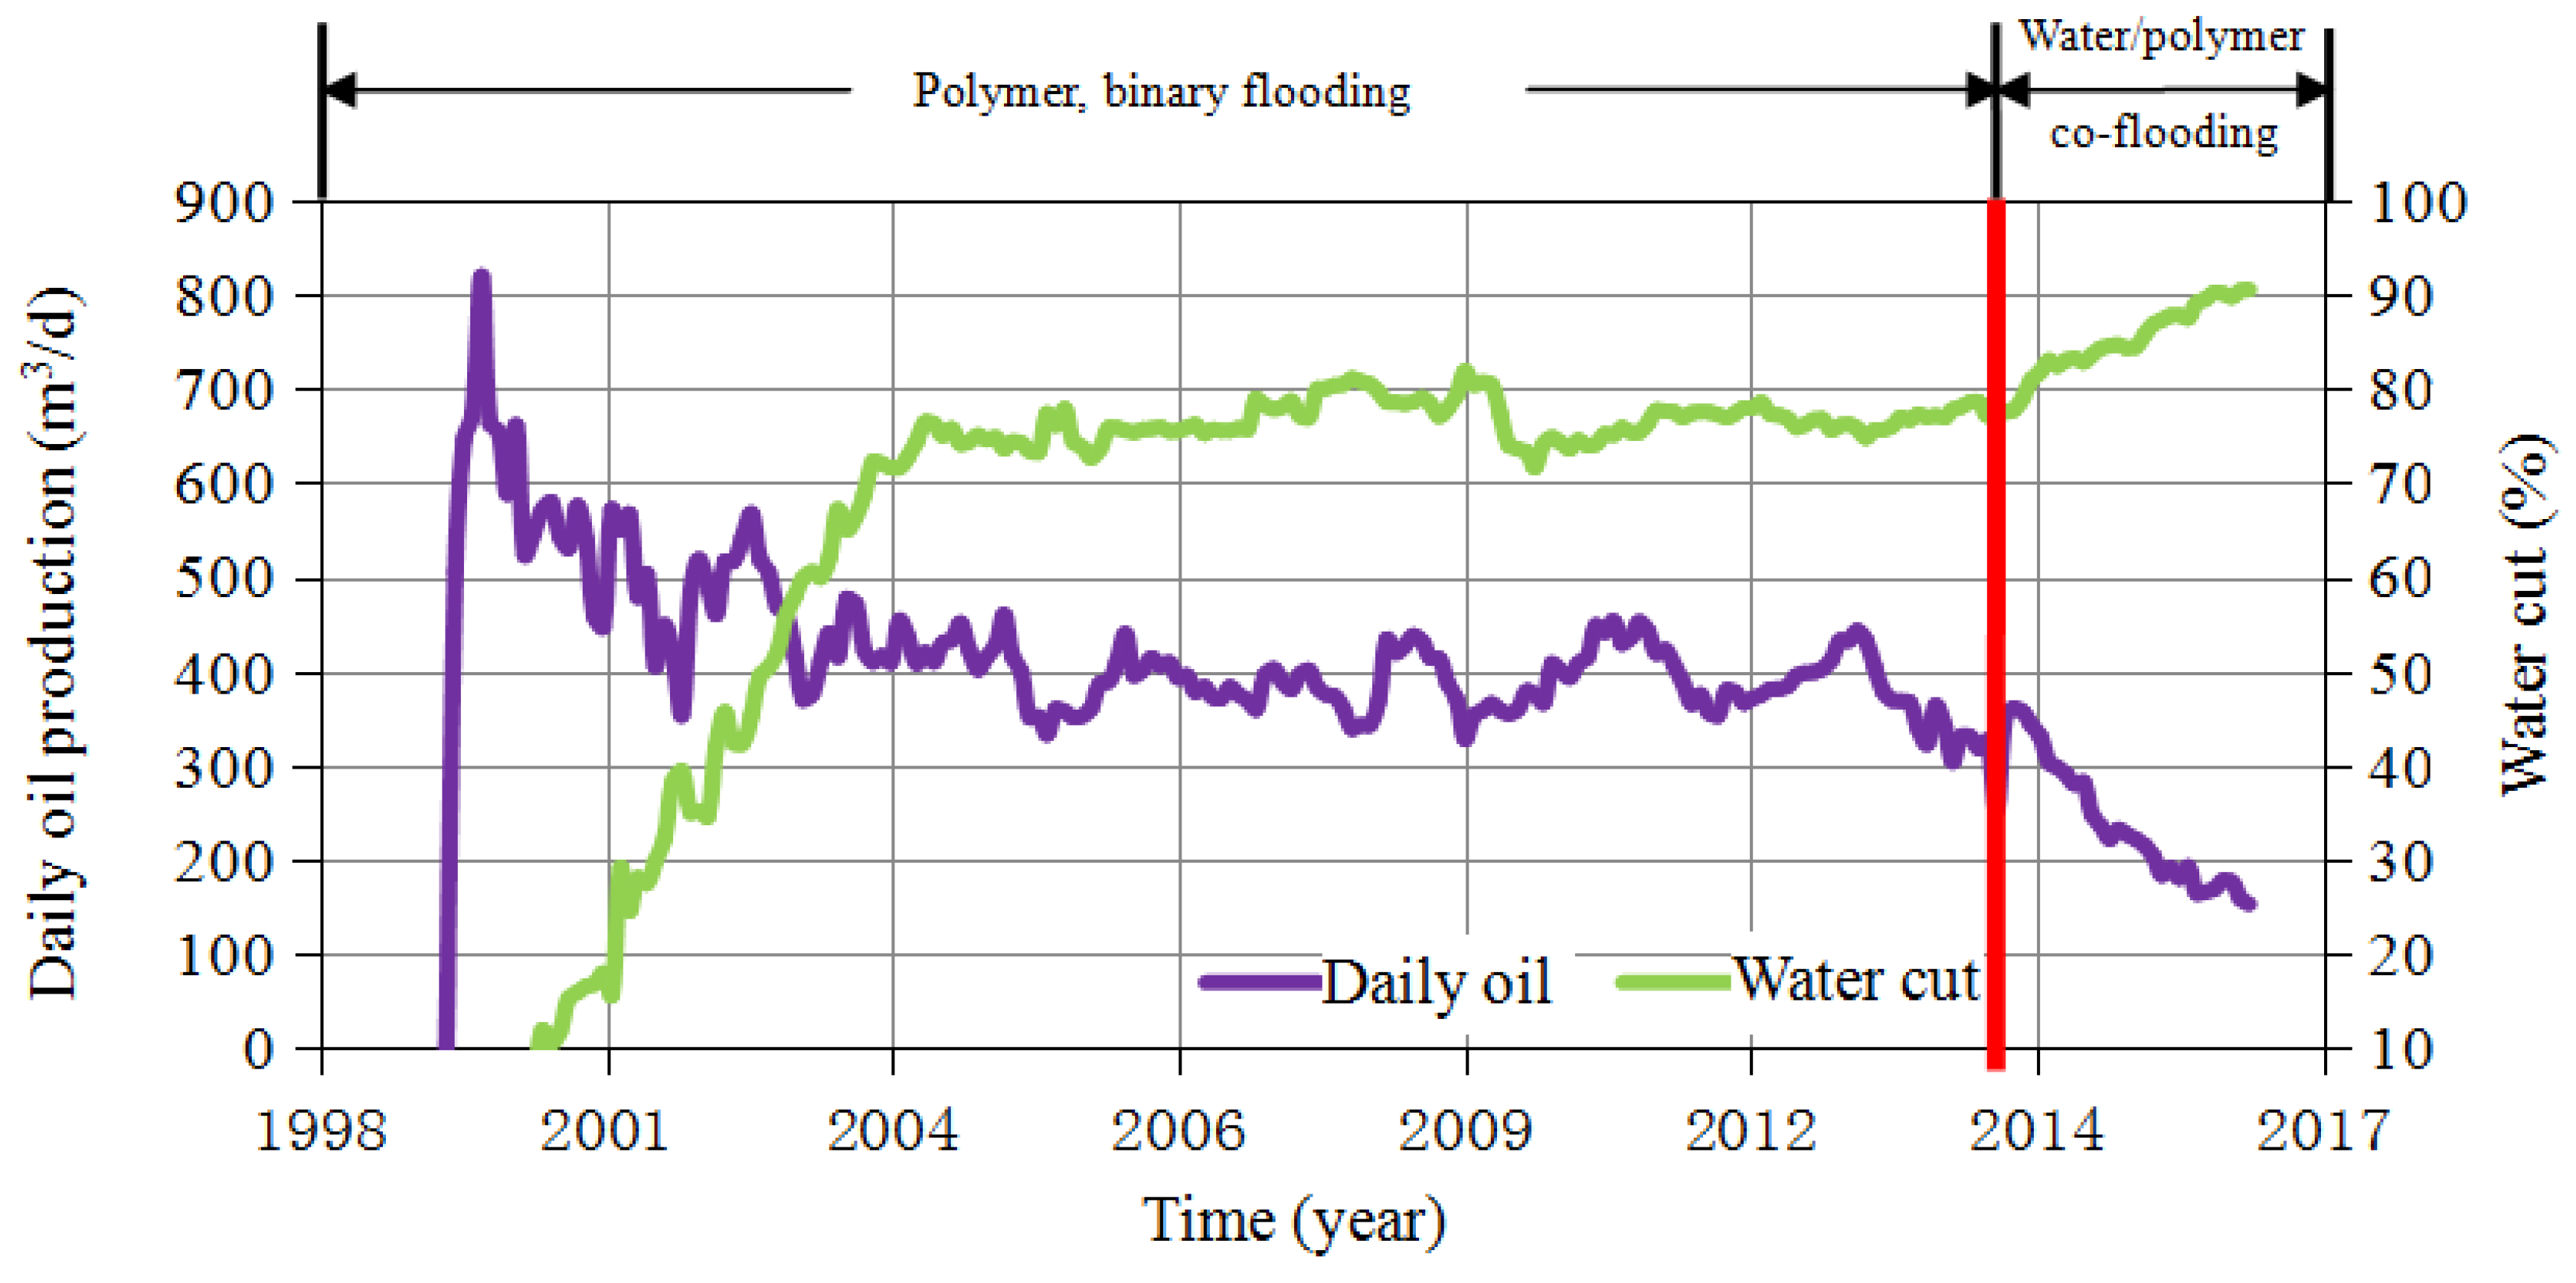
2.1. The Variation Rule of Oil Production and Water-Cut

A water or oil well is the basic unit of the oilfield development. The oil and water wells in the process of oilfield development are constantly producing oil and injecting water, so that the oil, gas, and water are constantly under seepage changes. These changes can be reflected in the daily production dynamic data of the oil and water wells, so that the status of the well group can be analyzed, as well as the dynamic characteristic of the formation where the well group is located [20]. According to the analysis results, compared with the stage of polymer flooding and binary flooding in the Jinzhou 9-3 oilfield, the well number and the liquid production of the old wells in the water/polymer co-flooding stage did not change, the oil production decreased, and the water-cut increased (Figure 2). The oil production of the interspaced wells decreased rapidly and the water-cut was generally high (Figure 3). These problems were mainly due to the influence of the interspaced wells. Because the interspaced wells shortened the well spacing, the injected water of the reservoir was easier to flow, the oil production would decrease after increasing in a short period of time, and the water-cut increased.

2.2. Polymer Store Ratio Change Law

The polymer store ratio is an important index to evaluate the development effect of the polymer flooding [21,22]. The higher the polymer store ratio, the better the polymer flooding effect. According to the actual model of the Jinzhou 9-3 oilfield, the numerical simulation method was adopted to calculate the polymer store ratio change law of the oilfield since 2007. The results are shown in Figure 4.
As can be seen from the Figure 4, the polymer store ratio of the Jinzhou 9-3 oilfield decreased gradually with the prolong of development time, with an average annual decline of 1.87%. In 2014, the oilfield began to make well pattern adjustments. The original inverted nine-spot well network was changed to the current row network, and the average annual polymer store ratio was 5.65%. The annual decline increased by 2.02 times. These problems were mainly due to the influence of the interspaced wells too. Because the injected water of the reservoir was easier to flow, the more reservoir polymers were produced with the water, the more average annual polymer store ratio decreased.

3. Study on the Seepage Law of the Water/Polymer Co-Flooding

Based on the basic parameters of the Jinzhou 9-3 oilfield, such as the physical properties, oiliness, well pattern, well spacing, and development history, the conceptual streamline model and the conceptual tracer model of this oilfield were abstracted to analyze the seepage law of water/polymer co-flooding. At the same time, the actual streamline model of Jinzhou 9-3 oilfield was established to check the accuracy of the seepage law. The streamline model and tracer model intuitively reflected the seepage law of the water/polymer co-flooding.

3.1. The Principle of the Model

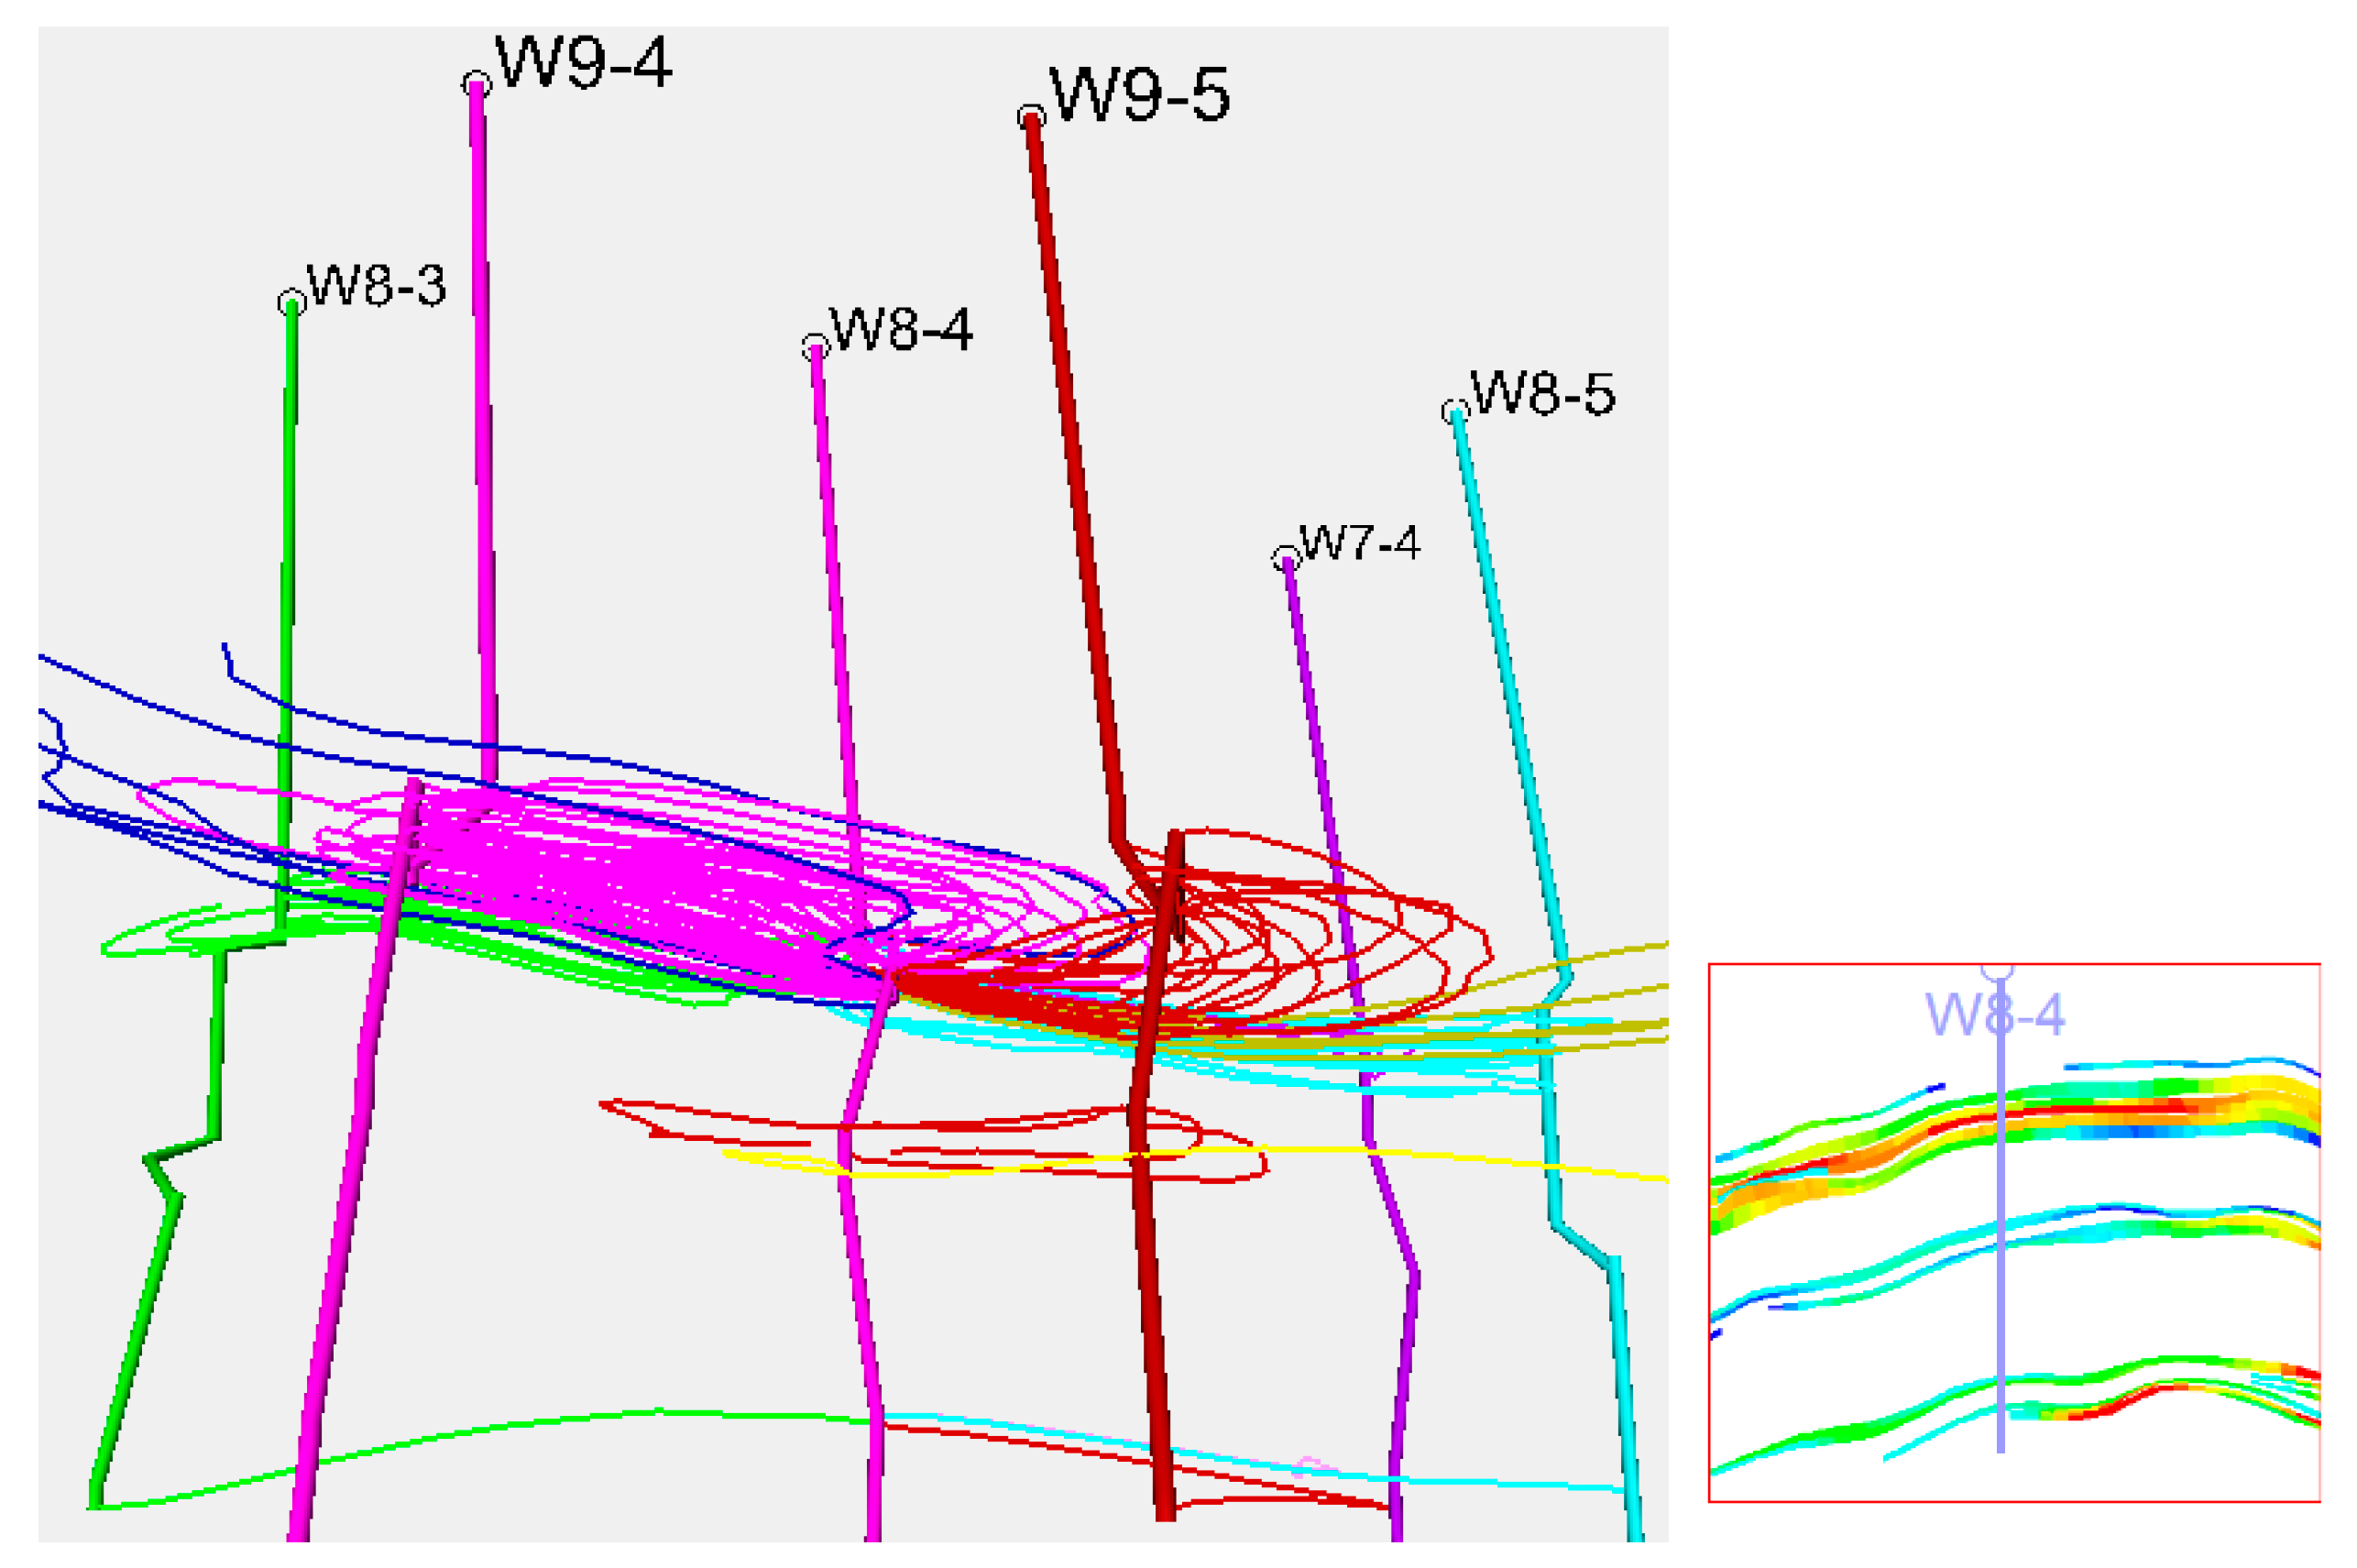
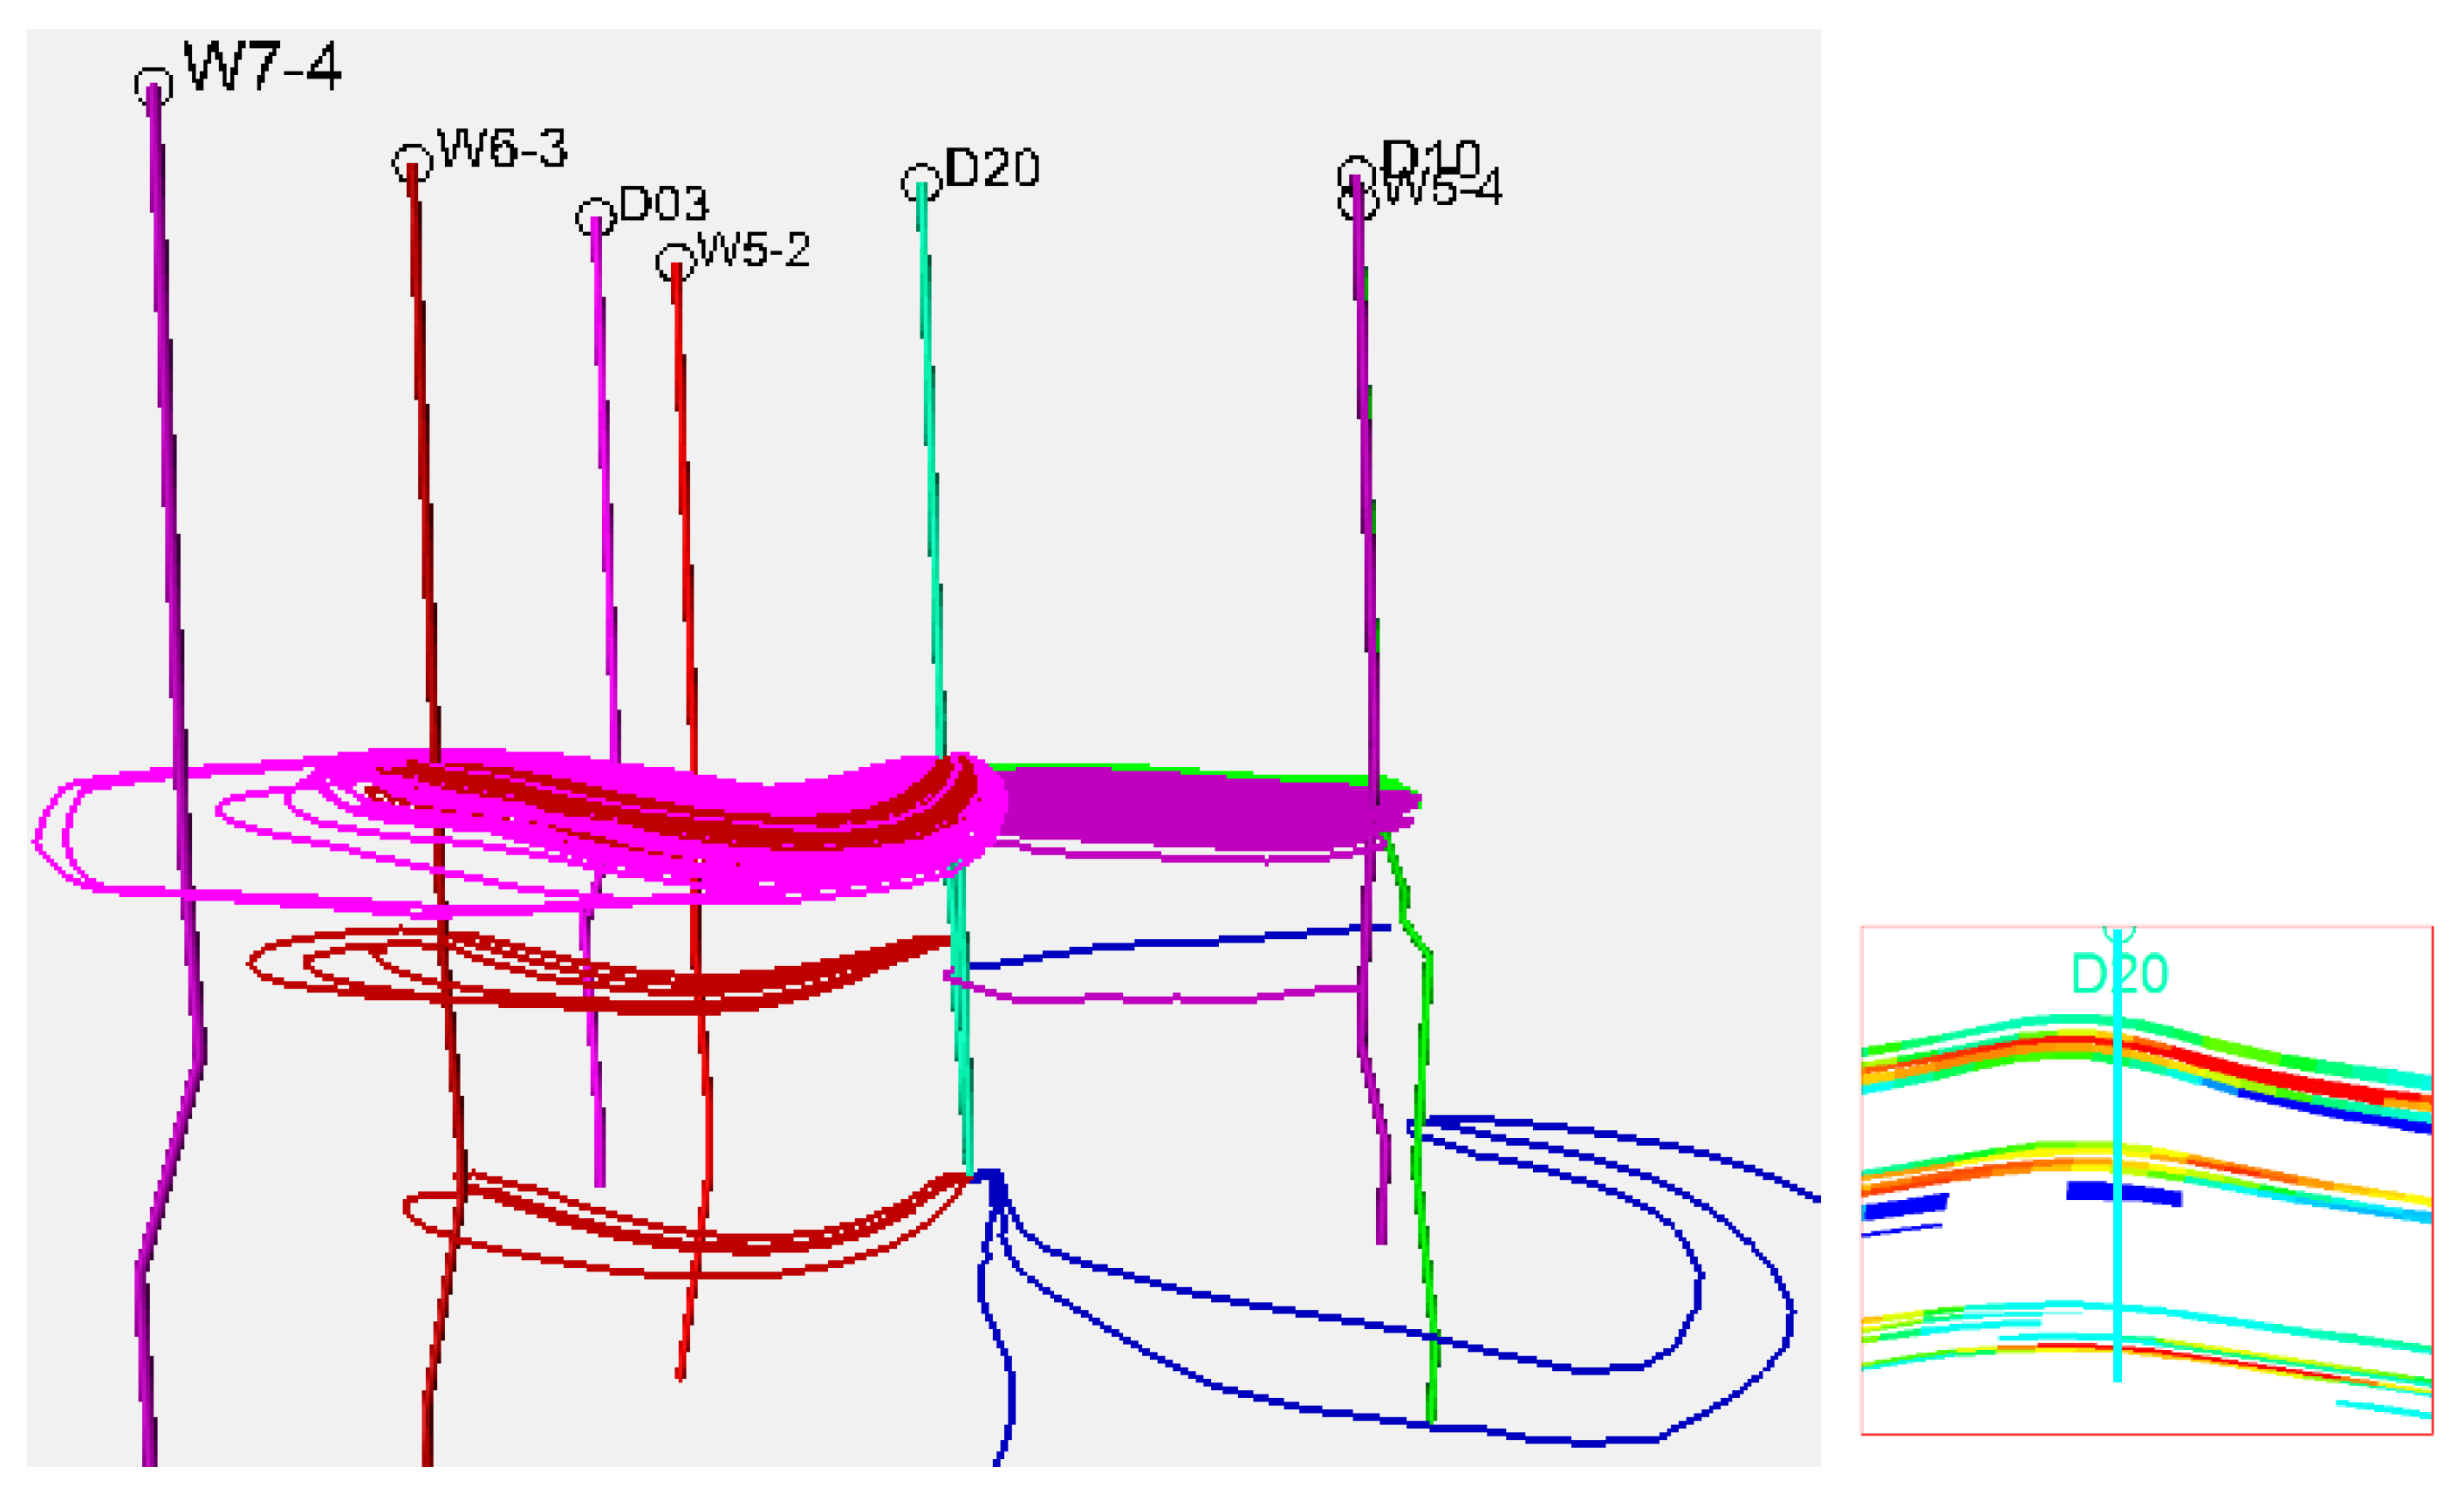
3.1.1. Streamline Model

The streamline model reduced the 3D simulation model to a series of one-dimensional linear models. The streamline model can be regarded as the particle seepage trajectory, which can be used to judge the degree of connectivity between the injection wells and the production wells and generate an ALLOC file of the distribution coefficient between the injection and the production wells. Zhang et al. [23] developed a novel mathematical model of the THMC processes. Pollock proposed a method to track the streamline trajectory, and the IMPES method was used to implicitly calculate the pressure field of the grid system, and the Darcy formula was applied to establish the real flow velocity field. The streamline line was finally tracked on this basis [24].
Assuming that the fluid and the rock are incompressible, considering the diffusion effect and ignoring the capillary pressure and the gravity effects, we adopted an implicit method to combine the oil and water phase equations and to eliminate the saturation variable. Then an equation only containing pressure was obtained. The pressure value was obtained by solving this linear algebraic equation system:
c i , j p i , j 1 + a i , j p i 1 , j + e i , j p i , j + b i , j p i + 1 , j + d i , j p i , j + 1 = f i , j c i , j = A c w i , j + c o i , j a i , j = A a w i , j + a o i , j e i , j = A e w i , j + e o i , j b i , j = A b w i , j + b o i , j d i , j = A d w i , j + d o i , j f i , j = A f w i , j + f o i , j A = ρ o ρ w .
After the pressure distribution of the grid system was obtained according to the above formula, the velocity component of the grid interface was calculated according to the Darcy equation:
v x ( i ± 1 2 ) = λ i ± 1 2 , j , k [ p ( i ± 1 , j , k ) p ( i , j , k ) ] / ( x i ± 1 x i )
v y ( j ± 1 2 ) = λ i , j ± 1 2 , k [ p ( i , j ± 1 , k ) p ( i , j , k ) ] / ( y j ± 1 y j )
v z ( k ± 1 2 ) = λ i , j , k ± 1 2 [ p ( i , j , k ± 1 ) p ( i , j , k ) ] / ( z k ± 1 z k ) λ = p = 1 N p K p μ p .
In the formula, p —pressure, MPa; x , y , z —the three coordinate directions; i , j , k —the node number of the x , y , z directions; K p —the permeability of p phase fluid, 10−3 μm2; μ p —the viscosity of the p phase fluid, mPa∙s; and N p —the number of the fluid phase.
The above formula was used to calculate the seepage velocity in all directions. In order to meet the requirement of tracking streamline, the seepage velocity needed to be converted into the real velocity. The calculation formula of the true velocity was
v a c t u a l = v d a r c y ϕ ( i , j , k )
In the formula, ϕ ( i , j , k ) —the porosity of the grid nodes.

3.1.2. Tracer Model

In the process of tracer simulation, the flow model of the tracer in the reservoir should be established first. The assumed conditions of the model include: The tracer did not occupy volume, and the tracer had no effect on physical properties. The total concentration of the tracer conformed to the material conservation equation, which included the reaction term of tracer. The phase concentration of the tracer was calculated according to the type of tracer, which could be divided into water, oil, gas, or distribution type [25].
For the tracer model, if the influence of the gas phase was ignored and only the oil and the water phase were considered, Feng et al. [25] proposed a three-dimensional two-phase four-component tracer mathematical model: two-phase referred to the oil phases and the water phases, and the four components referred to the oil components only in the oil phase, water components only in the water phase, non-distributive tracers only in the water phase, and distributive tracers only in the oil phase and the water phase. If components were represented by i, phases were represented by j; the mathematical model was
[ j = 1 N p C i j ρ j u j ] q i = t ( ϕ j = 1 N p C i j ρ j S j )
In the formula, C i j —the concentration of component i in the j phase, mg/L; ρ j j phase density, g/cm3; u j j phase velocity, cm/s; q i —mass flow rate of i cm3; S j j phase saturation; ϕ —porosity; N p —the total number of the phase; and —the divergence.
When considering mass transfer diffusion, the mathematical model was
[ j = 1 N p C i j ρ j u j ] + [ ϕ j = 1 N p S j ρ j K i j C i j ] q i = t ( ϕ j = 1 N p C i j ρ j S j )
In the formula, K i j —the diffusion tensor of component i in the j phase and —the gradient.
Therefore, in the tracer model, the non-distributive tracer concentration field mathematical model was
[ C 1 w K w B w μ w ( p w ρ w g D ) ] + [ ϕ S w B w K 1 w C 1 w ] q 1 ρ w = t ( ϕ S w B w C 1 w )
The mathematical model of the distributive tracer concentration field was
[ C 2 w K w B w μ w ( p w ρ w g D ) ] + [ ϕ S w B w K 2 w C 2 w ] m q 2 ρ w = t ( ϕ S w B w C 2 w )
[ C 2 o K o B o μ o ( p o ρ o g D ) ] + [ ϕ S o B o K 2 o C 2 o ] n q 2 ρ o = t ( ϕ S o B o C 2 o )
In the formula, m —the distribution coefficient of distributive tracer in the water phase; n —the distribution coefficient of distributive tracer in the oil phase; and m + n = 1 .

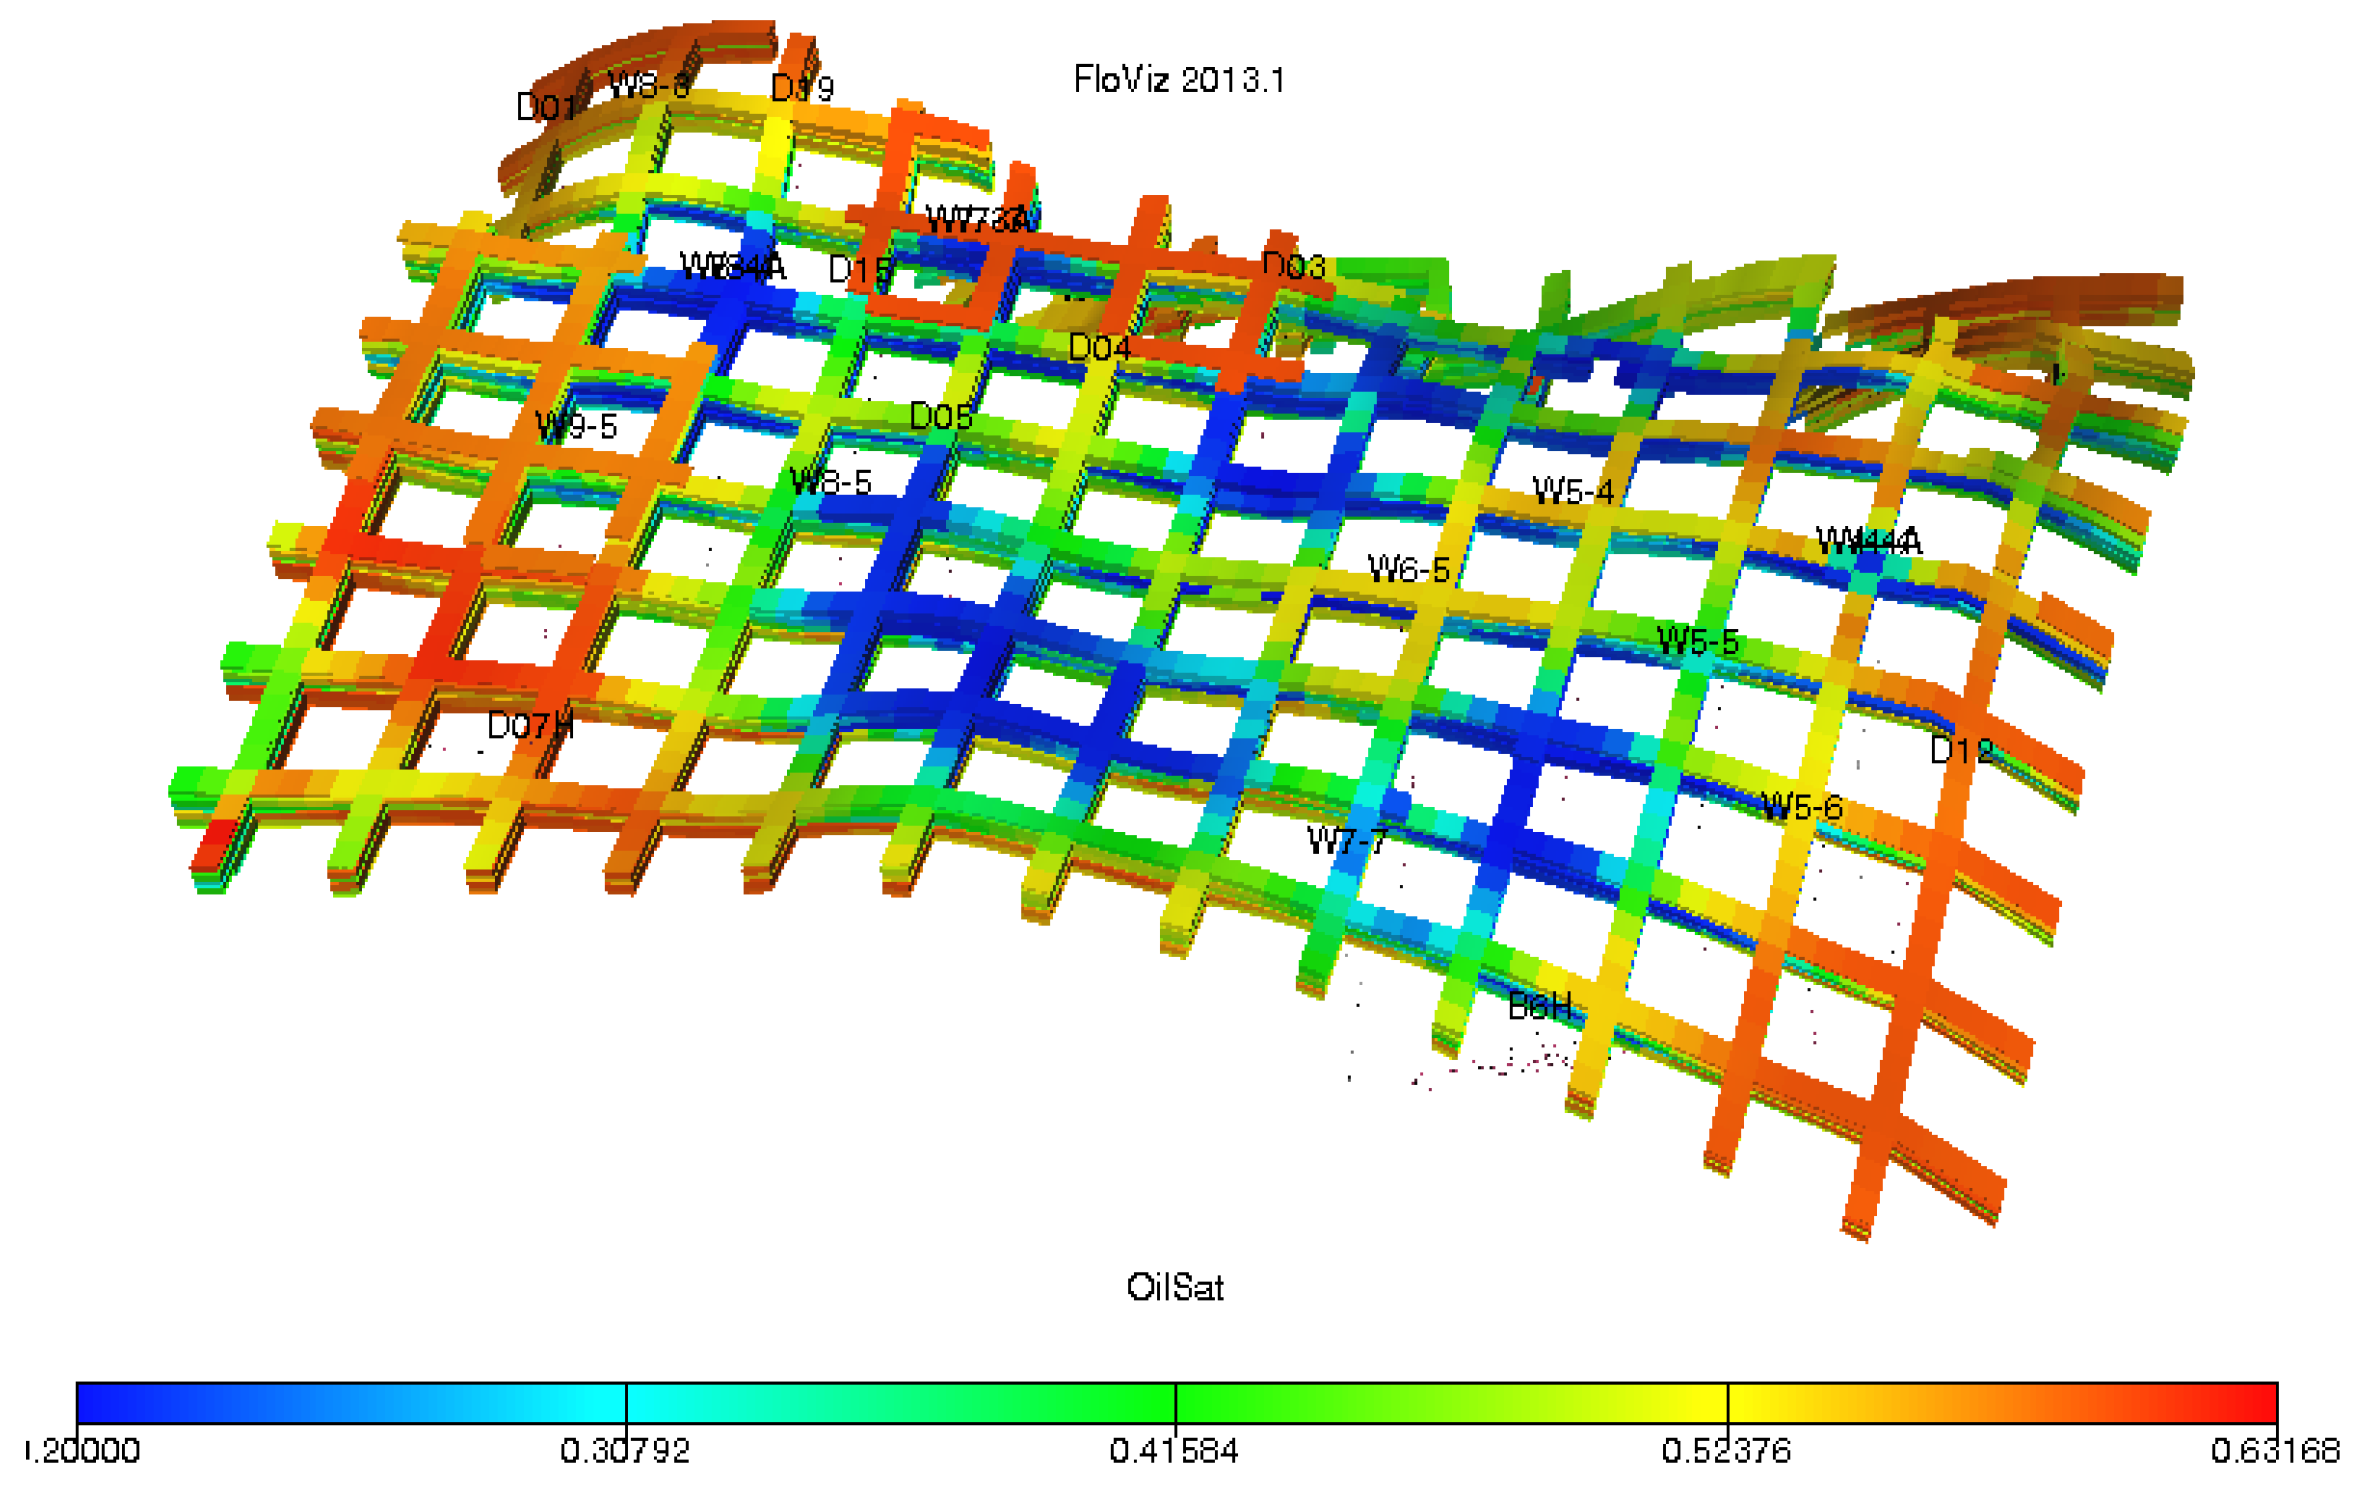
3.2. Seepage Law Analysis

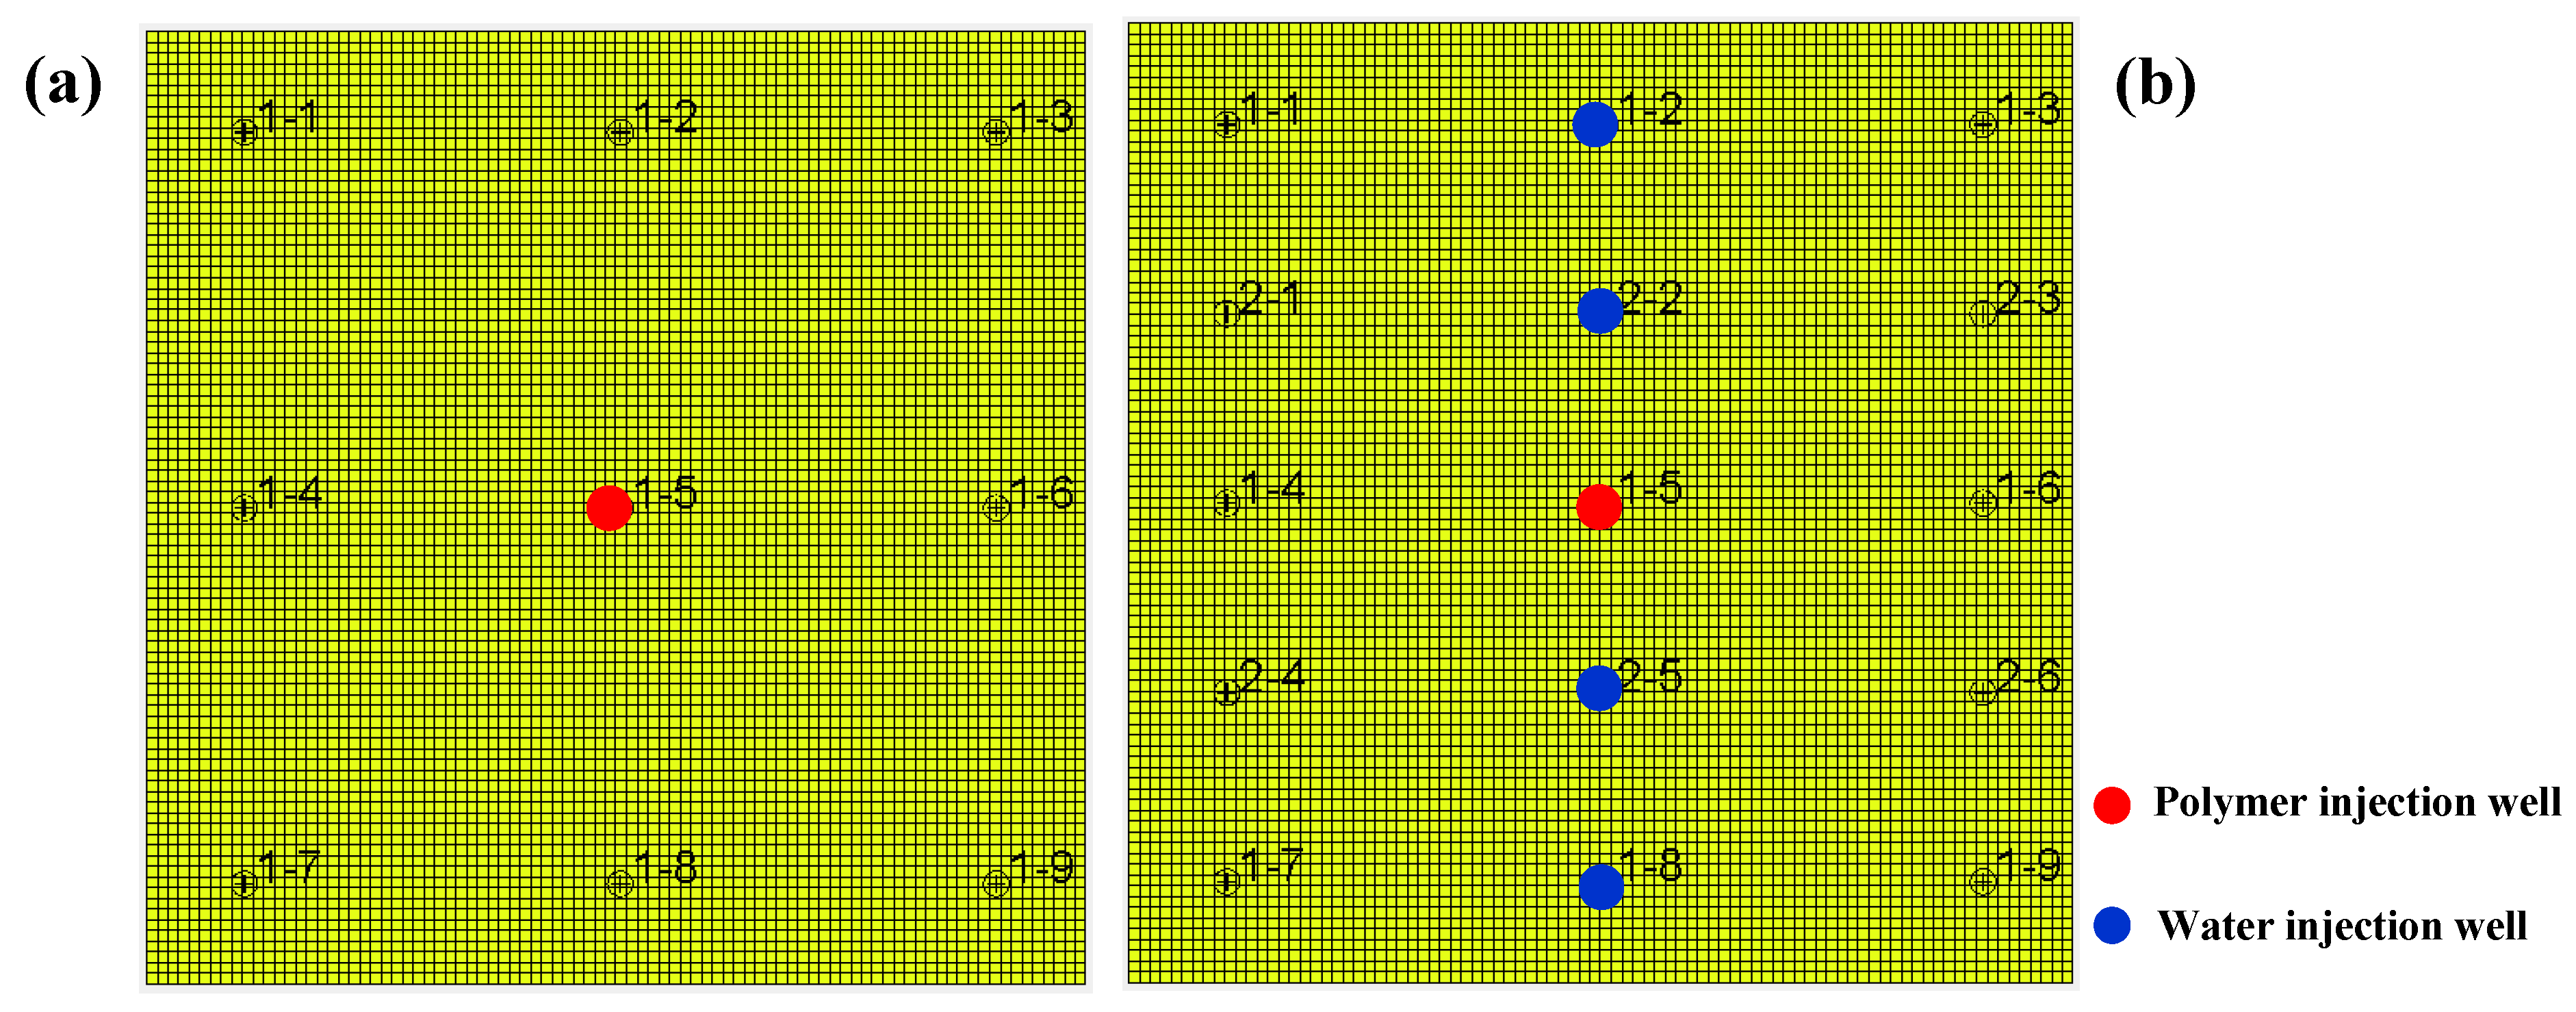
3.2.1. Experimental Design

A conceptual model was used to analyze the seepage law in the stage of the water/polymer co-flooding. The parameters of the conceptual fine geological model and numerical model are shown in Table 2:
Before the well interspaced, it was an inverted nine-point well pattern, with one injection well and eight production wells, and the well space was 350 m; after the well interspaced, it was a row pattern, the ratio of the injection wells to the production wells was 1:2, the well space was 175 m, and the row space was 350 m (Figure 1). The model development process was as follows: water flooding 0.45 PV + polymer flooding, 0.3 PV + binary flooding, 0.1 PV + prediction scheme, the water injection rate was 0.045 PV/year, and the polymer injection rate was 0.04 PV/year.

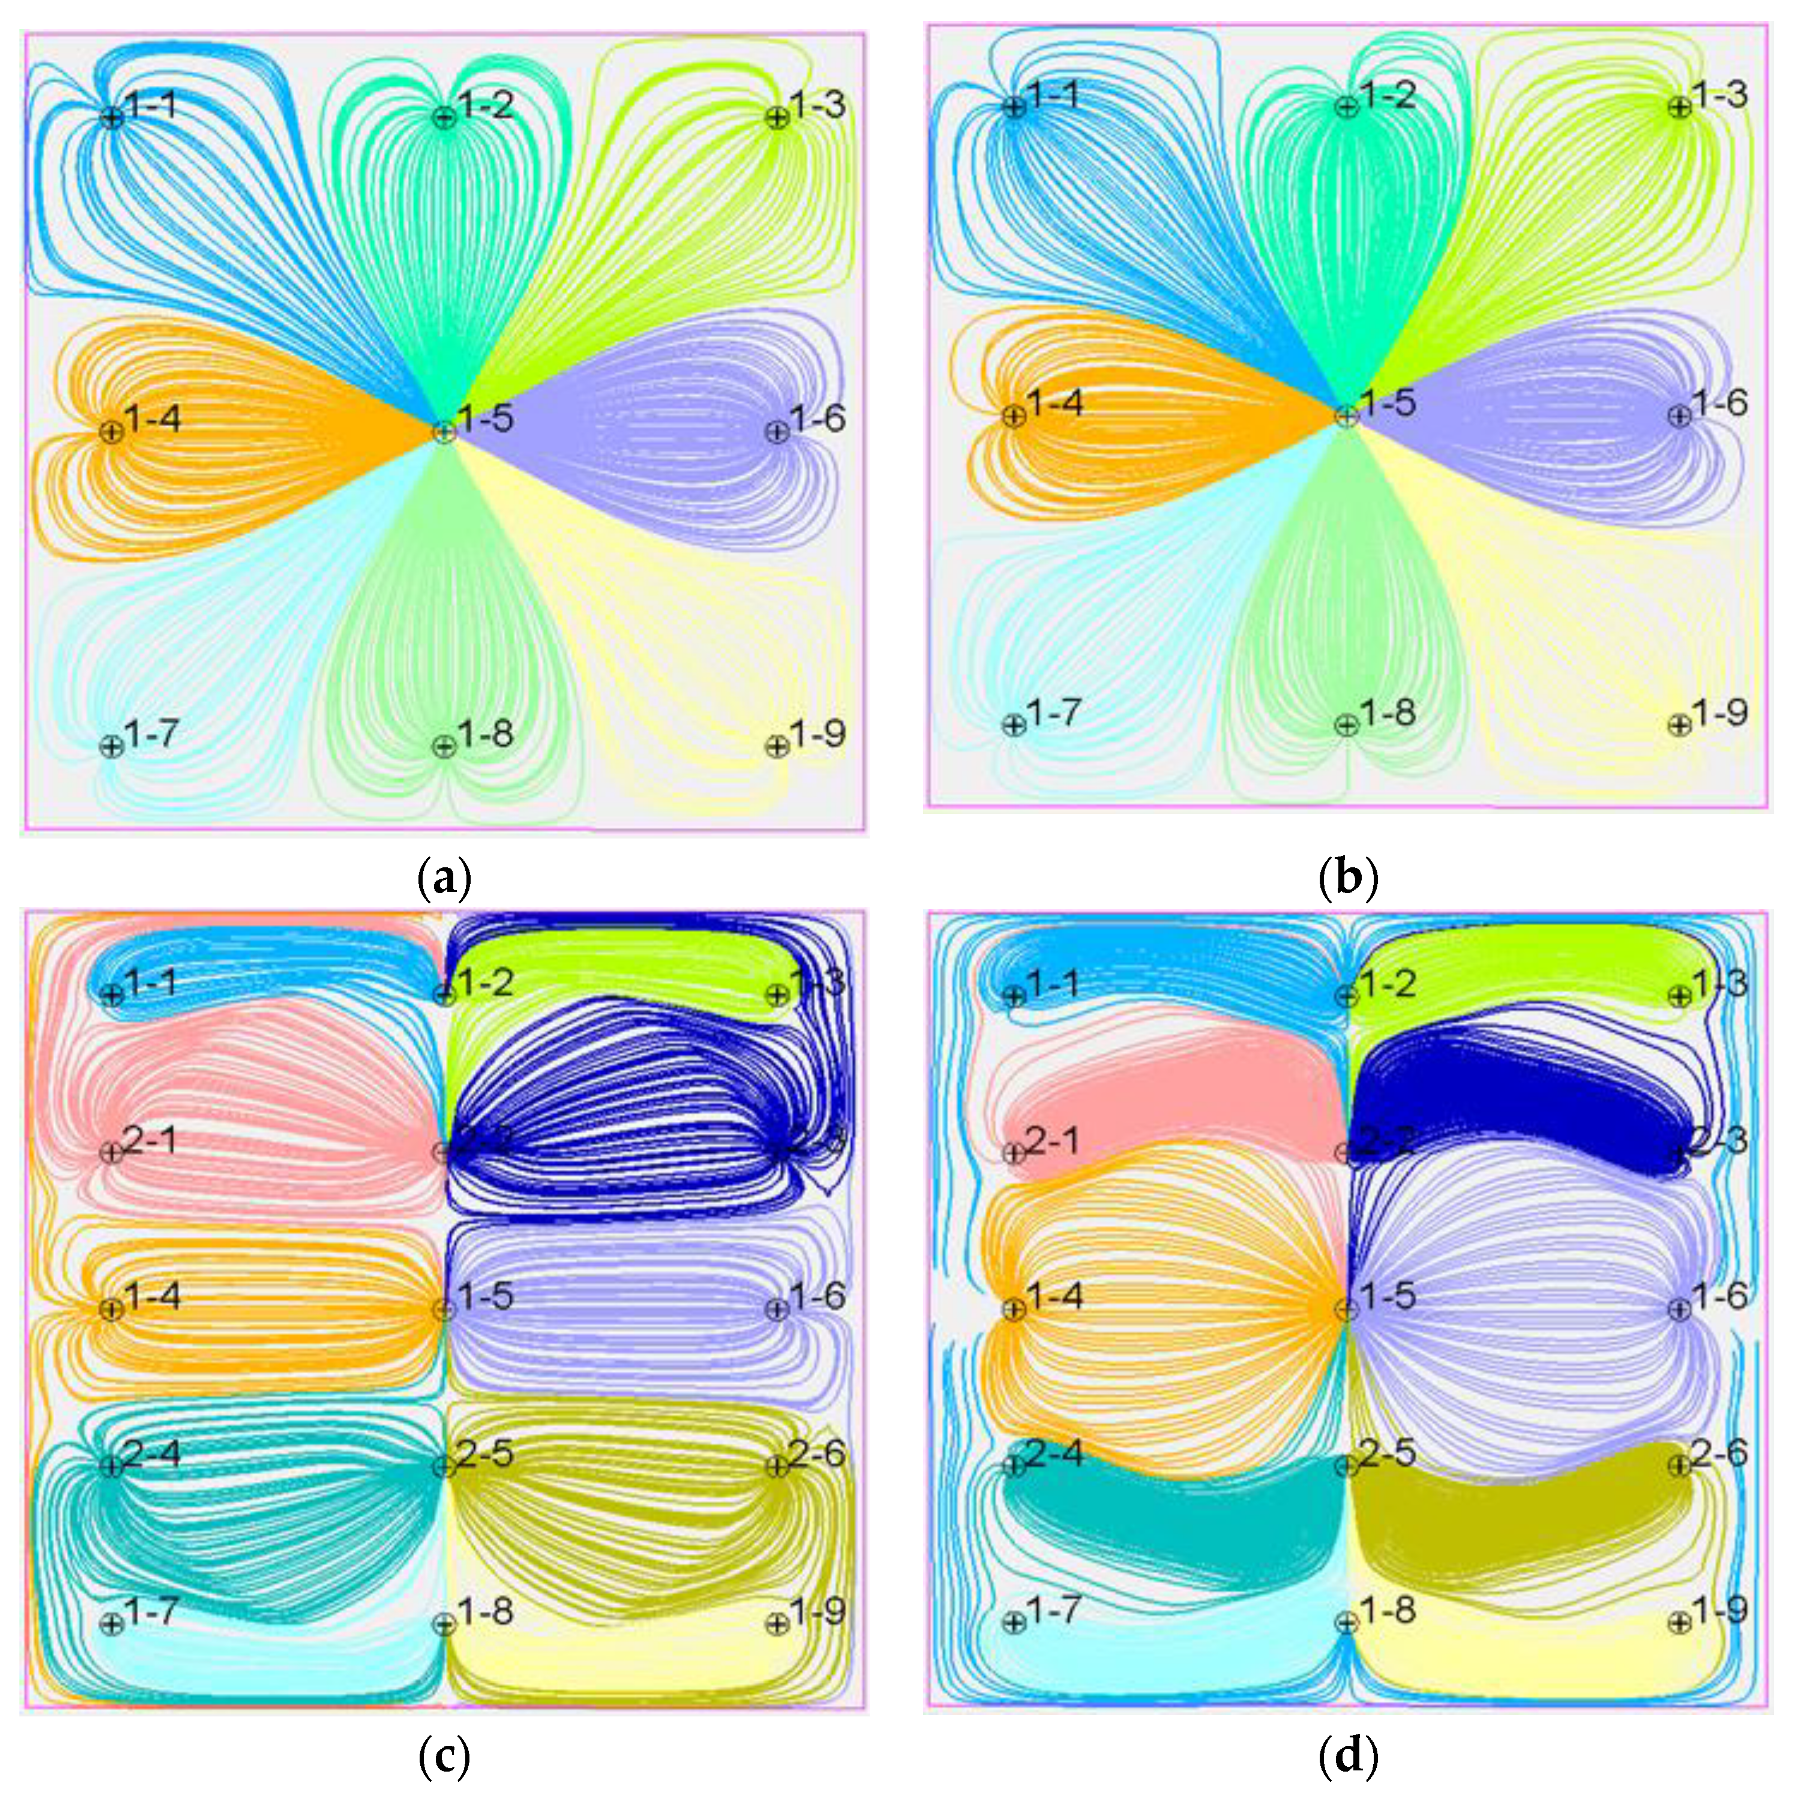
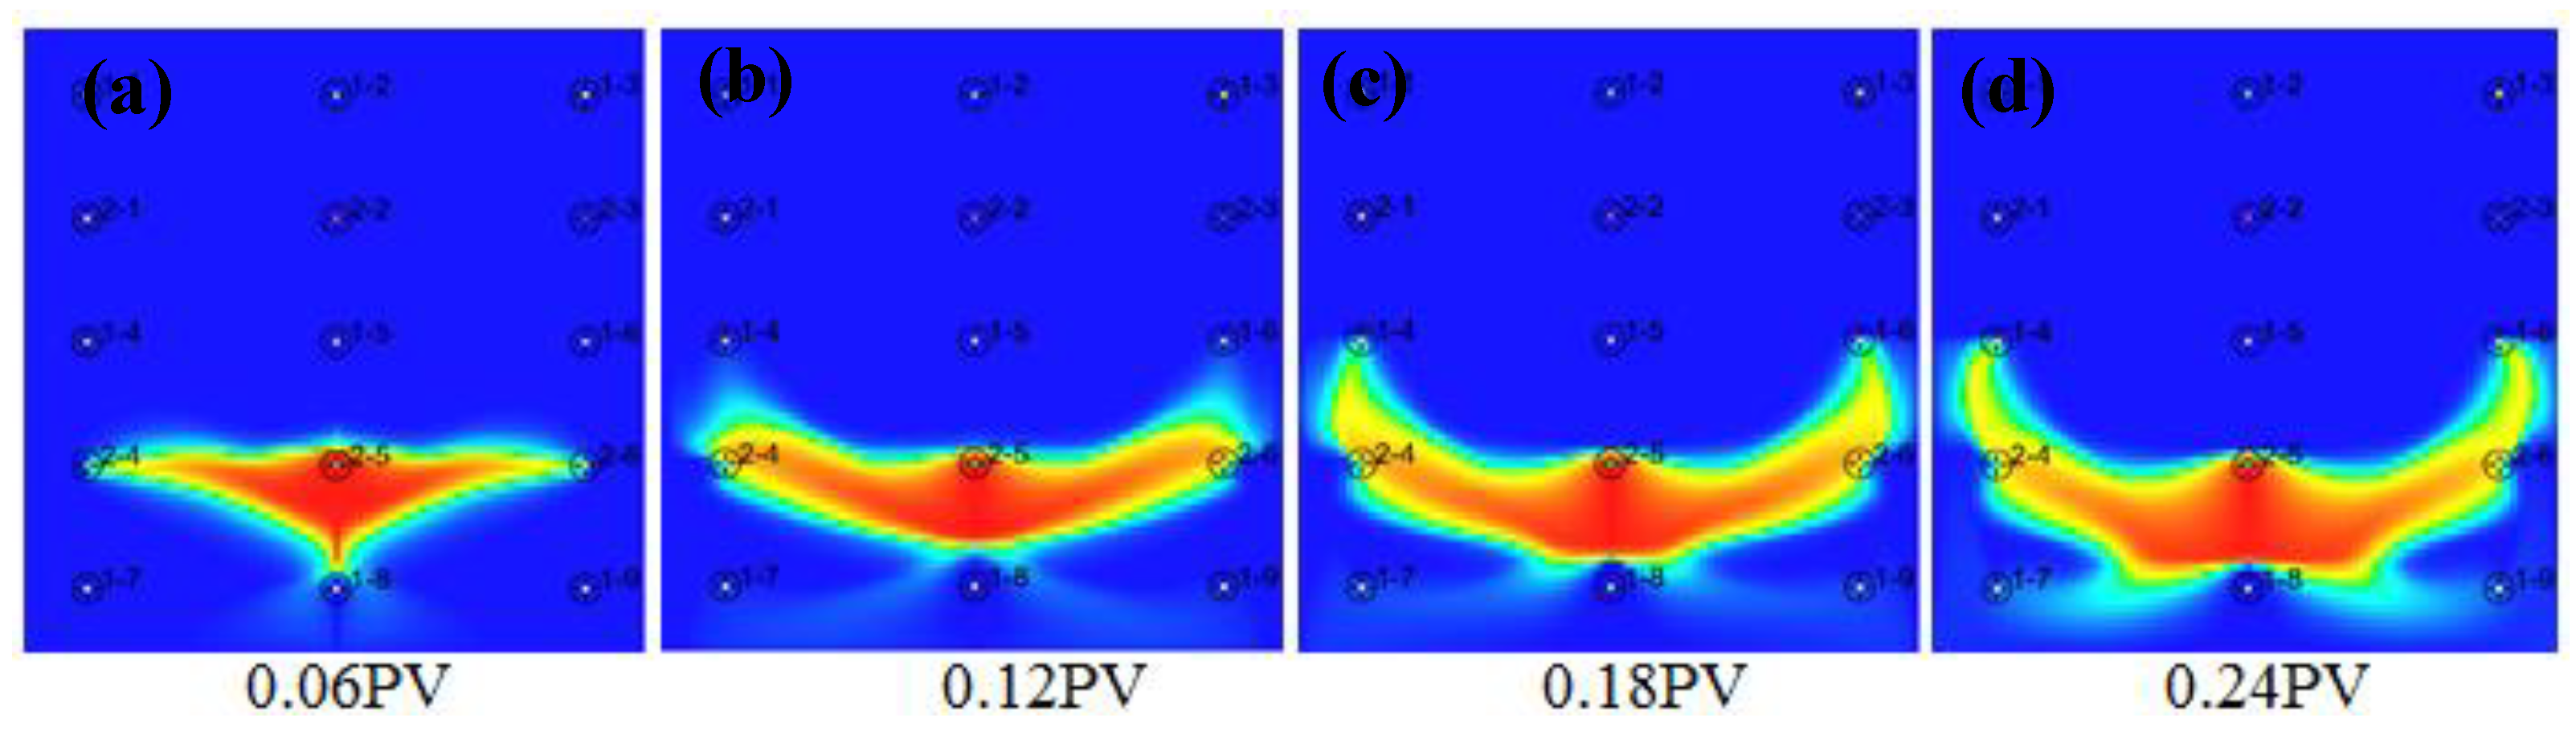
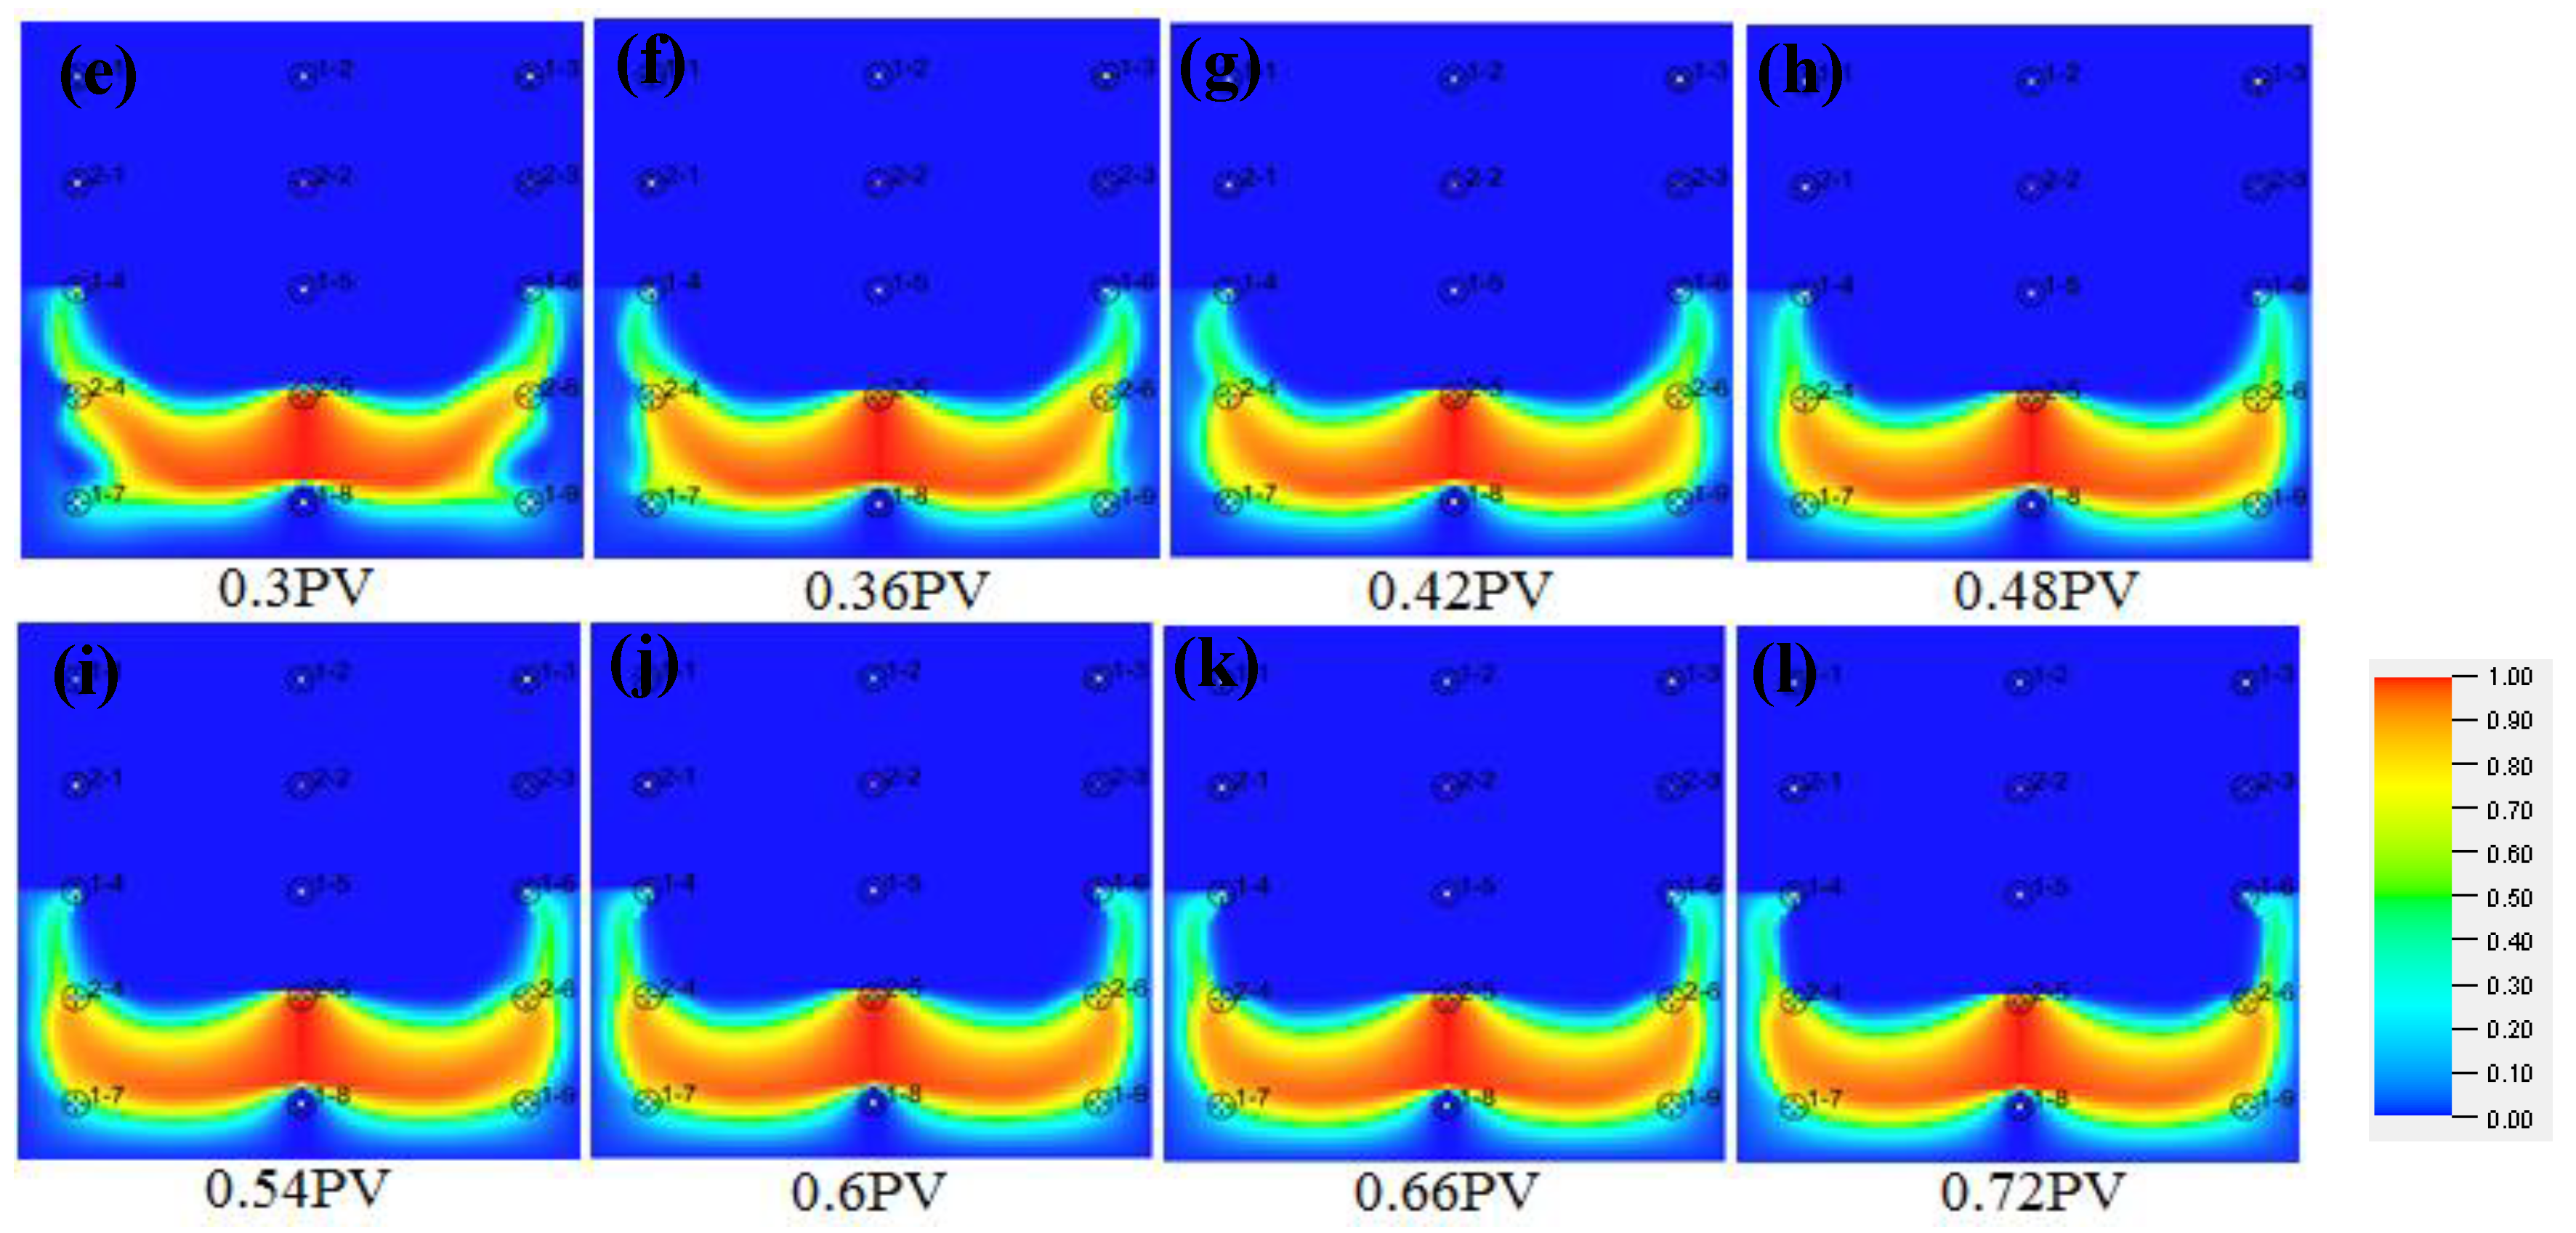
3.2.2. Characteristic Analysis of the Streamline Field

The streamline field distribution law of the conceptual model is shown in Figure 5.
From the flow diagram of the model, it could be concluded that for the production well 1-1 and well 1-4, during the water injection stage and the polymer injection stage, the liquid production came from the supply of the central injection well 1-5. In the stage of water/polymer co-flooding, the liquid production of well 1-1 was no longer supplied by the injection well 1-5.
By comparing the inverted nine-spot well pattern and row well pattern, and comprehensively analyzing the flow field of the water injection and polymer injection wells, we concluded that due to the change of the well pattern, the flow field of the central polymer injection well was interfered with by the water injection well; the polymer flow field changed from large to small, and the scope of the polymer seepage field also changed from large to small. Similarly, because of the central polymer injection well, the water flow field changed from large to small, and the scope of the water seepage field also changed from large to small. The water injection pressure would increase and water injection volume would decrease. After long-term development of water injection and polymer injection, the pore throat structure of the reservoir would change greatly, and the low-efficiency channels would form between certain oil and water wells, resulting in a smaller swept volume of water and polymer and a lower oil increment of per ton polymer.

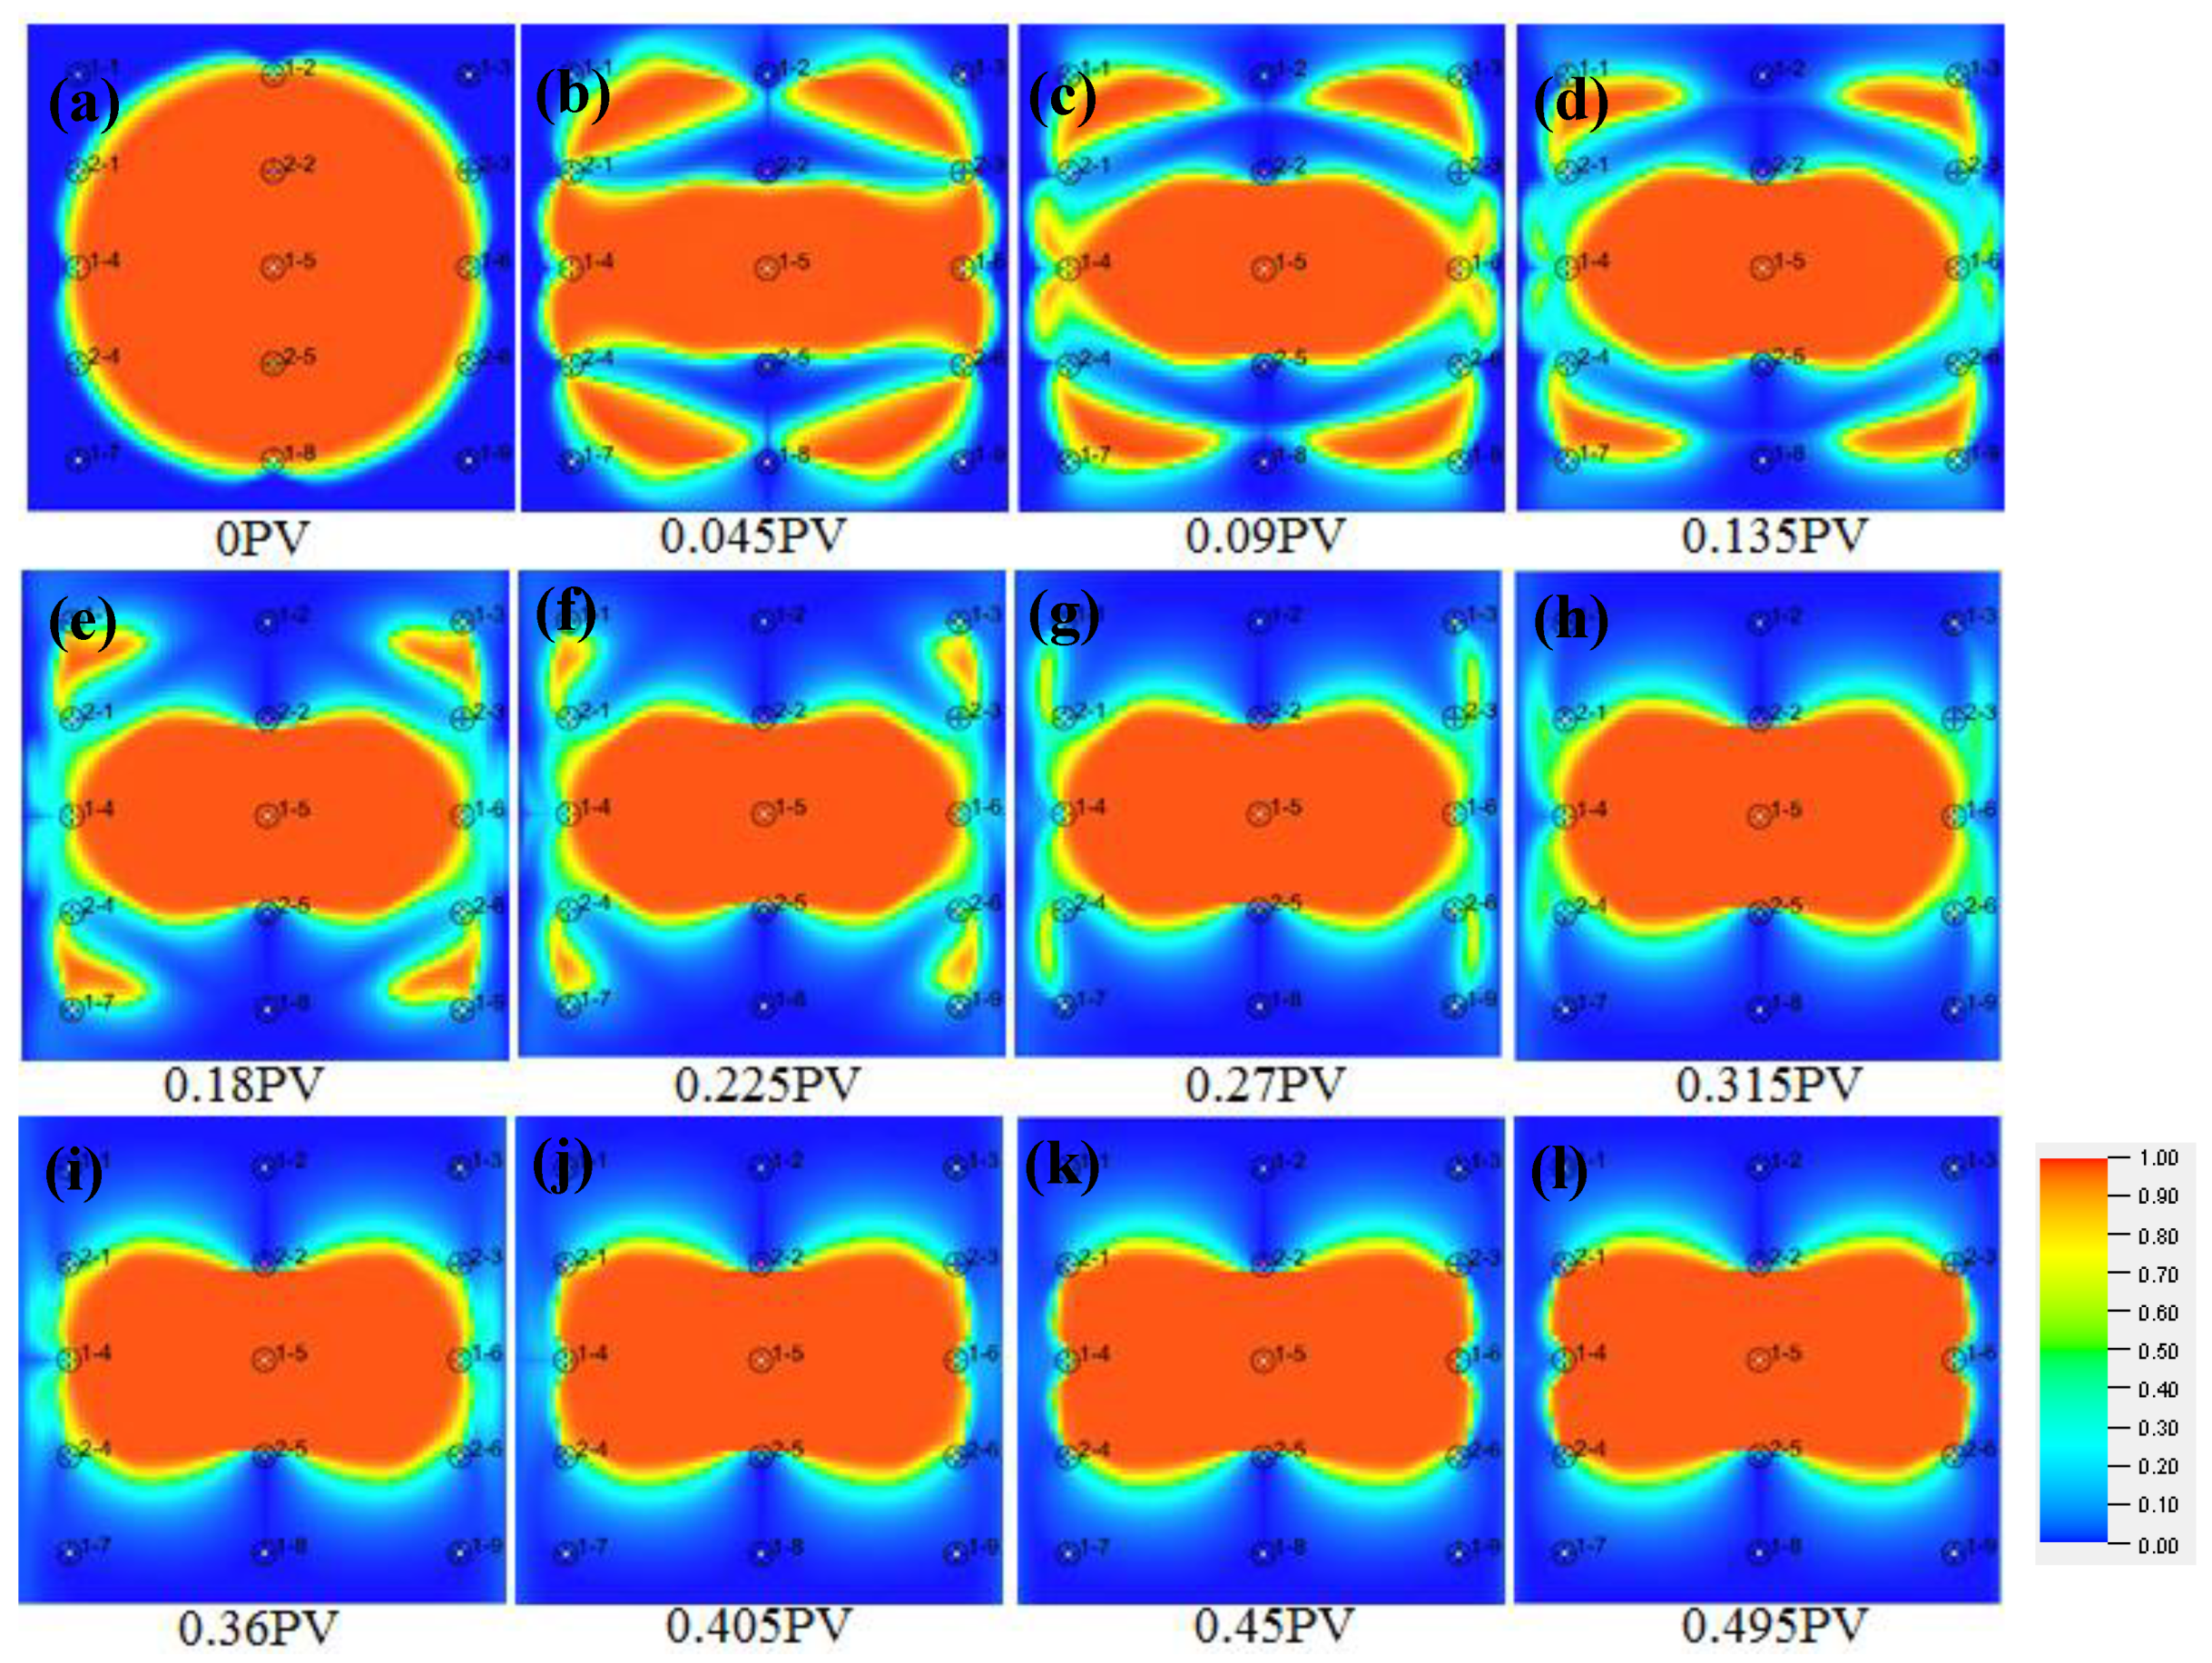
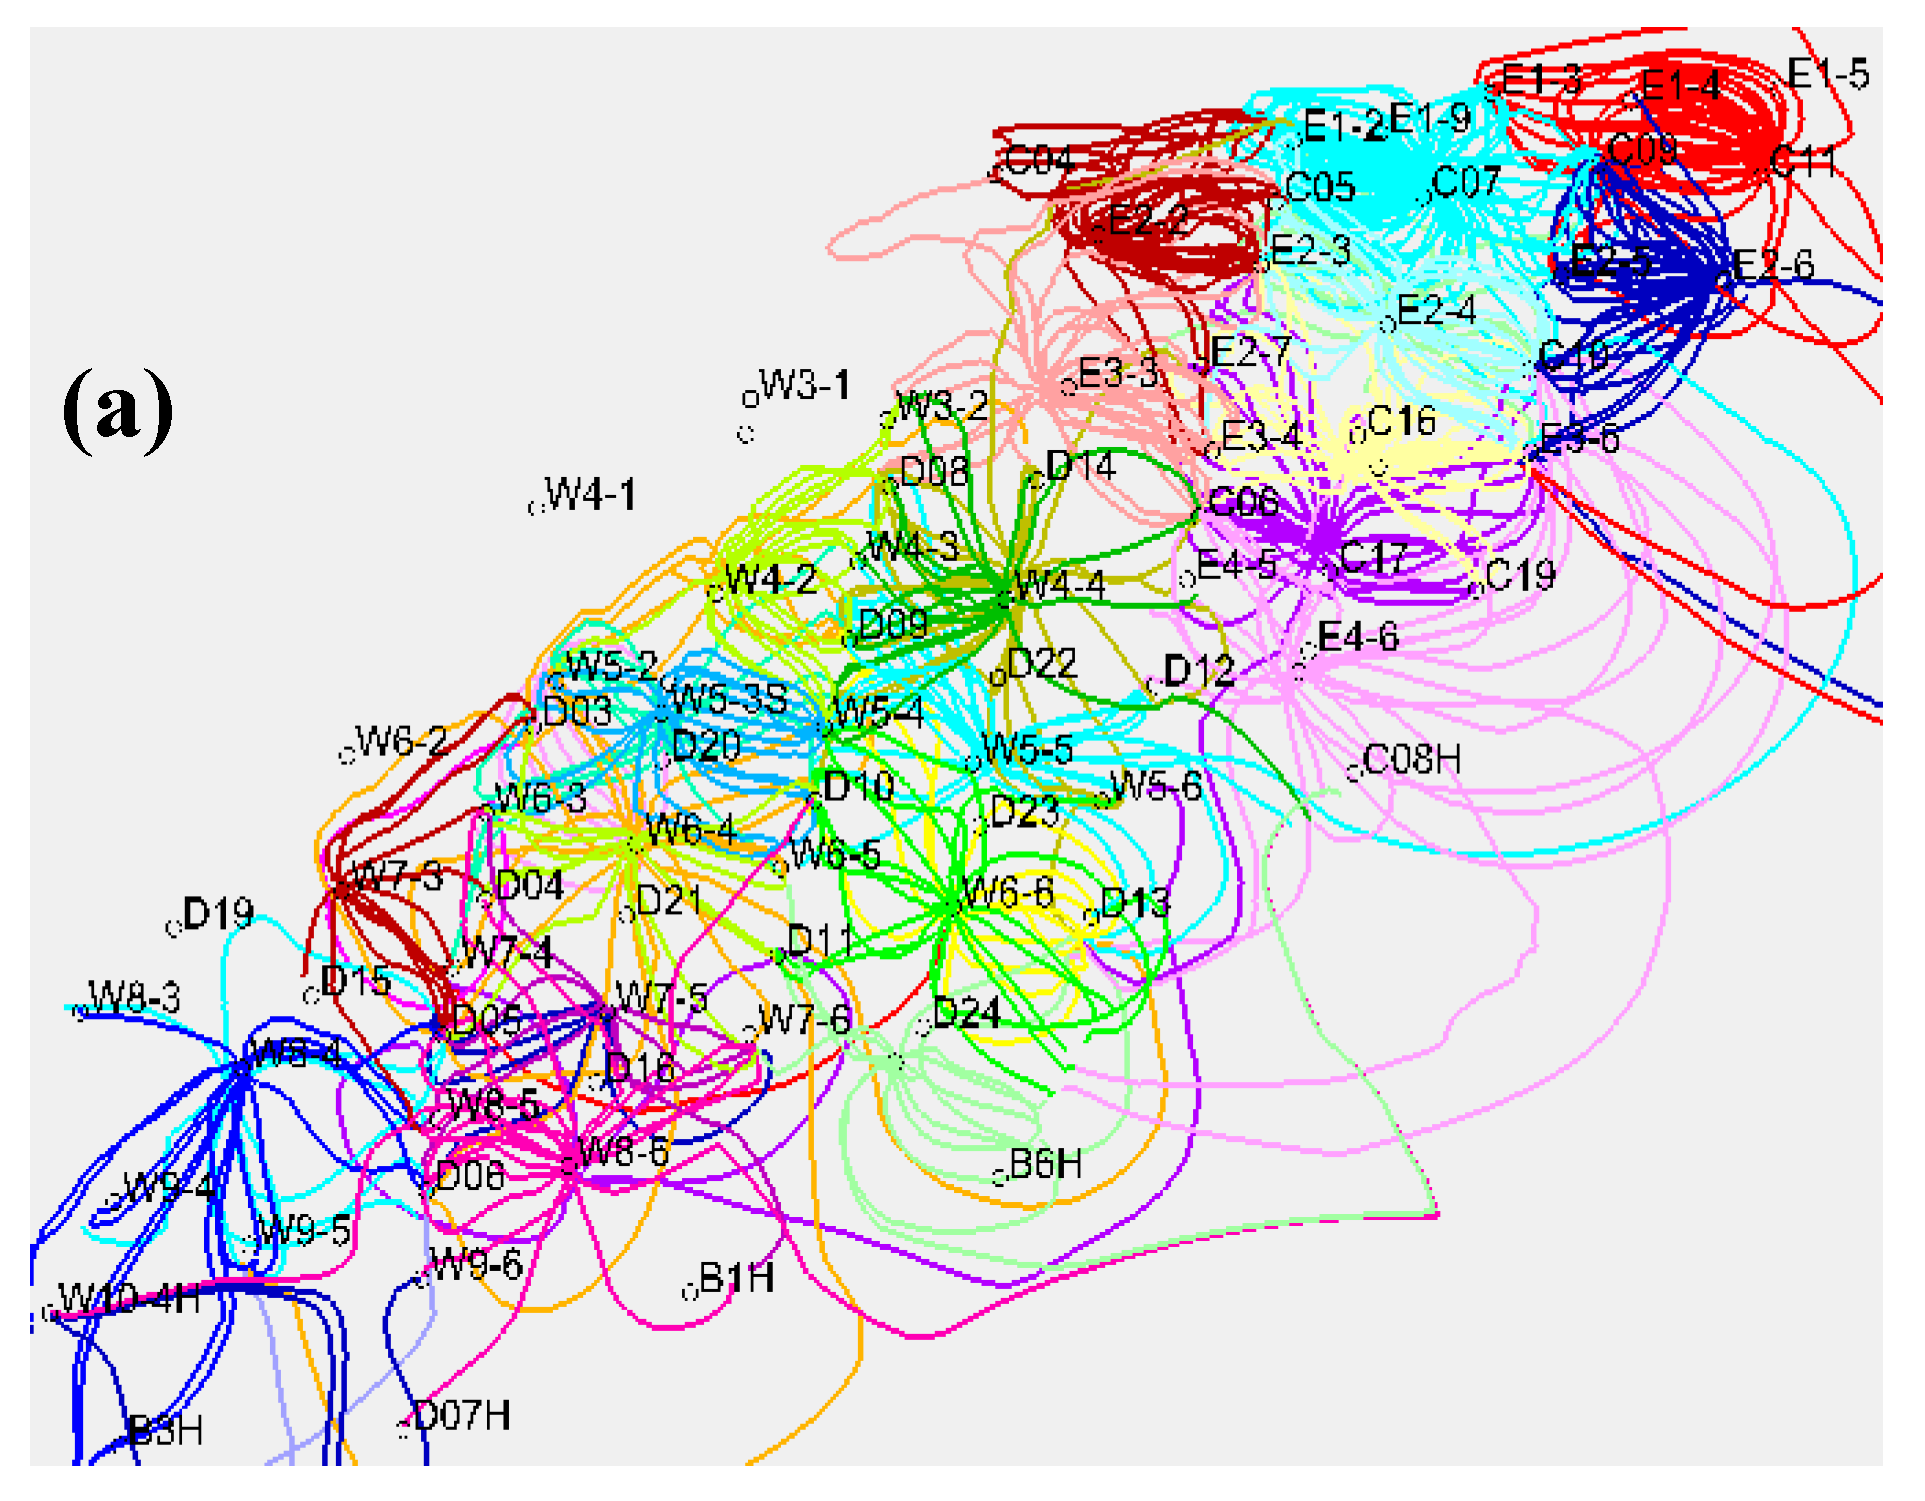
3.2.3. Analysis of Tracer Field Characteristics

In the water/polymer co-flooding stage of the conceptual model, we adopted the tracer tracking and the numerical simulation technology to track the polymer injection well 1-5 and the water injection well 2–5. For different injection PV numbers in the two wells, the tracking rules of the polymer and the water are shown in Figure 6 and Figure 7.
From the above single well polymer injection, the water injection tracer diagram could be seen: The initial injected polymer flowed uniformly from the polymer injection well 1-5 to the surrounding wells. Later, due to the influence of the water injection in well 2-2 and well 2-5 on both sides, the polymer was washed by the water, and the polymer injected from well 1-5 was prevented from flowing to both sides. Finally, the polymer injected from well 1-5 only flowed to well 1-4, well 1-6, well 2-1, well 2-3, well 2-4, and well 2-6. Most of the polymer flowed to well 1-4 and well 1-6. Well 1-1, well 1-3, well 1-7, and well 1-9 were no longer affected by the polymer injected from well 1-5. For the water injection well 2-5, the initially injected water mainly flowed to well 2-4 and well 2-6; after that, the injected water mainly flowed to well 2-4, well 2-6, well 1-4, and well 1-6. Finally, the injected water mainly flowed to well 2-4, well 2-6, well 1-4, well 1-6, well 1-7, and well 1-9, with most of the water flowing to well 1-7, well 1-9, well 2-4, and well 2-6.
In summary, in the early stage of water/polymer co-flooding, the interspaced injection wells had a certain displacement effect on the injected polymer, and the erosion was relatively serious; in the later stage of water/polymer co-flooding, due to the influence of the interspaced injection wells on both sides, the swept area of polymer was limited to some extent, and the corner wells could not be swept by the polymer; thus, the water flooding and the polymer flooding formed an obvious and fixed area.

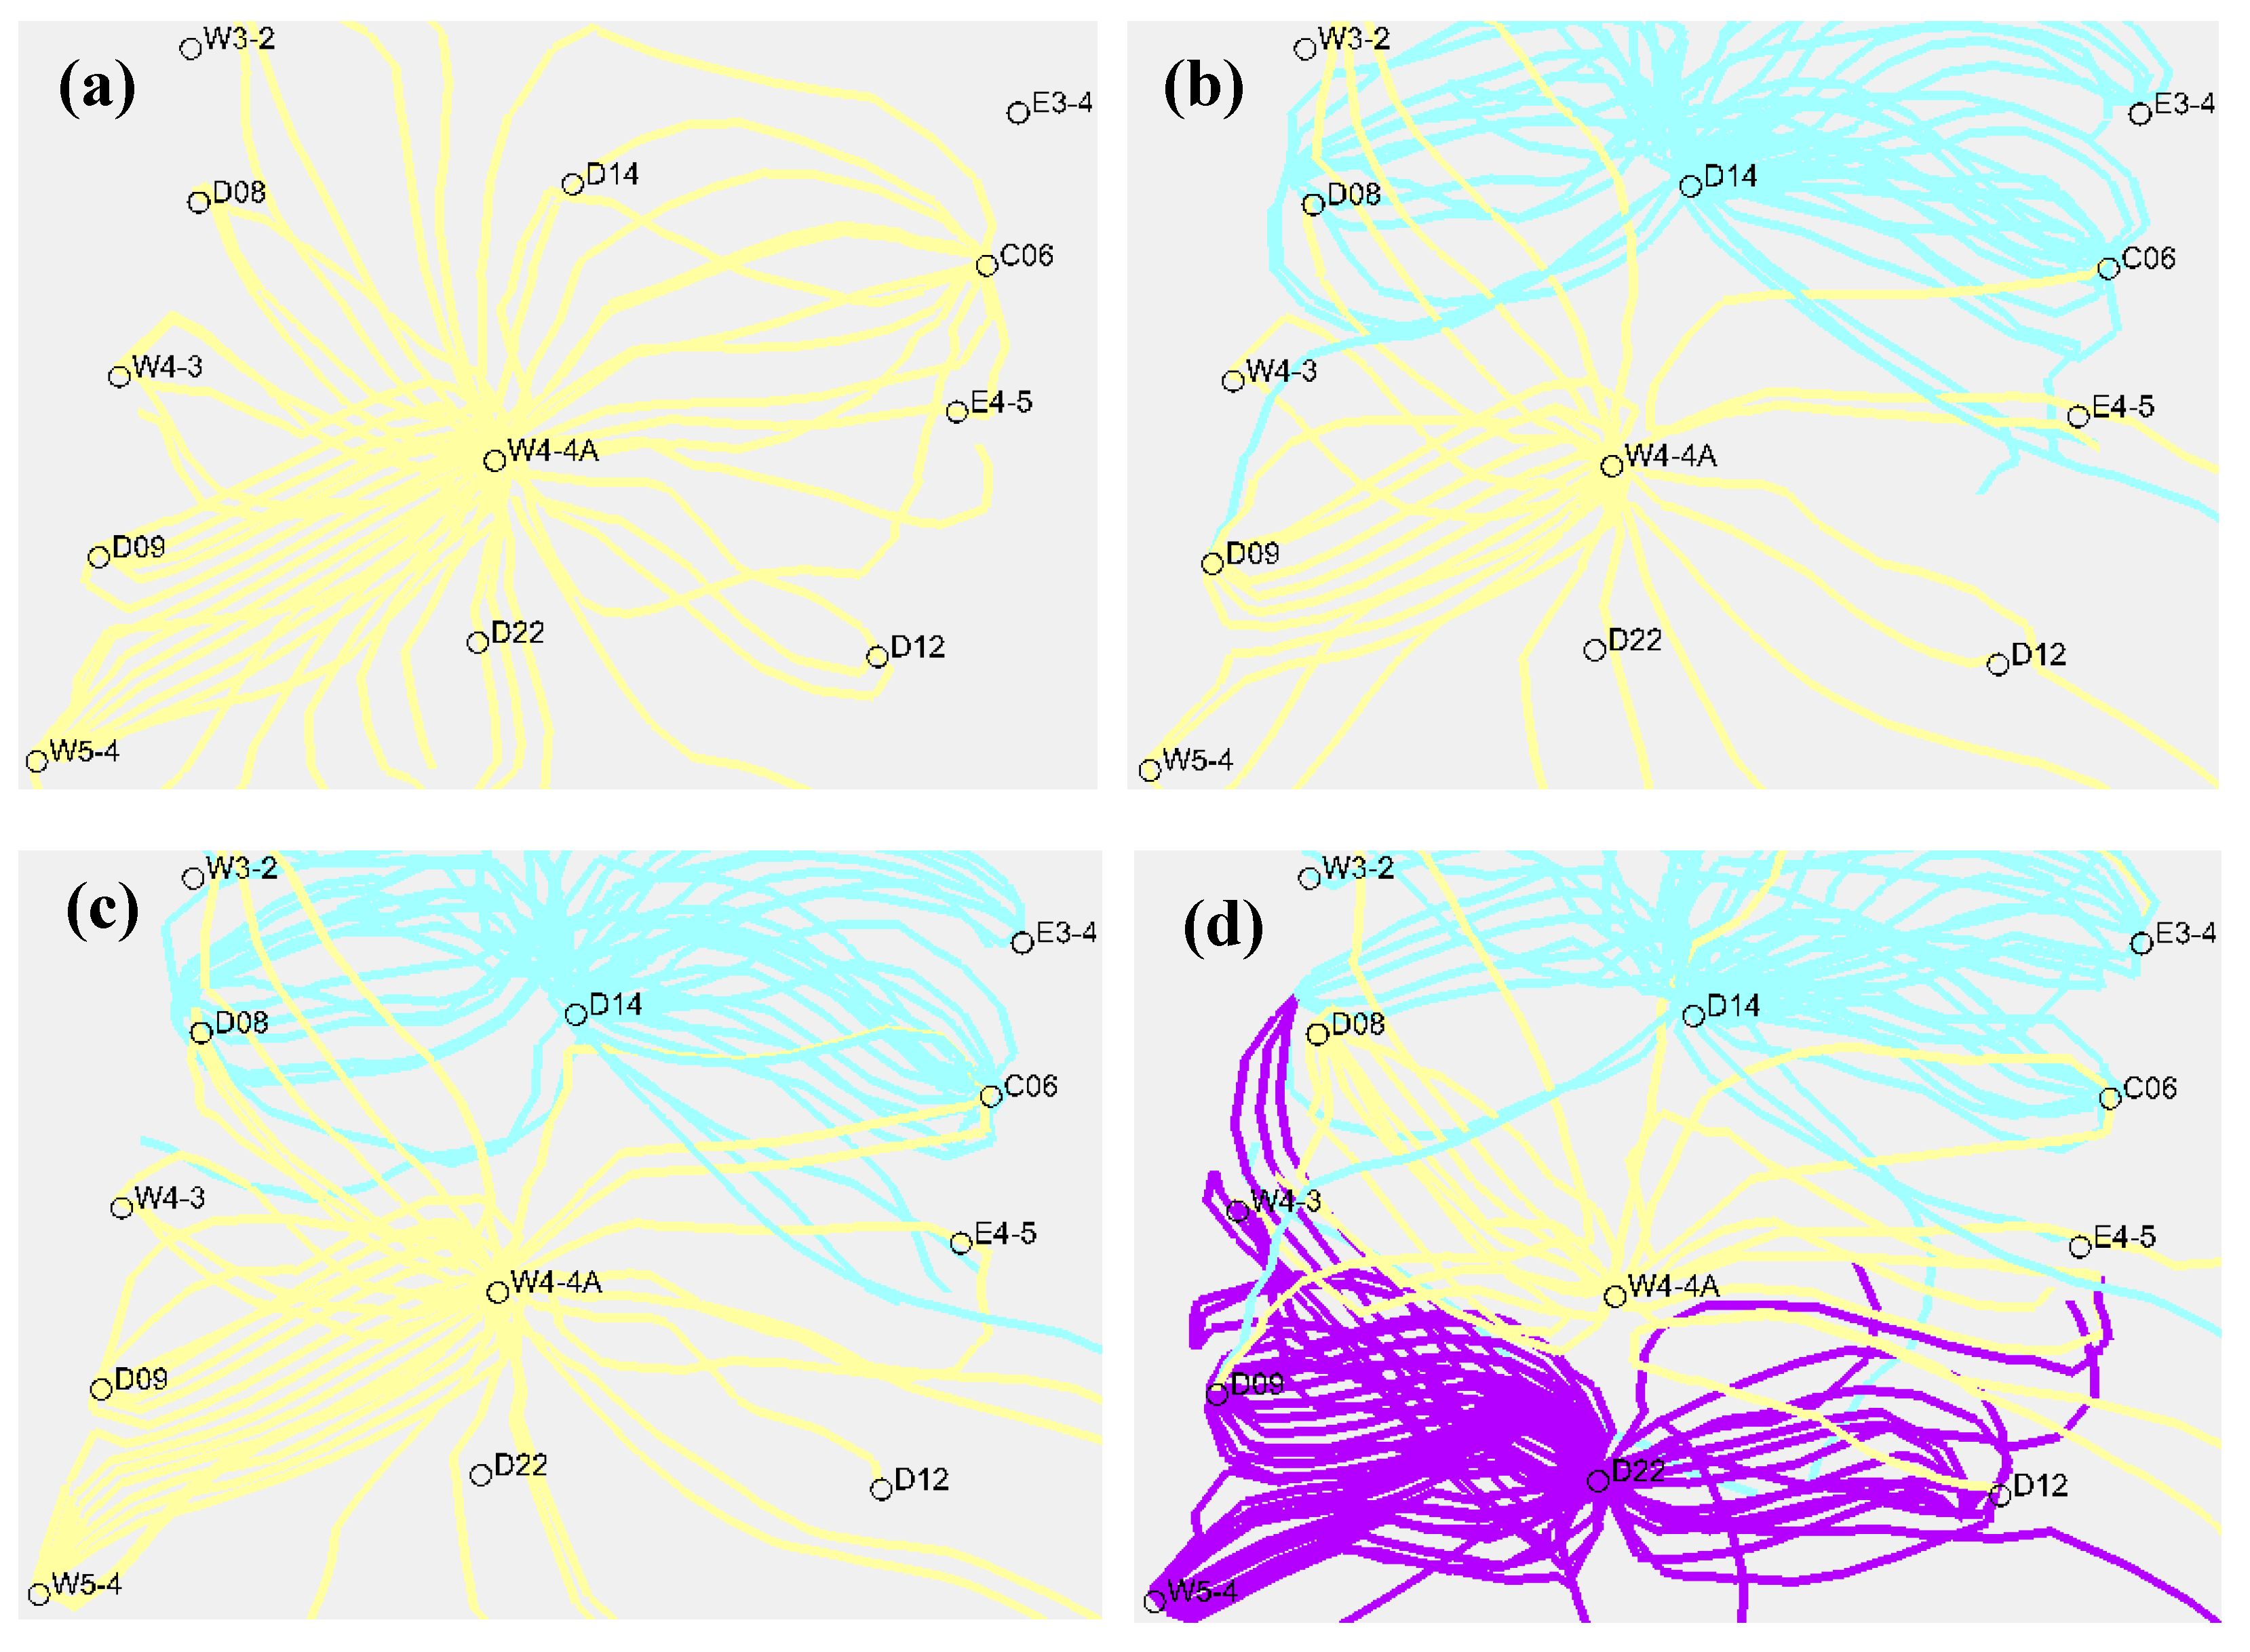
3.2.4. Quantitative Analysis of the Water/Polymer Interference

As can be seen from the streamline field and the tracer field characteristics of the water/polymer co-flooding, water flooding had a certain interference and limitation to polymer flooding in the water/polymer co-flooding. The interference and limitation were quantified by the oil increment of per ton polymer. The oil increment of per ton polymer is an important index to evaluate the effect of polymer flooding [26].
For the conceptual model, the design scheme is shown in Table 3.
In Table 3, the calculation of cumulative oil production and oil increment of per ton polymer in each prediction scheme was terminated when the water-cut of the oilfield reached 95% after the well interspaced. Here, in order to accurately quantify the degree of the water/polymer interference during the water/polymer co-flooding, a concept of the conversion ratio was proposed in addition to the oil increment of per ton polymer, which was used to calculate the cumulative oil production of scheme 1 and scheme 2 after the well interspaced. The conversion ratio was determined by scheme 1 and scheme 2, relative to scheme 3. Scheme 1 had four water injection wells (two edge wells convert to one well) and no polymer injection well. Scheme 2 had four polymer injection wells (two edge wells convert to one well) and no water injection well. Scheme 3 had three water injection wells (two edge wells convert to one well) and one polymer injection well.
In this case, 3/4 (converted ratio) of the cumulative oil production of scheme 1 after the well interspaced was equivalent to the cumulative oil production contribution of three injection wells; 1/4 (converted ratio) of the cumulative oil production of scheme 2 after the well interspaced was equivalent to the cumulative oil production contribution of one polymer injection well. We converted the cumulative oil production of scheme 1 and scheme 2 after the well interspaced according to this ratio. The sum of the converted cumulative oil production after the well interspaced was the oil production without any water and polymer flooding interference. From the results of each scheme in Table 3, compared with the whole water flooding stage after the well interspaced, the oil increment of per ton polymer by the whole polymer flooding was 35.97 m3/t, and the oil increment of per ton polymer by the water/polymer co-flooding was 22.84 m3/t. The former is greater than the latter, the interference of the oil increment of per ton polymer decreased by 36.5%. According to scheme 1 and scheme 2, the converted cumulative oil production after the well interspaced was 11.76 × 10⁴ m3, and the cumulative oil production of scheme 3 after the well interspaced was 11.42 × 10⁴ m3. The former is still greater than the latter, and both indexes reflected that there was interference in the water/polymer co-flooding.

3.3. Seepage Law Test

3.3.1. Experimental Design

To test the accuracy of the water/polymer co-flooding seepage law, the fine geological model and coarse fine geological model of the Jinzhou 9-3 oilfield were established; the streamline numerical model was established, and the history matching was carried out. All data were collected from the Jinzhou 9-3 oilfield. We collected seismic data, fault data, sedimentary facies data, hierarchical data, drilling data, logging data, perforation data, fracturing data, and production data of all the wells; the structural model, lithology model, porosity model, permeability model, saturation model were built. Then the model was initialized and the streamline numerical model was built. The model adopted the constant liquid volume production. The production index of the whole oilfield should be matched at the beginning of the history matching; then, the production index of the single well was matched. The flowchart of streamline model establishment is shown in Figure 8.
The flow line numerical model of Jinzhou 9-3 oilfield had a good matching result. According to the single well matching result, 92% of the single well matching results were close to the actual result, and the trend was consistent; therefore, they could be used to test the accuracy of the water/polymer co-flooding seepage law. The streamline field after history matching is shown in Figure 9, and the streamline field in the initial water/polymer flooding stage is shown in Figure 9a; the streamline field in injected polymer 0.1 PV of water/polymer flooding stage is shown in Figure 9b.

3.3.2. Seepage Characteristics

It could be seen from the flow field of the well group W5-3S and W4-4 (Figure 10 and Figure 11) that when the well W5-3S was flooding without water, the injected polymer mainly flowed to the surrounding wells W5-4, W5-2, D10, and W6-3. When the injected polymer volume was 0.045PV in the water/polymer co-flooding, due to the influence of the water injection in well D20, the amount of the polymer flowing from the well W5-3S to the well D10 and the well W6-3 decreased. When the injected polymer volume was 0.135PV in the water/polymer co-flooding, the injected polymer from the well W5-3S no longer flowed to the well D10 and the well W6-3, and the swept area of the polymer injected from the well W5-3s was significantly reduced. When the well W4-4 was flooding without water, the injected polymer mainly flowed to the surrounding wells W3-2, D08, W4-3, D09, W5-4, C06, E4-5, and D12. When the injected polymer volume was 0.045PV in the water/polymer co-flooding, due to the influence of the water injection in well D14, the amount of polymer flowing from the well W4-4 to the wells D08, W3-2, and C06 decreased. When the injected polymer volume was 0.135 PV in the water/polymer co-flooding, the well D22 was put into production again, the W4-4 was affected by the water injection wells D14 and D22 on both sides of the north and south. The polymer injected from the well W4-4 mainly flowed to the wells W4-3, D08, and E4-5, while the wells W5-4, D12, D09, and W3-2 were no longer affected by the polymer injection well W4-4.
In summary, in the stage without water/polymer co-flooding, the polymer was uniformly pushed around, and in the water/polymer co-flooding stage, the water injection well had a great influence on the polymer seepage, and the swept area of the polymer was significantly reduced. This seepage law was consistent with the seepage law of the conceptual model, indicating that the above water/polymer co-flooding seepage law is accurate.

3.3.3. Other Seepage Characteristics

The offshore oilfield had a strong heterogeneity. After long-term development of water injection and polymer injection, the pore characteristics, heterogeneity, wettability of the reservoir changed greatly [27,28]. In the late stage of water/polymer co-flooding, low-efficiency channels were formed between the oil wells and the water wells, and the injected water and polymer flowed directionally along the low-efficiency channels, resulting in a smaller swept volume and a lower oil increment of per ton polymer of the polymer flooding.
According to the results of the numerical simulation, combined with the real water absorption and production profile test results of the Jinzhou 9-3 oilfield, we analyzed and concluded that the dominant seepage channels in the stage of water/polymer co-flooding were mainly distributed in the wells W4-2, W4-4, W5-3S, W7-3, W8-4, D16, D20, and D21 of the oil group I and wells W6-4, W6-6, and W8-6 of the oil group II-III. The water and polymer flooding status of the oil group I is shown in Figure 12.
In addition, from a vertical perspective, when the polymer injection volume was 0.2 PV in water/polymer co-flooding, we saw from the vertical polymer injection streamline model of the well W8-4 (as shown in Figure 13) that the polymer from the well W8-4 mainly flowed to the oil group I with good physical properties in the upper section, while the amount of polymer absorption of the oil group II-III in the lower section with relatively poor physical properties was less. When the water injection volume was 0.2 PV in the water/polymer co-flooding, we saw from the vertical polymer injection streamline model of the well D20 (as shown in Figure 14) that the injected water from the well D20 mainly flowed to the oil group I with good physical properties, and the amount of water absorption of the oil group II-III was less.
The Jinzhou 9-3 oilfield mainly had a Delta estuary dam sand body, and it was mainly the complex rhythm and the inverse rhythm. Most of the highest permeability reservoir stratums were located the oil group I at the top or upper part of the reservoir. In the process of the water injection and in the polymer injection development process, the injected water, polymer, and edge water tended to seep along the high permeability zone of the oil group I located in the upper section, and the remaining oil was mostly concentrated in the middle and the lower sections of the reservoir [29,30]. In summary, due to the heterogeneity of the reservoir, the highest permeability reservoir stratums were located in the oil group I at the top or upper part of the reservoir. In the late stage of water/polymer co-flooding, the injected water and polymer mainly flowed to the oil group I with good physical properties, and the amount of water and polymer absorption of the oil group II-III was less. This phenomenon would lead to inefficient circulation, and the utilization rate of the injected water and polymer was low, which affected the oil-displacement effect of the water and polymer.

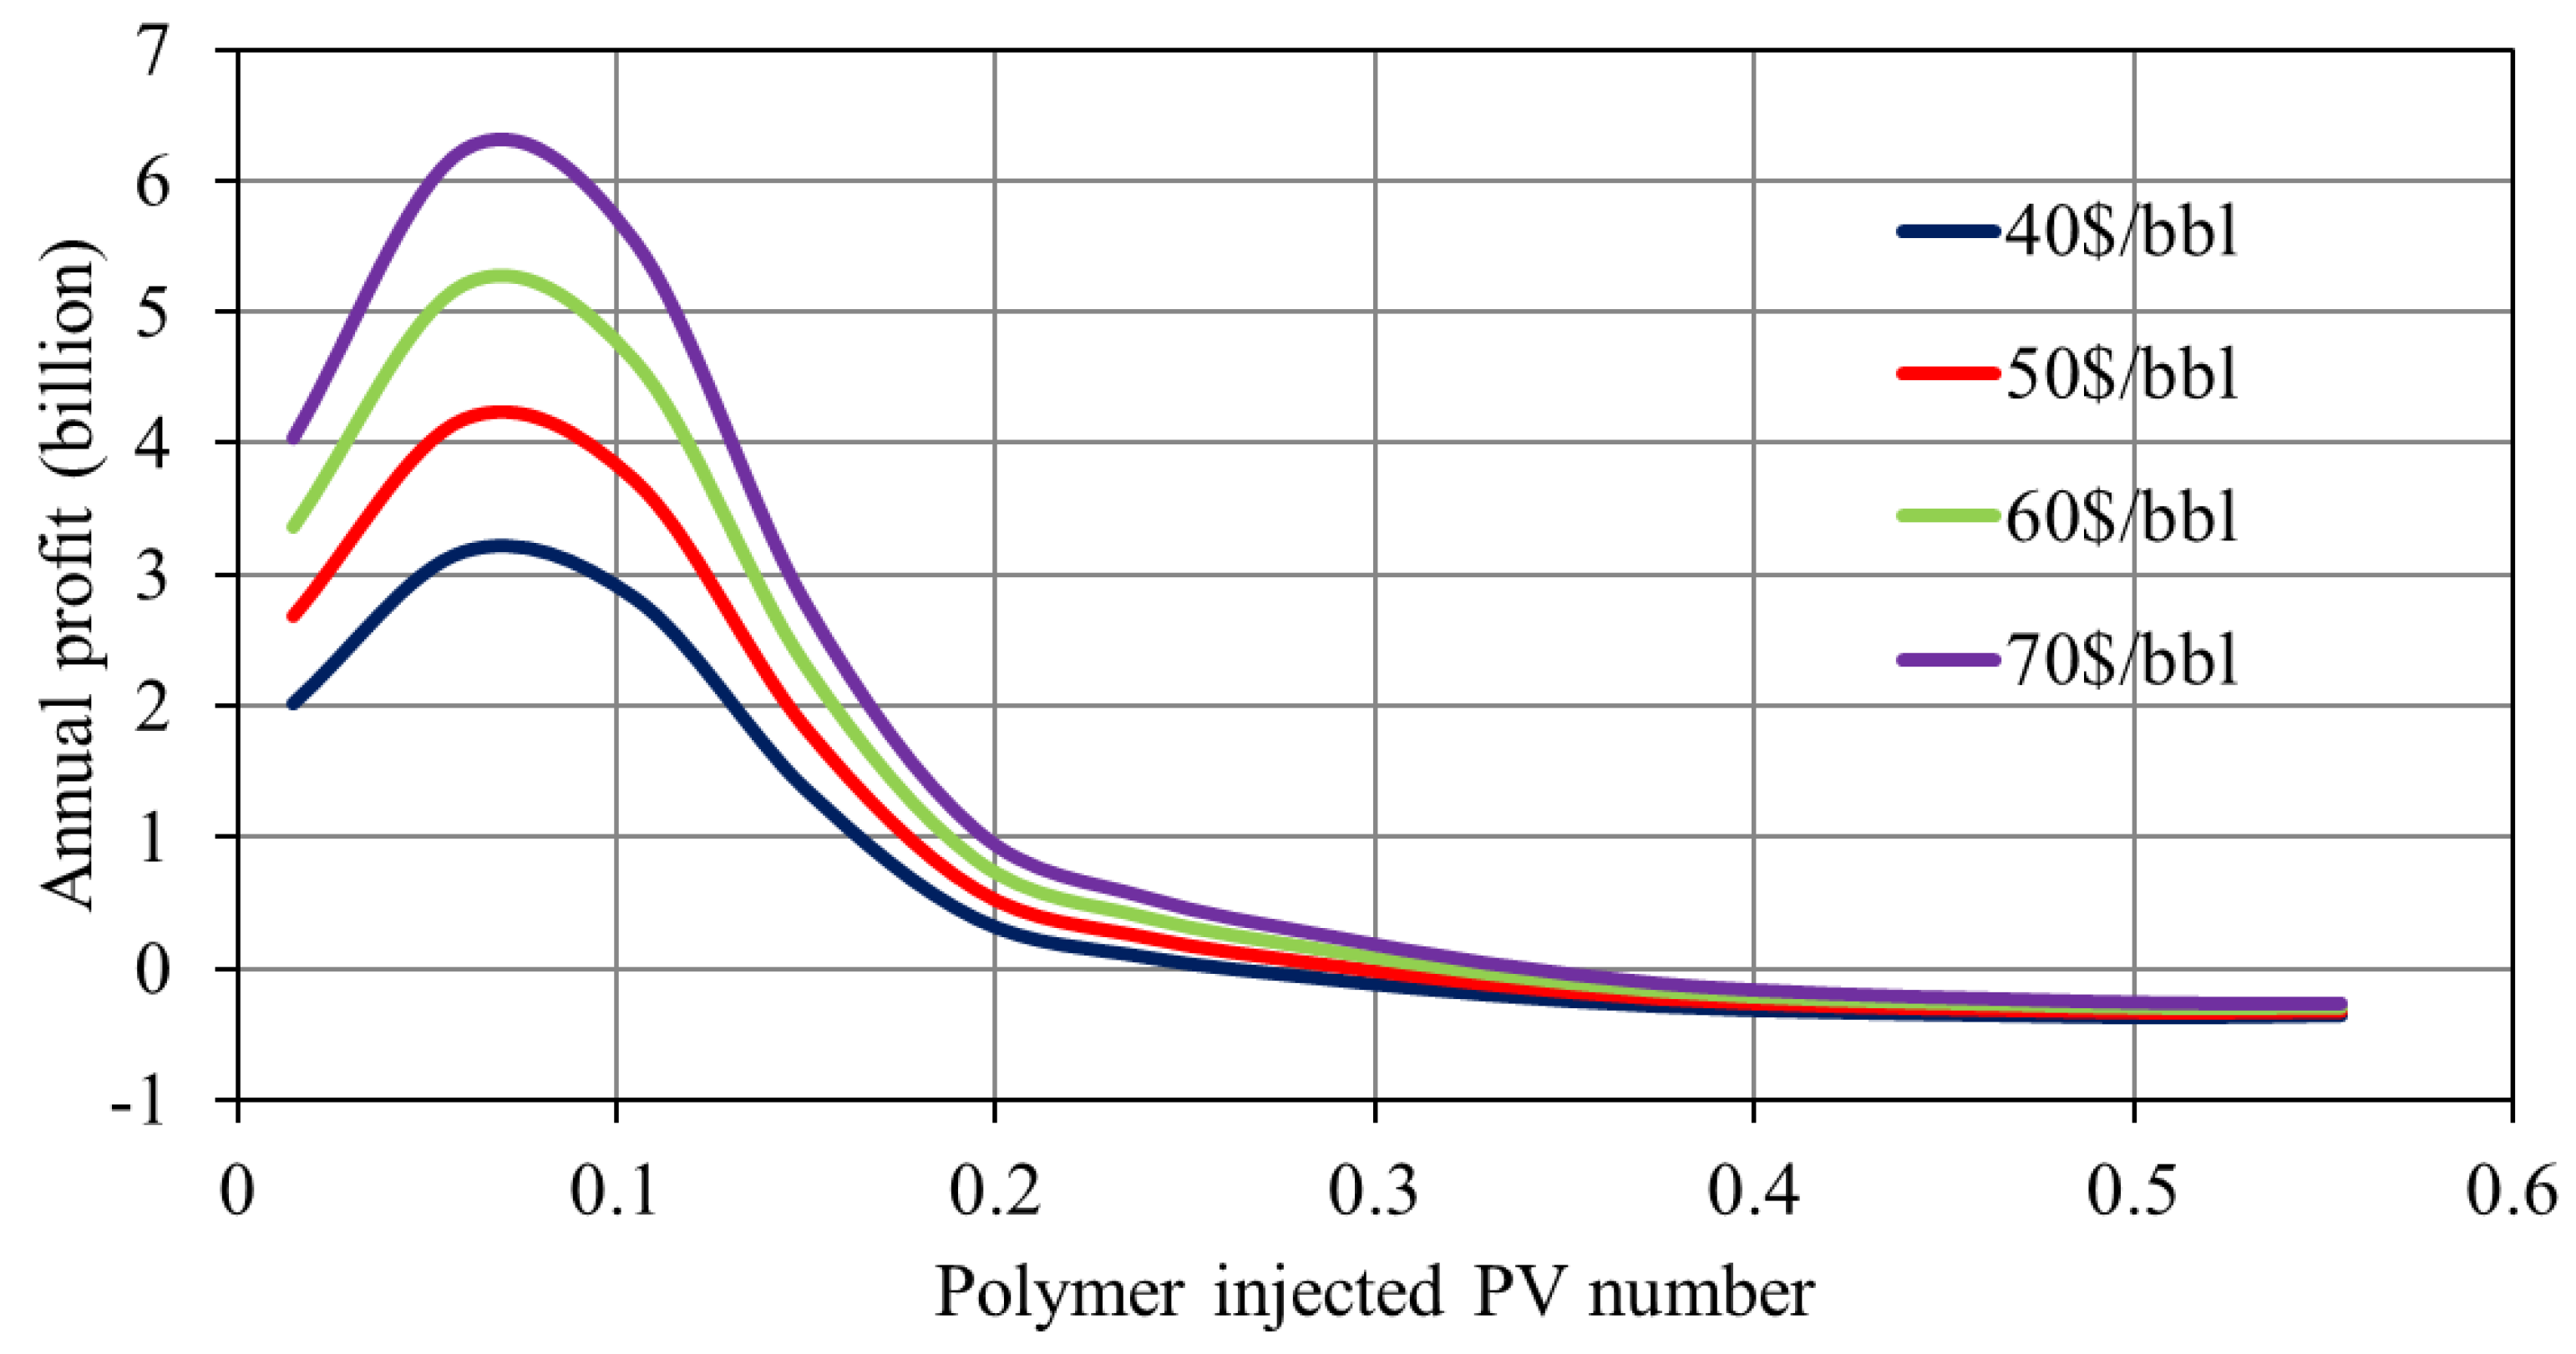
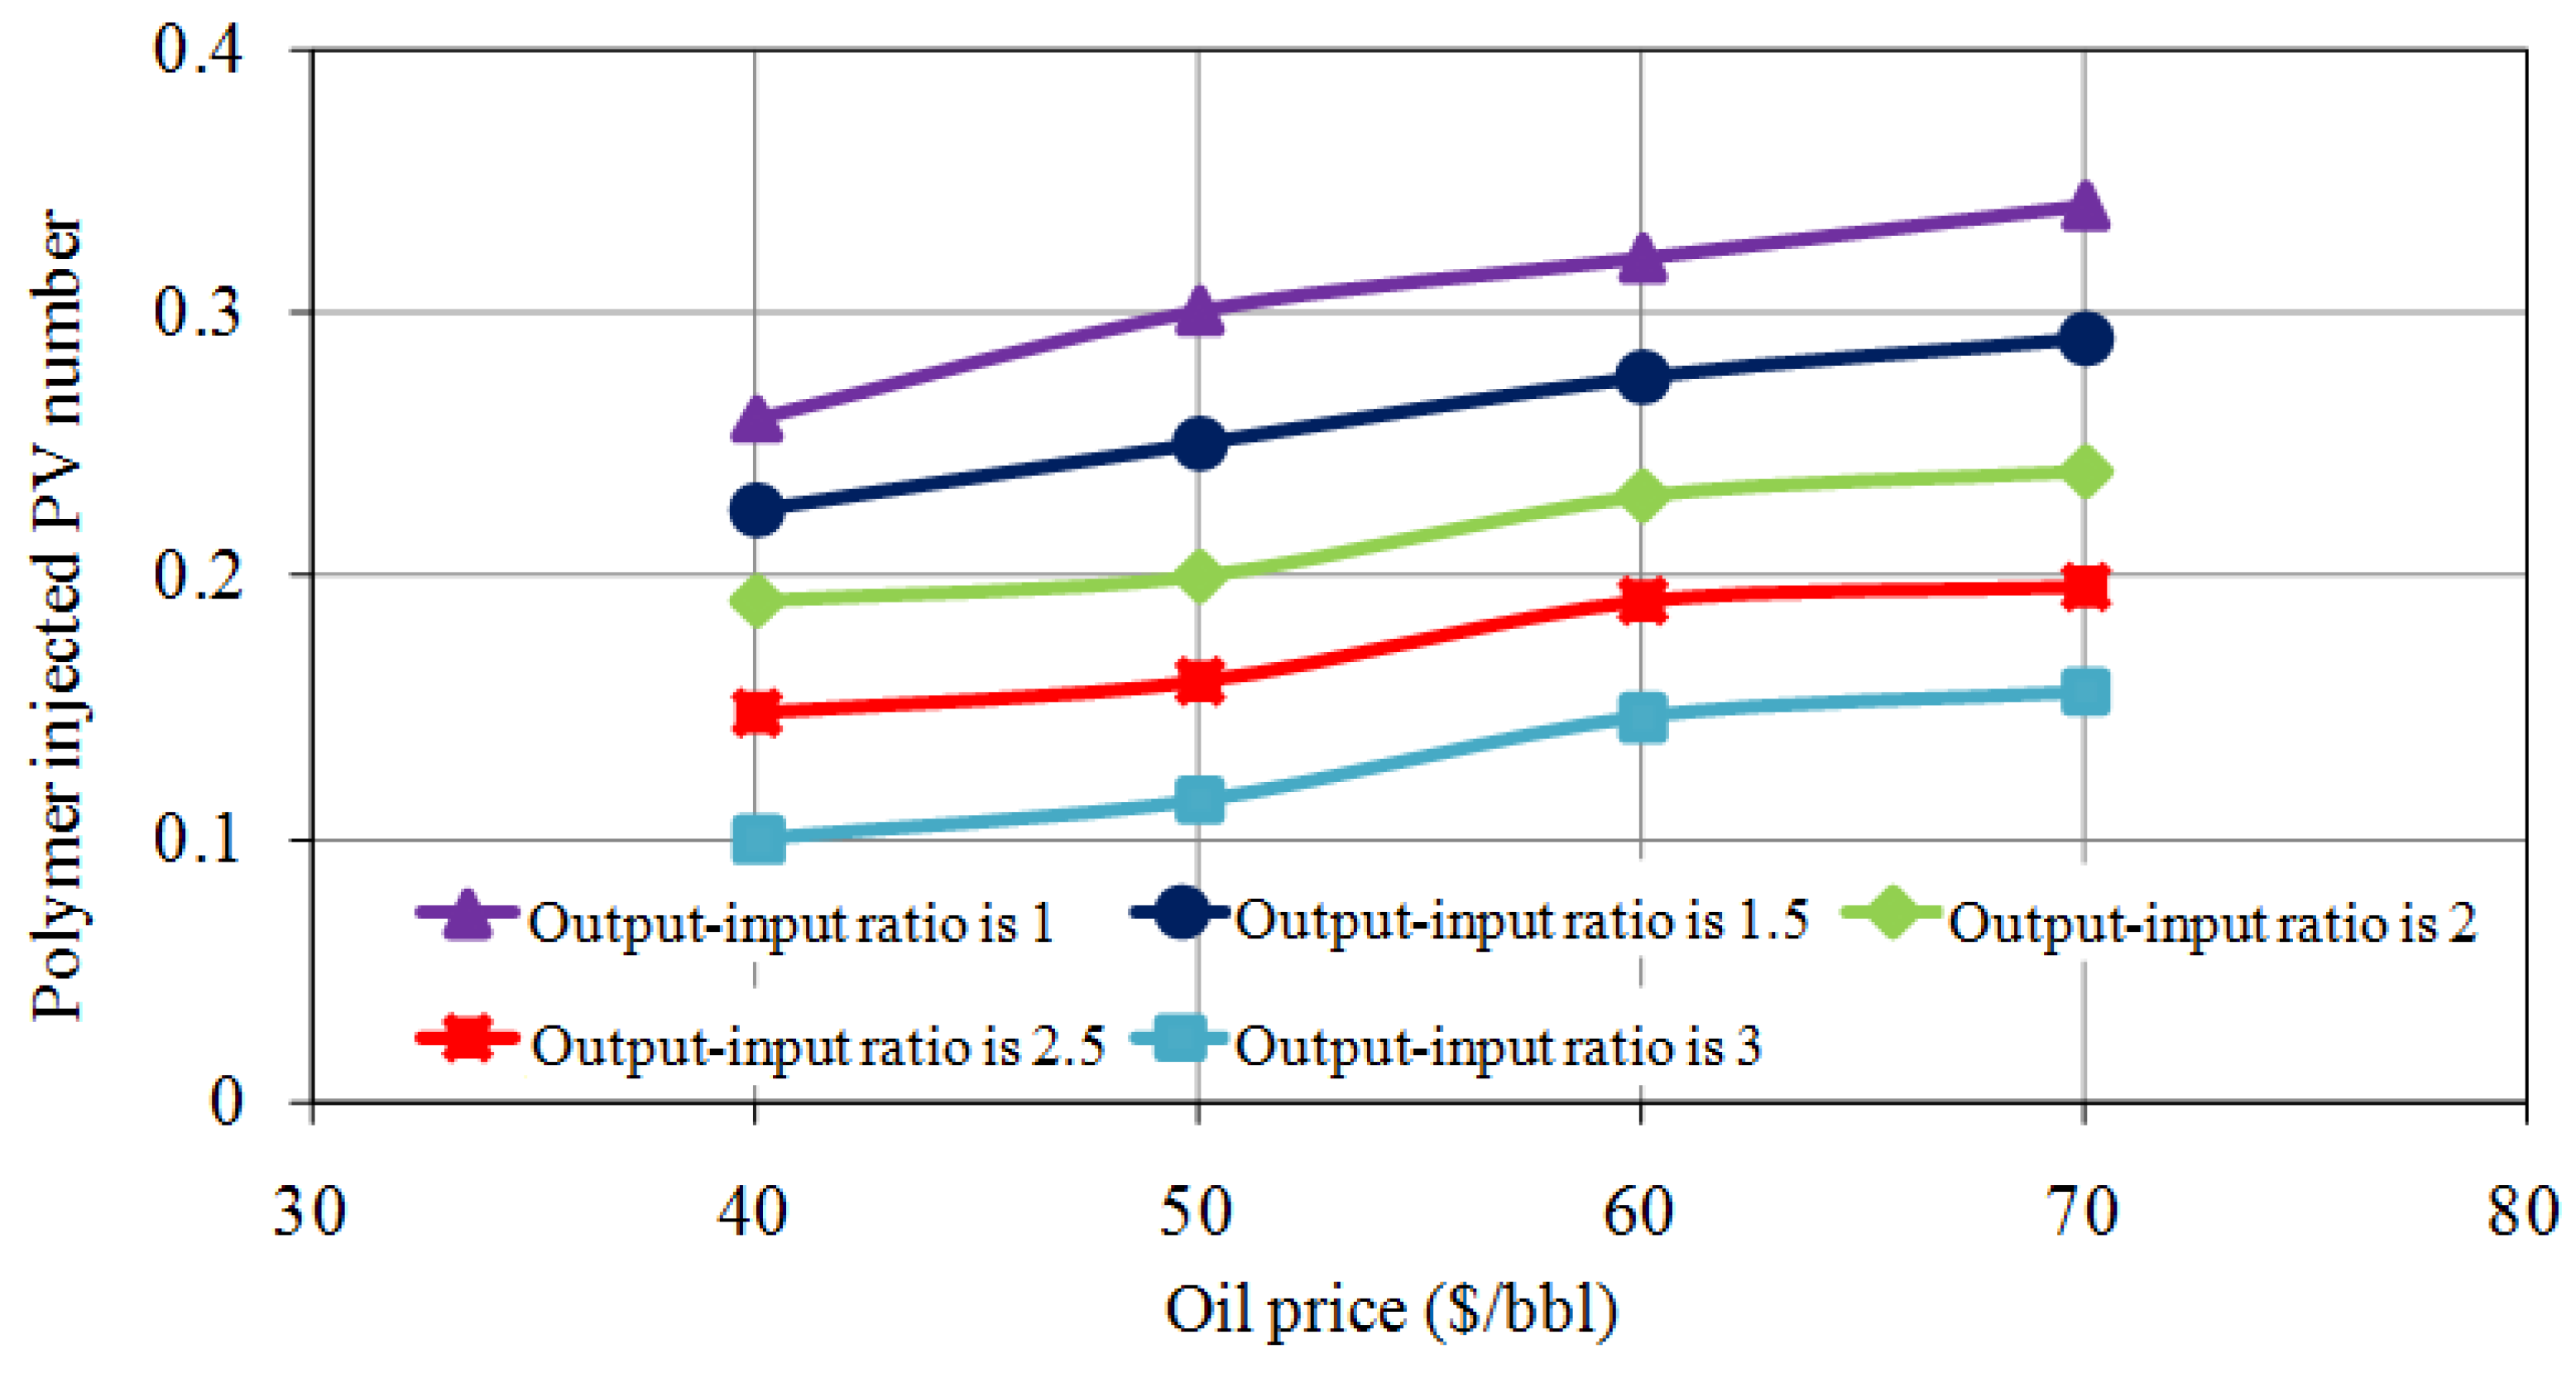
4. Analysis of Reasonable Polymer Injection Volume in the Water/Polymer Co-Flooding Stage

According to the above analysis, in the water/polymer co-flooding stage of the Jinzhou 9-3 oilfield, the oil production decreased, the water-cut increased and the polymer store rate decreased with the development of the oilfield. The polymer was restricted, the swept area and swept volume of the polymer flooding were reduced, and the phenomenon of the water and polymer breakthrough appeared. The effect was noticeably worse, and the water and polymer interference phenomenon was clear. Therefore, it was necessary to search for a reasonable polymer injection volume in the water/polymer co-flooding stage to achieve the best result. Here, the economic law was adopted to determine a reasonable polymer injection volume in the water/polymer co-flooding stage. Based on the actual model of the Jinzhou 9-3 oilfield, we used the economic law to predict the oil production in the water/polymer co-flooding stage and calculate the reasonable polymer injection volume under the different oil prices and output–input ratios. The calculation results are shown in Figure 15 and Figure 16.
From Figure 16, the increase of oil price in the water/polymer co-flooding stage, the polymer injected PV number increased, because the polymer flooding contributed to increase the oil production. When the annual profit was set at 0, the output-input ratio of the oilfield was 1; the point at which the output–input ratio is 1 moves back with the increase of the oil price. If the oil price was 50 dollars/bbl, the reasonable polymer injection volume was 0.59 PV, and the continuous polymer injection volume was 0.29 PV in the water/polymer co-flooding stage. When the output–input ratio was at 2, the reasonable polymer injection volume was 0.5 PV, and the continuous polymer injection volume was 0.2 PV in the water/polymer co-flooding stage.
The annual profit of the oilfield is also affected by many other factors, such as labor cost, depreciation charge, tax, national policy, international situation, etc. The development investment cost is composed of drilling cost, completion cost, facility cost, and transport cost; the accuracy of each cost is directly related to the accuracy of investment. In the development of offshore oilfield, the characteristics of the oilfield and environmental conditions change greatly. Therefore, the calculation results may not be suitable for special situations or other oilfields. The complex and changeable offshore environment has a great influence on the investment cost of oilfield development. It not only affects the cost of production facilities installation but also affects the production time of oilfield. Therefore, there is great uncertainty in the calculation results, and the similar oilfields should be analyzed according to their own circumstances.

5. Conclusions

In the water/polymer co-flooding stage, the liquid yield of old wells in the oilfield basically remained unchanged, the oil production decreased, and the water-cut increased. The oil production of the interspaced production wells decreased rapidly, and the water-cut was generally higher. The annual decrease of the polymer store rate increased by 2.02 times.
At the early stage of the water/polymer co-flooding, the interspaced water injection wells had a certain displacement effect on the polymer injected into the reservoir, and the erosion was serious; in the later stage of the water/polymer co-flooding, due to the influence of the interspaced water injection wells, the swept area of the polymer in the polymer injection wells was limited to some extent.
In the stage of the water/polymer co-flooding, mutual interference between the water and polymer existed, and the interference of the oil increment of per ton polymer decreased by 36.5%. In the later stage of the water/polymer co-flooding, the utilization rate of certain water injection and polymer injection wells was low, and the plane swept scope and vertical swept volume were small.
According to the economic law, when the output–input ratio was set at 1, the reasonable polymer injection volume was 0.59 PV, and the continuous polymer injection volume was 0.29 PV in the water/polymer co-flooding stage, and when the output-input ratio was at 2, the reasonable polymer injection volume was 0.5 PV, and the continuous polymer injection volume was 0.2 PV in the water/polymer co-flooding stage.
The study results could effectively guide the reasonable volume of polymer injection and improve the development benefit of the Jinzhou 9-3 oilfield. Moreover, they could also provide the references for the development of the same type of oilfield.

Author Contributions

Conceptualization, writing—original draft, investigation, J.W.; funding acquisition, supervision, K.S. and C.D.; project administration, formal analysis, L.S.; methodology, L.T.; writing—review and editing, G.C.; visualization, K.S. All authors have read and agreed to the published version of the manuscript.

Funding

This research was supported by the national key natural science foundation project “New Method of Oil Displacement Phase Self-expanding Sweep Volume to Improve Oil Recovery” (No. 51834005), and the major national science and technology project “Research On Comprehensive Adjustment Technology of Chemical Flooding in Offshore Oil Fields” (No. 2016ZX05025003), and Natural Science Foundation of Northeast Petroleum University (No. 2017QNJL04).

Conflicts of Interest

The authors declare no conflict of interest.

References

  1. Du, W. Observations of China’s oil industry in the 13th Five-Year Plan period. Int. Pet. Econ. 2017, 25, 28–32. [Google Scholar]
  2. Zhu, Y. Current developments and remaining challenges of chemical flooding EOR techniques in China. In Proceedings of the SPE Asia Pacific Enhanced Oil Recovery Conference, Kuala, Lumpur, Malaysia, 11–13 August 2015. [Google Scholar]
  3. Manrique, E.; Thomas, C.P.; Ravikiran, R.; Izadi, M.; Lantz, M.; Romero, J.L.; Alvarado, V. EOR: Current status and opportunities. In Proceedings of the SPE Improved Oil Recovery Symposium, Tulsa, OK, USA, 24–28 April 2010. [Google Scholar]
  4. Wang, D.M.; Cheng, J.C.; Wu, J.Z.; Wang, G. Application of polymer flooding technology in Daqing Oilfield. Acta Pet. Sin. 2005, 26, 74–78. [Google Scholar]
  5. Wu, Y.F.; Mahmoudkhani, A.; Watson, P.; Fenderson, T.R.; Nair, M. Development of new polymers with better performance under conditions of high temperature and high salinity. In Proceedings of the SPE EOR Conference at Oil and Gas West Asia, Muscat, Oman, 16–18 April 2012. [Google Scholar]
  6. Cleverson, E.; Nima, R.; Amer, A.; Sohrab, Z. Comprehensive review of carbonated water injection for enhanced oil recovery. Fuel 2019, 237, 1086–1107. [Google Scholar]
  7. Kamal, M.S.; Sultan, A.; Al-Mubaiyedh, U.A.; Hussein, I.A. Review on polymer flooding: Rheology, adsorption, stability, and field applications of various polymer systems. Polym. Rev. 2015, 55, 491–530. [Google Scholar] [CrossRef]
  8. Schneider, F.N.; Owens, W.W. Steady-state measurements of relative permeability for polymer/oil systems. Soc. Pet. Eng. J. 1982, 22, 79–86. [Google Scholar] [CrossRef]
  9. Sheng, J.J.; Leonhardt, B.; Azri, N. Status of polymer-flooding technology. J. Can. Pet. Technol. 2015, 54, 116–126. [Google Scholar] [CrossRef]
  10. Feng, Y.L. Simulation on Polymer Flooding and Water Flooding Working Together in Class II Reservoir. Ph.D. Thesis, Daqing Petroleum College, Daqing, China, 2007. [Google Scholar]
  11. Zhao, C.S.; Cui, G.Q.; Fu, Z. Numerical simulation study on the optimization of cycle injection and production scheme in middle and high water cut period. Spec. Oil Gas Reserv. 2009, 16, 61–63. [Google Scholar]
  12. Song, W.L.; Yuan, Y.W.; Liu, Q.J.; Sun, G.; Cui, G. Optimization of the injection parameters in the region of water and polymer flooding together in type II oil reservoir. In Proceedings of the Power & Energy Engineering Conference, Chengdu, China, 28–31 March 2010. [Google Scholar]
  13. Yan, W.H. Research on Methods of Improving Polymer Flooding Efficiency in Sub-Layers Reservoir of Daqing Oil Field. Ph.D. Thesis, Daqing Petroleum College, Daqing, China, 2008. [Google Scholar]
  14. Pang, X.H. The Optimization Study on the Water Polymer Flooding Together to Daqing Oilfield Xing Twelve Blocks. Master’s Thesis, Northeast Petroleum University, Daqing, China, 2016. [Google Scholar]
  15. Xu, Z.S.; Zhang, J.H.; Feng, Z.H.; Fang, W.; Wang, F.L. Characteristics of remaining oil viscosity in water-and polymer-flooding reservoirs in Daqing oilfield. Sci. Sin. 2010, 53, 76–87. [Google Scholar] [CrossRef]
  16. Yu, X.Y. The Study of Optimizing Injection-Production Designing Method. Master’s Thesis, Northeast Petroleum University, Daqing, China, 2012. [Google Scholar]
  17. Liu, Y.G. New Progress in Water Injection Control Technology in Bohai Oilfield; Chemical Industry Press: Beijing, China, 2013. [Google Scholar]
  18. Zendehboudi, S.; Rezaei, N.; Lohi, A. Applications of hybrid models in chemical, petroleum, and energy systems: A systematic review. Appl. Energy 2018, 228, 2539–2566. [Google Scholar] [CrossRef]
  19. Deng, Y.H.; Li, J.P. Formation Mechanism of Shallow Reservoir: Take Bohai oil Region as an Example; Petroleum Industry Press: Beijing, China, 2008. [Google Scholar]
  20. Pei, J.Y.; Yang, J.H.; Yang, Y.J.; Hu, J. Designing and optimizing techniques of the injected profile monitoring program in the oilfield development. Pet. Geol. Oilfield Dev. Daqing 2018, 37, 133–137. [Google Scholar]
  21. Goodarzi, F.; Zendehboudi, S. A comprehensive review on emulsions and emulsion stability in chemical and energy industries. Can. J. Chem. Eng. 2018, 97, 281–309. [Google Scholar] [CrossRef] [Green Version]
  22. Zhu, Y.; Gao, W.B.; Li, R.S. Action laws and application effect of enhanced oil recovery by adjustable-mobility polymer flooding. Acta Petrol. Sin. 2018, 39, 189–200. [Google Scholar]
  23. Zhang, R.L.; Yin, X.L.; Winterfeld, P.H.; Wu, Y.S. A fully coupled thermal-hydrological-mechanical-chemical model for CO2 geological sequestration. J. Nat. Gas Sci. Eng. 2016, 28, 280–304. [Google Scholar] [CrossRef] [Green Version]
  24. Dailami, K.; Nasriani, H.R.; Sajjadi, S.A.; Alizadeh, N. Optimizing oil recovery factor by horizontal and vertical infill drilling using streamline simulation in an Iranian oil reservoir. Energy Sources Part A Recovery Util. Environ. Eff. 2017, 1–8. [Google Scholar] [CrossRef]
  25. Feng, Q.H.; Li, S.H. Automatic matching for interwell tracer production curve. Petrol. Explor. Dev. 2005, 32, 121–124. [Google Scholar]
  26. Zhu, K.; Li, J.Y.; Fei, G.Q.; Xie, P.H. Synthesis and oil displacement performance of surface active polymer with long carbon side chain. Spec. Petrochem. 2019, 36, 1–6. [Google Scholar]
  27. Liu, Y.Y.; Kang, X.D.; Wei, Z.J.; Hao, J.L.; Zhang, J. Permeability contrast of offshore layered unconsolidated sandstone reservoir. Fault-Block Oil Gas Field 2018, 25, 78–81. [Google Scholar]
  28. Dehdaria, B.; Parsaeia, R.; Riazia, M.; Rezaeib, N.; Zendehboudi, S. New insight into foam stability enhancement mechanism, using polyvinyl alcohol (PVA) and nanoparticles. J. Mol. Liq. 2020. [Google Scholar] [CrossRef]
  29. Fan, Y.E.; Wang, H.F.; Hu, G.Y.; Song, L.M.; Zhang, J.Y.; Zhang, X.W. Anatomy method of composite sand body architecture in offshore oilfield and its application. China Offshore Oil Gas 2018, 30, 106–116. [Google Scholar]
  30. Zhang, Y.B.; Lu, X.G.; Wang, T.T.; Liu, Y.G.; Xia, H.; Chen, Y. Study on technology of multi-stage plugging and profile control for advantage channels in Bohai Oilfield. Pet. Geol. Recovery Effic. 2018, 25, 82–88. [Google Scholar]
Figure 1. The schematic diagram of the Jinzhou 9-3 oilfield. (a) Inverted nine-spot well pattern and (b) Row well pattern.
Processes 08 00515 g001
Figure 2. The daily oil production and water cut change law of old wells.
Processes 08 00515 g002
Figure 3. The daily oil production and water cut change law of new wells.
Processes 08 00515 g003
Figure 4. The polymer store rate’s change law of the Jinzhou 9-3 oilfield.
Processes 08 00515 g004
Figure 5. The change law of the streamline field in the model of the (a) water flooding stage, (b) polymer flooding stage, (c) injection of polymer, 0.1 PV of water/polymer flooding, (d) injection of polymer, 0.2 PV of water/polymer flooding, (e) injection of water, 0.1 PV of subsequent water flooding, and (f) injection of water, 0.2 PV of subsequent water flooding.
Processes 08 00515 g005aProcesses 08 00515 g005b
Figure 6. The polymer (a) injected, 0 PV, (b) injected, 0.045 PV, (c) injected, 0.09 PV, (d) injected, 0.135 PV, (e) injected, 0.18 PV, (f) injected, 0.225 PV, (g) injected, 0.27 PV, (h) injected, 0.315 PV, (i) injected, 0.36 PV, (j) injected, 0.405 PV, (k) injected, 0.45 PV, and (l) injected, 0.495 PV tracer diagrams of the well 1-5.
Processes 08 00515 g006
Figure 7. The water (a) injected, 0.06 PV, (b) injected, 0.12 PV, (c) injected, 0.18 PV, (d) injected, 0.24 PV, (e) injected, 0.3 PV, (f) injected, 0.36 PV, (g) injected, 0.42 PV, (h) injected, 0.48 PV, (i) injected, 0.54 PV, (j) injected, 0.6 PV, (k) injected, 0.66 PV, and (l) injected, 0.72 PV tracer diagrams of the well 2-5.
Processes 08 00515 g007aProcesses 08 00515 g007b
Figure 8. The flowchart of streamline model establishment.
Processes 08 00515 g008
Figure 9. The streamline field of the (a) initial and (b) injected polymer 0.1 PV in the water/polymer flooding stage.
Processes 08 00515 g009aProcesses 08 00515 g009b
Figure 10. The streamline field of (a) un-injected polymer, (b) injected polymer, 0.045 PV, (c) injected polymer, 0.09 PV, and (d) injected polymer, 0.135 PV of the W5-3S well group in the water/polymer flooding stage.
Processes 08 00515 g010
Figure 11. The streamline field of (a) un-injected polymer, (b) injected polymer, 0.045PV, (c) injected polymer, 0.09PV, and (d) injected polymer, 0.135PV of the W4-4 well group in the water/polymer flooding stage.
Processes 08 00515 g011
Figure 12. The water and polymer flooding status in the later stage of the water/polymer flooding of the oil group I.
Processes 08 00515 g012
Figure 13. The vertical polymer streamline model of the well W8-4.
Processes 08 00515 g013
Figure 14. The vertical water streamline model of the well D20.
Processes 08 00515 g014
Figure 15. Annual profit of water/polymer flooding. From the Figure 15, the increase of the polymer injected PV number in the water/polymer co-flooding stage, the annual profit of oilfield first increased and then decreased. The increase of the annual profit was due to the inconsistent production time of the well interspaced, which was a normal phenomenon; After that, polymer injection rate was constant and the oil production of the oilfield reduced every year, so the annual profit decreased.
Processes 08 00515 g015
Figure 16. Depravation time of water/polymer flooding.
Processes 08 00515 g016
Table 1. Physical property comparison of different oilfields.
Name of Oil FieldDepth (m)Effective Thickness (m)Porosity (%)Permeability (10−3 μm2)Viscosity (mPa s)
Jinzhou 9-31580–20003–4022–3610–500017.1
Suizhong 36-11300–160040–12031–333123–359437–155
Lvda 5-21240–170015–11630–40100–100136–210
Lvda 4-21560–18204–3824–3450–10003–4
lvda10-11330–166630–6027–3510–55007–19
Chengbei1625–16801522–3611–957057
Table 2. The parameters of the conceptual fine geological model and numerical model.
ModelParameterValue
The conceptual fine
geological model
The Model area0.875 km × 0.875 km = 0.766 km2
The Grid step5 m × 5 m × 1 m
The total number of grid21.5 × 104
The phaseoil, water, dissolved gas
The effective thickness7 m
The porosity0.27
The permeability1162.3 × 103 μm2
The initial oil saturation0.64
The conceptual
numerical model
The grid step10 m × 10 m × 1 m
The total number of grid5.4 × 104
The initial formation pressure17.1 MPa
The oil viscosity17.1 mPa s
The water injection rate0.045 PV/year
The polymer injection rate0.04 PV/year
Table 3. The designed schemes.
Serial NumberSchemeCumulative oil Production after the Well Interspaced (104 m3)Reduced ProportionCumulative Oil Production after the Well Interspaced (104 m3)Oil Increment of per Ton Polymer (m3/t)
1Water flooding + polymer flooding + full water flooding after the well interspaced10.683/411.7635.97
2Water flooding + polymer flooding + full polymer flooding after the well interspaced15.011/4
3Water flooding + polymer flooding + water/polymer co-flooding after the well interspaced11.42111.4222.84

