Article

Optimizing the Processing Factor and Formulation of Oat-Based Cookie Dough for Enhancement in Stickiness and Moisture Content Using Response Surface Methodology and Superimposition

by
Mohd Salahuddin Mohd Basri
1,2,*,
Nurain Mohd Jais
3,
Alifdalino Sulaiman
1,
Mohd Zuhair Mohd Nor
1,2,
Nor Nadiah Abdul Karim Shah
1,2 and
Siti Hajar Ariffin
1,2
1
Department of Process and Food Engineering, Faculty of Engineering, Universiti Putra Malaysia (UPM), UPM Serdang 43400, Selangor, Malaysia
2
Laboratory of Halal Science Research, Halal Products Research Institute, Universiti Putra Malaysia (UPM), Serdang 43400, Malaysia
3
Yeo Hiap Seng (Malaysia) Berhad, KM 6, Jalan Kota Tinggi, Jalan Pandan, Johor Bahru 81100, Johor, Malaysia
*
Author to whom correspondence should be addressed.
Processes 2020, 8(7), 797; https://doi.org/10.3390/pr8070797
Submission received: 20 May 2020 / Revised: 9 June 2020 / Accepted: 10 June 2020 / Published: 8 July 2020
(This article belongs to the Section Food Process Engineering)

Abstract

:
Despite the utilization of dusting flour and oil to reduce dough stickiness during the production process in food industry, they do not effectively help in eliminating the problem. Stickiness remains the bane of the production of bakery and confectionery products, including cookies. In addition, the high moisture content of cookie dough is unduly important to obtain a high breaking and compression strengths (cookies with high breaking tolerance). This study was conducted in light of insufficient research hitherto undertaken on the utilization of response surface methodology and superimposition to enhance the stickiness and moisture content of quick oat-based cookie dough. The study aims at optimizating, validating and superimposing the best combination of factors, to produce the lowest stickiness and highest moisture content in cookie dough. In addition, the effect of flour content and resting time on the stickiness and moisture content of cookie dough was also investigated, and microstructure analysis conducted. The central composite design (CCD) technique was employed and 39 runs were generated by CCD based on two factors with five levels, which comprised flour content (50, 55, 60, 65, and 70%), resting time (10, 20, 30, 40, and 50 min) and three replications. Results from ANOVA showed that all factors were statistically significant at p < 0.05. Flour content between 56% and 62%, and resting time within 27 and 50 min, resulted in dough with high stickiness. High-region moisture content was observed for flour content between 60% and 70%, and within 10 and 15 min of resting time. The optimized values for flour content (V1) = 67% and resting time (V2) = 10 min. The predicted model (regression coefficient model) was found to be accurate in predicting the optimum value of factors. The experimental validation showed the average relative deviation for stickiness and moisture content was 8.54% and 1.44%, respectively. The superimposition of the contour plots was successfully developed to identify the optimum region for the lowest stickiness and highest moisture content which were at 67–70% flour content and 10–15 min resting time.

Graphical Abstract

1. Introduction

Cookies are nutritive snacks produced by applying heat on an unpalatable dough in an oven [1]. Soft wheat flour has been the major ingredient used in the production of biscuits and other pastry products. Other ingredients used include whole grains and large inclusions such as nuts, raisins, coconut, and chocolate chips [2]. Oat, wheat and barley are examples of whole grains widely used in daily diets for most of the world population [3]. Due to the large component of bioactive compounds in them, such as vitamins, minerals, phytochemicals, and fiber [4], the utilization of whole-grain food materials and fiber-rich ingredients, in products such as cookies [5], bread [6], extruded snack products [7], and pasta [8] has greatly increased. In addition, whole grains contribute substantially in improving human health against diabetes [9], cancer [10], cholesterol [11], and harmful gut microbiota [12]. From the health and dietary point of view, oats have been used in low-calorie, high sugar content, and white wheat flour products as well. A study conducted by Krotkiewski [13] found that subjects who consumed 20 g of oat bran a day for 50 weeks had an average weight loss of 16.4 kg, compared with 10.6 kg among control subjects who consumed only the low-calorie diet. Eating oatmeal may help diabetics reduce the blood sugar level, since the fiber in oats contributes to slow down the absorption and metabolism of sugar. Hence, it reduces the need for insulin [14]. A study conducted by Holm and Björck [15] revealed that bread from white wheat with intact kernels from whole grains resulted in lower glucose responses and higher satiety scores.
In lieu of the increase in cookies production worldwide, stickiness has remained the major constraint in the food industry for decades, especially in baking and confectionery. Dough with high stickiness can cause considerable difficulty during processing, by causing interruptions in production, generating waste, and contaminating machinery [16]. The sticking of food to packaging materials or machinery is generally regarded as undesirable, resulting in possible packaging material damage, product loss, and disfigurement of the product surface.
Some of the technical problems related to the production of confectioneries include the improper density of confections and sugar selection and the formulation of stabilizers, such as flour, moisture content, and excess crystal formation [17]. Analysis of the viscosity of confectionery masses, including moisture and oats content [18], and protein content and water absorption properties [19] may be beneficial in reducing the problems related to the production processes, such as the mixing of dough masses. Although modern bakery and confectionary industries apply dusting flour or oil to reduce dough stickiness, it does not effectively help in eliminating the problem. Dough stickiness has long been the bane of the production schedule, which subsequently affects losses, due to the lowered quality of the end products [20].
Dough stickiness can be defined as the adhesion of dough to the contact surface [21,22] or the combination of cohesion which is the stickiness between particles, and adhesion which is defined as the stickiness between particle and wall or surface stickiness [23]. The addition of dietary fiber strengthens the structure of the dough at a limited level, and modifies its textural properties [24,25]. Ahmad and Thomas [26] studied the effect of β-glucan concentration and water content on the rheological and textural properties of wheat flour doughs. The results showed that higher water content increased dough stickiness. The excess water in β-glucan and wheat gluten dough, not bound by protein, was responsible for the increased stickiness value. Dough stickiness may also be affected by oat content. A study conducted by Wenjun et al. [27] found that the dough stickiness of Chinese steamed bread increased with additional oat bran content. Campbell et al. [28] reported that the stickiness and water absorption of bread dough increased with the addition of oat and wheat brans.
Other factors that influence the rheological properties of dough are the mixing and handling processes [29]. The moisture content of food is essential in food manufacture for various reasons. High moisture content in the biscuit dough resulted in high breaking point, density, and compression strength [30]. The important role of water during dough processing motivated researchers to investigate the relationship between water mobility and the functionality of dough, using qualitative and quantitative analyses [6,31]. The addition of brans in biscuit dough improved its water absorption properties [32]. Research conducted by Manohar and Rao [30] revealed that the stickiness of wheat flour dough increased with water addition, due to the distribution of protein charges, as suggested by Yoshino and Matsumoto [33]. Hamed et al. [34] found that the increase in moisture content consequently increased the stickiness properties of cookie batter. However, the further addition of water decreased its stickiness. Similar results were recorded by Lai and Lin [35].
Despite high number of publications related to food processing in the last several years, majority of researches were conducted using the one-factor-at-a-time (OFAT) approach. In predicting the optimum formulation of cookie dough (which possess low stickiness and high moisture content), statistical analysis and a regression coefficient model (mathematical model) were therefore necessary. In comparison with OFAT, the design of experiment (DOE) was found to provide several benefits, which include low resources requirements (experimental runs, time, material, and manpower), precise estimation of the main effects and their interactions, and the ability to analyze a high number of factors [36]. In addition, the response surface methodology (RSM), originally coined by Box and Wilson [37], is widely used as a statistical model to conduct main effect, interaction, and optimization studies. The central composite design (CCD) was reported to be the best model for evaluation purposes [38]. Table 1 shows the difference in the total number of experimental runs between RSM and full factorial (classical method) design, based on five-level factors [39]. The result shows that for more than one factor, RSM only requires at least 13 experimental runs, as compared to 25 for a full factorial design.
Since response surface methodology (RSM), specifically central composite design (CCD), has been widely used in process optimization [40,41,42,43,44], it will, therefore, be used in this study. The purpose of the present study was: (i) to investigate the effect of factors including flour content and dough resting time on the stickiness and moisture content of oat-based cookie dough with large inclusion; (ii) to perform optimization, validation and superimposition processes to obtain the best combination of factors that produce the lowest stickiness and highest moisture content in cookie dough; and (iii) to conduct a microstructure analysis of cookie dough and evaluate the result.

2. Materials and Methods

2.1. Design of Experiment Based on RSM

The experiment using RSM was designed based on two factors, namely flour content (V1) and resting time (V2). The responses, i.e., stickiness and moisture content, were assumed to be influenced by these factors. The value for other factors (ingredients) was fixed. Samples with 100% wheat flour acted as control samples, and were compared with the optimized sample after the optimization process. For central composite design (CCD), five levels, and their working ranges were chosen, as shown in Table 2.

2.2. Experiment Design

A central composite design (CCD) involving five levels and two factors, with three replications, were applied for all design points, comprising a total of 39 experimental runs. The factors were chosen based on the literature, their significant effect on the responses, and their workability (within the allowed working range). The complete CCD with coded and uncoded levels of the factors are shown in Table 3. The value for the total block is 1, with the experiments carried out in a randomized order.
An analysis of variance (ANOVA) was carried out to determine the significance of the main factors and their interactions. The significance level was set at 95% with a p-value of 0.05. The regression coefficient model (mathematical model) generated from the ANOVA table will be used for optimization purpose, depending on the value of the correlation coefficient, R2. Experimental data were fitted to the second-order polynomial model to derive the regression coefficient model. The model for the response surface analysis is shown in Equation (1),
Y = β 0 + t = 1 3 β i X i + i 3 β i i X i 2 + i 1 2 j = i + 1 3 β i j X i X j ,
where Y is the response, β0, βi, βii, and βij are regression coefficients for the intercept, linear, quadratic, and interaction terms, respectively. Xi and Xj are coded values for the independent variables [45].

2.3. Raw Materials

The raw materials were bought from local manufacturers and certified halal, according to the Malaysian Standard on Halal Food (MS 1500:2009). The halal certificate, issued by Malaysia’s Department Islamic Development (JAKIM), is a document that certifies the products that have followed and cover the Islamic dietary guidelines [46]. The superfine wheat flour (9 g/100 g protein) used in this study was produced by Prestasi Flour Mill (M) Sdn. Bhd, Malaysia. The quick oats were obtained from Cimei Food Ingredients Sdn. Bhd, Malaysia. The characteristics of wheat flour and quick oats are shown in Table 4.
In this study, only wheat flour was used. Instead of oat flour, quick oat was incorporated in the dough at the designated ratio. Quick oats are flakes with thickness between 0.356 and 0.457 mm. It is produced from steel-cut groats, which are usually produced by sectioning groats into three or four pieces, before the final steaming and flaking process [47]. Quick oats were used in this study, due to the health benefit of oats and increasing interest among researchers and manufacturer.
Other ingredients used in the cookie recipe were coarse grain sugar and soft brown sugar (Malayan Sugar Manufacturing Co. Bhd., Kuala Lumpur, Malaysia), semi-sweet chocolate chip (Beryls Chocolate & Confectionery Sdn. Bhd., Seri Kembangan, Malaysia), butter (Lam Soon Edible Oils Sdn. Bhd., Kuala Lumpur, Malaysia), egg (Lay Hong Berhad, Klang, Malaysia), cashew nut, almond strip (Foong Keng Foodstuff Manufacturing Co. Sdn. Bhd., Kuching, Malaysia), and Royal brand baking powder (Mondelez International, Madrid, Spain).

2.4. Cookie Dough Preparation

Except for flour and oats, the formulations for all samples were prepared using the same amount of ingredients, as shown in Table 5. The oat to flour composition was measured based on cup percentage. The weight of these ingredients was based on the American Standard Matrix Measurement and Cups Conversion [48]. One cup of oat and flour was 90 g and 120 g, respectively. The following ingredients (as g/345 g on dough basis) were used: oat (27–54 g), flour (60–84 g), brown sugar (25 g), coarse grain sugar (25 g), chocolate chips (30 g), cashew nuts (7 g), almond slices (10 g), egg (15 g), butter (125 g), and baking powder (3 g).
Butter was sliced into small pieces and creamed with brown and coarse grain sugar at speed of 3 for 240 s in a heavy-duty mixer (KitchenAid, Model 5K5SS, MI, USA), using a flat beater and with scraping down every 60 s. Egg was then added, and the mixing continued at speed 4 for 30 s, and followed at speed 5 for 30 s, to form a soft and thick batter. The water contained in egg and butter is important in hydrating the starch particles, and can be absorbed by the protein to form the gluten of the dough. Egg is used as a source of liquid in the dough preparation, since water constitutes the major part of an egg [49].
In another mixing bowl, flour, oat, and baking powder were manually mixed. The amount of flour and oat required was based on the experimental design (Table 3) and mixture composition (Table 6). Large inclusions were then added, comprising chocolate chips, cashew nuts, and almond slices, and homogeneously mixed with the flour-oat-baking powder mixture. The batter was scraped down and poured into the mixing bowl, followed by manual mixing for 120 s. The dough was then stored in a closed container prior to testing.

2.5. Cookie Dough Formulation

The amount of oat and flour required in preparing the cookie dough was calculated based on the cup percentage, as shown in Table 6. The oat to flour composition of 50O/50F indicated that the dough comprised 50% of a cup of oat and similarly 50% of flour. This indicated that half cup of oat (45 g) and half cup of flour (60 g) were required for the 50O/50F composition. Likewise, 30% cup of oat and 70% cup of flour was designed for the 30O/70F composition. The total number of cups for oat and flour were 0.3 cup (27 g) and 0.7 cups (84 g), respectively. Samples were prepared according to the experimental design in Table 3.

2.6. Stickiness Analysis

The value of stickiness was determined using a texture analyzer (TA.XT PLUS, Stable Micro Systems, Surrey, U.K.), with a 75 mm diameter cylinder probe (P/75P), and at pre-test speed of 0.5 mm/s, test speed of 0.5 mm/s, post-test speed of 10.0 mm/s, return distance of 5 mm, applied force of 5 g, contact time of 0.1 s, and trigger type of Auto-5 g [50]. Measurements were made on triplicate from each sample composition, with three measurements per replicate. The schematic diagram of the apparatus used to conduct the stickiness test is shown in Figure 1.
The TestXpert®10.11 software (Zwick GmbH & Co. KG, Ulm, Germany) was employed to calculate stickiness, as the energy needed to remove the working plate from the dough surface after compression. The dough stickiness value was obtained based on the maximum positive force on the force versus time curve. According to Agrahar-Murugkar and Dixit-Bajpai [51], the maximum force reading, which was the highest positive peak from the positive region, indicates the stickiness value.

2.7. Moisture Content Analysis

The moisture content of the cookie dough was examined using Moisture Analyzer (Model MB45, Othaus, US). A total of 2 g of sample was placed in a tray. The starting and end temperature was set at 105 °C and 120 °C, respectively. Measurement was made on triplicate from each sample composition with three measurements per replicate.

2.8. Microstructure Analysis

The microstructure of sample which exhibited the highest and lowest value of stickiness and moisture content was studied, using the Hitachi S-3400N variable scanning electron microscope (SEM). The samples were mounted on an 8 mm diameter stub, with a carbon conductive tape and sputter-coated with gold in a vacuum JSM-IT100 (InTouchScope, Hitachi, Japan). All samples were observed at 1.0 kV for 50x and 100x magnifications.

3. Results and Discussion

Data obtained from the experiments were analyzed using MINITAB software and results on the responses (stickiness and moisture content) are given in Table 7. Flour content and resting time are represented by V1 and V2, respectively.

3.1. Statistical Analysis of Stickiness

The ANOVA table is shown in Table 8. The results showed that the squared terms for both factors are highly significant at p-value of 0.000. However, the interaction term (interaction between different factors, V1 *V2) showed a p-value of 0.667 which indicates that there is no significant relationship between the factors.
The coefficient of determination (R2) is 0.9644, which indicates that 96.44 percent of the sample variation in the stickiness was attributed to the factors V1 and V2. The R2 of 1.0000 means that the regression coefficient model is capable in predicting the optimum value with high accuracy. All main factors (V1 and V2) and their squared terms (V1 *V1 and V2 *V2) are highly significant at 0.000. The squared term of V1 *V1 was found to has the strongest effect on the response, due to the highest absolute coefficient value of 1073.78. The squared term, which is significant (p-value < 0.005), indicates that the relationship between the factor and the response follows a curved line. The regression coefficient model for the factors on the stickiness of cookie dough is given in Equation (2).
Y s = 6608.22 553.17 ( V 1 ) + 452.44 ( V 2 ) 1073.78 ( V 1 ) 2 246.82 ( V 2 ) 2 + 41.50 ( V 1 ) ( V 2 )
where Ys represents the stickiness (response) while V1 and V2 are the flour content and resting time, respectively. This regression coefficient model (mathematical model) can be used to calculate and analyze the effect of factors on the stickiness of the cookie dough.

3.2. Effect of Factors on Stickiness

From the analysis, ANOVA and regression coefficient model were used in analyzing the effect of factors on stickiness. Contour and surface plots, which showed the effect of flour content and resting time on the stickiness of cookie dough, were used for better illustration, and are shown in (b).
It was observed in Figure 2b that at all resting times, the stickiness value for the sample containing 70% of flour was lower than that of other samples. High stickiness was observed for flour content between 56% and 62%, and within 27 and 50 min for resting time. The results agreed with those reported by Yildiz et al. [52], who showed that low stickiness values were recorded under high flour content. As shown in Figure 2a, at the resting time of 40 min, the stickiness value increases when the flour content increases from 50% to 60%. Dough stickiness is generally associated with the development of gluten, and the interaction with other ingredients in the formula including sugar, fat, and water [53]. Thus, low flour content (conversely high oat content) indicates a low amount of gluten in the dough matrix, which resulted in a low stickiness value.
The further addition of flour from 60% to 70% resulted in a decrease in stickiness value from approximately 6814 N to 1524 N, respectively. The trend is consistent with those for other resting times. The results agreed with those of Yildiz et al. [52], where the dough was stickier at a longer resting time. Other studies likewise reported that the stickiness value increases with resting time. However, no systematic trend of stickiness values on the resting time was recorded in these studies [26]. During the production process, a longer contact time between dough and its contact surface may result in an increase in the stickiness value, due to an increase in the contact area [54]. The dough will maintain contact with the contact surfaces, create a bigger contact area, and subsequently increase surface wettability [55].
In Figure 2a, the highest stickiness value of flour content with 58% at all resting times. This could be associated with the presence of excess water that is not bound by proteins [26]. The gluten present in the flour absorbed water to induce protein interactions that play a critical role in dough stickiness [56]. For samples with flour content of 50%, 55%, and 60%, similar results were obtained by Tang and Liu [57]. Thus, they concluded that as the protein content increased, its hydration increased surface adhesion, and consequently effected higher dough stickiness. The surface tension between the dough and contact surface is developed by the mixture of water and water-soluble materials that dissolved [58]. It was also suggested that doughs made through mixing non-sticky dough flour with a sufficient amount of water-soluble fiber would increase their stickiness [50].
The decrease in the stickiness value of the sample with 65% to 70% of flour content, at all resting times, could be associated with the limited water availability in the protein complex. The hydration capability and complexing with ingredients play an important role in imparting stickiness to the dough [26]. The changes in dough stickiness over resting time and flour content may probably be due to the structural relaxation [59] and network degradation caused by enzyme activity after a longer resting time [60].
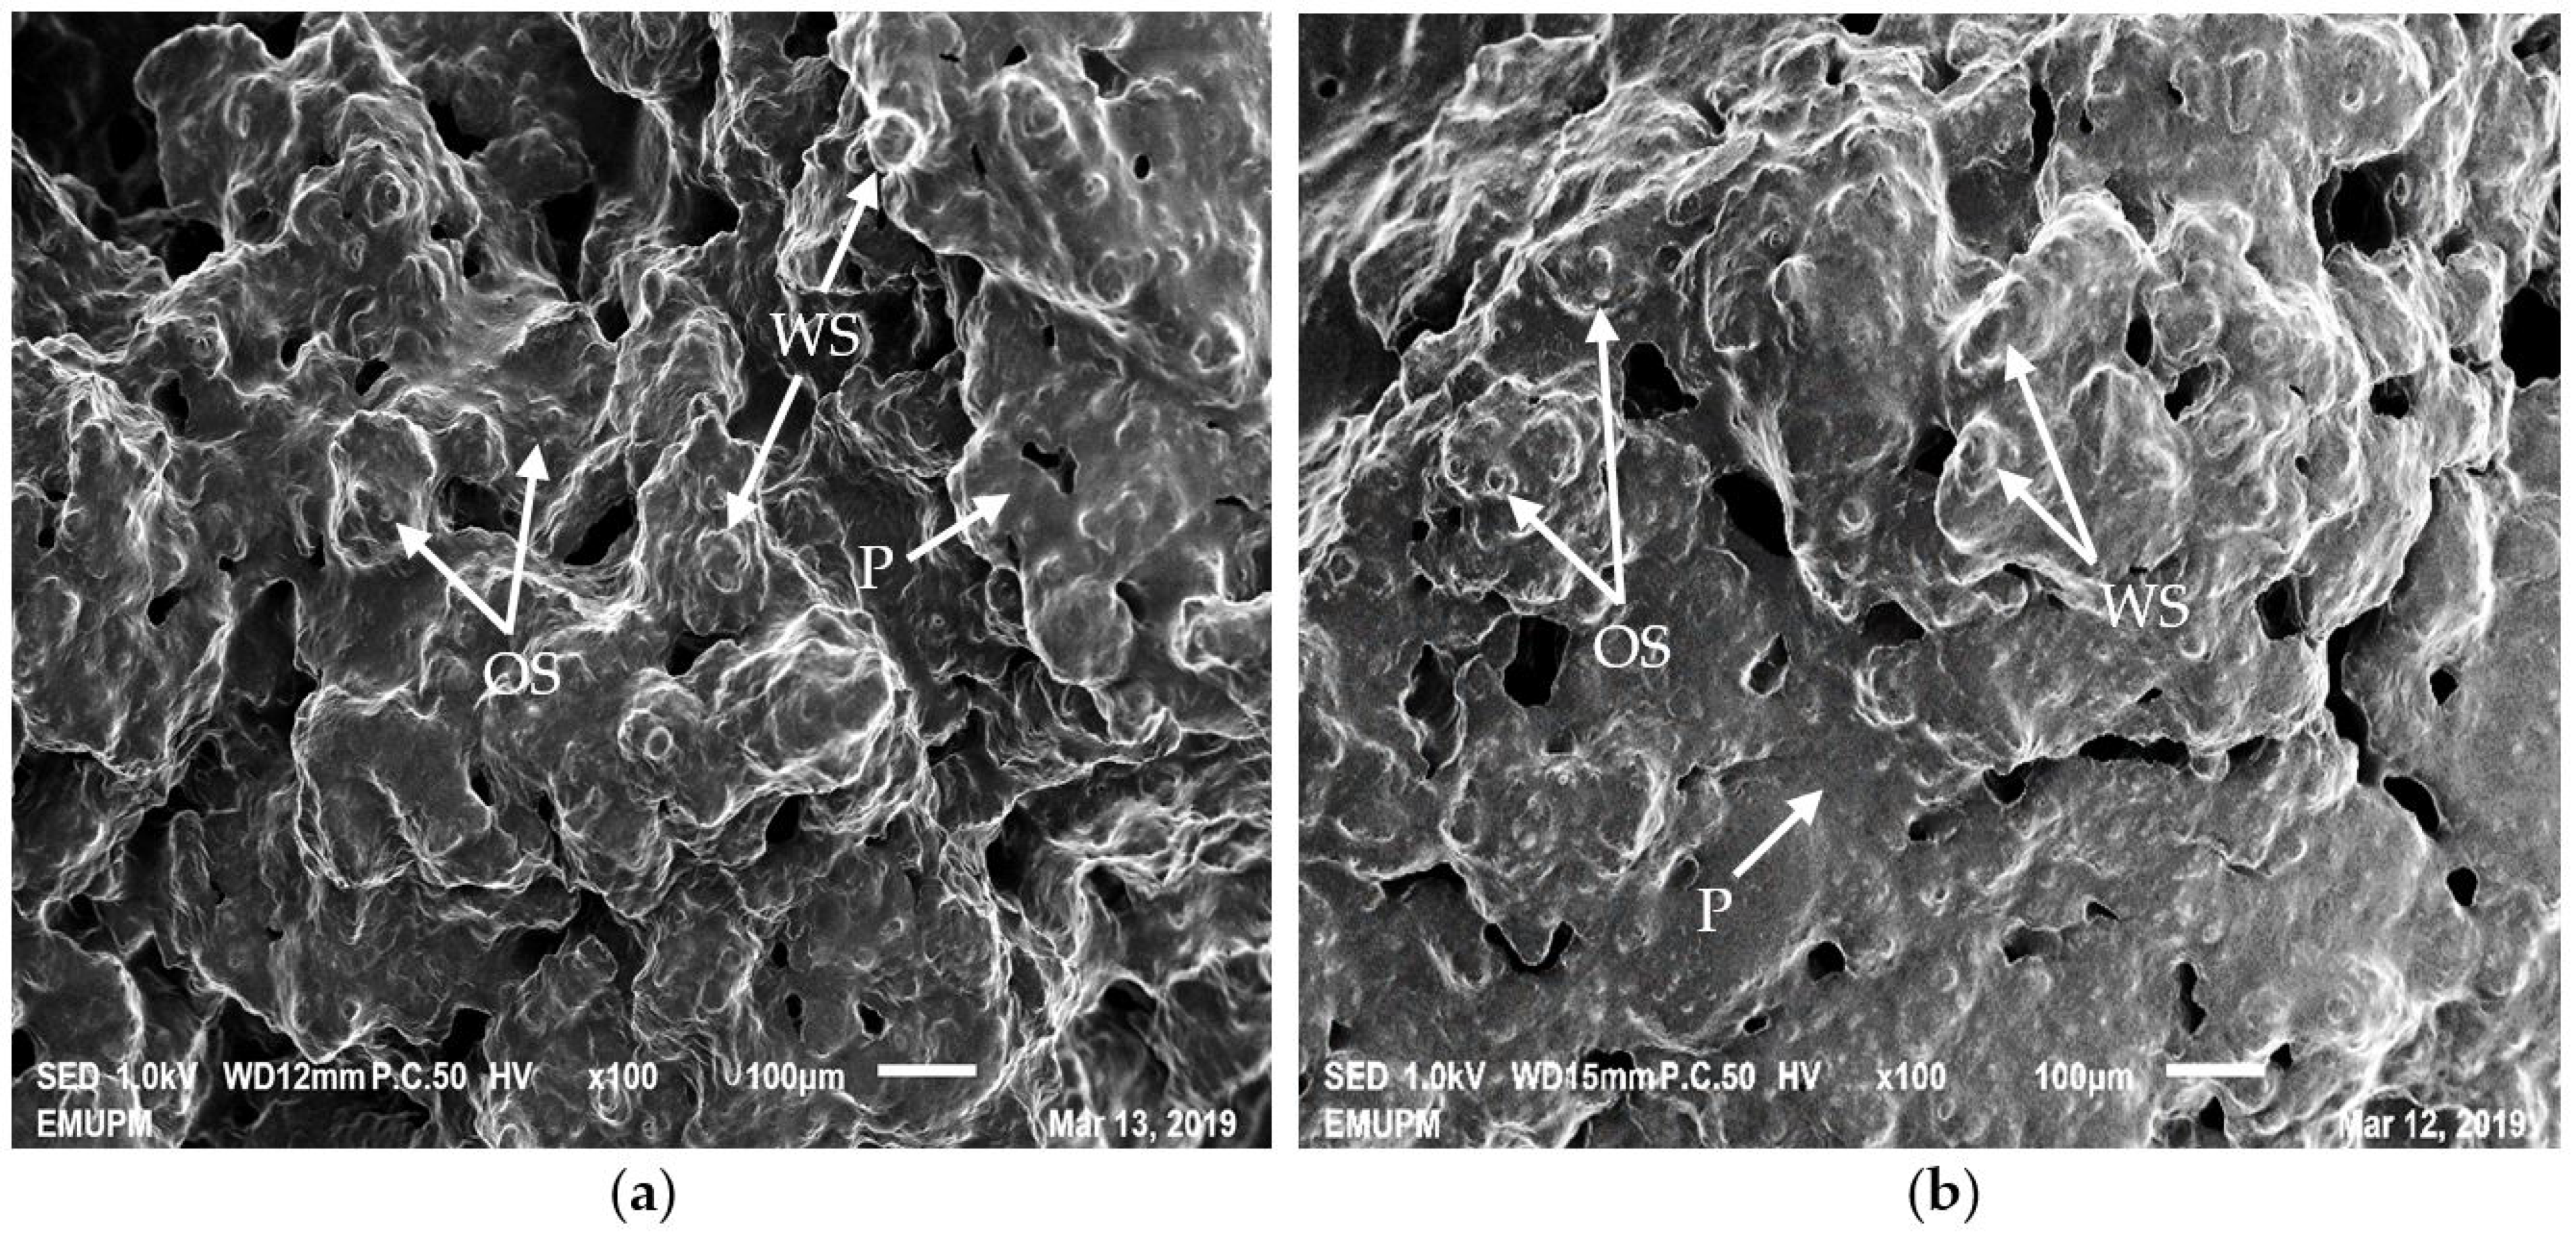
Figure 3 shows the micrograph images at 100x magnification after 30 min of resting time for sample S4 and S8, which produced the highest (6918 N) and lowest (1528 N) stickiness values, respectively. Flour content for sample S4 and S8 were 60% and 70%, respectively. Oat starch granules can be determined by a much smaller size than wheat granules, and are irregular and polyhedral [61]. It can be observed that wheat and oat starch granules were distributed in the protein matrix. These results were consistent with those observed by Dachana et al. [62], which stated that a thin sheet representing the protein matrix, along with small and large embedded starch granules, can be observed in cookie dough. The starch granules, which were almost entirely covered by thin layers of protein film, were melted and re-solidified fat [63]. It can be seen in Figure 3b that the area covered with the protein matrix is larger than that shown in Figure 3a.
In Figure 3a, the starch granules are partially embedded in the protein matrix, due to the surface adhesion induced by the protein. Hollows and ditches were observed on the dough surface, which indicates that the continuity of the gluten matrix has been disrupted by the protein [57]. Figure 3a shows sample with higher number of holes, and with a more uneven structure, as compared to that shown in Figure 3b. This observation is in agreement with results by Majzoobi et al. [64], which concluded that a higher percentage of oat content (lower content of flour) resulted in a more uneven surface structure, and with an increased number of holes. Figure 3b shows the micrograph image of the sample with the lowest stickiness value. The starch granules were mostly covered with a thin protein film, which was responsible for network formation, resulting in low stickiness properties and a good handling of dough [62,65].

3.3. Statistical Analysis of Moisture Content

The ANOVA table is shown in Table 9. The results showed that the main factors, which are flour content and resting time, are significant at p-value of 0.005 and 0.000, respectively. The interaction term (interaction between different factors, V1 *V2) showed a p-value of 0.000, which indicates that there was a very strong relationship between the factors.
The coefficient of determination (R2) was 0.9891, which indicates that 98.91 percent of the sample variation in the stickiness, was attributed to the factors V1 and V2. All terms were significant at p-value < 0.050, with the squared term of V2 *V2 being the least significant term. Resting time (V2) was found to have the strongest effect on the response, due to the highest absolute coefficient value of 0.3081. All terms have negative effect on the moisture content, as indicated by the negative sign of the coefficient value. The squared term which is significant (p-value < 0.005) indicates that the relationship between the factor and the response follows a curved line. The regression coefficient model for the factors on the stickiness of cookie dough is given in Equation (3).
Y m = 11.3892 0.0186 ( V 1 ) 0.3081 ( V 2 ) 0.0686 ( V 1 ) 2 0.0094 ( V 2 ) 2 0.1575 ( V 1 ) ( V 2 )
where Ym represents the moisture content (response), while V1 and V2 are the flour content and resting time, respectively. This regression coefficient model (mathematical model) can be used to calculate and analyze the effect of factors on the moisture content of the cookie dough.

3.4. Effect of Factors on Moisture Content

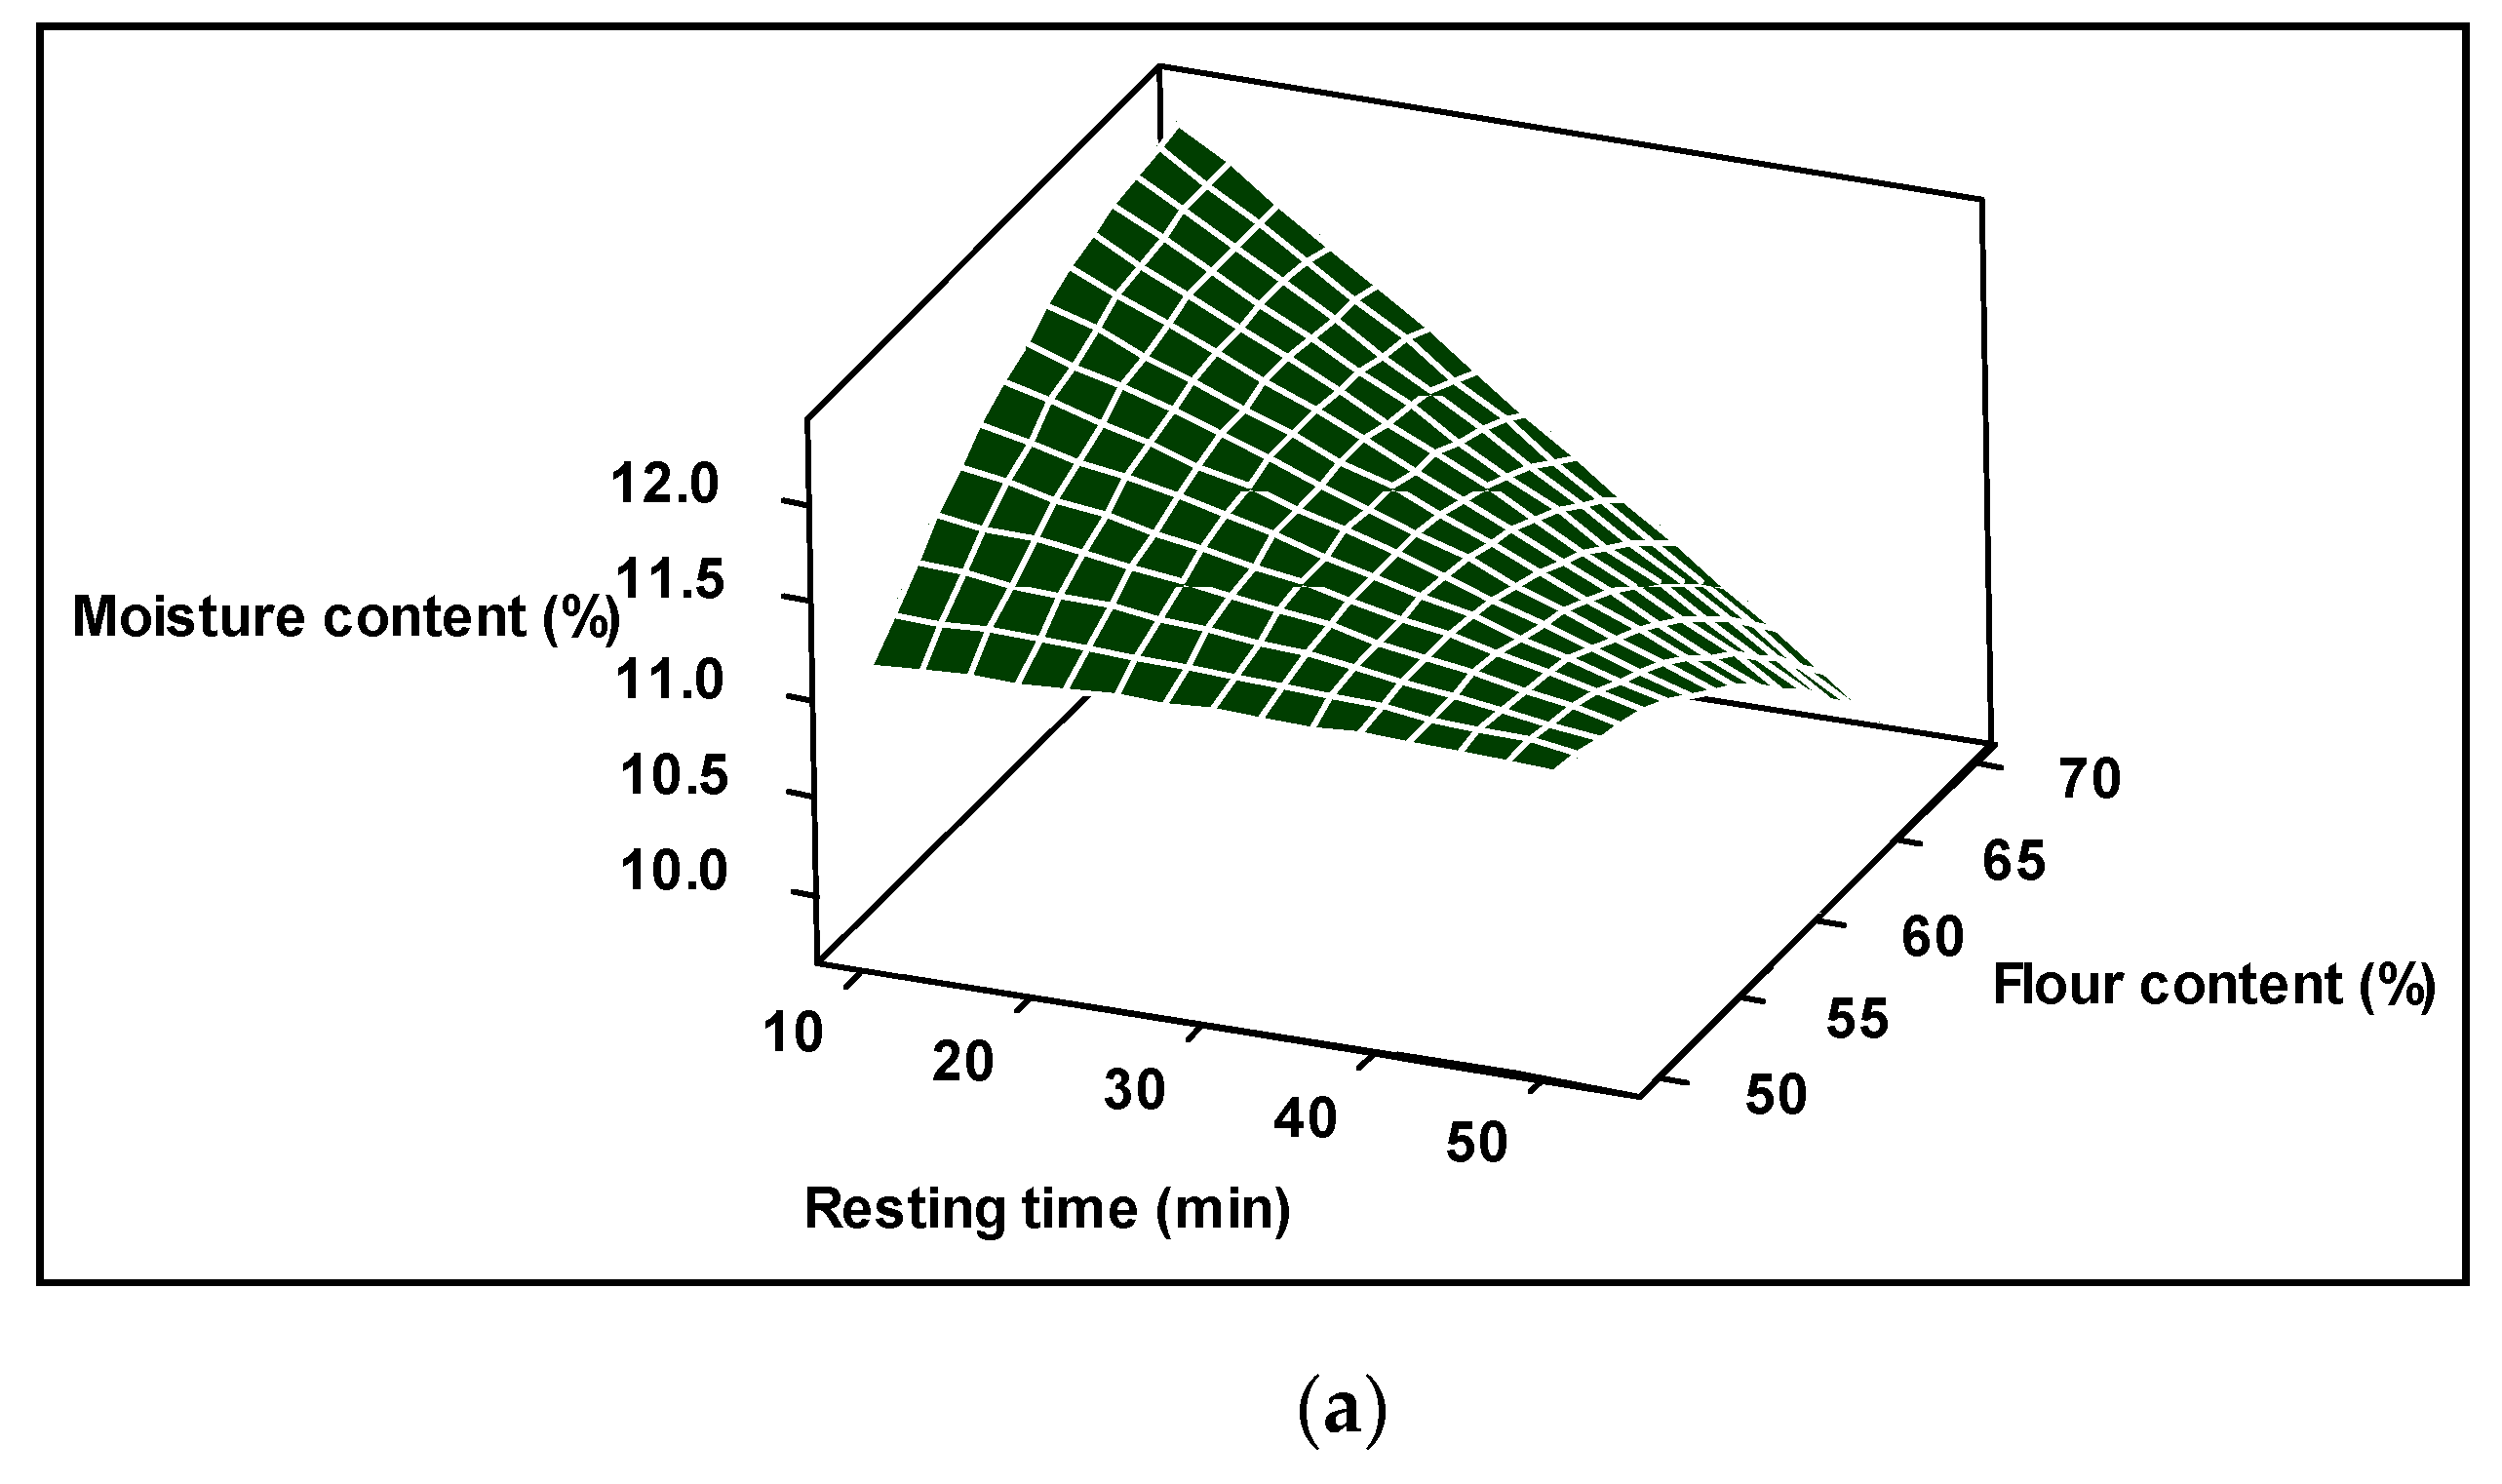
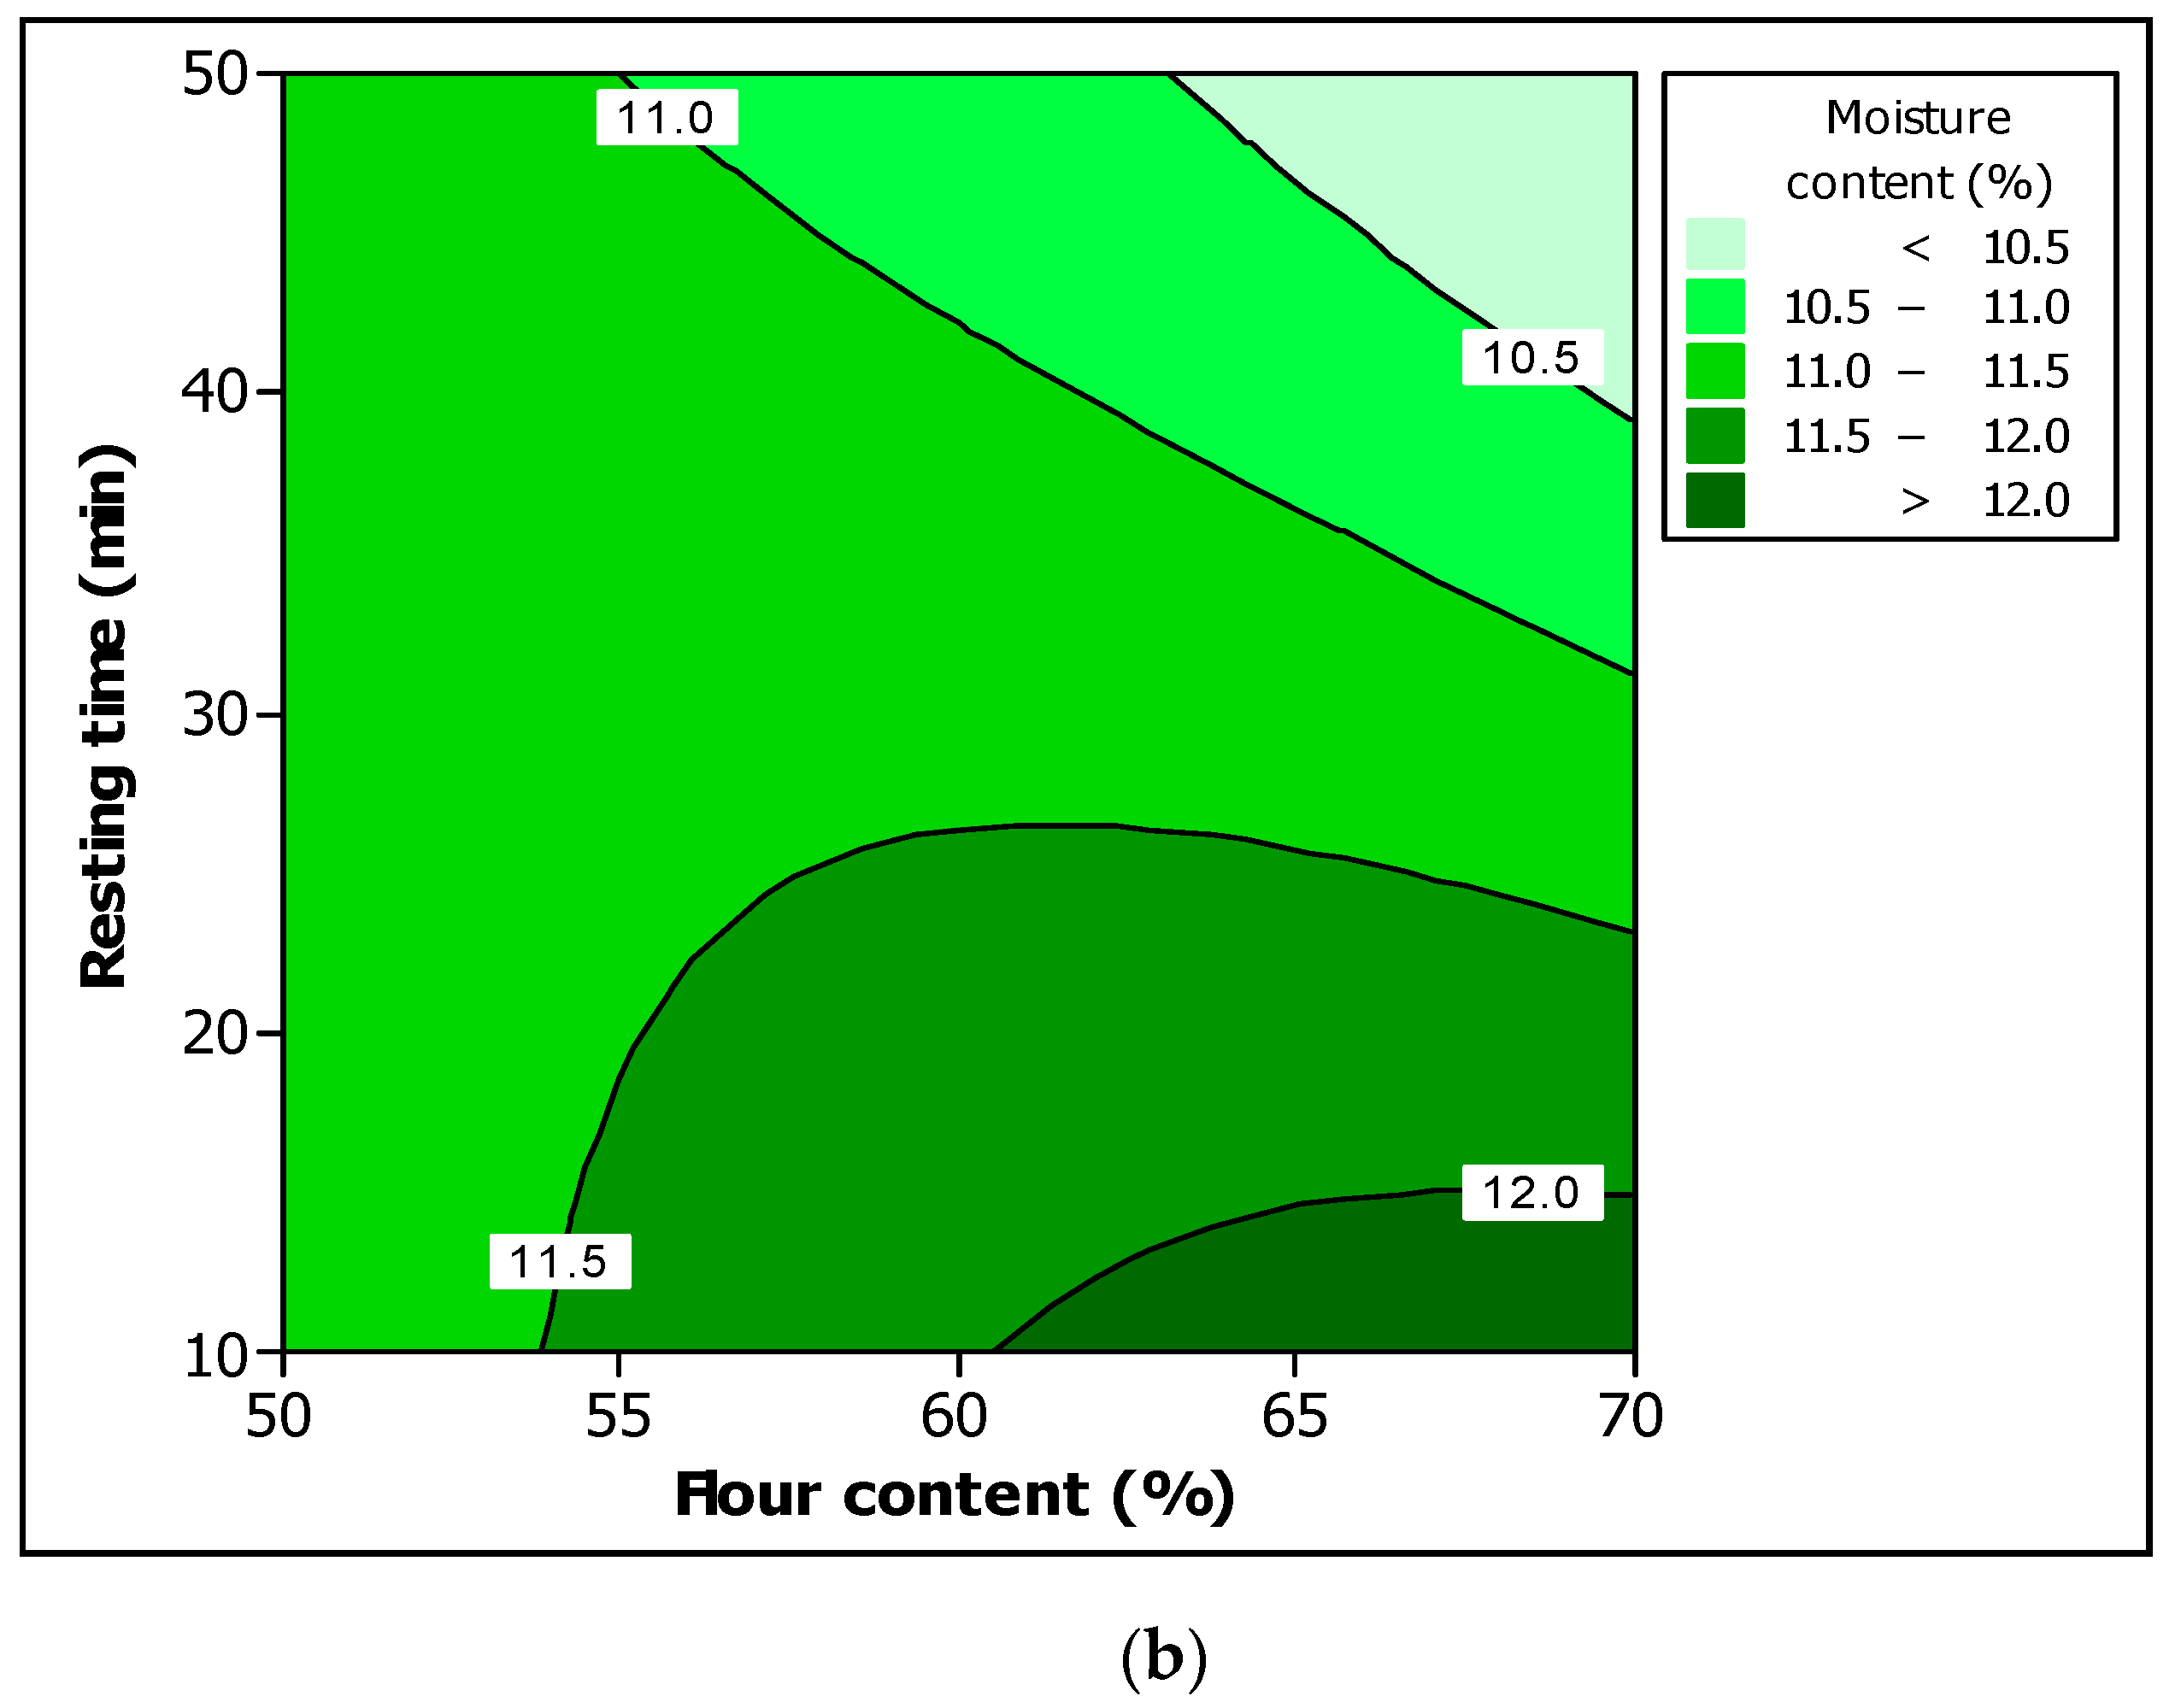
From the analysis, ANOVA and a regression coefficient model were used in analyzing the effect of factors on moisture content. Contour and surface plots, which showed the effect of flour content and resting time on the moisture content of cookie dough, were used for better illustration, and are shown in Figure 4.
Except for the sample with 50% flour content, the moisture content decreases when the resting time increases, as shown in Figure 4b. Similarly, a high moisture content was recorded at 10 min resting time, and flour content between 55% and 70%. The high region moisture content was observed for flour content between 60% and 70%, and within 10 and 15 min for resting time. Moisture reduction is probably due to evaporation from the cookie dough, which is affected by the environment. Although water is a minor component in cookie batter formula, its rheological behavior and machinability are largely influenced by the water content, and its distribution within the batter [66,67].
The effect of resting time and dough composition on the moisture content can be analyzed from the surface plot, as shown in Figure 4a. At 10 min resting time, the sample with 60% flour content (sample S3), which had the lowest stickiness value (Figure 2b), recorded the highest moisture content. At flour content of 70%, the moisture content decreased with an increase in resting time. Sample S13 recorded the lowest moisture content (10.69%) at 50 min of resting time. The high content of flour resulted in a dough with large surface area, which absorbed more moisture within the first 20 min of resting time. An increase in the surface area of starch led to higher water absorption [68]. Bushuk [69] showed that moisture was bounded variously to the flour constituents; namely 46% to starch, 31% to proteins, and 23% to pentosans.
At 30, 40, and 50 min of resting time, the samples with a high stickiness value (those with 60% flour content) exhibited comparably high moisture content. Based on this trend, it can be said that the lower the moisture content in the cookie dough, the lower the stickiness value. Similar results were also obtained by Milašinović Šeremešić et al. [70]. Higher water absorption provided better wetting properties, and the dough is in better contact with the solid contact surface. Thus, it gave higher surface adhesion, and subsequently increased dough stickiness [71,72]. The moisture absorption ability of the flour was found to be directly proportional to the protein level. An increase in protein level increased water absorption and stickiness properties [56].
Figure 5 shows the microscopic images of sample S3 and S13 at 10 and 50 min of resting time, respectively. Both samples contained 60% of flour. The starch granules in Figure 5a are completely covered with the protein matrix, due to high moisture content. These results concurred with observations made by Létang et al. [73], which showed that starch granules were less visible in highly hydrated dough, due to a covering of continuous film. The dough with high moisture content, as shown in Figure 5a, entailed a highly aggregated protein phase, which is scattered, clustered, and less interconnected. In Figure 5b, the sample with the lowest moisture content possesses a slightly clustered, yet interconnected, network of the protein matrix. Fewer empty areas can be seen between the protein matrix, as compared with the more compact structure, as shown in Figure 5a.

3.5. Optimization of the Responses

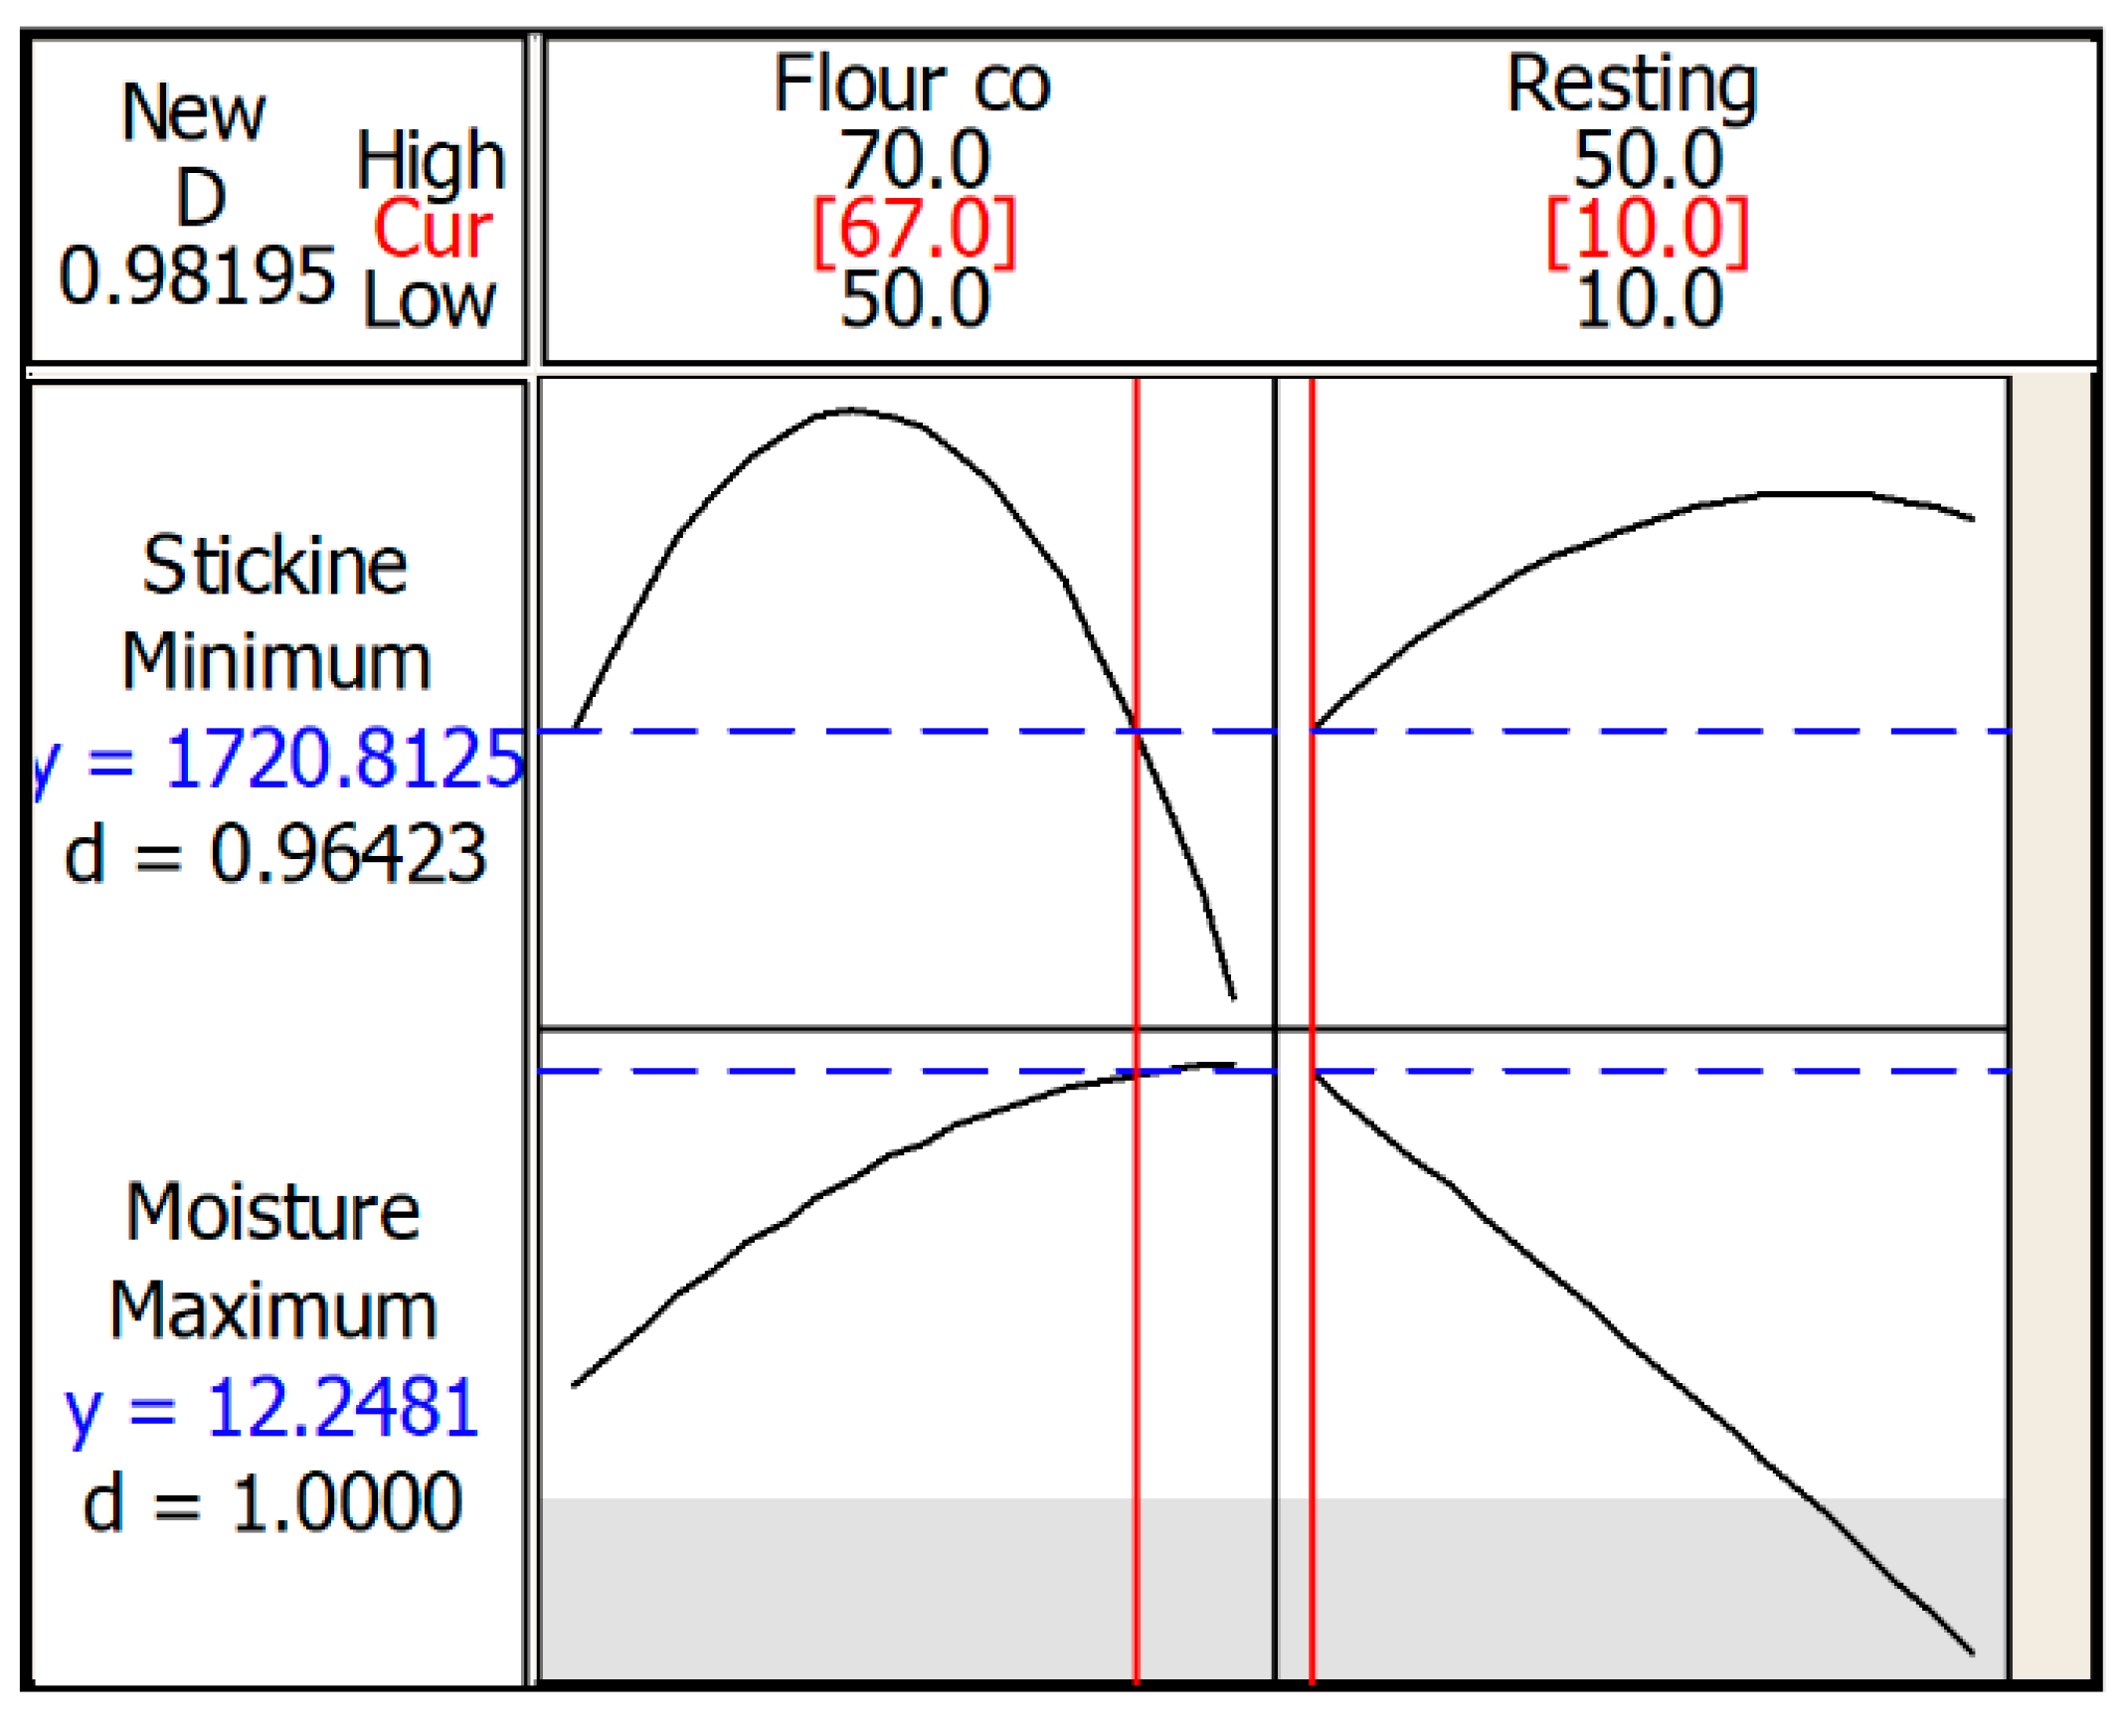
The optimization plot is shown in Figure 6. The purpose of conducting optimization is to obtain the best combination of flour content and resting time in producing the cookie dough with the minimum value of stickiness and the maximum value moisture content. The composite desirability value, D, was calculated to be close to 1, therefore the factors were within the working range. The optimized values of factors were flour content (V1) = 67% and resting time (V2) = 10 min. As compared to the control sample with 100% wheat flour, the control sample recorded low stickiness and moisture content at 668N and 11.51%, respectively. These results are in agreement with other studies, which obtained low stickiness [34] and low moisture content [74] for a sample with 100% wheat flour.

3.6. Experimental Validation

Experimental validation is the final step in the modelling process, and was used to verify the accuracy of the predicted model (regression coefficient model) [75]. A validation experiment was carried out for three validation samples (SV1, SV2 and SV3) under the optimal conditions obtained from the optimization plot (see Figure 6). As shown in Table 10, the average relative deviation for stickiness and moisture content was 8.54% and 1.44%, respectively. This verified the predictability of the model with a comparison of the experimental (actual) values against the predicted figures (1720 N and 12.25%), implying that the RSM-based empirical model can adequately describe the relationship between the independent variables and the target response and, therefore, successfully reveal the optimum process conditions.

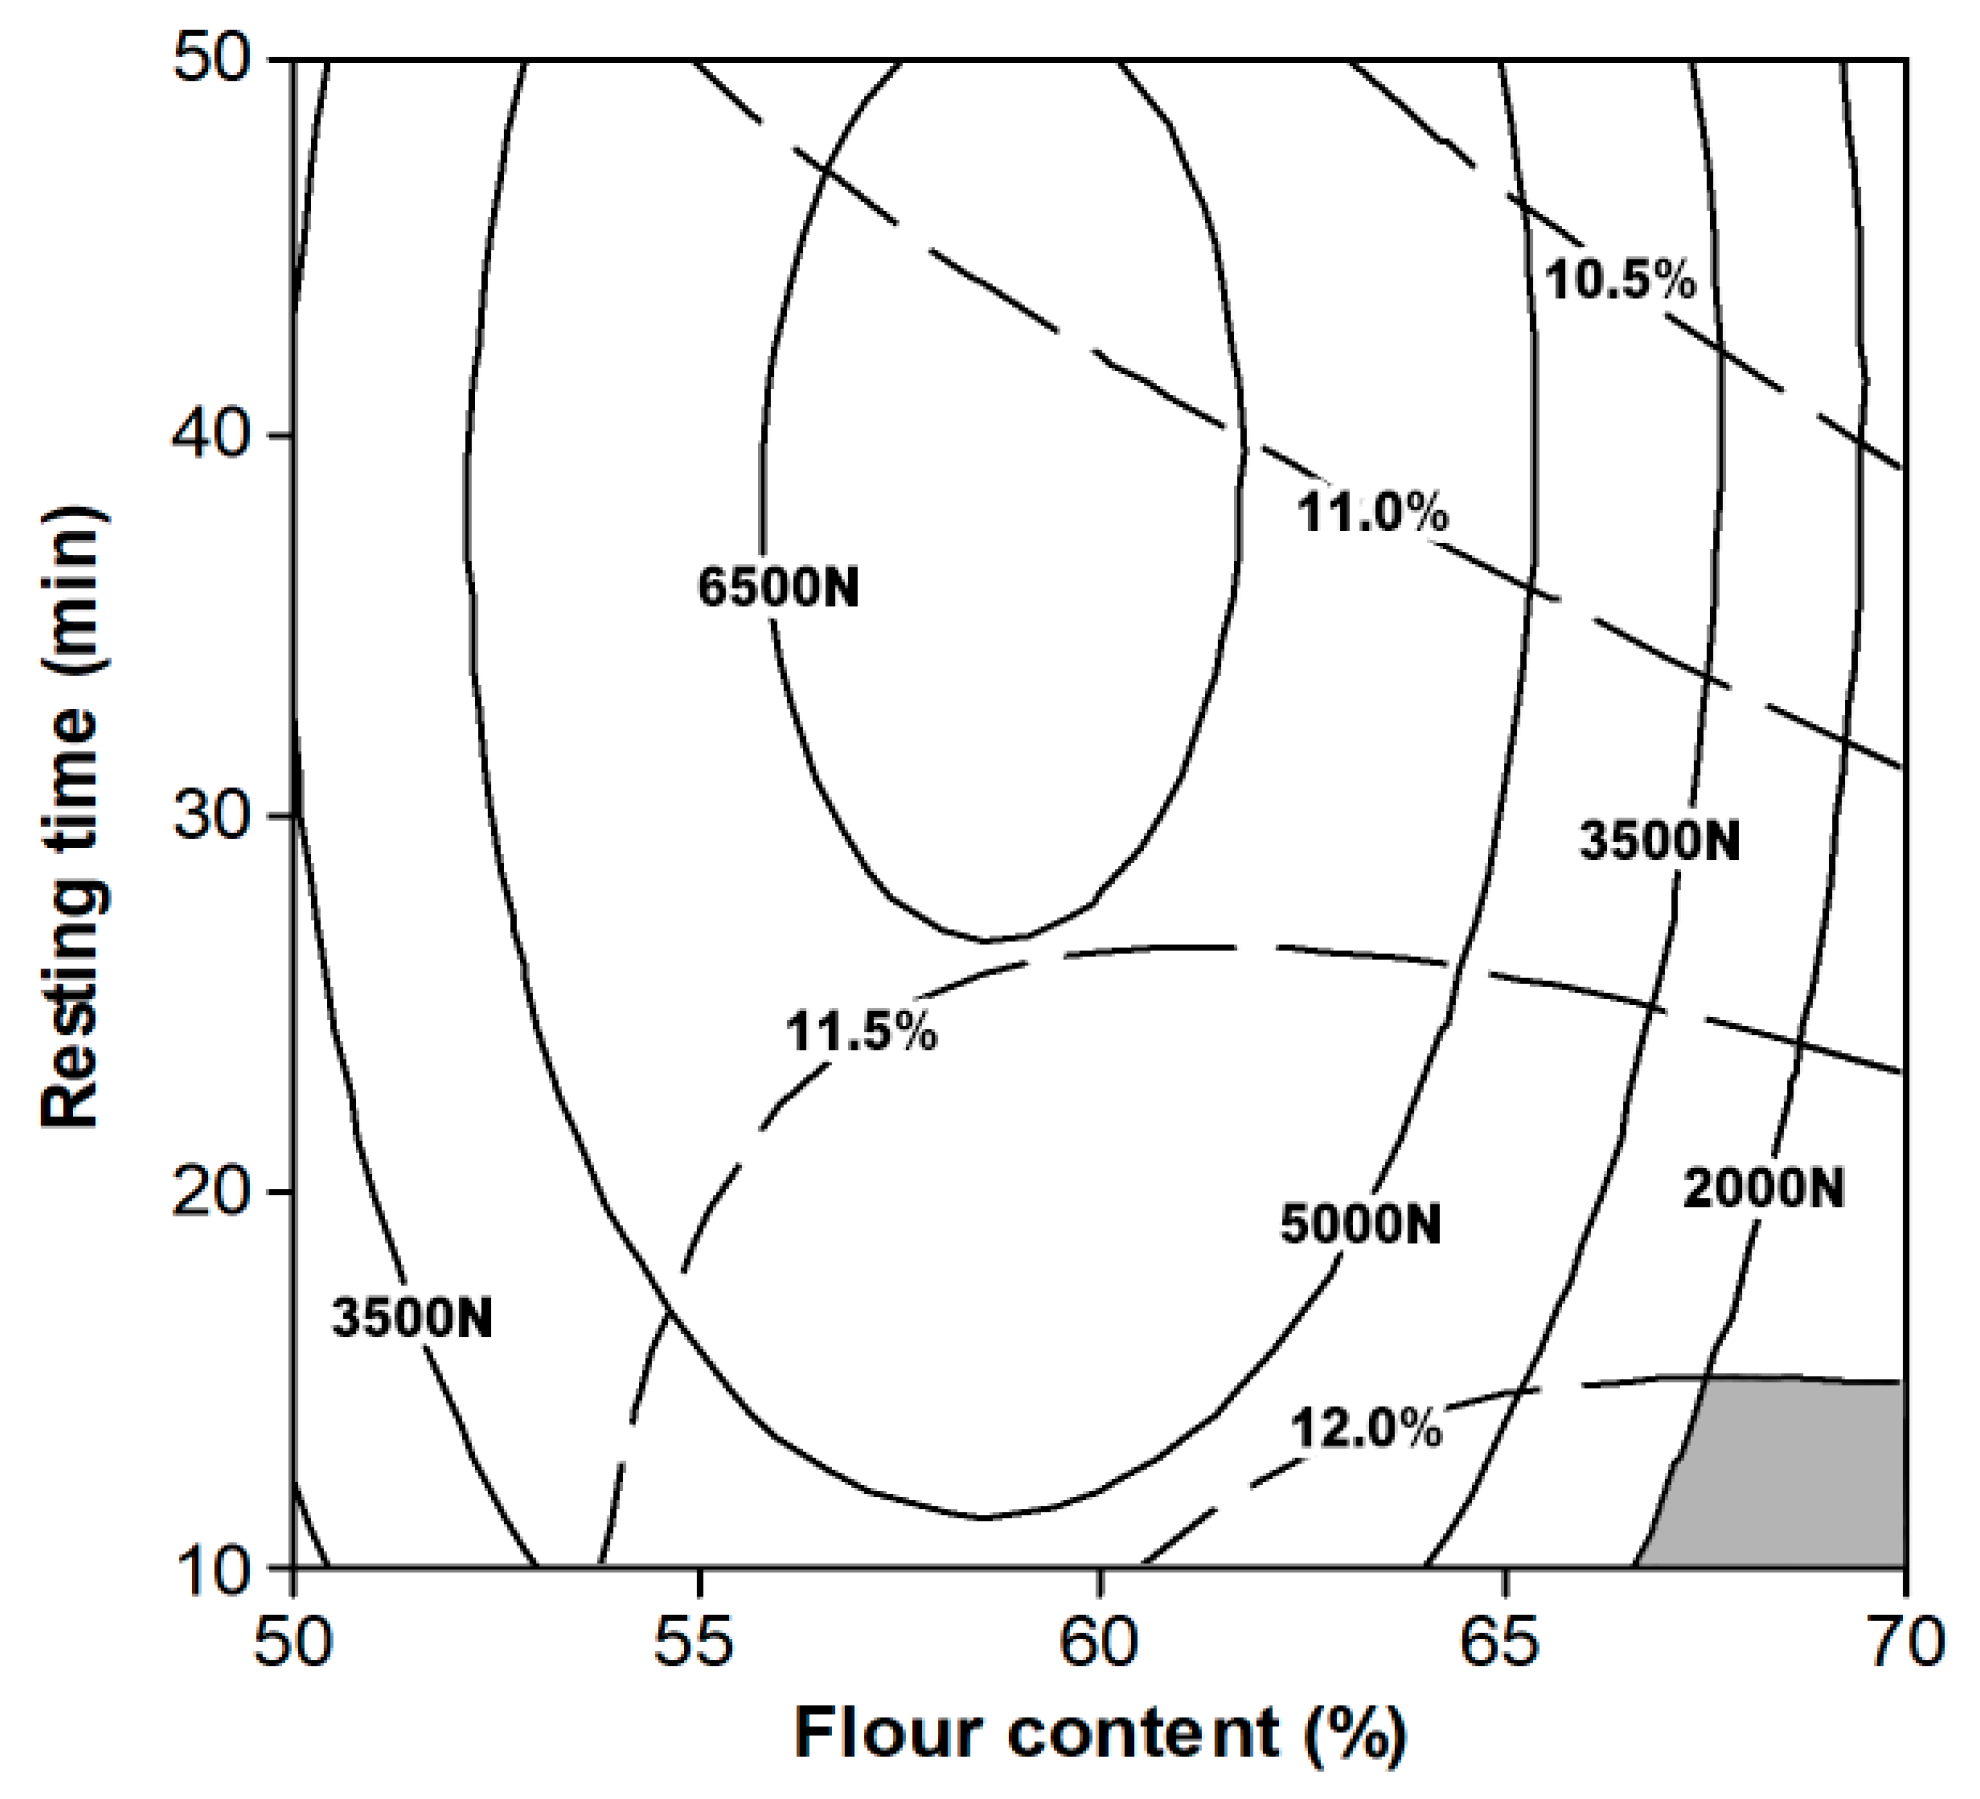
3.7. Contour Plots Superimposition

A method used to plot the overlaid graphs for various response surfaces is through the superimposition of the contour plots. This method is superior to the classical one-factor-at-a-time (OFAT) approach, which lacks the interaction of selected variables, and with experimental runs that are cumbersome [76]. The superimposed contour plots further serve as a reference template, which is easy to use in estimating the response for any given factor value within the range available. Figure 7 shows a feasible representation of the optimum range for the processing condition and formulation of cookie dough. The solid and dotted lines represent the contour line for stickiness and moisture content, respectively. Based on the overlaid contour plots, the optimum range for the lowest stickiness and highest moisture content (represented by the grey region) were found to be 67–70% flour content and 10–15 min resting time.

4. Conclusions

The effects of flour content and dough resting time on stickiness and moisture content were studied, and the statistical analysis using RSM and CCD showed that flour content and resting time have a significant effect on the stickiness and moisture content of the cookie dough. High stickiness was observed for flour content between 56% and 62%, and within 27 and 50 min for resting time. The lowest stickiness is associated with limited water available in the enlarged area of the protein matrix. Except for the sample with 50% flour content, the moisture content decreases when the resting time increases. Similarly, high moisture content was recorded at 10 min resting time and flour content between 55% and 70%. The high region moisture content was observed for flour content between 60% and 70%, and within 10 and 15 min of resting time. The sample with the lowest moisture content possessed a slightly clustered yet interconnected network of the protein matrix. The optimized values for factors were flour content (V1) = 67% and resting time (V2) = 10 min. The validation results showed the average relative deviation for stickiness and moisture content were 8.54% and 1.44%, respectively. The predicted model (regression coefficient model) thus developed was verified as highly accurate. The superimposition of the contour plots was found to successfully identify the optimum range for the lowest stickiness and highest moisture content, which were identified at 67–70% flour content and 10–15 min resting time. Several potential studies have been identified, including sensory evaluation and customer satisfaction. In addition, a study on different types of wheat flours may potentially improve the properties of cookie dough.

Author Contributions

Conceptualization, M.S.M.B.; Methodology, M.S.M.B.; Software, S.H.A.; Validation, M.S.M.B. and S.H.A.; Formal analysis, N.M.J.; Investigation, N.M.J.; Resources, M.S.M.B. and M.Z.M.N.; Writing—original draft preparation, M.S.M.B. and N.M.J.; Writing—review and editing, N.N.A.K.S. and A.S.; Supervision, M.S.M.B. and A.S.; Funding acquisition, M.S.M.B. All authors have read and agreed to the published version of the manuscript.

Funding

The authors acknowledge the financial support from Universiti Putra Malaysia (UPM) of the Geran Putra-IPM (9583800).

Acknowledgments

The authors would like to thank the staffs of faculty of engineering and Halal Products Research Institute for their assistance.

Conflicts of Interest

The authors declare no conflict of interest.

References

  1. Anozie, G.; China, M.; Beleya, E. Sensory evaluation and proximate composition of snacks produced from campsite flour of dioscorea alata and telfairia occidentalis seeds flours. J. Home Econ. Res. 2014, 20, 100–108. [Google Scholar]
  2. Davidson, I. Biscuit, Cookie and Cracker Production: Process, Production and Packaging Equipment; Academic Press: Cambridge, MA, USA, 2018. [Google Scholar]
  3. Carcea, M. Nutritional Value of Grain-Based Foods. Foods 2020, 9, 504. [Google Scholar] [CrossRef] [PubMed]
  4. Andersson, A.A.; Dimberg, L.; Åman, P.; Landberg, R. Recent findings on certain bioactive components in whole grain wheat and rye. J. Cereal Sci. 2014, 59, 294–311. [Google Scholar] [CrossRef]
  5. Hossain, A.; Brennan, M.A.; Mason, S.L.; Guo, X.; Zeng, X.A.; Brennan, C.S. The effect of astaxanthin-rich microalgae “Haematococcus pluvialis” and wholemeal flours incorporation in improving the physical and functional properties of cookies. Foods 2017, 6, 57. [Google Scholar] [CrossRef] [Green Version]
  6. Kowalczewski, P.Ł.; Walkowiak, K.; Masewicz, Ł.; Bartczak, O.; Lewandowicz, J.; Kubiak, P.; Baranowska, H.M. Gluten-Free Bread with Cricket Powder—Mechanical Properties and Molecular Water Dynamics in Dough and Ready Product. Foods 2019, 8, 240. [Google Scholar] [CrossRef] [PubMed] [Green Version]
  7. Oliveira, L.C.; Rosell, C.M.; Steel, C.J. Effect of the addition of whole-grain wheat flour and of extrusion process parameters on dietary fibre content, starch transformation and mechanical properties of a ready-to-eat breakfast cereal. Int. J. Food Sci. Technol. 2015, 50, 1504–1514. [Google Scholar] [CrossRef] [Green Version]
  8. Tolve, R.; Pasini, G.; Vignale, F.; Favati, F.; Simonato, B. Effect of Grape Pomace Addition on the Technological, Sensory, and Nutritional Properties of Durum Wheat Pasta. Foods 2020, 9, 354. [Google Scholar] [CrossRef] [Green Version]
  9. Ye, E.Q.; Chacko, S.A.; Chou, E.L.; Kugizaki, M.; Liu, S. Greater whole-grain intake is associated with lower risk of type 2 diabetes, cardiovascular disease, and weight gain. J. Nutr. 2012, 142, 1304–1313. [Google Scholar] [CrossRef]
  10. Knudsen, M.D.; Kyro, C.; Olsen, A.; Dragsted, L.O.; Skeie, G.; Lund, E.; Aman, P.; Nilsson, L.M.; Bueno-de-Mesquita, H.B.; Tjonneland, A.; et al. Self-reported whole-grain intake and plasma alkylresorcinol concentrations in combination in relation to the incidence of colorectal cancer. Am. J. Epidemiol. 2014, 179, 1188–1196. [Google Scholar] [CrossRef] [Green Version]
  11. Cho, S.S.; Qi, L.; Fahey, G.C., Jr.; Klurfeld, D.M. Consumption of cereal fiber, mixtures of whole grains and bran, and whole grains and risk reduction in type 2 diabetes, obesity, and cardiovascular disease. Am. J. Clin. Nutr. 2013, 98, 594–619. [Google Scholar] [CrossRef]
  12. Zhou, A.L.; Hergert, N.; Rompato, G.; Lefevre, M. Whole grain oats improve insulin sensitivity and plasma cholesterol profile and modify gut microbiota composition in C57BL/6J mice. J. Nutr. 2015, 145, 222–230. [Google Scholar] [CrossRef] [Green Version]
  13. Krotkiewski, M. Use of fibres in different weight reduction programs. Diet. Fiber Obes. Curr. Top. Nutr. Dis. 1985, 14, 85–109. [Google Scholar]
  14. Agin, B.; Jegtvig, S. Superfoods for Dummies; John Wiley & Sons: Hoboken, NJ, USA, 2009. [Google Scholar]
  15. Holm, J.; Björck, I. Bioavailability of starch in various wheat-based bread products: Evaluation of metabolic responses in healthy subjects and rate and extent of in vitro starch digestion. Am. J. Clin. Nutr. 1992, 55, 420–429. [Google Scholar] [CrossRef] [PubMed]
  16. Mamat, H.; Hill, S.E. Effect of fat types on the structural and textural properties of dough and semi-sweet biscuit. J. Food Sci. Technol. 2014, 51, 1998–2005. [Google Scholar] [CrossRef] [PubMed] [Green Version]
  17. Hartel, R.W.; Joachim, H.; Elbe, V.; Hofberger, R. Confectionery Science and Technology; Springer: Berlin/Heidelberg, Germany, 2018. [Google Scholar]
  18. Czubaszek, A.; Karolini-Skaradziñska, Z. Effects of wheat flour supplementation with oat products on dough and bread quality. Pol. J. Food Nutr. Sci. 2005, 14, 281. [Google Scholar]
  19. Khatkar, B. Effect of protein contents and water absorption values on dynamic rheological properties of wheat flour dough. J. Food Sci. Technol. Mysore 2005, 42, 321–325. [Google Scholar]
  20. Grausgruber, H.; Hatzenbichler, E.; Ruckenbauer, P. Analysis of repeated stickiness measures of wheat dough using a texture analyzer. J. Texture Stud. 2003, 34, 69–82. [Google Scholar] [CrossRef]
  21. Dobraszczyk, B. The rheological basis of dough stickiness. J. Texture Stud. 1997, 28, 139–162. [Google Scholar] [CrossRef]
  22. Hoseney, R.; Smewing, J. Instrumental measurement of stickiness of doughs and other foods. J. Texture Stud. 1999, 30, 123–136. [Google Scholar] [CrossRef]
  23. Adhikari, B.; Howes, T.; Bhandari, B.; Truong, V. Stickiness in foods: A review of mechanisms and test methods. Int. J. Food Prop. 2001, 4, 1–33. [Google Scholar] [CrossRef]
  24. Fendri, L.B.; Chaari, F.; Maaloul, M.; Kallel, F.; Abdelkafi, L.; Chaabouni, S.E.; Ghribi-Aydi, D. Wheat bread enrichment by pea and broad bean pods fibers: Effect on dough rheology and bread quality. LWT 2016, 73, 584–591. [Google Scholar] [CrossRef]
  25. Sangnark, A.; Noomhorm, A. Effect of dietary fiber from sugarcane bagasse and sucrose ester on dough and bread properties. LWT-Food Sci. Technol. 2004, 37, 697–704. [Google Scholar] [CrossRef]
  26. Ahmed, J.; Thomas, L. Effect of β-glucan concentrate on the water uptake, rheological and textural properties of wheat flour dough. Int. J. Food Prop. 2015, 18, 1801–1816. [Google Scholar] [CrossRef]
  27. Wenjun, L.; Margaret, B.; Luca, S.; Charles, B. The Effect of Oat Bran on the Dough Rheology and Quality of Chinese Steamed Bread. Grain Oil Sci. Technol. 2018, 1, 126–130. [Google Scholar]
  28. Campbell, G.M.; Ross, M.; Motoi, L. Bran in bread: Effects of particle size and level of wheat and oat bran on mixing, proving and baking. In Bubbles in Food 2; Elsevier: Amsterdam, The Netherlands, 2008; pp. 337–354. [Google Scholar]
  29. Osella, C.; Sanchez, H.; De La Torre, M. Effect of dough water content and mixing conditions on energy imparted to dough and bread quality. Cereal Foods World 2007, 52, 70. [Google Scholar]
  30. Manohar, R.S.; Rao, P.H. Effects of water on the rheological characteristics of biscuit dough and quality of biscuits. Eur. Food Res. Technol. 1999, 209, 281–285. [Google Scholar] [CrossRef]
  31. Aprodu, I.; Badiu, E.A.; Banu, I. Influence of protein and water addition on gluten-free dough properties and bread quality. Int. J. Food Eng. 2016, 12, 355–363. [Google Scholar] [CrossRef]
  32. Sudha, M.; Vetrimani, R.; Leelavathi, K. Influence of fibre from different cereals on the rheological characteristics of wheat flour dough and on biscuit quality. Food Chem. 2007, 100, 1365–1370. [Google Scholar] [CrossRef]
  33. Yoshino, D.; Matsumoto, H. Colloid titration of wheat proteins, dough, and flour. Cereal Chem. 1966, 43, 187–195. [Google Scholar]
  34. Hamed, A.; Ragaee, S.; Marcone, M.; Abdel-Aal, E.S.M. Quality of Bread and Cookie Baked from Frozen Dough and Batter Containing β-Glucan-Rich Barley Flour Fraction. J. Food Qual. 2015, 38, 316–327. [Google Scholar] [CrossRef]
  35. Lai, H.; Lin, T. Bakery products: Science and technology. Bak. Prod. Sci. Technol. 2006, 2, 3–65. [Google Scholar]
  36. Czitrom, V. One-factor-at-a-time versus designed experiments. Am. Stat. 1999, 53, 126–131. [Google Scholar]
  37. Box, G.E.; Wilson, K.B. On the experimental attainment of optimum conditions. In Breakthroughs in Statistics; Springer: Berlin/Heidelberg, Germany, 1992; pp. 270–310. [Google Scholar]
  38. Czyrski, A.; Jarzębski, H. Response Surface Methodology as a Useful Tool for Evaluation of the Recovery of the Fluoroquinolones from Plasma—The Study on Applicability of Box-Behnken Design, Central Composite Design and Doehlert Design. Processes 2020, 8, 473. [Google Scholar] [CrossRef]
  39. Basri, M.S.M.; Mustapha, F.; Mazlan, N.; Ishak, M.R. Optimization of Rice Husk Ash-Based Geopolymers Coating Composite for Enhancement in Flexural Properties and Microstructure Using Response Surface Methodology. Coatings 2020, 10, 165. [Google Scholar] [CrossRef] [Green Version]
  40. Asante-Sackey, D.; Rathilal, S.; Pillay, L.V.; Kweinor Tetteh, E. Ion Exchange Dialysis for Aluminium Transport through a Face-Centred Central Composite Design Approach. Processes 2020, 8, 160. [Google Scholar] [CrossRef] [Green Version]
  41. Kaleem, M.; Ahmad, A.; Amir, R.M.; Kaukab Raja, G. Ultrasound-Assisted Phytochemical Extraction Condition Optimization Using Response Surface Methodology from Perlette Grapes (Vitis vinifera). Processes 2019, 7, 749. [Google Scholar] [CrossRef] [Green Version]
  42. Basheer, A.O.; M Hanafiah, M.; Abdulhakim Alsaadi, M.; Al-Douri, Y.; Malek, M.; Mohammed Aljumaily, M.; Saadi Fiyadh, S. Synthesis and characterization of natural extracted precursor date palm fibre-based activated carbon for aluminum removal by RSM optimization. Processes 2019, 7, 249. [Google Scholar] [CrossRef] [Green Version]
  43. Shim, S.; Won, S.; Reza, A.; Kim, S.; Ahmed, N.; Ra, C. Design and Optimization of Fluidized Bed Reactor Operating Conditions for Struvite Recovery Process from Swine Wastewater. Processes 2020, 8, 422. [Google Scholar] [CrossRef] [Green Version]
  44. Tran, Q.T.; Vu Thi, T.L.; Do, T.L.; Pham Thi, H.M.; Hoang Thi, B.; Chu, Q.T.; Lai Phuong, P.T.; Do, H.N.; Hoang Than, H.T.; Ta Thi, T.T. Optimization of Microwave-Assisted Extraction Process of Callicarpa candicans (Burm. f.) Hochr Essential Oil and Its Inhibitory Properties against Some Bacteria and Cancer Cell Lines. Processes 2020, 8, 173. [Google Scholar] [CrossRef] [Green Version]
  45. Tabaraki, R.; Nateghi, A. Optimization of ultrasonic-assisted extraction of natural antioxidants from rice bran using response surface methodology. Ultrason. Sonochem. 2011, 18, 1279–1286. [Google Scholar] [CrossRef]
  46. Majid, M.A.A.; Abidin, I.H.Z.; Majid, H.; Chik, C.T. Issues of halal food implementation in Malaysia. J. Appl. Environ. Biol. Sci. 2015, 5, 50–56. [Google Scholar]
  47. Webster, F.; Wood, P. Oat utilization: Past, present and future. Oats Chem. Technol. 2011, 347–361. [Google Scholar]
  48. Dovesfarm.co.uk. US Cups Conversion Table. Available online: https://www.dovesfarm.co.uk/uploads/files/DovesFarm_US_Cups_Conversion_Table.pdf (accessed on 1 May 2020).
  49. Réhault-Godbert, S.; Guyot, N.; Nys, Y. The golden egg: Nutritional value, bioactivities, and emerging benefits for human health. Nutrients 2019, 11, 684. [Google Scholar]
  50. Chen, W.; Hoseney, R. Development of an objective method for dough stickiness. LWT-Food Sci. Technol. 1995, 28, 467–473. [Google Scholar] [CrossRef]
  51. Agrahar-Murugkar, D.; Dixit-Bajpai, P. Physicochemical, textural, color, nutritional, scanning electron microscopy and sensorial characterization of calcium-rich breads fortified with sesame, malted finger millet, cumin and moringa leaves. Nutr. Food Sci. 2019, 50, 47–60. [Google Scholar] [CrossRef]
  52. Yildiz, O.; Meral, R.; Dogan, I.S. Determination of stickiness values of different flour combinations. Int. J. Food Eng. 2012, 8, 1–11. [Google Scholar] [CrossRef]
  53. Fustier, P.; Castaigne, F.; Turgeon, S.; Biliaderis, C. Flour constituent interactions and their influence on dough rheology and quality of semi-sweet biscuits: A mixture design approach with reconstituted blends of gluten, water-solubles and starch fractions. J. Cereal Sci. 2008, 48, 144–158. [Google Scholar] [CrossRef]
  54. Laukemper, R.; Jekle, M.; Becker, T. Time-dependent adhesion behavior between dough and contact surfaces in bakeries. J. Food Eng. 2019, 255, 24–31. [Google Scholar] [CrossRef]
  55. Roman-Gutierrez, A.; Sabathier, J.; Guilbert, S.; Galet, L.; Cuq, B. Characterization of the surface hydration properties of wheat flours and flour components by the measurement of contact angle. Powder Technol. 2003, 129, 37–45. [Google Scholar] [CrossRef] [Green Version]
  56. van Velzen, E.J.; van Duynhoven, J.P.; Pudney, P.; Weegels, P.L.; van der Maas, J.H. Factors associated with dough stickiness as sensed by attenuated total reflectance infrared spectroscopy. Cereal Chem. 2003, 80, 378–382. [Google Scholar] [CrossRef]
  57. Tang, X.; Liu, J. A comparative study of partial replacement of wheat flour with whey and soy protein on rheological properties of dough and cookie quality. J. Food Qual. 2017, 2017, 1–10. [Google Scholar] [CrossRef]
  58. Rodriguez-Sandoval, E.; Franco, C.M.L.; Manjarres-Pinzon, K. Effect of fructooligosaccharides on the physicochemical properties of sour cassava starch and baking quality of gluten-free cheese bread. Starch-Stärke 2014, 66, 678–684. [Google Scholar] [CrossRef] [Green Version]
  59. Kim, Y.R.; Cornillon, P.; Campanella, O.; Stroshine, R.; Lee, S.; Shim, J.Y. Small and large deformation rheology for hard wheat flour dough as influenced by mixing and resting. J. Food Sci. 2008, 73, E1–E8. [Google Scholar] [CrossRef] [PubMed]
  60. Wu, J.; Hoseney, R. Rheological changes in cracker sponges during an 18-hour fermentation. Cereal Chem. 1989, 66, 182–185. [Google Scholar]
  61. Wang, L.; White, P. Structure and physicochemical properties of starches from oats with different lipid contents. Cereal Chem. 1994, 71, 443–450. [Google Scholar]
  62. Dachana, K.; Rajiv, J.; Indrani, D.; Prakash, J. Effect of dried moringa (Moringa oleifera lam) leaves on rheological, microstructural, nutritional, textural and organoleptic characteristics of cookies. J. Food Qual. 2010, 33, 660–677. [Google Scholar] [CrossRef]
  63. Brites, L.T.G.F.; Ortolan, F.; Silva, D.W.D.; Bueno, F.R.; Rocha, T.D.S.; Chang, Y.K.; Steel, C.J. Gluten-free cookies elaborated with buckwheat flour, millet flour and chia seeds. Food Sci. Technol. 2019, 39, 458–466. [Google Scholar] [CrossRef] [Green Version]
  64. Majzoobi, M.; Layegh, B.; Farahnaky, A. Inclusion of oat flour in the formulation of regular salted dried noodles and its effects on dough and noodle properties. J. Food Process. Preserv. 2014, 38, 48–58. [Google Scholar] [CrossRef]
  65. Sarabhai, S.; Prabhasankar, P. Influence of whey protein concentrate and potato starch on rheological properties and baking performance of Indian water chestnut flour based gluten free cookie dough. LWT-Food Sci. Technol. 2015, 63, 1301–1308. [Google Scholar] [CrossRef]
  66. Agyare, K.; Addo, K.; Xiong, Y.; Akoh, C. Effect of structured lipid on alveograph characteristics, baking and textural qualities of soft wheat flour. J. Cereal Sci. 2005, 42, 309–316. [Google Scholar] [CrossRef]
  67. Assifaoui, A.; Champion, D.; Chiotelli, E.; Verel, A. Rheological behaviour of biscuit dough in relation to water mobility. Int. J. Food Sci. Technol. 2006, 41, 124–128. [Google Scholar] [CrossRef]
  68. Hazelton, J.L.; DesRochers, J.L.; Walker, C.E. Biscuits, Cookies, and Crackers|Chemistry of Biscuit Making. In Encyclopedia of Food Sciences and Nutrition, 2nd ed.; Caballero, B., Ed.; Academic Press: Oxford, UK, 2003; pp. 533–539. [Google Scholar] [CrossRef]
  69. Bushuk, W. Distribution of Water in Dough and Bread. Baker’s Dig. 1966, 40, 38–41. [Google Scholar]
  70. Milašinović Šeremešić, M.; Dokić, L.; Nikolić, I.; Radosavljević, M.; Šoronja Simović, D. Rheological and textural properties of short (cookie) dough made with two types of resistant starch. J. Texture Stud. 2013, 44, 115–123. [Google Scholar] [CrossRef]
  71. Ghodke, S.; Ananthanarayan, L.; Rodrigues, L. Use of response surface methodology to investigate the effects of milling conditions on damaged starch, dough stickiness and chapatti quality. Food Chem. 2009, 112, 1010–1015. [Google Scholar] [CrossRef]
  72. Yi, J.; Kerr, W.L.; Johnson, J.W. Effects of waxy wheat flour and water on frozen dough and bread properties. J. Food Sci. 2009, 74, E278–E284. [Google Scholar] [CrossRef]
  73. Létang, C.; Piau, M.; Verdier, C. Characterization of wheat flour–water doughs. Part I: Rheometry and microstructure. J. Food Eng. 1999, 41, 121–132. [Google Scholar] [CrossRef]
  74. Almoraie, N.M. The effect of walnut flour on the physical and sensory characteristics of wheat bread. Int. J. Food Sci. 2019, 2019, 1–7. [Google Scholar] [CrossRef] [Green Version]
  75. Thacker, B.H.; Doebling, S.W.; Hemez, F.M.; Anderson, M.C.; Pepin, J.E.; Rodriguez, E.A. Concepts of Model Verification and Validation; Los Alamos National Lab: Los Alamos, NM, USA, 2004. [Google Scholar]
  76. Jampala, P.; Tadikamalla, S.; Preethi, M.; Ramanujam, S.; Uppuluri, K.B. Concurrent production of cellulase and xylanase from Trichoderma reesei NCIM 1186: Enhancement of production by desirability-based multi-objective method. 3 Biotech 2017, 7, 14. [Google Scholar] [CrossRef] [Green Version]
Figure 1. Schematic diagram of the texture analyzer.
Processes 08 00797 g001
Figure 2. (a) Surface plot; (b) contour plot of flour content vs. resting time for stickiness.
Processes 08 00797 g002
Figure 3. (a) Sample S4 (highest stickiness value); (b) Sample S8 (lowest stickiness value) at 100× magnification. OS: oat starch granules; WS: wheat starch granules; P: protein matrix.
Processes 08 00797 g003
Figure 4. (a) Surface plot; (b) contour plot of flour content vs. resting time for moisture content.
Processes 08 00797 g004aProcesses 08 00797 g004b
Figure 5. (a) Sample S3 (highest moisture content); (b) sample S13 (lowest moisture content) at 50× magnification. OS: oat starch granules; WS: wheat starch granules; P: protein matrix.
Processes 08 00797 g005
Figure 6. Optimization plot for optimum combination of flour content and resting time.
Processes 08 00797 g006
Figure 7. Optimum conditions as a function of the independent variables after superimposition of the contour plots.
Processes 08 00797 g007
Table 1. Difference in number of experimental runs between full factorial design and response surface methodology (RSM) [39].
FactorsLevelsTotal Number of Experimental Runs
Full Factorial DesignRSM
2525 (52)13
35125 (53)20
45625 (54)31
553125 (56)52
Table 2. Factors and levels used for stickiness and moisture content analyze.
FactorUnitNotationLevel
−2−1012
Flour content%V15055606570
Resting timeminV21020304050
Table 3. Design matrix.
SampleCoded factorUncoded Factor
V1V2V1V2
S1006030
S2116540
S30−26010
S4006030
S5006030
S6−115540
S7207030
S8207030
S9026050
S10−1−15520
S11116540
S12−205030
S13026050
S14−1−15520
S151−16520
S16−1−15520
S17−115540
S18006030
S19006030
S20006030
S21006030
S22−205030
S230−26010
S24006030
S25207030
S26006030
S27006030
S28−205030
S29026050
S30006030
S31−115540
S321−16520
S33006030
S34006030
S350−26010
S36006030
S37116540
S381−16520
S39006030
Table 4. Characteristics of wheat flour.
CharactersValues (%)
Wheat FlourQuick Oat
Moisture13.42 ± 0.108.50 ± 0.08
Ash *0.55 ± 0.011.83 ± 0.02
Protein *10.24 ± 0.0814.21 ± 0.12
Wet gluten *25.31 ± 0.110.93 ± 0.03
Values are given as mean ± standard deviation (n = 3) * Ash, protein and wet gluten values in % (w/w, dry mass).
Table 5. Ingredients used in cookie dough preparation.
IngredientsWeight (g)
Quick oat27–45
Wheat flour60–84
Brown sugar25
Coarse grain sugar25
Chocolate chip30
Cashew nut7
Almond slice10
Egg15
Butter125
Baking powder3
Table 6. Oat to flour composition, number of cups and weight of the oat and flour.
CompositionCup Percentage (% cup)No. of CupWeight (g)
OatFlourOatFlourOatFlour
50O/50F50500.500.5045.060.0
45O/55F45550.450.5540.566.0
40O/60F40600.400.6036.072.0
35O/65F35650.350.6531.578.0
30O/70F30700.300.7027.084.0
O: oat. F: flour.
Table 7. Design matrix and response value for the stickiness and moisture content test.
SampleCoded FactorUncoded FactorResponse
V1V2V1V2Stickiness (N)Moisture Content (%)
S1006030628511.36
S2116540454010.82
S30−26010477911.96
S4006030691811.42
S5006030673211.35
S6−115540620411.18
S7207030164511.09
S8207030152811.03
S9026050621410.74
S10−1−15520596011.52
S11116540495810.82
S12−205030284411.15
S13026050684310.69
S14−1−15520558911.49
S151−16520404011.72
S16−1−15520547711.46
S17−115540690911.15
S18006030660011.31
S19006030669811.36
S20006030674211.34
S21006030654611.35
S22−205030337911.14
S230−26010477911.96
S24006030664511.47
S25207030157111.11
S26006030684511.38
S27006030677411.39
S28−205030311011.16
S29026050653010.79
S30006030674511.41
S31−115540655811.20
S321−16520356811.81
S33006030642111.44
S34006030635611.40
S350−26010477911.96
S36006030659911.39
S37116540505410.83
S381−16520380111.77
S39006030661411.45
Table 8. Stickiness value for different flour content and dough resting time.
TermNotationCoefficientStd. Error of Coefficientp
Constant 6608.2279.330.000
Flour contentV1−553.1755.150.000
Resting timeV2452.4455.150.000
Flour content *Flour contentV1 *V1−1073.7839.910.000
Resting time *Resting timeV2 *V2−246.8239.910.000
Flour content *Resting timeV1 *V241.5095.530.667
R2 = 0.9644        R2(adj) = 0.9590
Table 9. Moisture content value for different flour content and dough resting time.
TermNotationCoefficientStd. Error of Coefficientp
Constant 11.38920.0088070.000
Flour contentV1−0.01860.0061230.005
Resting timeV2−0.30810.0061230.000
Flour content *Flour contentV1 *V1−0.06860.0044310.000
Resting time *Resting timeV2 *V2−0.00940.0044310.041
Flour content *Resting timeV1 *V2−0.15750.0106050.000
R2 = 0.9891        R2(adj) = 0.9875
Table 10. Experiment validation.
SampleStickiness (N)Moisture Content (%)
ActualPredictedRelative Deviation (%)ActualPredictedRelative Deviation (%)
SV1183217206.4512.0512.251.55
SV21913172011.1612.1712.250.57
SV3185917208.0211.9712.252.21
Average8.54Average1.44