Article

Performance Prediction Model of Solid Oxide Fuel Cell System Based on Neural Network Autoregressive with External Input Method

1
Department of Aircraft Engineering, Army Academy R.O.C, Taoyuan 32092, Taiwan
2
Institute of Nuclear Energy Research, R.O.C, Taoyuan 32092, Taiwan
*
Author to whom correspondence should be addressed.
Processes 2020, 8(7), 828; https://doi.org/10.3390/pr8070828
Submission received: 29 April 2020 / Revised: 30 June 2020 / Accepted: 3 July 2020 / Published: 13 July 2020
(This article belongs to the Special Issue Representative Model and Flow Characteristics of Fuel Cells)

Abstract

:
An accurate performance prediction model for the solid oxide fuel cell (SOFC) system not only contributes to the realization of the operating condition but also plays a role in long-term prediction performance. Accordingly, a research study has been developed to suitably deal with the time-series model and accurately build the performance prediction model of SOFC system based on neural network autoregressive with external input (NNARX) method. The architecture regressor parameters of the NNARX model were efficiently determined using the Taguchi orthogonal array (OA) method for optimal sets. The identified and evaluated optimal parameter levels were used to conduct an analysis of variance (ANOVA) to prove correctness. Moreover, a series of statistics criteria and multi-step prediction were also employed for investigating the uncertainty of the predicted model and solve the overfitting and under fitting problems; further. These criteria were also used to determine the performance of the proposed model architecture. The predicted results of the current study indicated that the developed optimal model level parameters consistently had the least statistics errors and reduced workload of the trial-and-error processes.

1. Introduction

During the last decades, countries around the world have invested great emphasis and research attention on production of renewable energy resources because of global warming and economic efficiency concerns. Among various available renewable power sources, fuel cells are promising energy resources because they generate electricity without any pollutant emissions. One of the most in-demand fuel cell types is the solid oxide fuel cell (SOFC), due to its extremely low emissions, high conversion efficiency and potential long lifetime. Accordingly, SOFC system productions have been developed for applications in various domains, including the military, residential, industrial and transportation fields [1,2,3].
The accurate prediction of the SOFC system performance can assist in better utilization of this system for commercialization and maintenance of its reliability and durability as a power system. Moreover, the precise prediction model of the SOFC system developed in advance could assist in efficient energy distribution among managers. The existing performance prediction models for the SOFC system are divided into two groups—(1) white-box model and (2) black-box model. White-box model methods, called model-based approaches, have been used to estimate the prediction model of SOFC through the mathematical. The mathematical modeling approach consists of an inner system physical model and an electrochemical equivalent circuit model. More details and complicated models have been translated by physical and analytical equations from a multi-dimension (MD) [4,5,6,7,8,9,10,11,12,13,14].
The MD model, called the computational fluid dynamics (CFD) technique, can simulate the inside airflow concentration and operational condition of the parameters for the SOFC performance before the production is constructed. Such MD numerical approaches are coupled with complex mathematical equations following physical, electrochemical and thermal principles for the white-box model methods of the SOFC system. Whilst high-dimension models could increase the prediction accuracy, nonlinear complex mathematical equations require much computation and are time consuming.
Meanwhile, the black-box model approaches are based on statistical regression of the experimental data from measurement of sensors. Black-box model approaches enabled the response relationship between inputs and outputs without explicit physical mathematic equations. These models were behavioral models derived through a statistics data-driven approach, which had the advantage of dynamic prediction model [15,16,17,18,19,20,21,22,23,24,25]. From the available literature of the artificial neural network (ANN) approaches are a type of the black box models and have become popular and more widely utilized in the FC system performance prediction.
The statistics data-driven approach proposed the usage of the measurement data to imply inputs to the outputs, simulate the SOFC system performance and provide a good prediction and accurate ability during sufficient measurement dates. An SOFC is a coupled nonlinear time -variety with dynamic physical system; hence, the corresponding performance prediction model of the SOFC system can be obtained once the experimental data from the sensor measurements are prepared and employed to train the NN structure. The objective of this study was to present the potential of predicting the SOFC system performance based on the usage of the neural network autoregressive with external input (NNARX) model. The proposed model had the ability to train complex nonlinear and time-series input/output relationships and adapt to the changes in an operating condition, such as that in the SOFC system.
The advantage of the NNARX model is a more accurate series-parallel identification model method that measures the output available for use instead of feeding-forward the estimated output [26,27]. The quality of the established NNARX model performance prediction of SOFC system not only depends on neural network hidden neuron but also ARX model order and time delay structure parameters. Above all, there is limited theoretical and practical background to support the systematical selection of the structure parameters during the modeling phase process. The model structure parameters of the NNARX are usually selected based on previous experience in the trial-and-error processes and the workload leading to time consumption. In that way, the optimal combination setting of the NNARX structure parameters is not guaranteed.
In this study, one of the efficient and systematical analyses of NNARX model structure performed statistical experimental design by using the Taguchi orthogonal array (OA) method for achieving the goal. Taguchi OA method has ability to determine the effect of the factors on characteristic properties and the optimal conditions of them. The advantage of the Taguchi method is that uses special design of OA with only a small number of experiments in order to realize the effect of input variables on the response characteristics. The important levels of parameter are computed within analysis of variance (ANOVA). The optimum combination structures of NNARX model are obtained by using signal of noise (S/N). Therefore, the proposed method of Taguchi OA method for achieving the NNARX model architecture usefully minimizes time, cost and number of trial experiments, which efficiently reduces the workload [28,29,30]. Moreover, the mathematical validation criteria have been investigated and analyzed to attain the model accuracy. In addition, a multi-step ahead prediction has been adopted to examine the results of the long-term prediction and generalization problems. The long-term prediction NNARX model of the SOFC system performance was developed based on the measured operating parameter data.
The remainder of this paper has been organized as follows—Section 2 presents the data set collection for this study; Section 3 introduces the systematic modeling techniques, including the NNARX model and the Taguchi OA array; in addition, the performance of error that includes the coefficient of determination (R2), root mean square error (RMSE), mean absolute error (MAE), mean absolute percentage error (MAPE) and different steps of the ahead prediction k for the SOFC long-term model; Section 4 describes the model prediction results and discussion; finally, Section 4 provides the conclusions and future work.

2. Materials and Methods

2.1. Data Description and Test System

In this work, the commercial Anode-Supported Cell (ASC) SOFC cells within the size of 10 × 10 cm2 and a reactive area of 9 × 9 cm2 conducted [31]. The main compositions of anode, electrolyte and cathode are NiO/YSZ, YSZ and LSC within total 550 µm thickness. The cell operating temperature range is from 600 to 700 °C. Figure 1 shows the schematic diagram of SOFC unsealed design experimental platform.
The long-term test processes was separated into two models by varying gases flow rate—one is standard operating procedure (SOP) and other reducing flow rate. In the SOP test, the hydrogen and air fed in anode and cathode with the flow rate of 800 cm3/min and 2000 cm3/min during the temperature up to 700 °C. To realize the effect of less flow rates on the SOFC performance, the flow rates were reduced and sent as 500 cm3/min of hydrogen into the anode and 1500 cm3/min air into the cathode and further tested after the basic test period. During the long-term testing period, the polarization curve measurement and the AC impedance were recorded within a certain interval. The detail analysis results of experimental had been published in literature [31]. The major fluctuations output voltage data of SOFC system could present the significant effect during operation and generally utilized to evaluate the degree of performance since easily measured. The long-term degradation performance of voltage dataset within reduced flow operating parameters was divided into training phases and validation phases of NNARX model as shown in (Figure 2) [32].

2.2. Applied Methodology

The proposed methodology was applied to construct the identification model for predicting the SOFC long-term performance based on neural network autoregressive with external input (NNARX) mode. The NNARX model architecture parameters were used by employing the Taguchi OA method to achieve minimum time consumption and find the optimal settings efficiently. Moreover, a series of statistics performance criteria provided a goodness of fit to show the NNARX model structure of the SOFC system for the correctness of the long-term prediction.

2.2.1. NNARX Model

Similar to a time-varying nonlinear complex SOFC system, the traditional identification method was not easy to model. The neural network by the recurrent dynamic structure output was dependent not only on the present input but also on previous input, output and network status. The dynamic neural network had the advantages of memory and simplicity to effectively train a series of time-varying systems. One kind of dynamic neural network based on the NNARX was applied herein, which showed the next dependent output signal values relationship between the previous output signal values with the previous exogenous independent input signal values as shown in Figure 3.
The NNARX model was found based on the linear ARX model, which can be expressed in the following equation form [27]:
y ^ p r e d ( t ) = g [ y ( t 1 ) , , y ( t n a ) ,   u ( t n k ) , , u ( t n b n k + 1 ) ] + e ˜ ,
where y and u represents the measured output and input, respectively; y ^ p r e d ( t ) is the estimated validation prediction performance of the SOFC output; na and nb is output and input model structure respectively and nk is the time delay; e ˜ ( t ) is the unknown perturbation or noise mapping error. The tapped delay line code was used to compute the regressor structure parameter of [ ] . The neural network structure of multilayer perceptron was applied to model the NNARX regressor structure given as follows:
y ^ p r e d ( t ) = g [ ( t ) T , φ ] + e ˜ ( t ) ,
where ( t ) and φ represent the regression vectors and the adjustable parameters of the NN structure weights and bias, respectively. The units in the hidden and output layers were used by the hyperbolic tangent and the linear transfer function (F, f), respectively. The formula computation of the neural network output value is as follows [26]:
y ^ p r e d ( ( t ) T , φ ) = f i ( j = 1 h n W i , j × F j ( i = 1 n d w j , i φ i + w j , 0 ) + W i , 0 ) ,
where h n is the number of hidden units; W i , j is the weighting between hidden neuron and output layer; n d is the number of input variables; w j , i denotes the weighting between input and hidden layer. During the selected NNARX model architecture parameters process, the thresholds and the weights of the joints between the two layers of the performance index (PI) were evaluated using the normalized sum square error (NSSE) of the output layer. The PI formula is defined as follows:
PI = ( NSSE tr + NSSE ts ) ,   NSSE = SSE / 2 N   ,   SSE = i = 1 n ( y i y ^ p r e d i ) 2 ,
where y i and y ^ p r e d i are the measures of the prediction output. The NSSE denotes the training and testing data. The operation condition of the SOFC data could be recorded within the sensors at the stack inlet side, including aging time, current density, temperature of the anode and cathode and flow rate of H2 and air, because these parameters can be controlled based on the required operating condition. Meanwhile, the NNARX model output was the SOFC voltage (Figure 4).
The network topic was to minimize the prediction error between the model predictions and measurements by turning weights and biases. The appropriate model order [na nb nk] and network structures [hn] played an important role in the identification procedure with the recurrent NNARX model. The principle of selection within the smallest number of independent parameters explaining the model well should be followed [33]. The regressor structure values of na, nb and nk, were used to work over the range of 1 to 5. The three-layer feed-forward neural network structure was employed to model the structure and the reason for this is to easily estimate any nonlinear function within a sufficient number of hidden neurons in the previous research [34,35,36]. No general rules are required for choosing the appropriate number of hidden neurons before the identification process. The number of hidden-layer neurons has a significant effect on the prediction results (e.g., few neurons cause model under fitting, whilst many neurons result in an increase in the training time and model overfitting). According to previously proposed literatures [37], the number of neurons can determine the level of questions. An experience formula for the determination of hidden neurons is expressed below:
h n = n i + n o + p ,
where hn, ni, no and p represent the number of hidden neurons, inputs and outputs, respectively and p is an integer constant from 1 to 12. A common approach is the trial-and-error approach within different structure parameters until the model performance was going good. If many topologies must be considered, the approach was time-consuming and un-affordable. The Taguchi orthogonal (OA) array was employed in the parameter selection to efficiently save time spent and reduce the number of experiments conducted.

2.2.2. Taguchi OA Method

The crucial major tasks in the identification procedure of the NNARX model based on the regressor structure and hidden neurons involved the selection of an appropriate architectural parameter. In this section, the Taguchi OA method was employed to minimize time consumption and obtain the accurate and robust NNARX model structure of the SOFC. The Taguchi method is a statistic methodology widely used to determine the optimum operating parameter of design factors. It induces an efficient and systematic design of OAs to consider the entire parameter with a few numbers of experimental runs. In the OA design, all parameter level combinations occur for an equal number of times. By applying OAs, the Taguchi approach can be utilized to easily set-up experiments with a very large number of factors varied on few levels. The Taguchi OA provides the performance measurement criteria transformed into the signal-to-noise (S/N) ratio for computing the variance of the response at each setting of the experimental parameter runs. Generally, the OA methods have three types of S/N ratio—larger-the-better (LB), nominal-the-better (NB) and smaller–the-better (SB). The main propose of the proposed Taguchi OA based on economically and accurately is to select the NNARX model structure parameter. On the other word, the aim is to develop model architecture parameters of NNARX model and yields outstanding performance of the SOFC system. Therefore, the PI according to Formula (4) belongs to the SB type problem and corresponding objective function to minimal represented by the formula as follows:
S N = 10 log 10 ( 1 n i = 1 n y i 2 ) ,
where yi is the performance response to the ith setting of the model structure parameter combination and n is the number of samples in a trial. Table 1 shows the NNARX model architecture of the SOFC system design parameters and their corresponding levels. If all of the possible combination of the design factors with each have three levels were to be considered, then the number of full factorial design runs 34 = 81 would be created. This is uneconomical, so by applying Taguchi OA method to reduce a large number of variables with a small number of experiments. In this work, the total degree of freedom (DoF) for the four design factors is 4 × (3 − 1) = 8, an economical DoE of OA L9(34) is selected based on experimentation as it has 9 DoF more than selected NNARX design factors [30]. Therefore, a total of nine experimental runs were performed. The variability was inversely proportional to the S/N ratio, meaning that a greater S/N value corresponded to a better performance of the NNARX model. The results were obtained by independently extracting the main effects of these factors and determining the statistically significant factors. For each combination of OA experiment runs, the values were computed based on training model identification data set using MATLAB software. The model structure of NNARX parameter was estimated using the PI criterion.

2.2.3. Model Validation Criteria Metric Definitions

The performance evaluation criteria of the NNARX model were compared herein using various statistical methods. The statistic measures considered were R2, RMSE, MAE and MAPE, which are given as follows:
R 2 = 1 i = 1 n ( y i y ^ p r e d i ) 2 i = 1 n y ^ p r e d i 2
RMSE = 1 n i = 1 n ( y i y ^ p r e d i ) 2
MAE = 1 n i = 1 n | y y ^ p r e d i |
MAPE = 1 n i = 1 n | y y ^ p r e d i y | × 100 % ,
where y i is the real measurement value; y ^ p r e d i is the predicted model value by NNARX model; and n is the number of sample measurement size. R2 value can be conducted to evaluate the accuracy performance of prediction model. The smaller statistical measurement values of the RMSE, MAE and MAPE generally had better prediction ability for the corresponding model. Actually, the modeling test phase should be performed in accordance with the intended use of the model. In order to verify the ability of NNARX model to evaluate the uncertainty for unseen data and predict intervals generalization, other validation methods should be considered.

2.2.4. Multi-Step Ahead Prediction

To avoid the NNARX model of the SOFC system from overfitting or under fitting, the important technique of the k-step ahead prediction was employed for the prediction interval. The multi-step ahead prediction approach is basically an extension of the one-step ahead validation test. The method can divulge whether information was captured by the NNARX model. In the NNARX model validation procedure, the approach was applied to examine the underfitting or overfitting problems described as [38]:
y ^ p r e d ( t + k ) = y ^ p r e d ( t + k t , θ ^ ) = g ^ [ ^ ( t + k ) , θ ^ ] ,
where
^ T ( t + k ) = [ y ^ p r e d ( t + k ) y ^ p r e d ( t + k min ( k , n ) + 1 ) y ( t )   y ( t max ( n k , 0 ) ) u ( t d + k ) u ( t d m + k ) ]
The two-ahead, third-ahead and four-ahead predictions were employed in the SOFC model herein.

3. Results and Discussion

For developing the long-term prediction performance of the SOFC system using the NNARX model, the total data sets were separated into two parts as training mode and validation test phases, respectively (Section 2 and Figure 2). The software used was the MATLAB Identification Toolbox for predicting the SOFC system performance [39].

3.1. Analysis of the Selected NNARX Model Structure

Four factors were selected according to the model parameter structure of NNARX as shown in Table 1. Three levels of the L9 OA experiment runs were proposed and the NSSE was computed at each training and validation step (Figure 5). Meanwhile, the training and the validation NSSEs were considered as the PI combined within the concept of the SB values (Table 2). In spite of the different types of performance characteristics, a greater S/N ratio corresponded to a better output performance. Based on the results obtained, the proposed model structure parameters of experiment run in OA5 (A2B2C3D1) for (A) hidden units (hn = 10, level-2), (B) output order (na = 3, level-2),(C) input order (nb = 5, level-3) (D) time delay (nk = 1,level-1) provide less PI index and higher SN value than any other experiment runs in OA matrix.
To analyze the design factor effects of NNARX model structure yield output performance for SN values, the response table was designed as shown in Table 3. This indicates the optimal level values of design model parameters within the highest S/N in bold form. The optimal level value of the design factor was the level that provided the highest S/N value in the design interval. Moreover, the response table is represented graphically in Figure 6. This indicates that the optimal levels are marked within red circles. Based on this, the optimal NNARX model parameter structure levels were A2B3C3D1 for (A) hidden units (hn = 10, level-2), (B) output order (na = 5, level-3), (C) input order (nb = 5, level-3), (D) time delay (nk = 1, level-1). In other words, the optimum parameter structure selected had 10 hidden units, model output-input order delays both the same in 5 and time-delay in 1 was the optimal test NNARX model.
To compute the relative magnitude of the effect of design factor and estimate the error variance on the S/N value of SB in NNARX model structure parameter, the analysis of variance (ANOVA) was performed. The result of ANOVA used S/N ratios within 95% confidence level as shown in Table 4. Based on the ANOVA analyses, the factors A and C are pooled into the error term due to the small values of the sum of squares and it is clear that change the design factor B (na) for model output order of level contributed to 97.6% of the total variation in the NNARX model of SOFC performance.

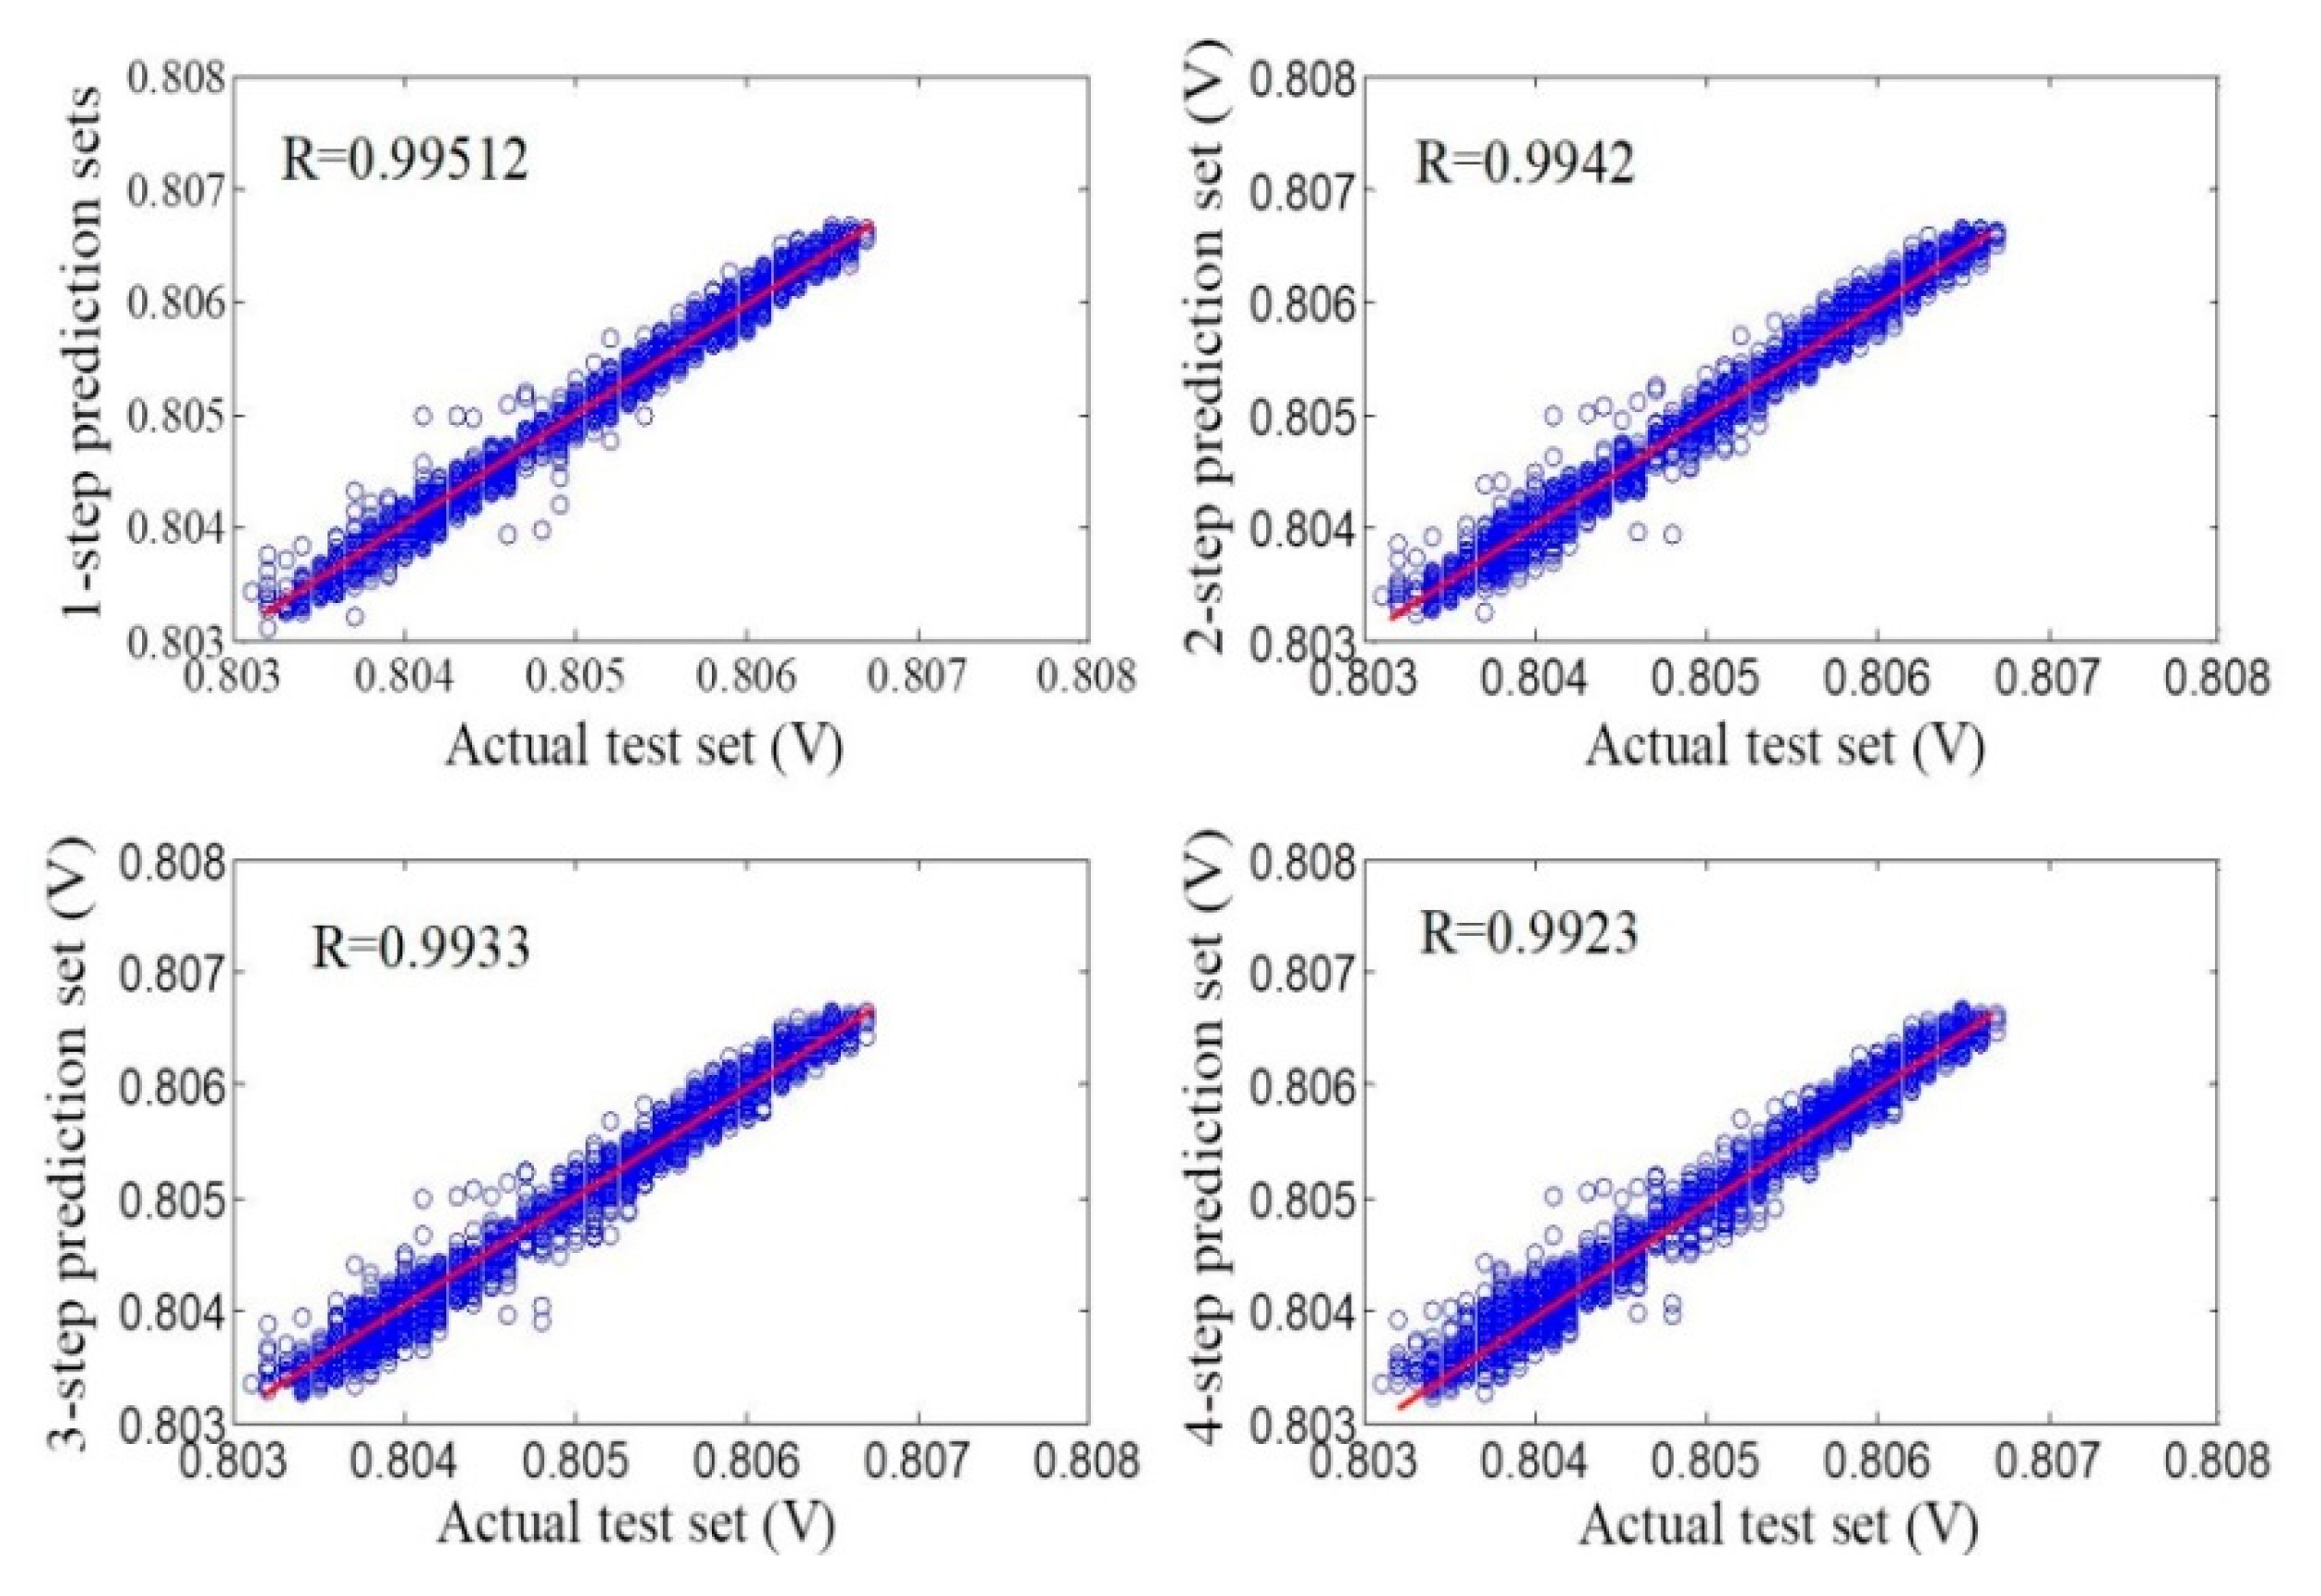
3.2. Comparison and Prediction Analysis

The expected responses of the optimal design have to be verified to recheck whether the errors caused by interaction among the design factors within an acceptable tolerance. Confirmation test process was performed as a necessary and important procedure to verify the experimental results. Based on the above discussion, the optimum design structure parameters identified was not included in experiment runs of OA matrix and therefore the confirmation test should be conducted. Applying the A2B3C3D1 combination of NNARX model design parameters of levels, the optimum model structures of SOFC system was developed. Comparing original OA5 (A2B2C3D1) with optimal set (A2B3C3D1), the NNARX model was trained and tested within PI index as shown in Figure 7. The results indicated that the optimal set of A2B3C3D1 provided the less PI values and improved the performance combined in S/N ratio 18.5% (dB) than OA5.
In order to verify the prediction ability of the developed optimal set NNARX model, statistics criteria were concerned in the comparison of the prediction performance. Multi-step predictions were conducted and four corresponding results have been listed in Table 5 and Figure 8. The results indicated that the values of the RMSE, MAE and MAPE of the analysis optimal set model structure parameters were all lesser than original best experiment runs combination in OA5 parameters in one-step ahead to four-step ahead prediction, which further demonstrated the superiority of the proposed method of NNARX model prediction ability. For example, the RMSE average values of two parameters model sets prediction was reduced by 1.32%, 2.28%, 3.64% and 6.61% in horizons of one-step ahead, two-step ahead, three-step ahead and four-step ahead, respectively. With the increase of the prediction horizon, the prediction errors were also less. Moreover, the higher values coefficient of determination R2 was interpreted as the amount of variability in the model. The R2 values of optimal set was higher than OA5 in horizons of one-step ahead, two-step ahead, three-step ahead and four-step ahead, respectively.
The developed NNARX model based on proposed methods had the best long term prediction performance than benchmark sets in horizons of one-step, two-step, three-step and four-step prediction. In Figure 8a–d shows the multi-step prediction results of the developed model of optimal test parameter structures of A2B3C3D1. As it is obvious in Figure 9, the proposed model could effectively capture the main trends of voltage change of SOFC system. Figure 10 shows the prediction ability for the optimal set model for voltage of SOFC system. The model prediction output data was around the 45-degree line that indicated that the model possessed a goodness of fit. The R values of the optimal set output with respect to one-step ahead, two-step ahead, three-step ahead and four-step ahead were 0.995, 0.994, 0.993, 0.992, respectively. They had an average regression value of 0.9935 which was close to unity and provided an accurate fit of all output datasets. Thus, the results concluded that the developed proposed model based on Taguchi OA method can successfully and effectively reduce workload of the trial-and-error process. Additionally, the optimal sets parameters model of NNARX model applied with multi-step prediction approach provided the long-term high performance of SOFC system.

4. Conclusions

In this study, the NNARX structure was successfully proposed and developed to predict the complex long-term performance of SOFC system. This was performed by realization of the design problem and selection of a suitable NNARX model structure. Initially, the systematic Taguchi OA method was used to choose the important level factors and simplify the design problem. ANOVA was then utilized to compute sensitivity and more precise combination of design level factors. Through a series of statistical analysis, the final results demonstrated that the optimal test indeed improved the original design and achieved a better performance. The experimental results are demonstrated in the rich and detailed validation, including prediction intervals and k-step advance prediction. Moreover, the proposed methodology was strongly trusted to be successfully applied for the development of a NNARX model for the long-term prediction of the SOFC system performance within relatively small and time-effective experiment. Future research works regarding the incorporation of the results of this study into prognostics and health management is highly encouraged. This can be done in terms of predictive maintenance extending the lifetime and reducing the cost of SOFC system.

Author Contributions

Conceptualization, S.-J.C.; methodology, S.-J.C.; software, S.-J.C.; validation, S.-J.C.; formal analysis, S.-J.C.; investigation, S.-J.C.; resources, J.-K.L.; data curation, S.-J.C. and J.-K.L.; writing—original draft preparation, S.-J.C.; writing—review and editing, S.-J.C.; visualization, S.-J.C.; supervision, S.-J.C.; project administration, S.-J.C.; funding acquisition, S.-J.C. All authors have read and agreed to the published version of the manuscript.

Funding

This research was supported by the Ministry of Science and Technology, Taiwan, R.O.C., under grant MOST 108-2221-E-539-001.

Acknowledgments

The authors thank to acknowledge of Institute of Nuclear Research, Atomic Energy Council, R.O.C. for providing the dataset assistances.

Conflicts of Interest

The authors declare no conflict of interest.

References

  1. Stambouli, A.B.; Traversa, E. Solid oxide fuel cells (SOFCs): A review of an environmentally clean and efficient source of energy. Renew. Sustain. Energy Rev. 2002, 6, 433–455. [Google Scholar] [CrossRef]
  2. E4tech. The Fuel Cell Industry Review 2017; E4tech: London, UK, 2017; Available online: http://www.fuelcellindustryreview.com (accessed on 20 January 2020).
  3. Kaur, G. Solid Oxide Fuel Cell Components: Interfacial Compatibility of SOFC Glass Seals; Springer: Berlin/Heidelberg, Germany, 2016. [Google Scholar]
  4. Ma, R.; Gao, F.; Breaz, E.; Huangfu, Y.; Briois, P. Multidimensional Reversible Solid Oxide Fuel Cell Modeling for Embedded Applications. IEEE Trans. Energy Convers. 2018, 33, 692–701. [Google Scholar] [CrossRef]
  5. Wang, K.; Hissel, D.; Péra, M.C.; Steiner, N.; Marra, D.; Sorrentino, M.; Pianese, C.; Monteverde, M.; Cardone, P.; Saarinen, J. A Review on solid oxide fuel cell models. Int. J. Hydrog. Energy 2011, 36, 7212–7228. [Google Scholar] [CrossRef]
  6. Gebregergis, A.; Pillay, P.; Bhattacharyya, D.; Rengaswemy, R. Solid oxide fuel cell modeling. IEEE Trans. Ind. Electron. 2009, 56, 139–148. [Google Scholar] [CrossRef] [Green Version]
  7. Klotz, A.D.; Leonide, A.; Weber, A.; Ivers-Tiffée, E. Electrochemical model for SOFC and SOEC mode predicting performance and efficiency. Int. J. Hydrog. Energy 2014, 39, 20844–20849. [Google Scholar] [CrossRef]
  8. Hajimolana, S.A.; Hussain, M.A.; Daud, W.M.A.W.; Soroush, M.; Shamiri, A. Mathematical modeling of solid oxide fuel cells: A review. Renew. Sustain. Energy Rev. 2011, 15, 1893–1917. [Google Scholar] [CrossRef]
  9. Stempien, J.P.; Liu, Q.; Ni, M.; Sun, Q.; Chan, S.H. Physical principles for the calculation of equilibrium potential for co-electrolysis of steam and carbon dioxide in a Solid Oxide Electrolyzer Cell (SOEC). Electrochim. Acta 2014, 147, 490–497. [Google Scholar] [CrossRef]
  10. Wang, C.; Nehrir, M.H. A physically based dynamic model for solid oxide fuel cells. IEEE Trans. Energy Convers. 2007, 22, 887–897. [Google Scholar] [CrossRef]
  11. Andersson, M.; Yuan, J.; Sundén, B. Review on modeling development for multiscale chemical reactions coupled transport phenomena in solid oxide fuel cell. Appl. Energy 2010, 87, 1461–1476. [Google Scholar] [CrossRef] [Green Version]
  12. Peksen, M. A coupled 3D thermofluid–thermomechanical analysis of a planar type production scale SOFC stack. Int. J. Hydrog. Energy 2011, 36, 11914–11928. [Google Scholar] [CrossRef]
  13. Rossia, I.; Traversoa, A.; Tucker, D. SOFC/Gas Turbine Hybrid System: A simplified framework for dynamic simulation. Appl. Energy 2019, 238, 1543–1550. [Google Scholar] [CrossRef]
  14. Huang, Q.A.; Hui, R.; Wang, B.; Zhang, J. A review of AC impedance modeling and validation in SOFC diagnosis. Electrochim. Acta 2007, 52, 8144–8164. [Google Scholar] [CrossRef]
  15. Zhongliang, L.; Rachid, O.; Daniel, H.; Stefan, G. Data-driven diagnosis of PEM fuel cell: A comparative study. Control Eng. Pract. 2014, 28, 1–12. [Google Scholar]
  16. Wu, Y.; Breaz, E.; Gao, F.; Miraoui, A. A Modified Relevance Vector Machine for PEM Fuel-Cell Stack Aging Prediction. IEEE Trans. Ind. Appl. 2016, 52, 2573–2581. [Google Scholar] [CrossRef]
  17. Ogaji, S.O.T.; Singh, R.; Pilidis, P.; Diacakis, M. Modelling fuel cell performance using artificial intelligence. J. Power Sources 2006, 154, 192–197. [Google Scholar] [CrossRef]
  18. Puranik, S.V.; Keyhani, A.; Khorrami, F. Neural Network Modeling of Proton Exchange Membrane Fuel Cell. IEEE Trans. Energy Convers. 2010, 25, 474–483. [Google Scholar] [CrossRef]
  19. Bozorgmehri, S.; Hamedi, M. Modeling and optimization of anode-supported solid oxide fuel cells on cell parameters via artificial neural network and genetic algorithm. Fuel Cells 2012, 1, 11–23. [Google Scholar] [CrossRef]
  20. Milewski, J.; Świrski, K. Modelling the SOFC behaviours by artificial neural network. Int. J. Hydrog. Energy 2009, 34, 5546–5553. [Google Scholar] [CrossRef]
  21. Arriagada, J.; Olausson, P.; Selimovic, A. Artificial neural network simulator for SOFC performance prediction. J. Power Sources 2002, 112, 54–60. [Google Scholar] [CrossRef]
  22. Chettibi, N.; Mellit, A.; Sulligoi, G.; Pavan, A.M. Adaptive Neural Network-Based Control of a Hybrid AC/DC Microgrid. IEEE Trans. Smart Grid 2018, 9, 1667–1679. [Google Scholar] [CrossRef] [Green Version]
  23. Wu, X.J.; Zhu, X.J.; Cao, G.Y.; Tu, H.Y. Nonlinear modeling of a SOFC stack based on ANFIS identification. Simul. Model. Pract. Theory 2008, 16, 399–409. [Google Scholar] [CrossRef]
  24. Sorrentino, M.; Marra, D.; Pianese, C.; Guida, M.; Postiglione, F.; Wang, K.; Pohjoranta, A. On the Use of Neural Networks and Statistical Tools for Nonlinear Modeling and On-field Diagnosis of Solid Oxide Fuel Cell Stacks. Energy Procedia 2014, 45, 298–307. [Google Scholar] [CrossRef] [Green Version]
  25. Wu, X.J.; Zhu, X.J.; Cao, G.Y.; Tu, H.Y. Modeling a SOFC stack based on GA-RBF neural networks identification. J. Power Sources 2007, 167, 145–150. [Google Scholar] [CrossRef]
  26. Jaeger, H. Tutorial on Training Recurrent Neural Networks, Covering BPPT, RTRL, EKF and the Echo State Network Approach; Technical Report; Fraunhofer Institute for Autonomous Intelligent Systems (AIS), Since 2003: International University Bremen, Bremen, Germany, 2005; pp. 10–18. [Google Scholar]
  27. Moghaddamnia, A.; Remesan, R.; Kashani, M.H.; Mohammadi, M.; Han, D.; Piri, J. Comparison of LLR, MLP, Elman, NNARX and ANFIS Models—With a case study in solar radiation estimation. J. Atmos. Sol.-Terr. Phys. 2017, 71, 975–982. [Google Scholar] [CrossRef]
  28. Montgomery, D.C. Design and Analysis of Experiments, 8th ed.; Wiley: New York, NY, USA, 2012. [Google Scholar]
  29. Phillip, J.R. Taguchi Techniques for Quality Engineering, 2nd ed.; McGraw-Hill: New York, NY, USA, 2017. [Google Scholar]
  30. Roy, A.R.K. Design of Experiments Using the Taguchi Approach: 16 Steps to Product and Process Improvement; Wiley: New York, NY, USA, 2001. [Google Scholar]
  31. Lee, D.; Lin, J.K.; Tsai, C.H.; Wu, S.H.; Cheng, Y.N.; Lee, R.Y. Analysis of long-term and thermal cycling tests for a commercial solid oxide fuel cell. J. Electron. Energy Convers. Storage 2017, 14, 0411021–0411028. [Google Scholar] [CrossRef]
  32. Ljung, L. System Identification: Theory for User; Prentice–Hall: Upper Saddle River, NJ, USA, 1999. [Google Scholar]
  33. Hagan, M.T.; Menhaj, M.B. Training feedforward networks with the Marquardt algorithm. IEEE Trans. Neural Netw. 1994, 5, 989–993. [Google Scholar] [CrossRef]
  34. Söderström, T.; Stoica, P. System Identification; Prentice Hall International: London, UK, 1898. [Google Scholar]
  35. Mechaqrane, A.; Zouak, M. A comparison of linear and neural network ARX models applied to a prediction of the indoor temperature of a building. Neural Comput. Appl. 2004, 13, 32–37. [Google Scholar]
  36. Kashani, M.N.; Shahhosseini, S. A methodology for modeling batch reactors using generalized dynamic neural networks. Chem. Eng. J. 2010, 159, 195–202. [Google Scholar] [CrossRef]
  37. Lyu, J.; Zhang, J. BP neural network prediction model for suicide attempt among Chinese rural residents. J. Affect. Disord. 2019, 246, 465–473. [Google Scholar] [CrossRef]
  38. Norgaard, M.; Ravn, O.; Poulsen, N.K.; Hansen, L.K. Neural Networks for Modelling and Control of Dynamic Systems; Springer: London, UK, 2003. [Google Scholar]
  39. Beal, M.H.; Hagan, M.T.; Demuth, H.B. Neural Network Toolbox User’s Guide; The Mathworks Inc.: Natick, MA, USA, 2016. [Google Scholar]
Figure 1. Schematic diagram of the solid oxide fuel cell (SOFC) experimental platform [31].
Processes 08 00828 g001
Figure 2. The voltage data of SOFC for training and validation phase.
Processes 08 00828 g002
Figure 3. The basic neural network auto regressive with exogenous inputs (NNARX).
Processes 08 00828 g003
Figure 4. NNARX structure of SOFC.
Processes 08 00828 g004
Figure 5. Performance index (PI) values of Taguchi orthogonal array (OA) matrix in training and validation phase.
Processes 08 00828 g005
Figure 6. Responses graph of design factor effects for S/N ratios.
Processes 08 00828 g006
Figure 7. Performance index (PI) index values comparison of OA5 and optimal set.
Processes 08 00828 g007
Figure 8. Prediction errors comparison between OA5 and Optimal test models. (a) root mean square error (RMSE) (b) mean absolute error (MAE) (c) mean absolute percentage error (MAPE) (d) R2.
Processes 08 00828 g008
Figure 9. Multi-step prediction output of the optimal test model.
Processes 08 00828 g009
Figure 10. Regression analysis of optimal test multi-step prediction.
Processes 08 00828 g010
Table 1. Factors and levels of NNARX model structure parameter.
SymbolFactorsLevel-1Level-2Level-3
AHidden neural (hn)51015
BOutput order (na)135
CInput order (nb)135
DTime delay (nk)135
Table 2. Results of S/N ratios of normalized sum square error (NSSE) for training and validation.
Exp. NumberABCDNSSE TrainingNSSE ValidationPISN
111114.53 × 10 9 4.64 × 10 9 9.16 × 10 9 166.782
212223.91 × 10 9 4.22 × 10 9 8.13 × 10 9 167.838
313333.85 × 10 9 4.16 × 10 9 8.02 × 10 9 167.962
421234.51 × 10 9 4.69 × 10 9 9.20 × 10 9 166.749
522313.77 × 10 9 4.12 × 10 9 7.89 × 10 9 168.099
623123.85 × 10 9 4.18 × 10 9 8.03 × 10 9 167.943
731324.46 × 10 9 4.81 × 10 9 9.26 × 10 9 166.703
832133.98 × 10 9 4.19 × 10 9 8.17 × 10 9 167.787
933213.73 × 10 9 4.22 × 10 9 7.95 × 10 9 168.06
Table 3. Response table of design factors for S/N ratios.
LevelA(hn)B(na)C(nb)D(nc)
Level-1167.527167.745167.504167.647
Level-2167.597167.908167.549167.495
Level-3167.517167.988167.588167.500
Effect0.0800.0841.243300.1525
Rank4132
Table 4. Results of ANOVA for S/N ratios.
FactorDegrees of FreedomSun of SquareMean SquareContributionp-Value
A(hn)(2)0.0013---
B(na)22.80581.402997.60%5.353 × 10 5
C(nb)(2)0.0075---
D(nc)20.03770.01880.95%1.30 × 10 1
Error40.02070.00520.41%
Total82.86416 100%
Table 5. Comparison results between OA5 and optimal test for multi-step prediction.
k-Step PredictionPerformance CriteriaOA5 (A2B2C3D1)Optimal Test (A2B3C3D1)
One-step aheadRMSE9.08 × 10 5 8.96 × 10 5
MAE6.673 × 10 5 6.57 × 10 5
MAPE (100%)2.352 × 10 1 2.297 × 10 1
R20.99110.9914
Two-step aheadRMSE1.01 × 10 4 9.87 × 10 5
MAE7.437 × 10 5 7.22 × 10 5
MAPE (100%)2.648 × 10 1 2.599 × 10 1
R20.98780.9883
Three-step aheadRMSE1.10 × 10 4 1.06 × 10 4
MAE8.108 × 10 5 7.75 × 10 5
MAPE (100%)2.884 × 10 1 2.813 × 10 1
R20.98540.9866
Four-step aheadRMSE1.21 × 10 4 1.13 × 10 4
MAE8.871 × 10 5 8.30 × 10 5
MAPE (100%)2.922 × 10 1 2.848 × 10 1
R20.98240.9847

