Numerical Study on the Influence of Step Casing on Cavitating Flows and Instabilities in Inducers with Equal and Varying Pitches


Abstract
1. Introduction
2. Numerical Studies
2.1. Numerical Methods
2.2. The Inducers and Step Casing Design
3. Results
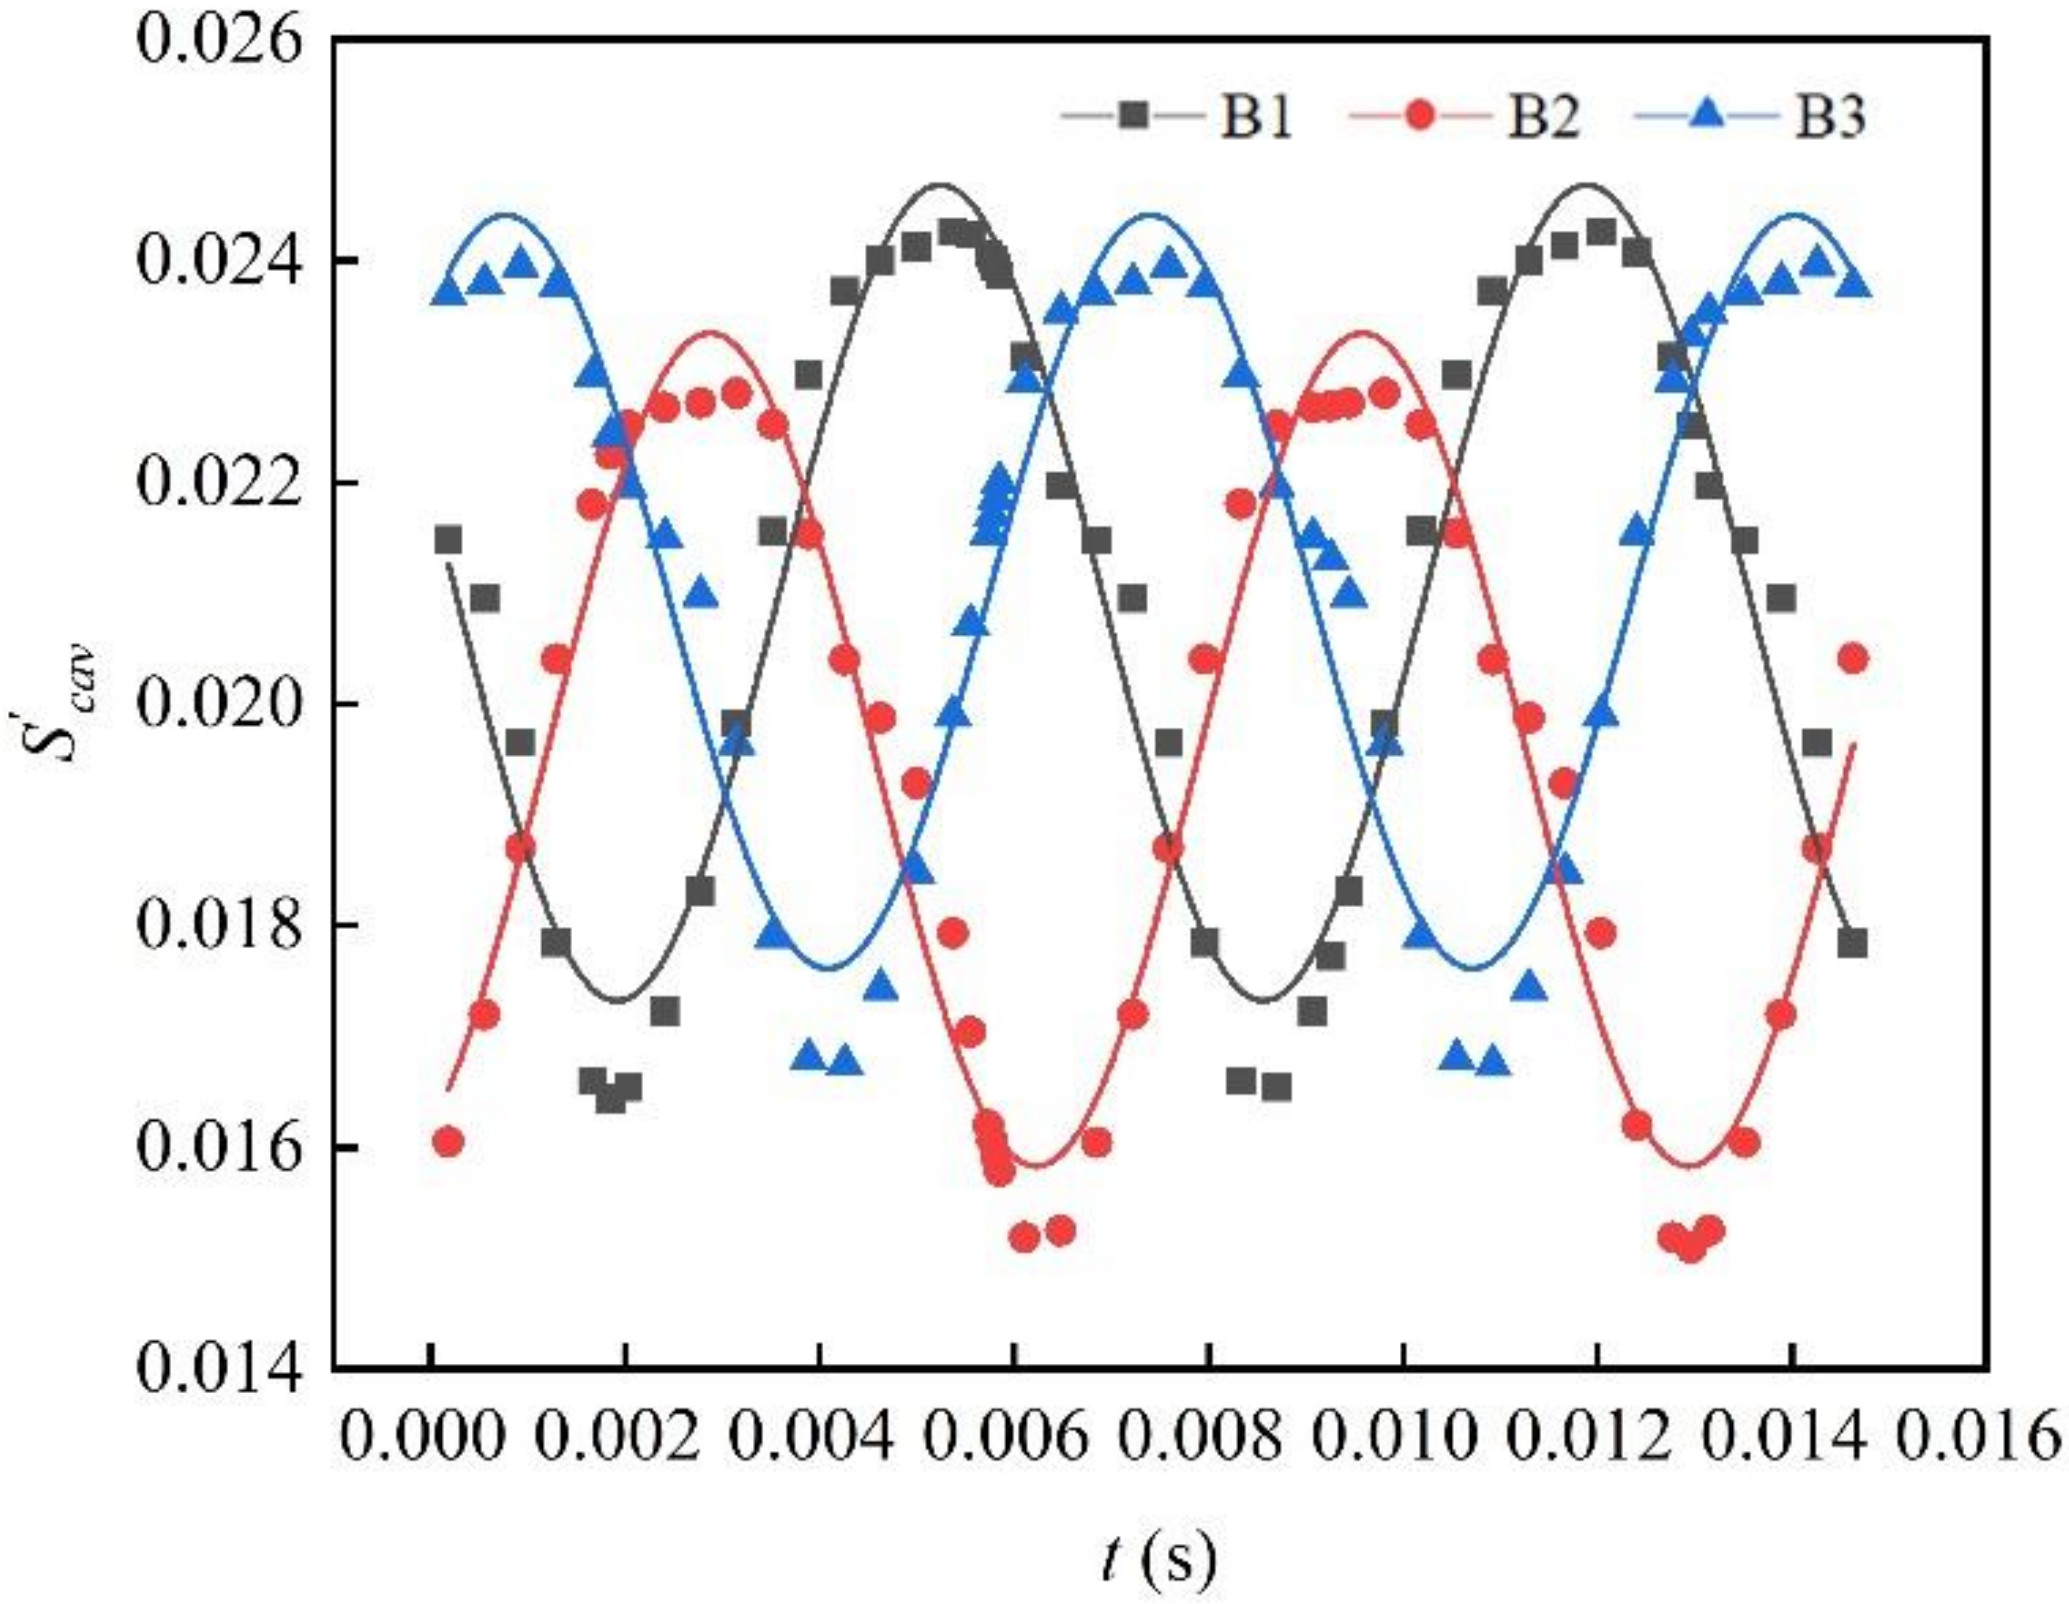
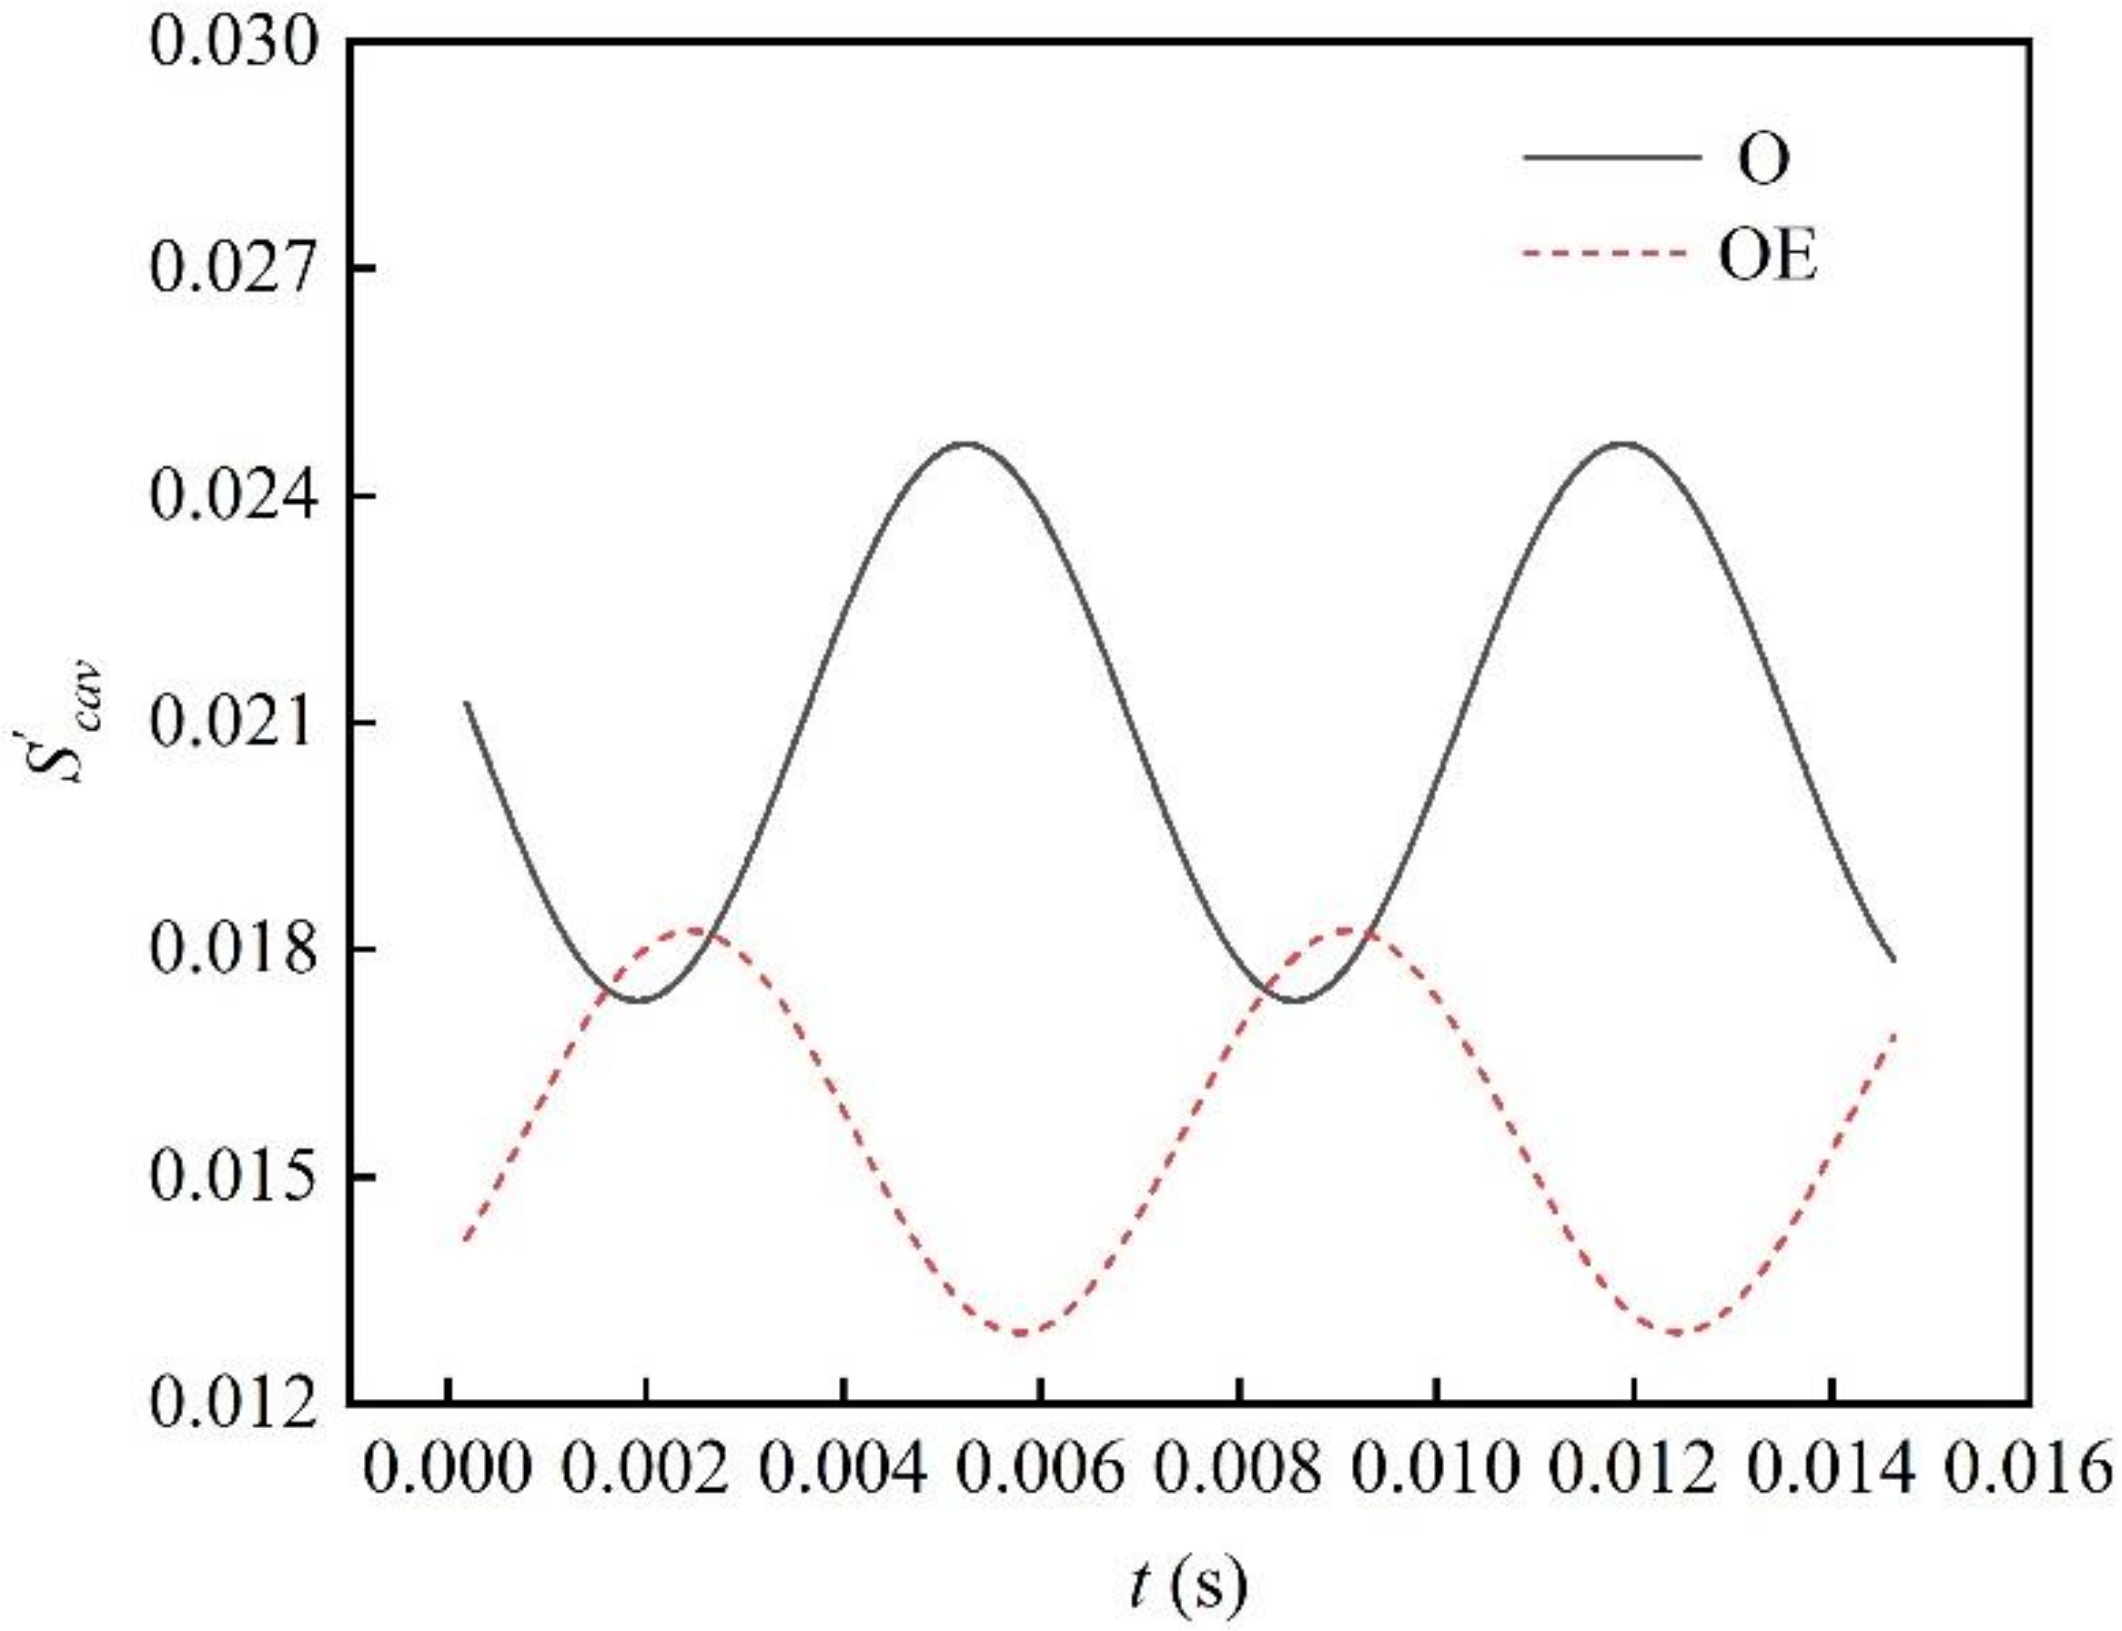
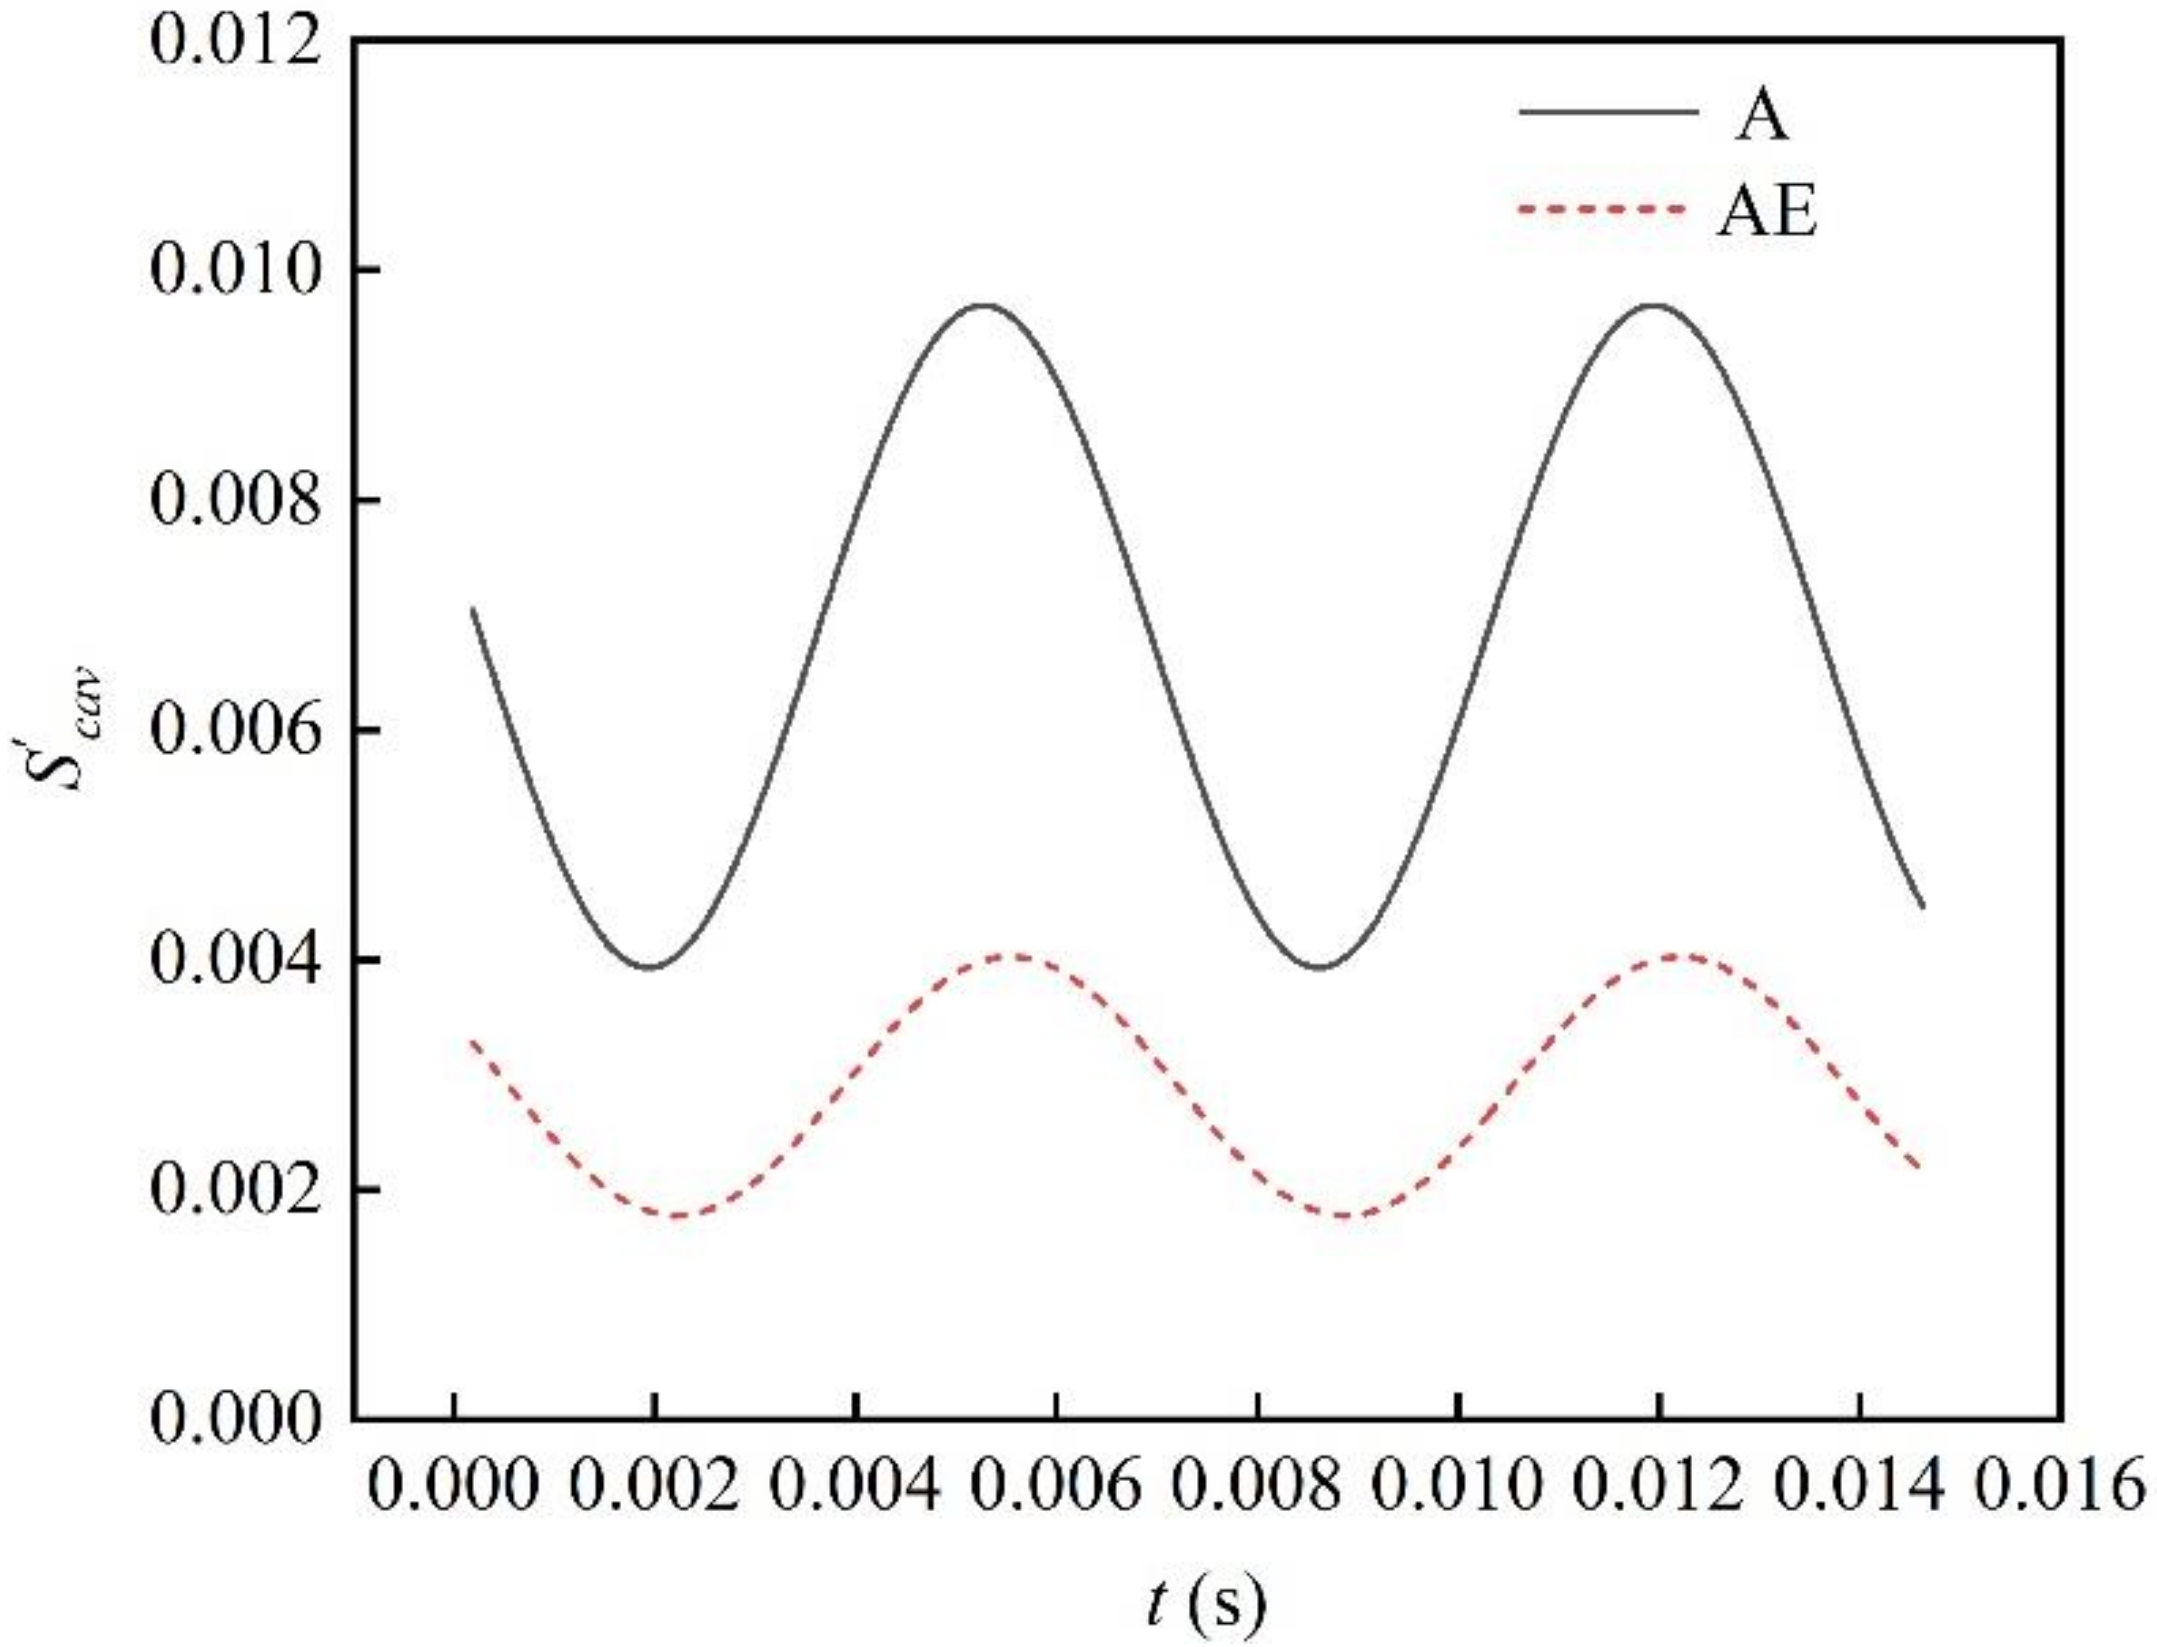
3.1. Characteristics of Cavity Oscillation on the Blades
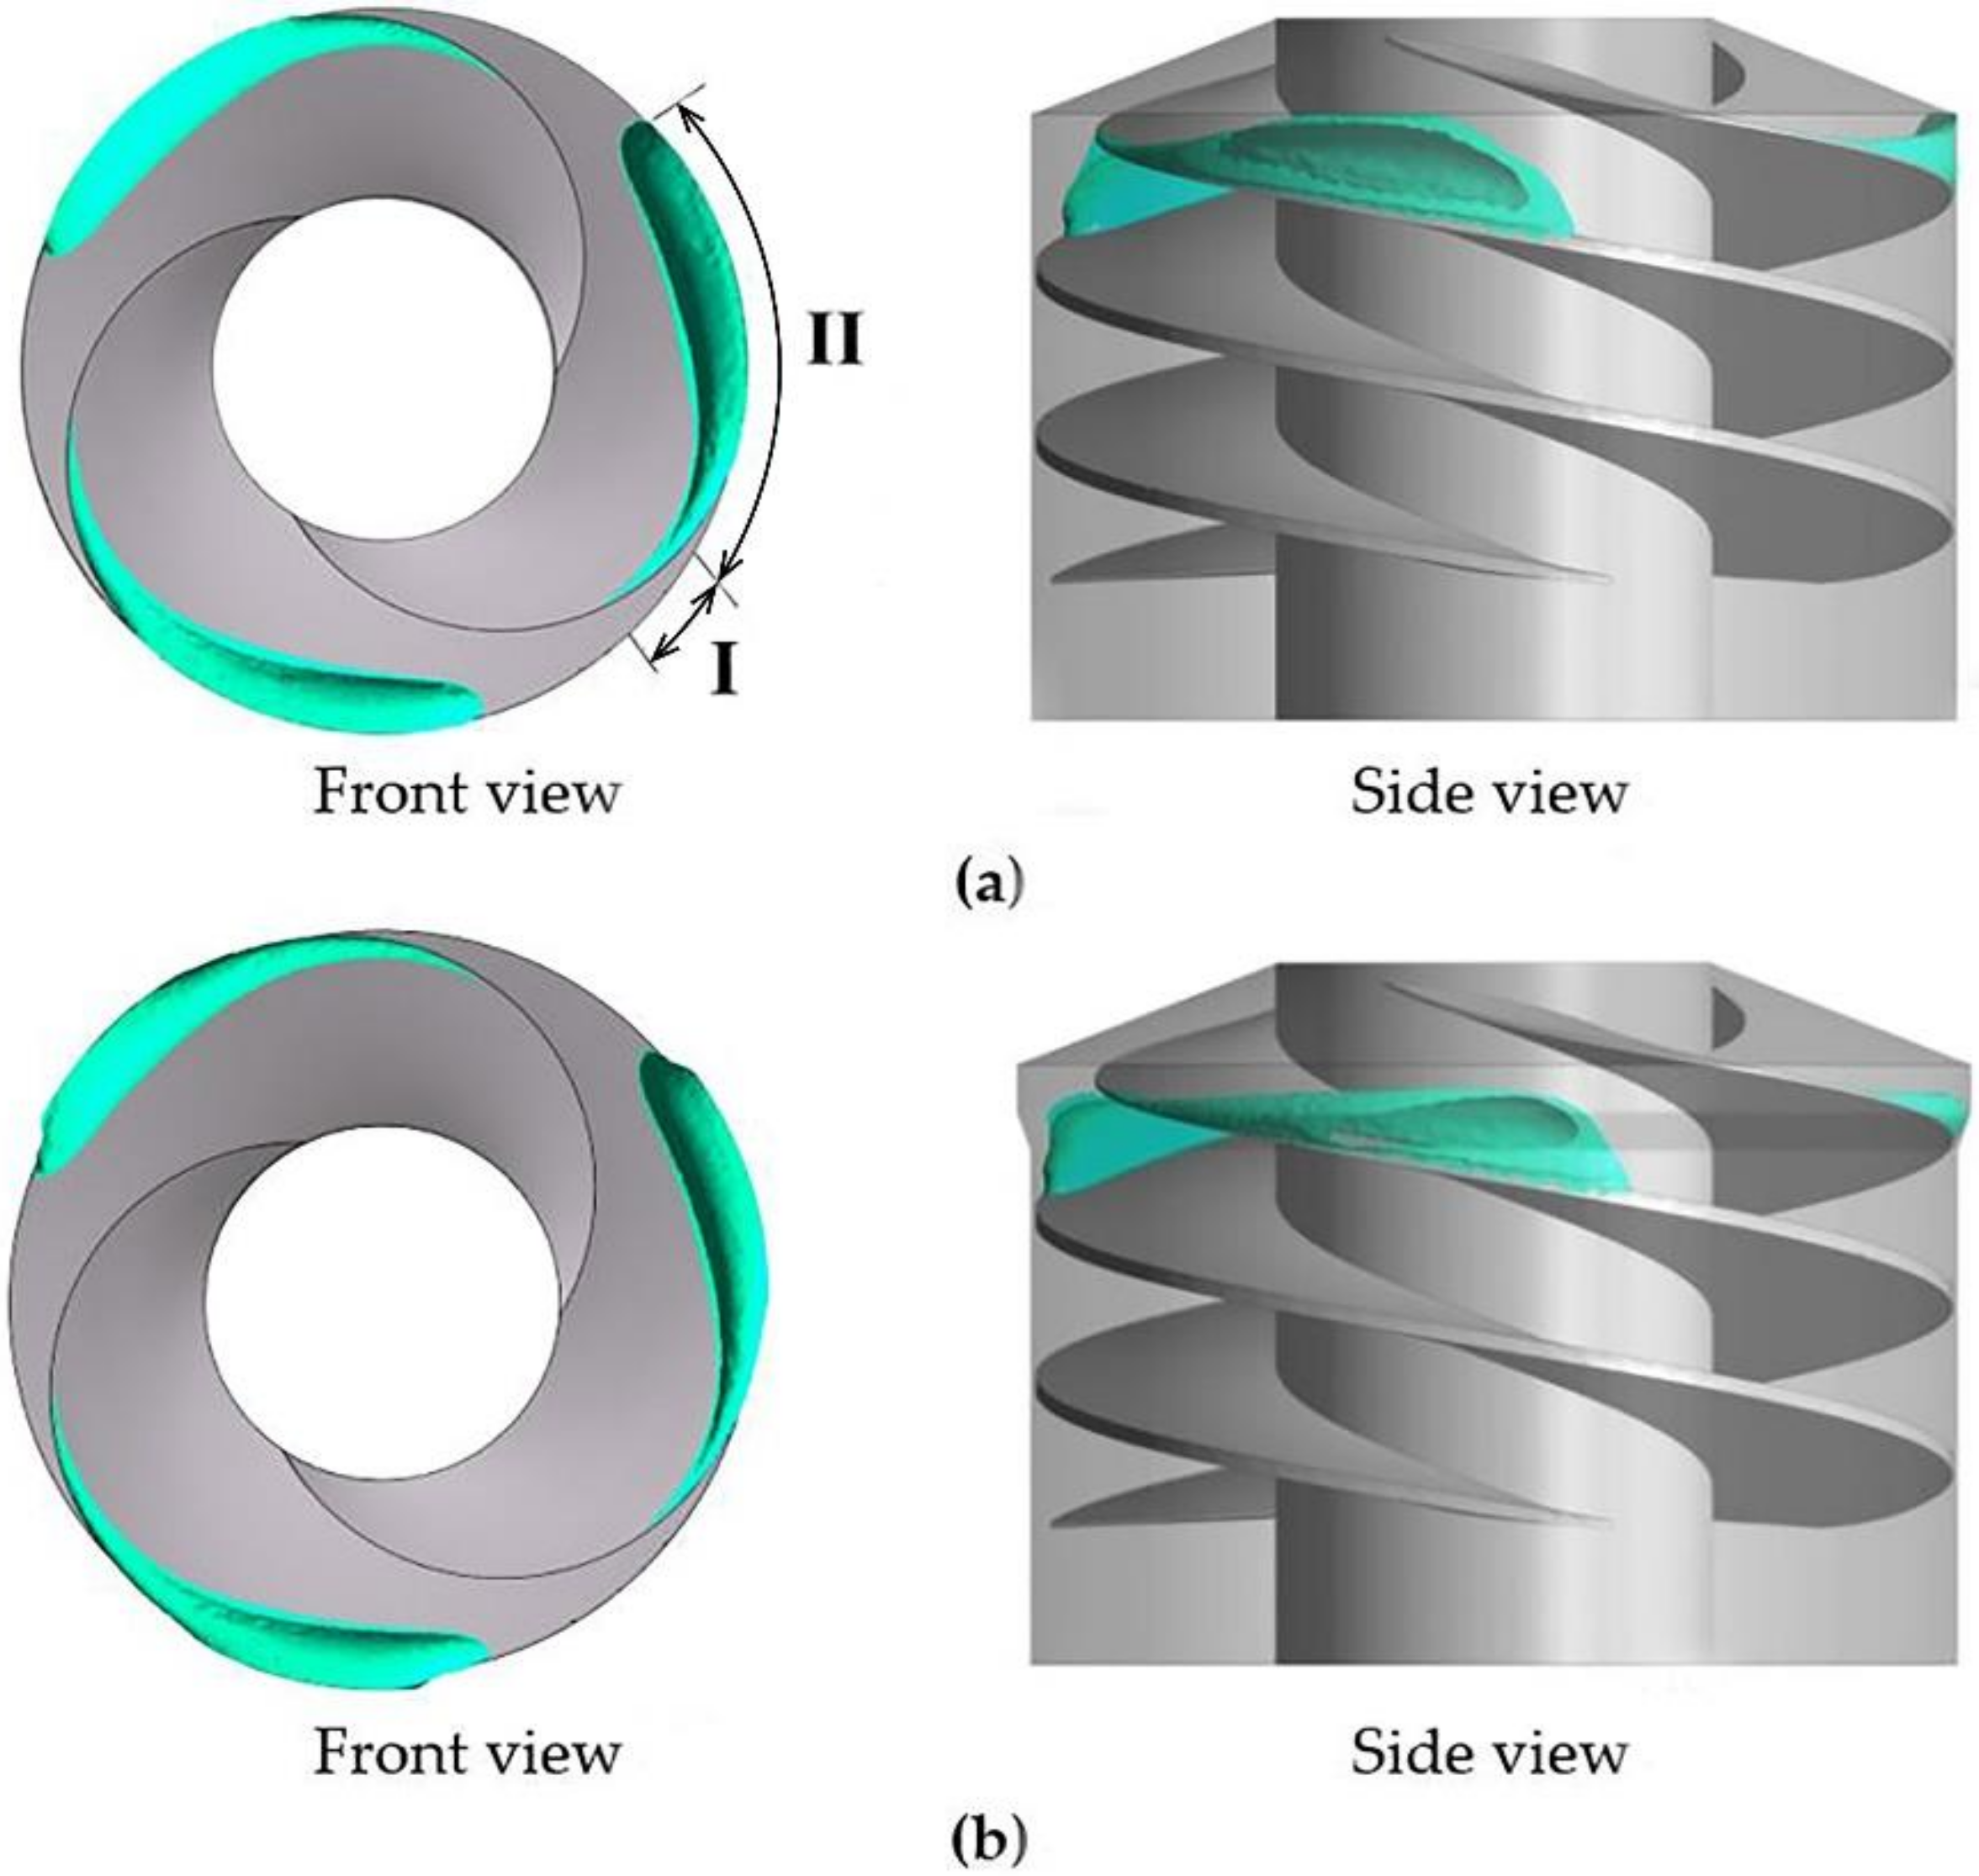
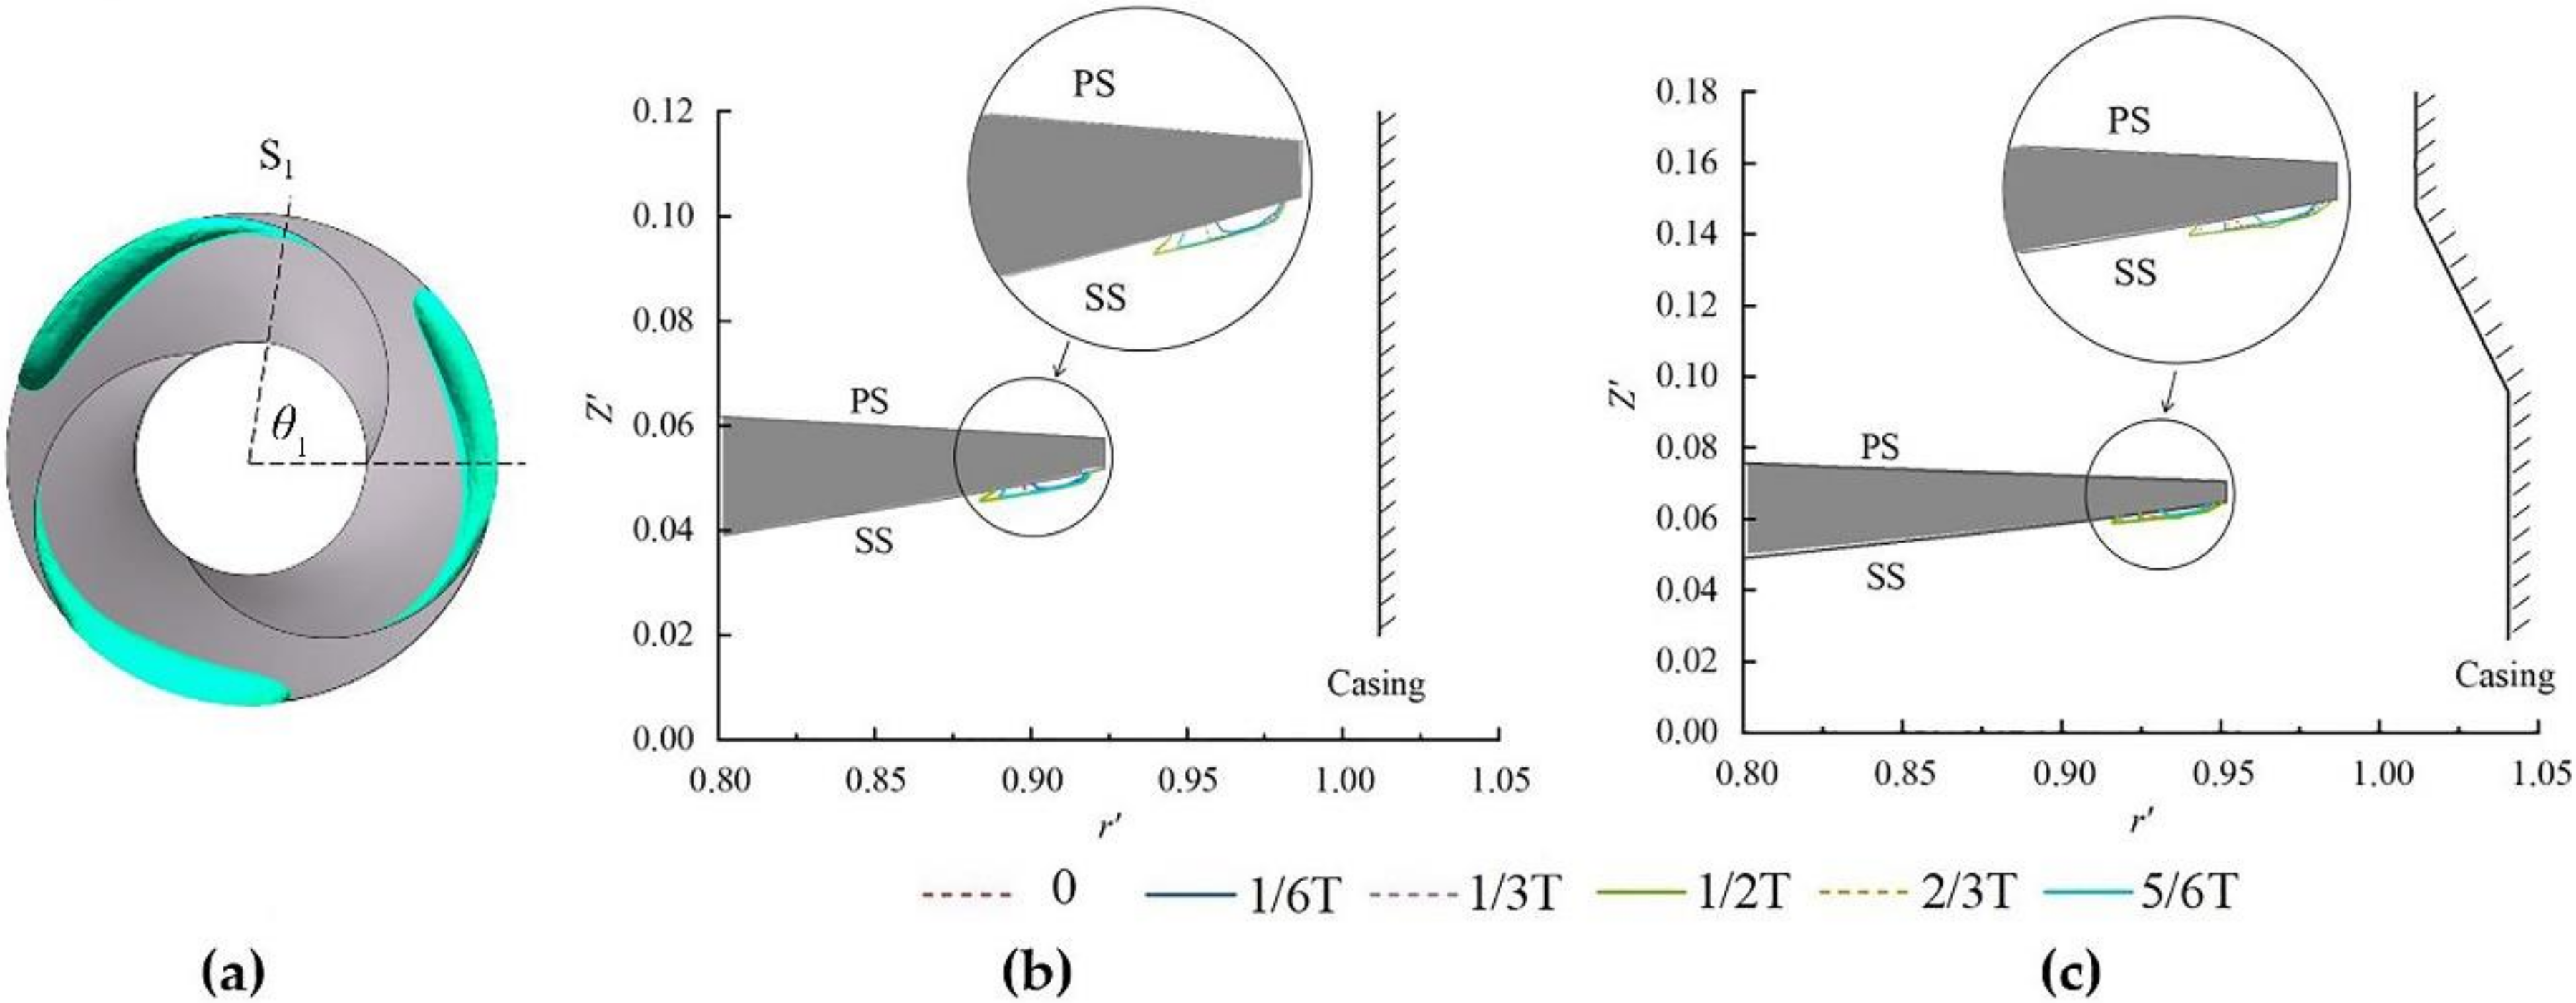
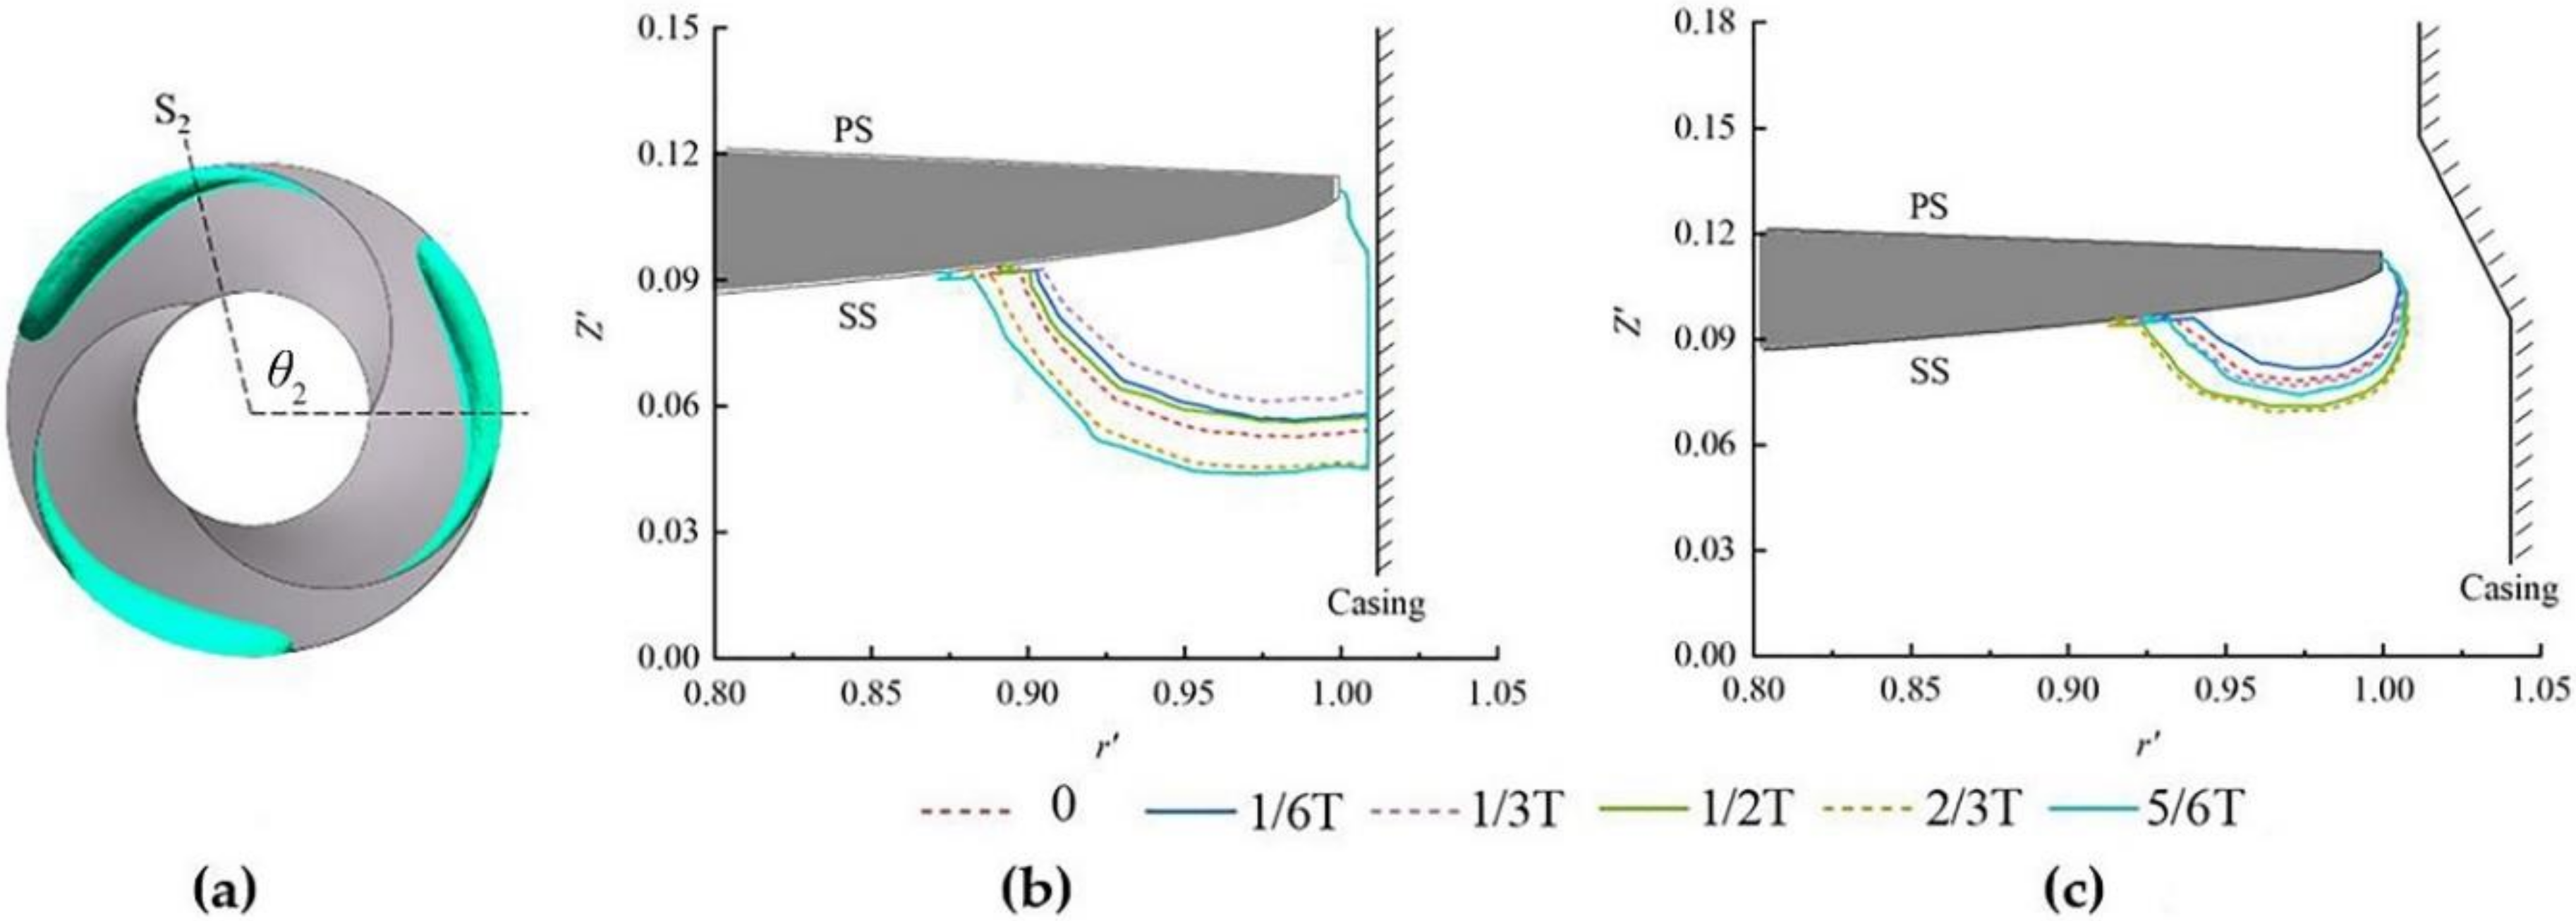
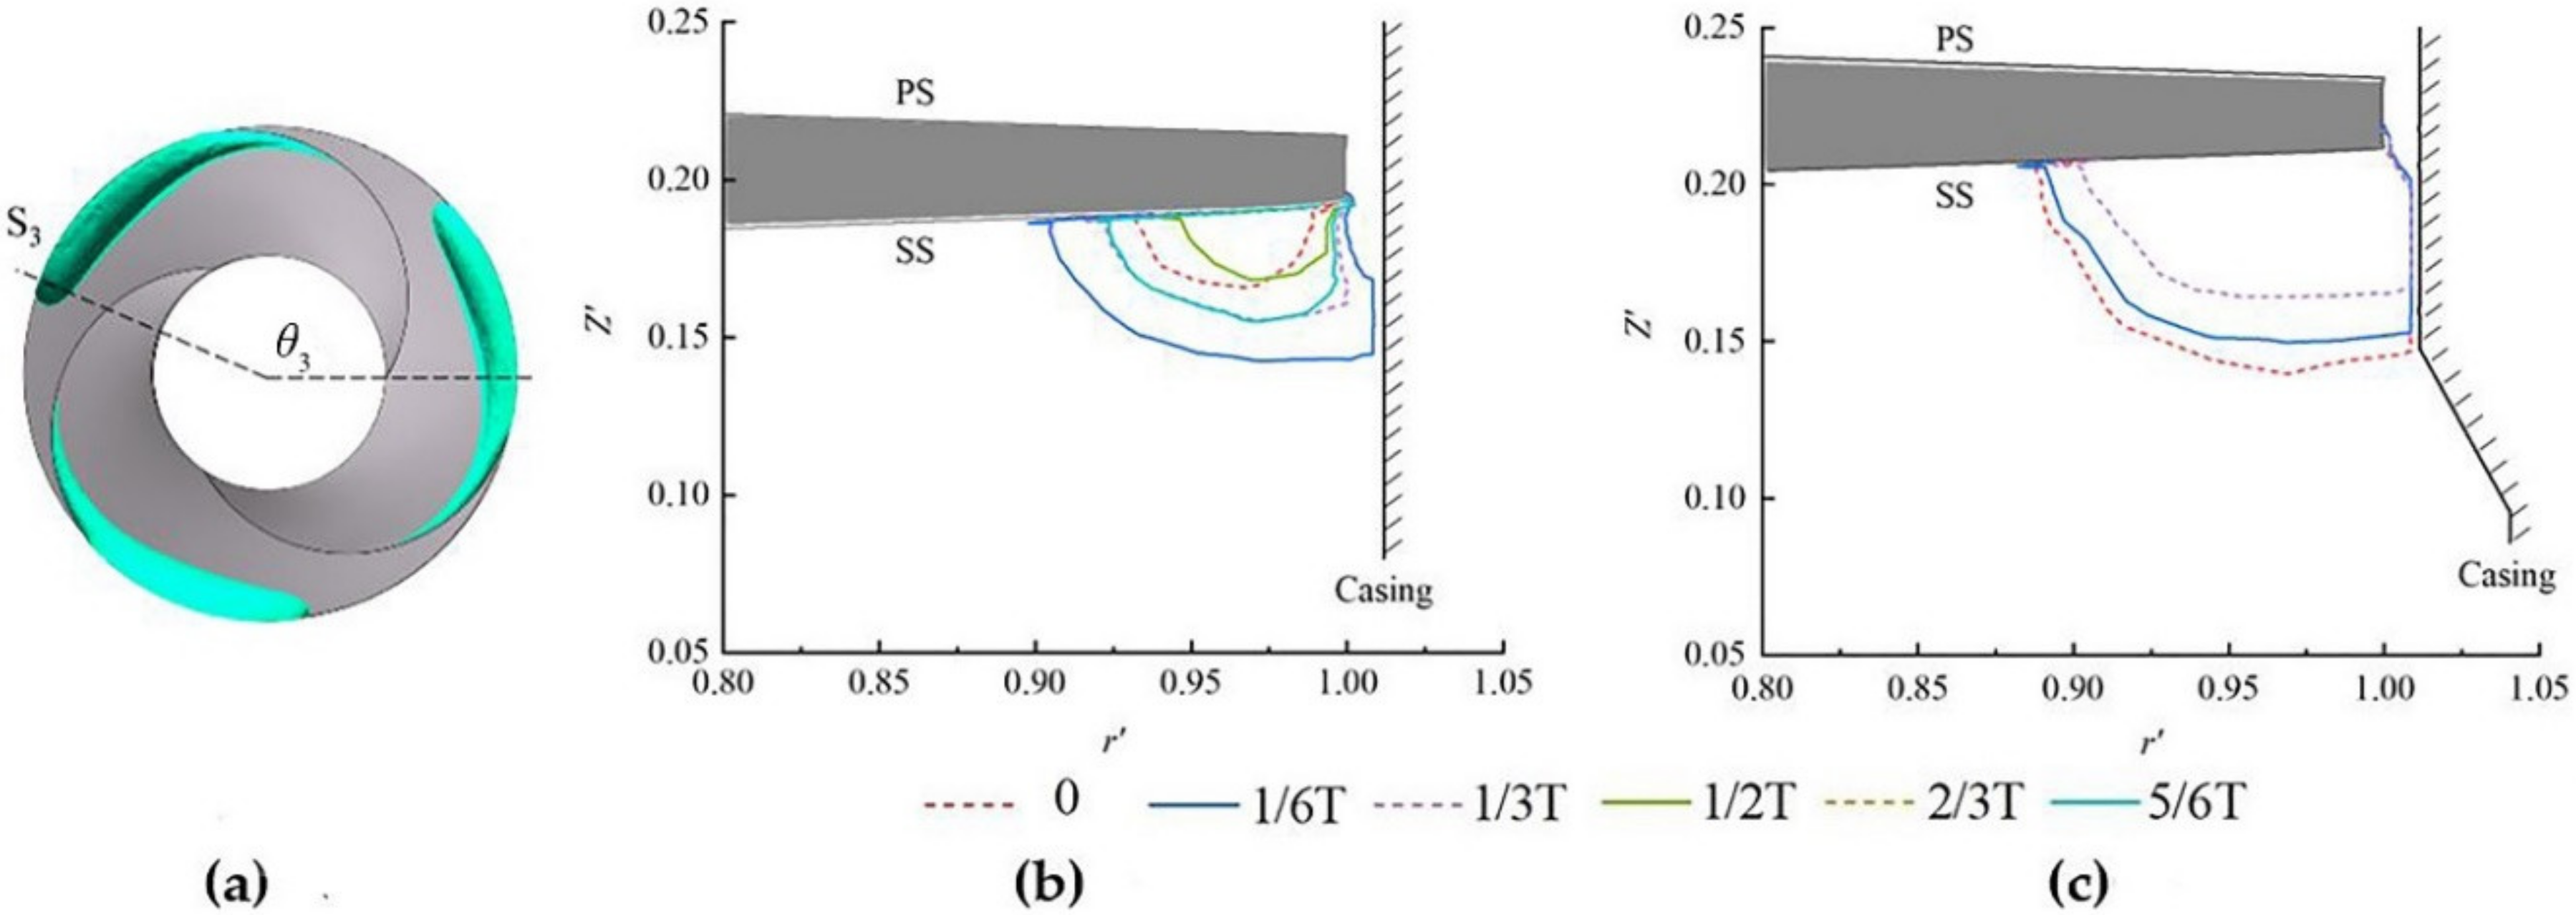
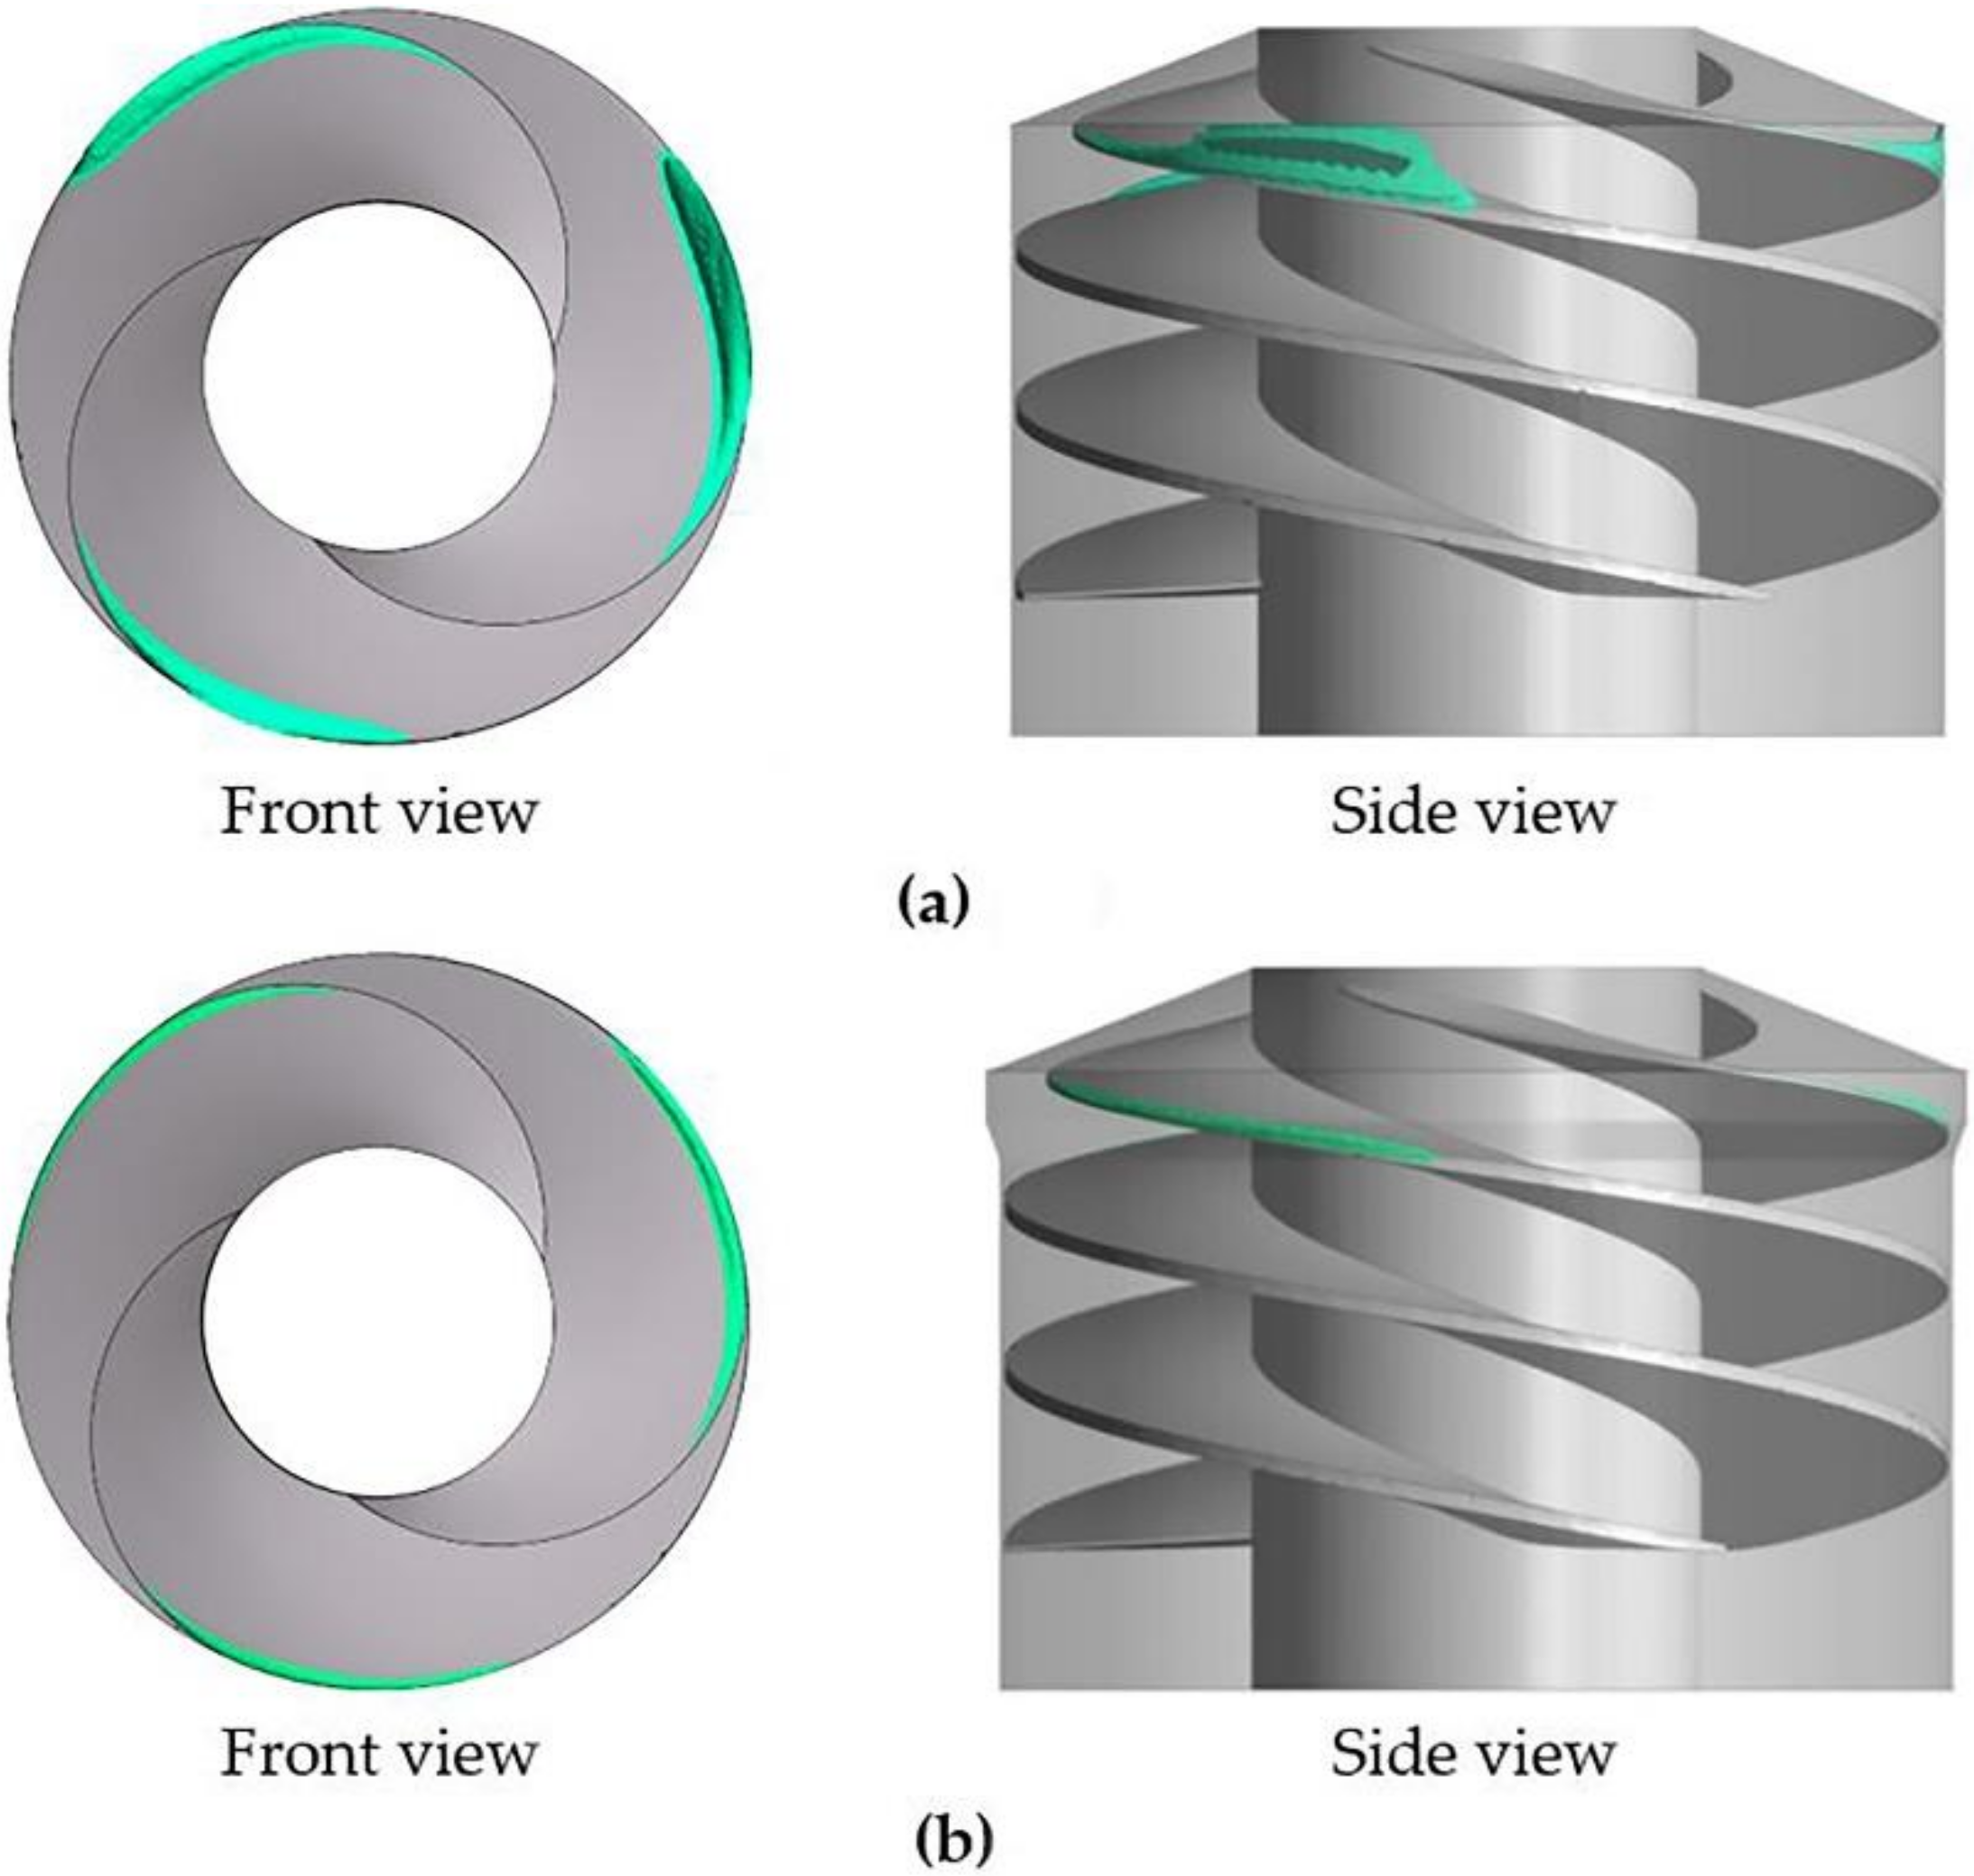
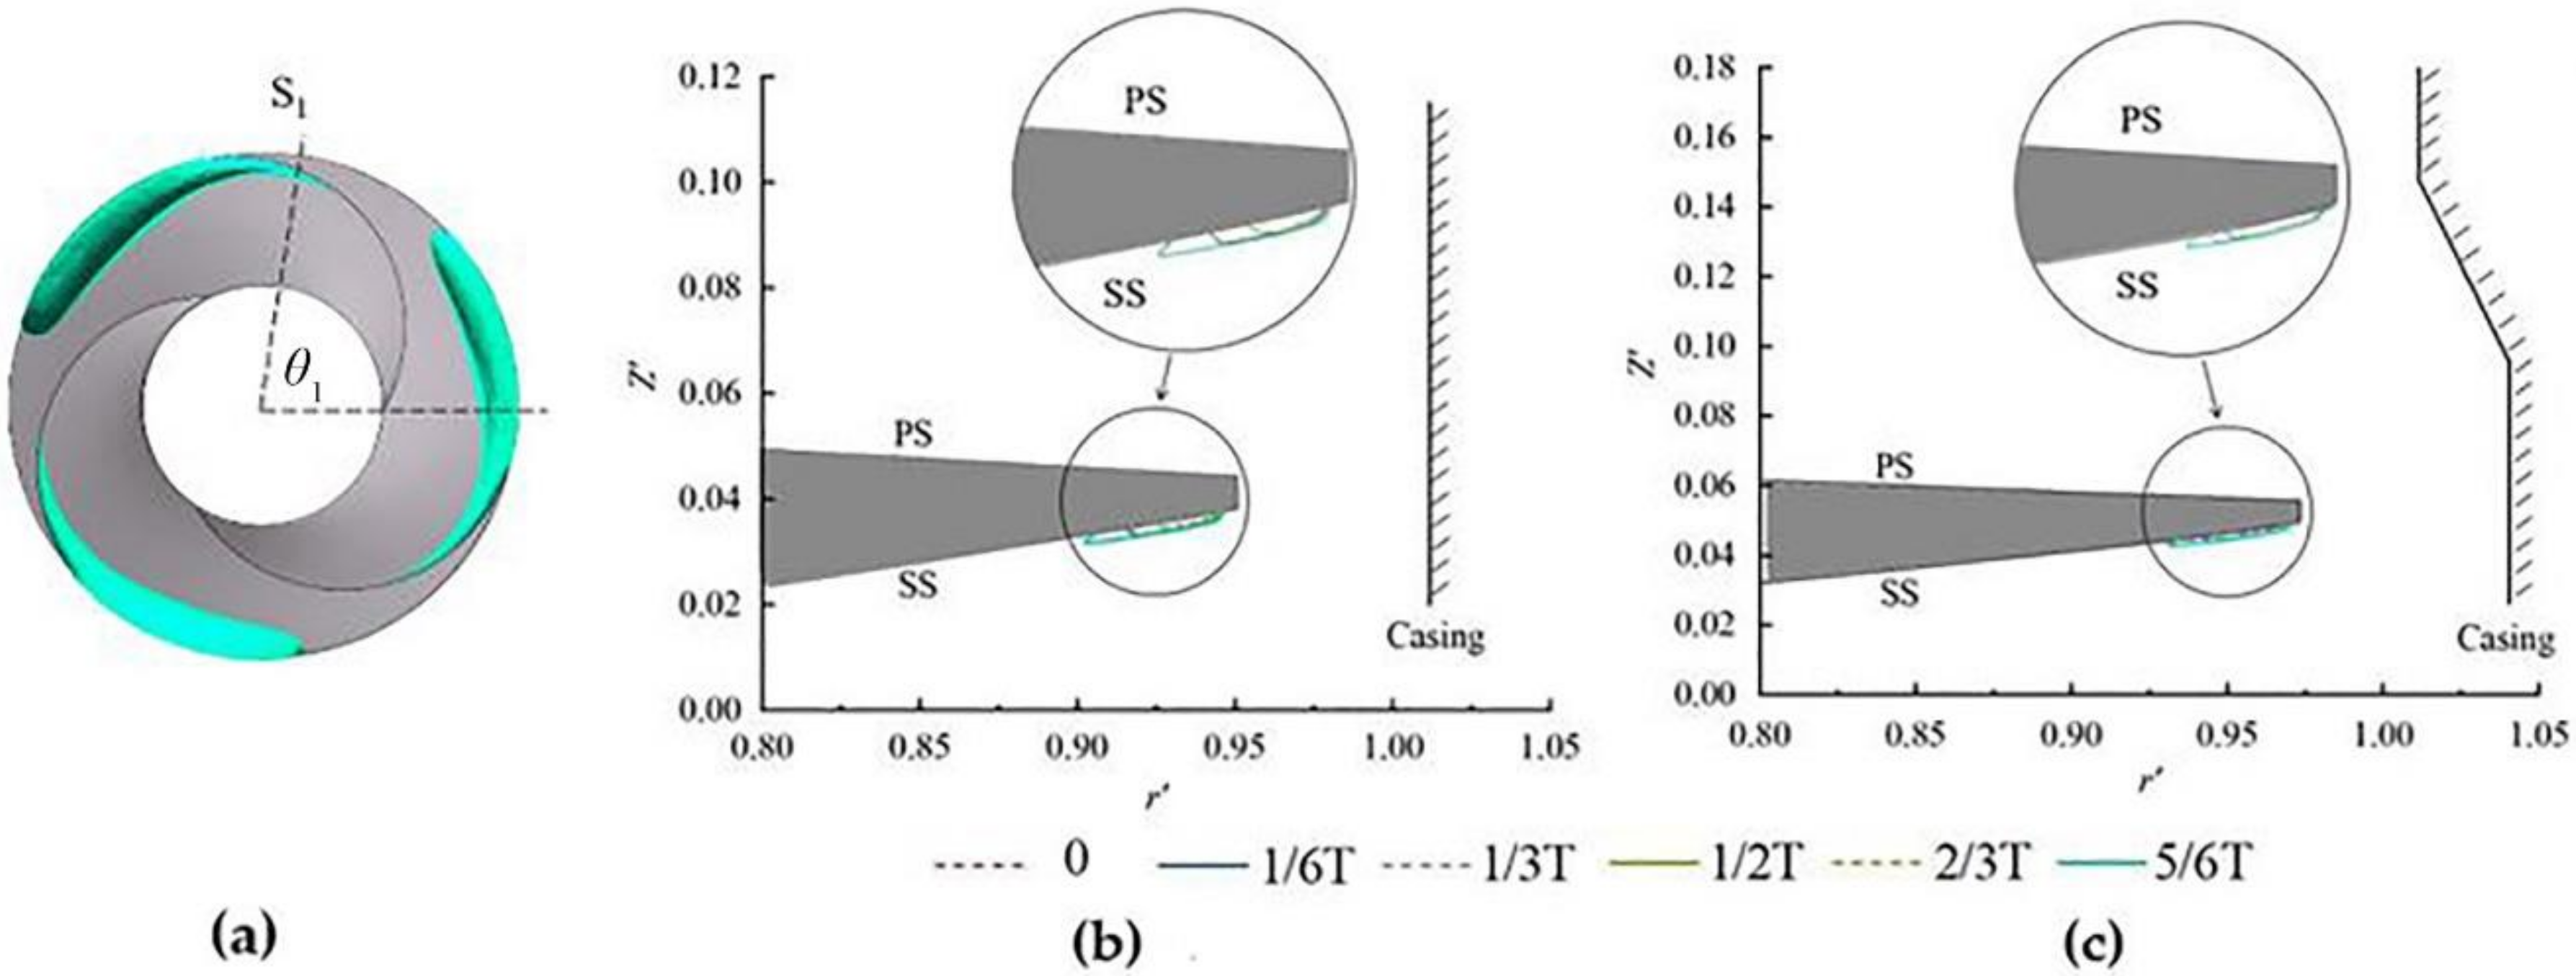
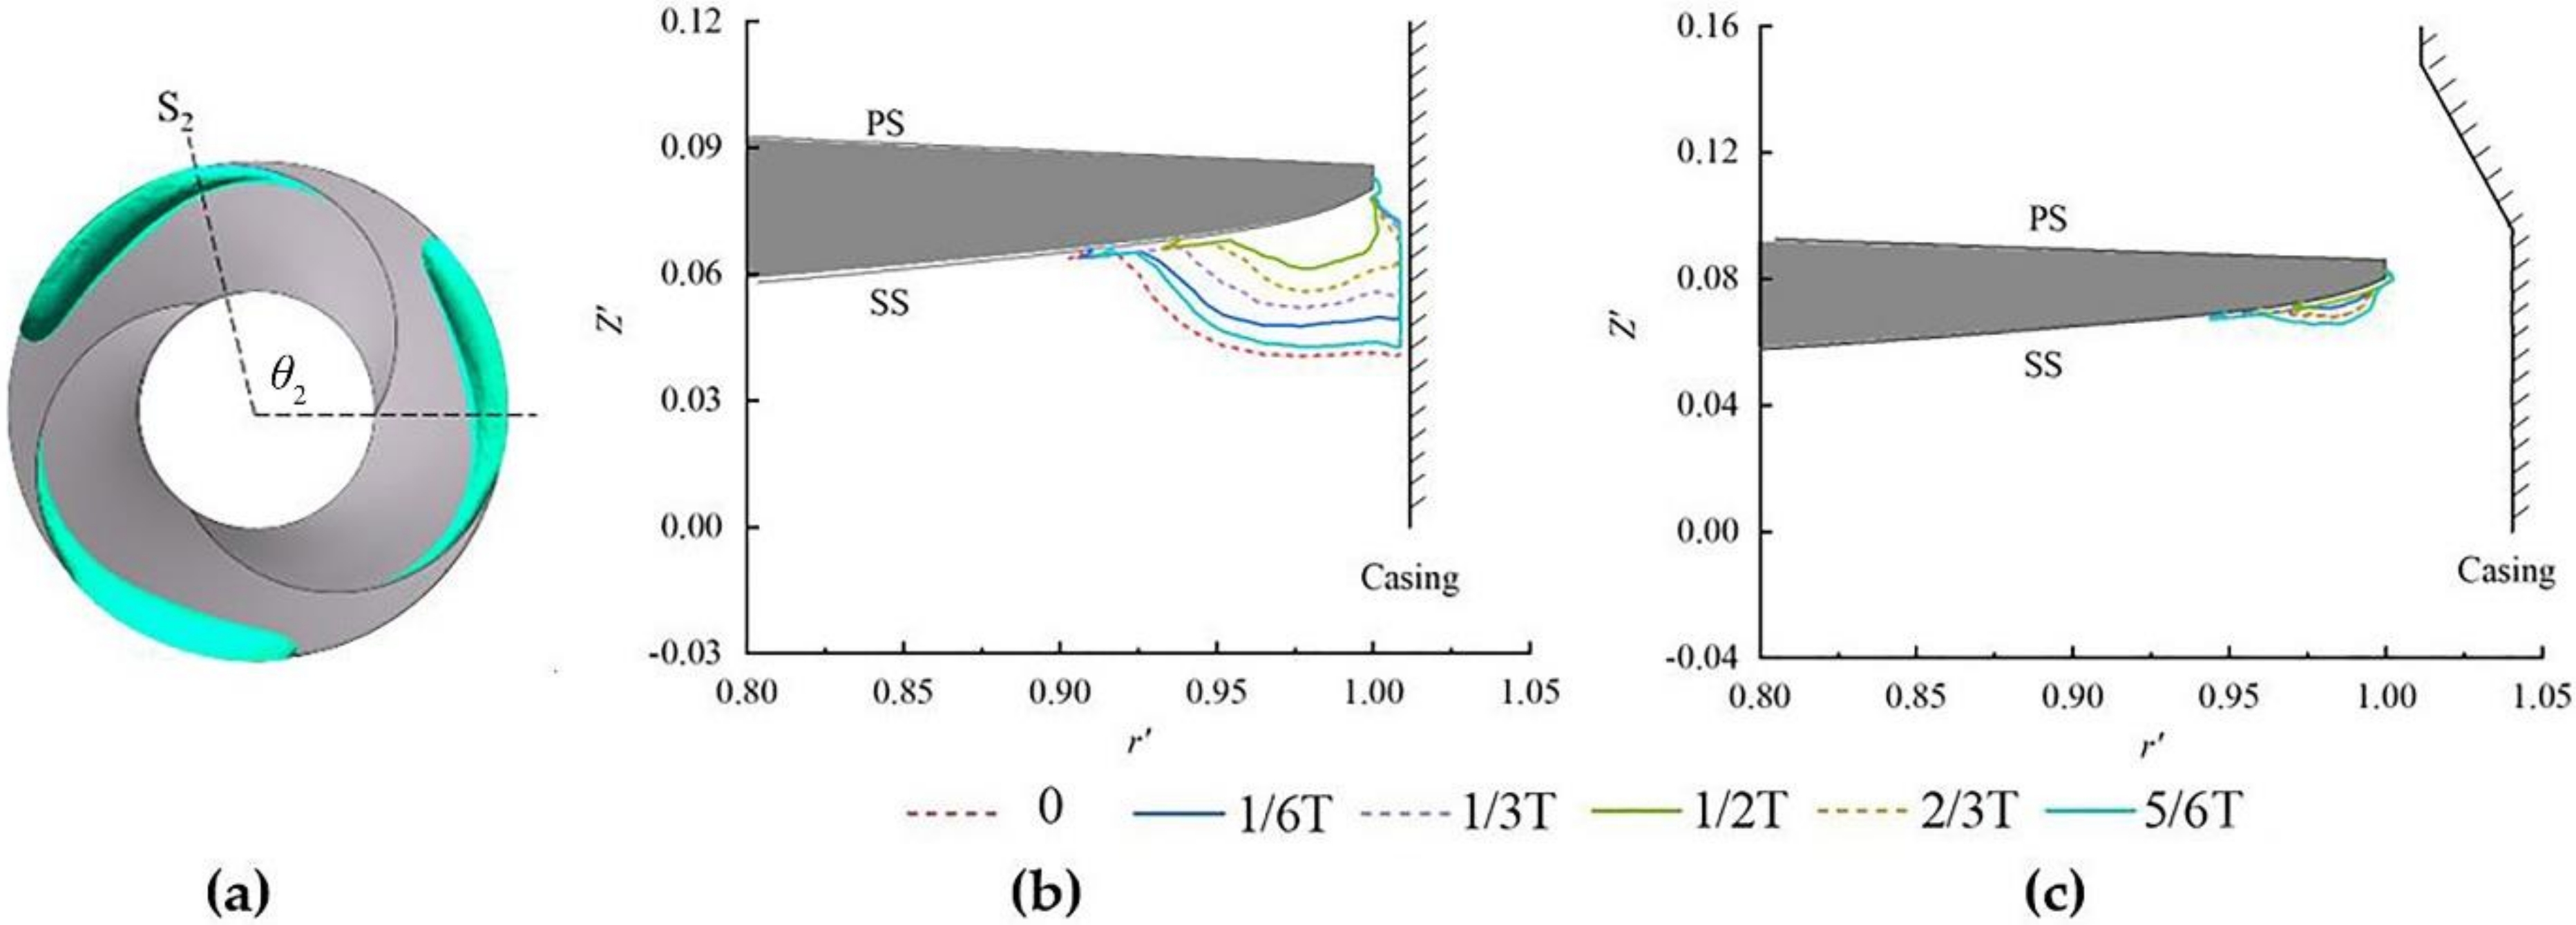
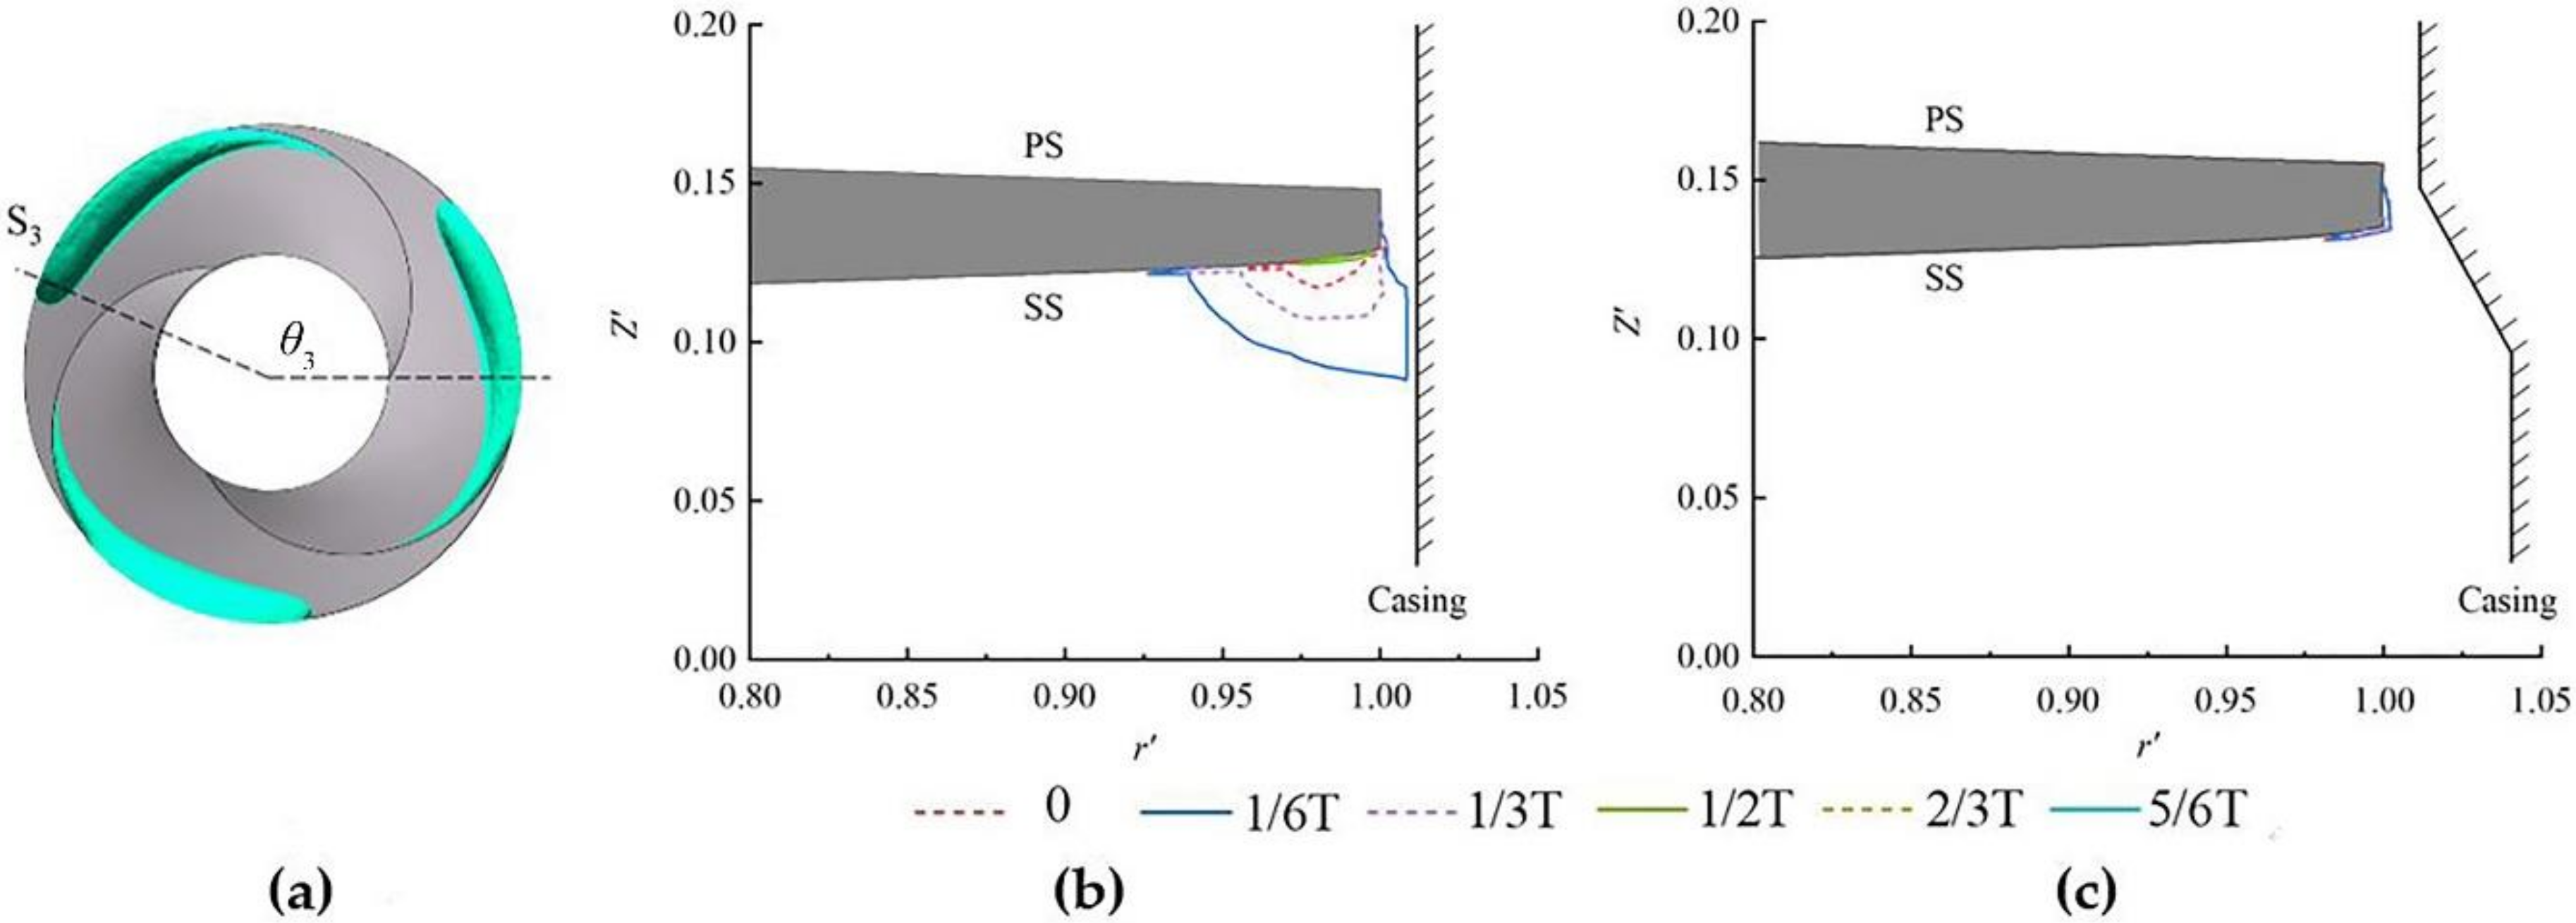
3.2. Characteristics of Three-Dimensional Cavity Structures
3.2.1. The Results of Cases with the Equal Pitch Inducer
3.2.2. The Results of Cases with the Varying Pitch Inducer
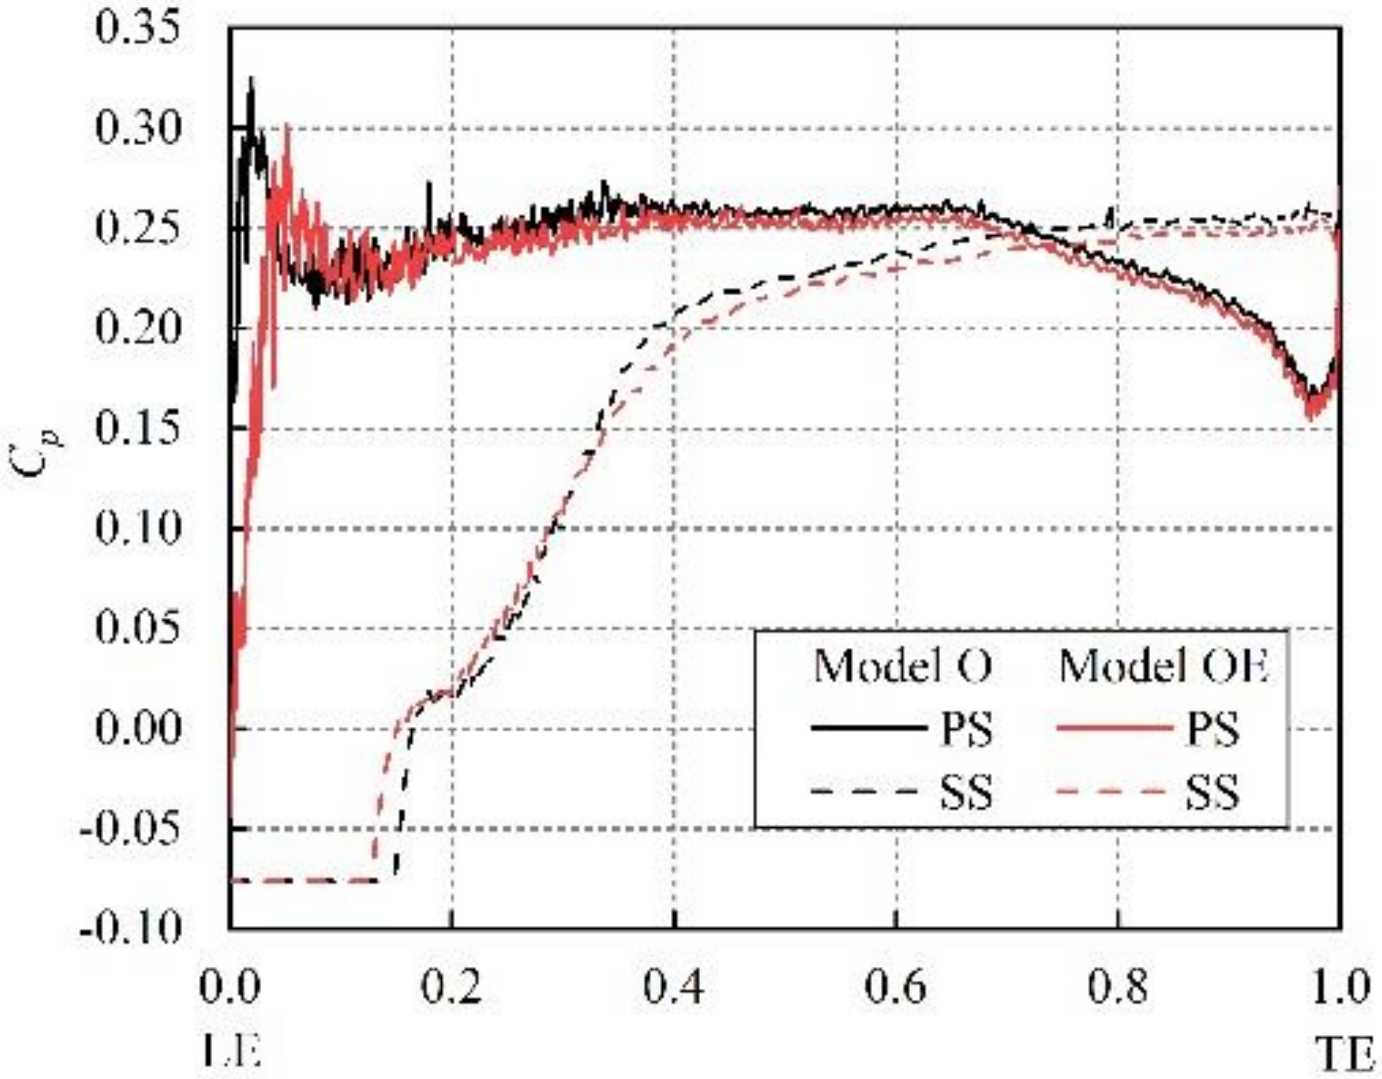
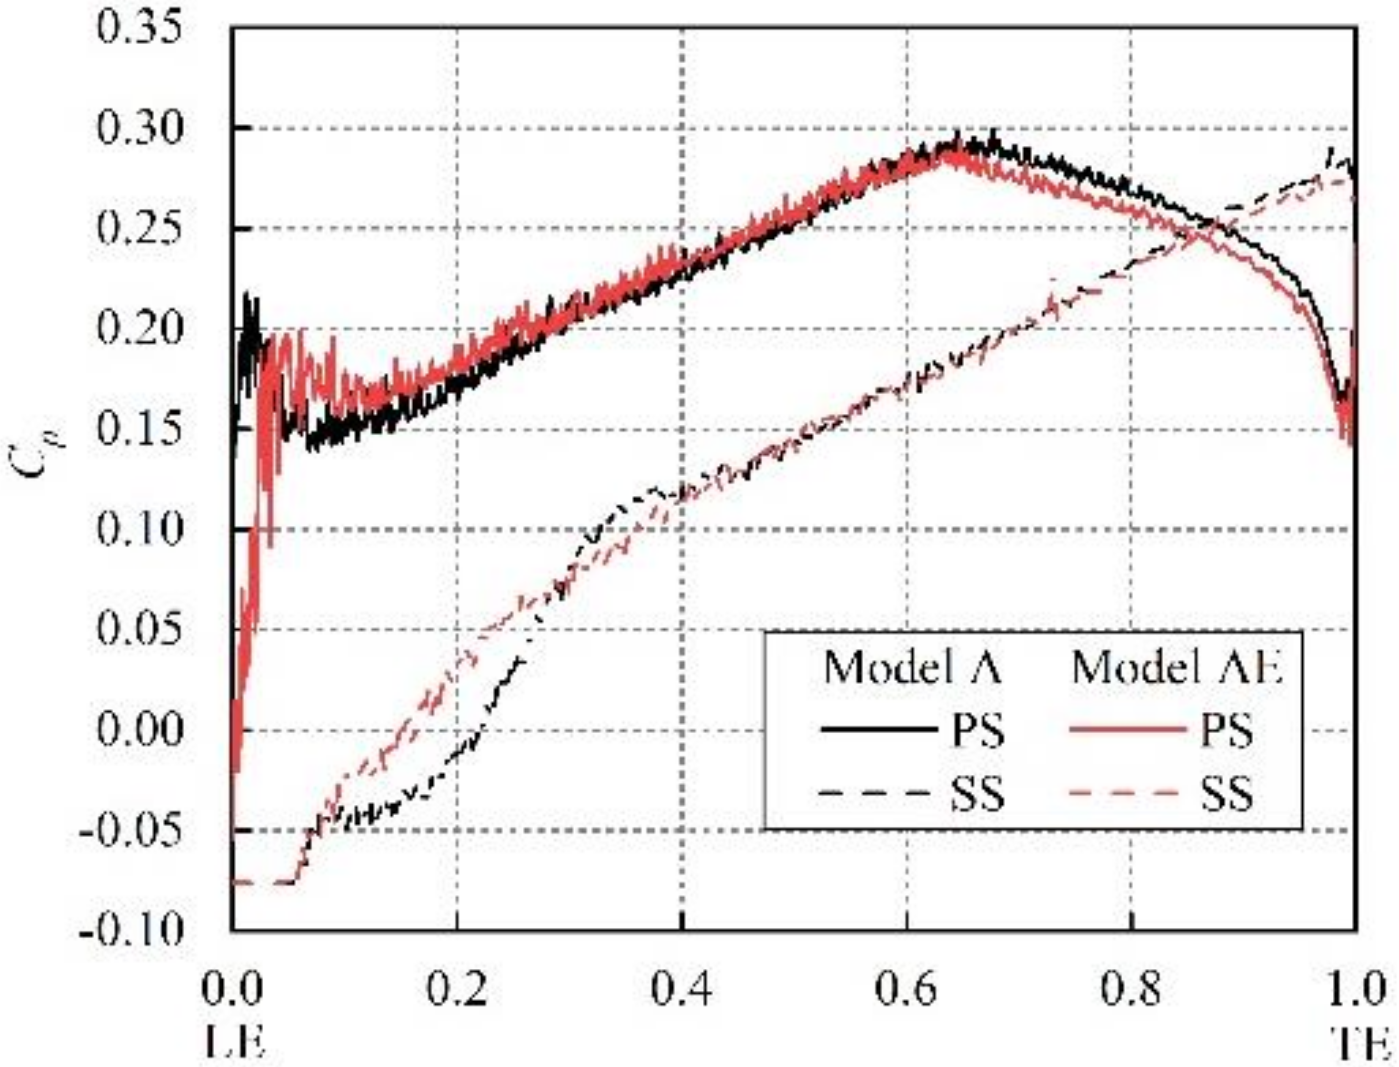
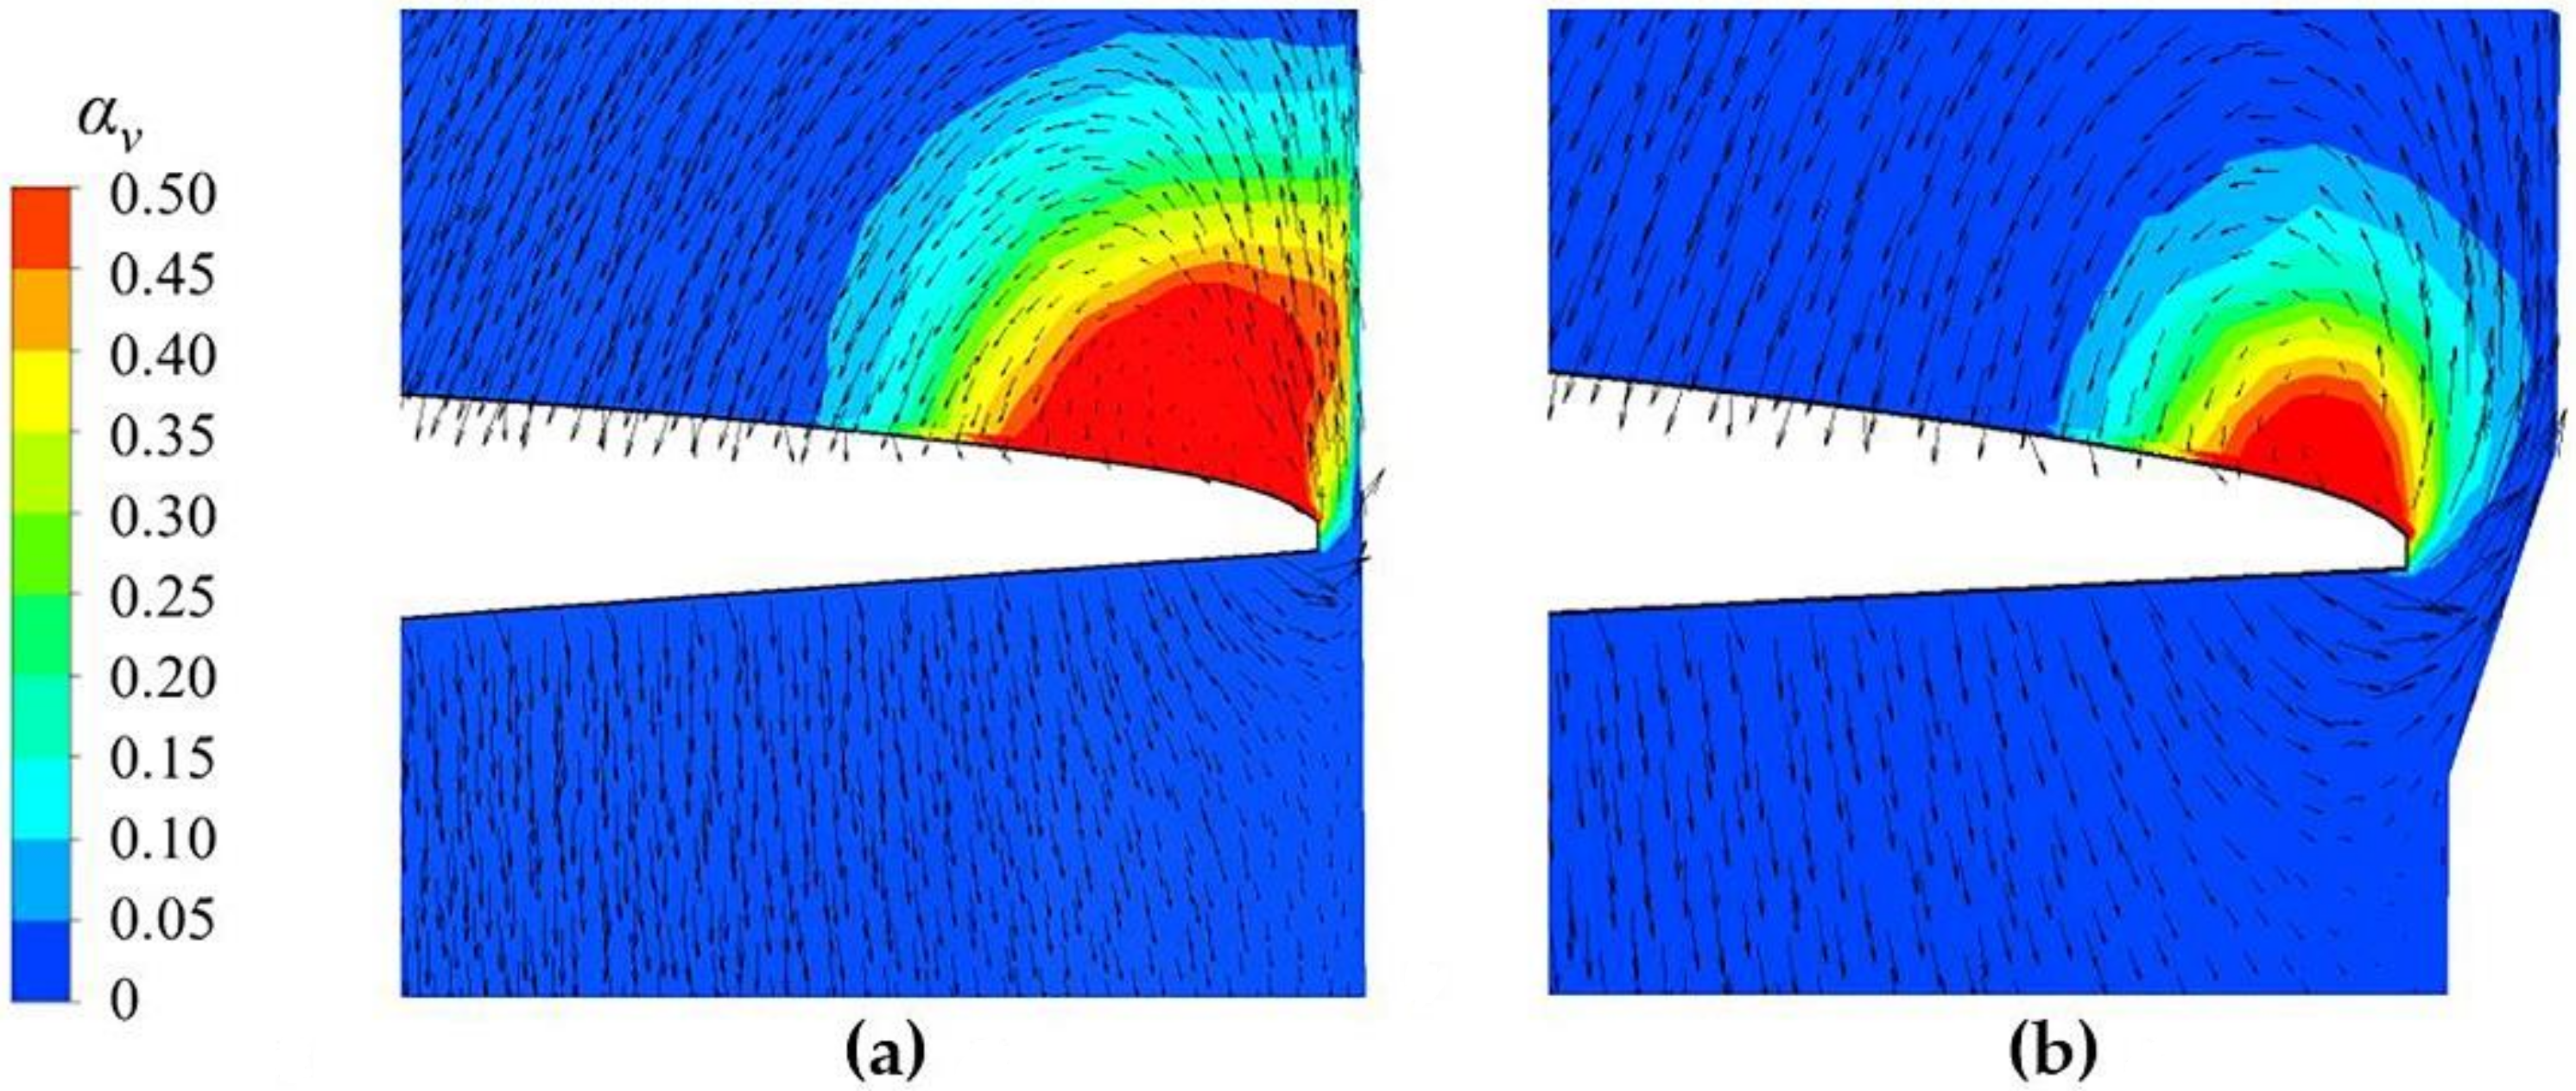
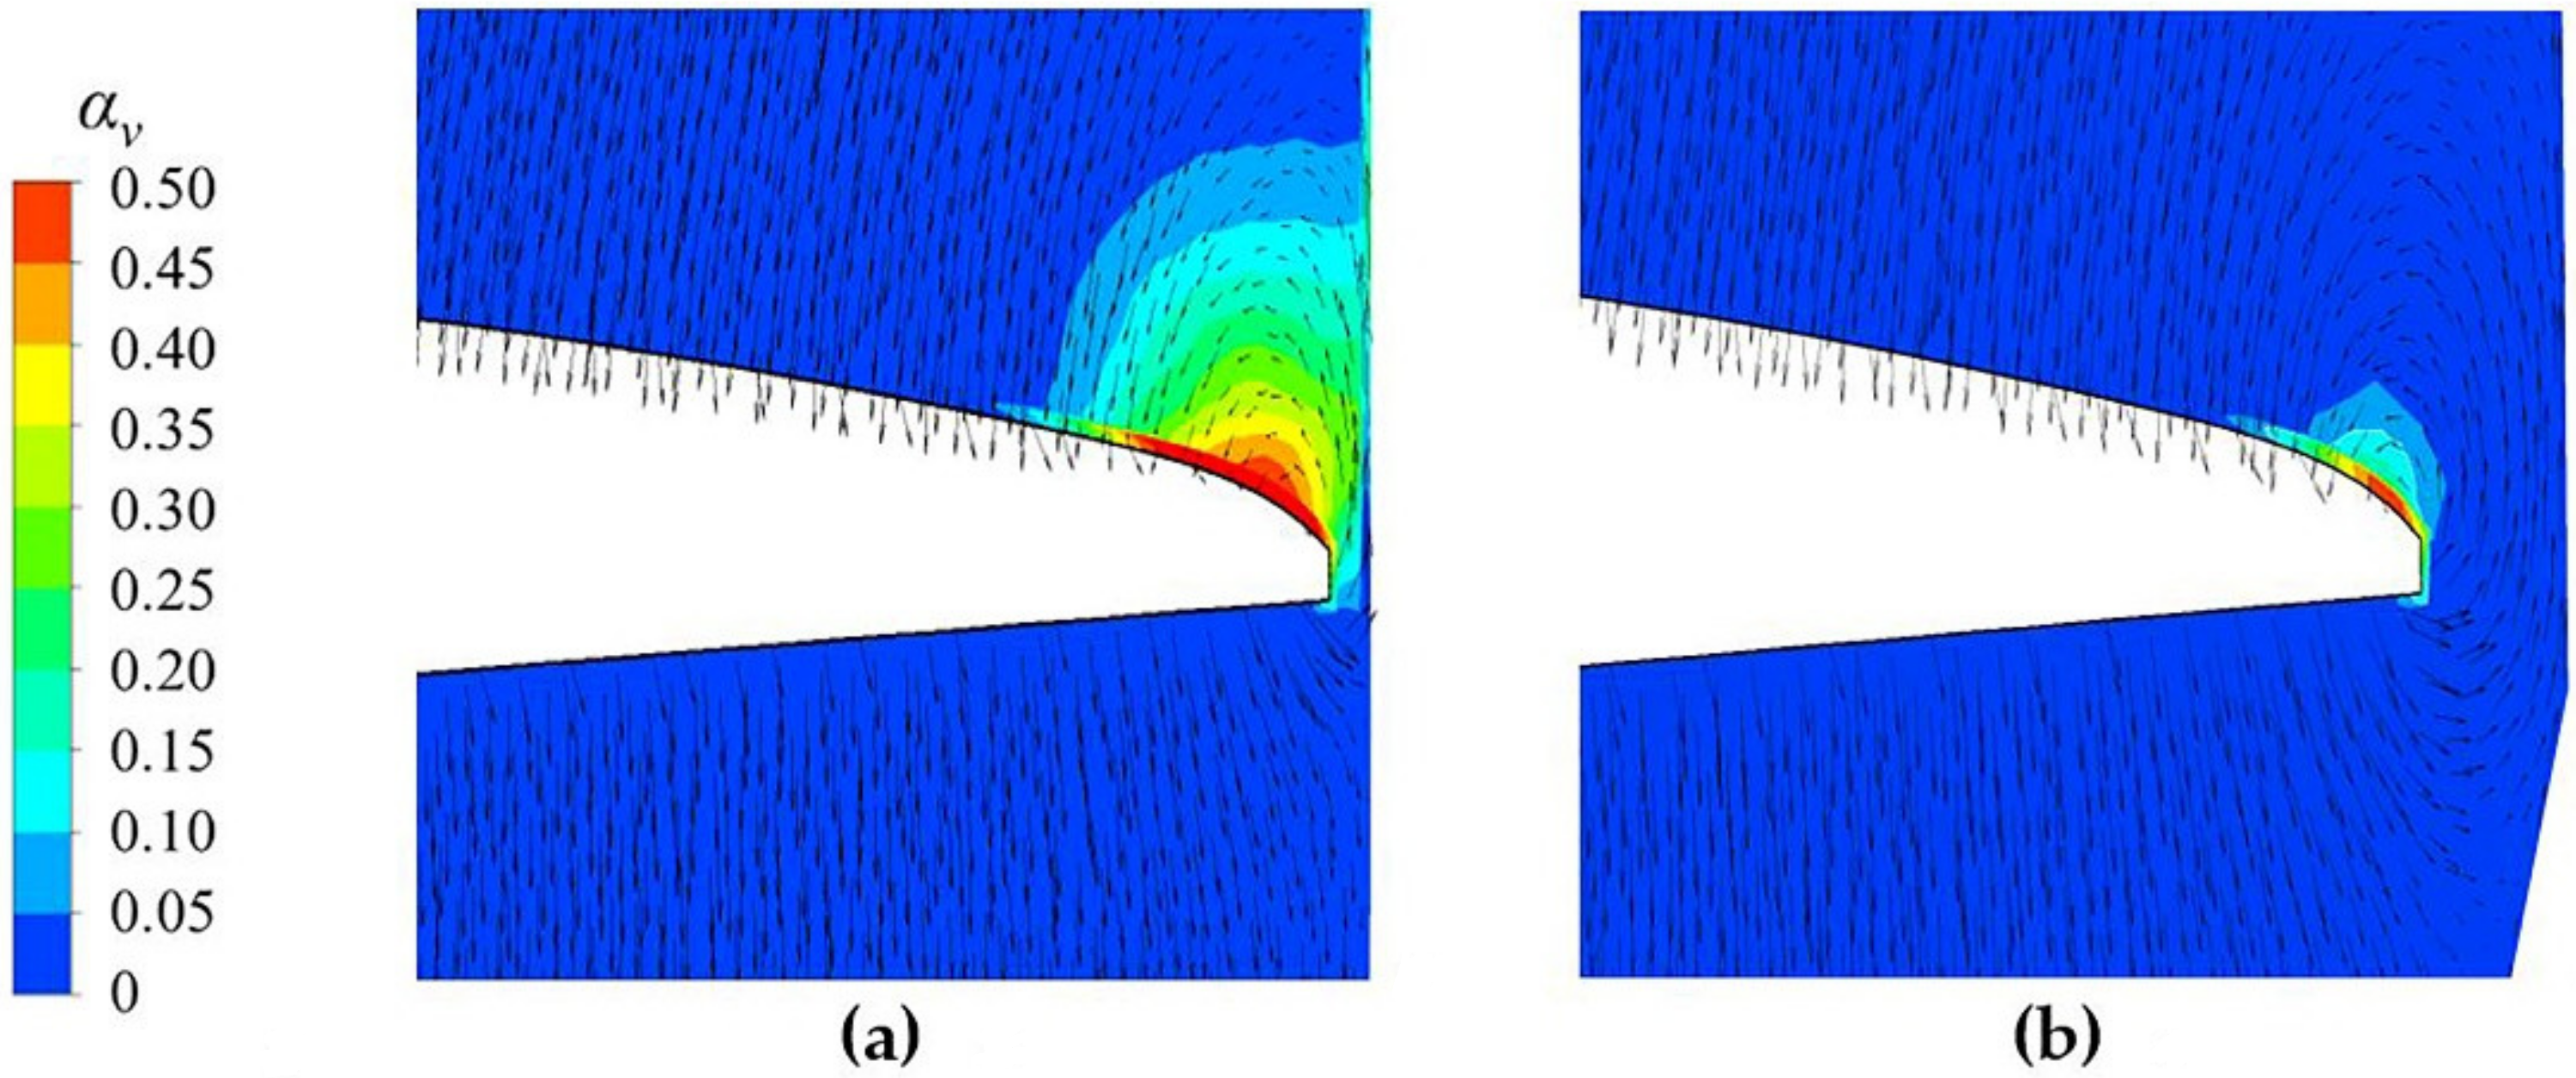
3.3. Characteristics of Blade Loading and Flow Field
4. Conclusions
Author Contributions
Funding
Conflicts of Interest
References
- d’Agostino, L. Turbomachinery Developments and Cavitation. In Proceedings of the VKI Lecture Series on Fluid Dynamics Associated to Launcher Developments, Rhode-Saint-Genese, Belgium, 15–17 April 2013; von Karman Institute of Fluid Dynamics: Rhode-Saint-Genese, Belgium, 2013. [Google Scholar]
- d’Agostino, L.; Cervone, A.; Torre, L.; Pace, G.; Valentini, D.; Pasini, A. An Introduction to Flow-Induced Instabilities in Rocket Engine Inducers and Turbopumps. In Cavitation Instabilities and Rotordynamic Effects in Turbopumps and Hydroturbines: Turbopump and Inducer Cavitation, Experiments and Design; d’Agostino, L., Salvetti, M.V., Eds.; Springer International Publishing: Cham, Switzerland, 2017; pp. 65–86. [Google Scholar]
- Sack, L.E.; Nottage, H. System oscillations associated with cavitating inducers. J. Fluids Eng. 1965, 87, 917–924. [Google Scholar] [CrossRef]
- Kamijo, K.; Yoshida, M.; Tsujimoto, Y. Hydraulic and mechanical performance of LE-7 LOX pump inducer. J. Propuls. Power 1993, 9, 819–826. [Google Scholar] [CrossRef]
- Braisted, D.; Brennen, C. Auto-oscillation of cavitating inducers. In Proceedings of the symposium on Polyphase Flow and Transport Technology, San Francisco, CA, USA, 13–15 August 1980; American Society of Mechanical Engineers (ASME): San Francisco, CA, USA; pp. 157–166. [Google Scholar]
- Tsujimoto, Y. Cavitation instabilities in turbopump inducers. In Fluid Dynamics of Cavitation and Cavitating Turbopumps; d’Agostino, L., Maria Vittoria, S., Eds.; Springer: Pisa, Italy, 2007; pp. 169–190. [Google Scholar]
- Brennen, C.E. Hydrodynamics of Pumps; Cambridge University Press: New York, NY, USA, 2011. [Google Scholar]
- Ryan, R.; Gross, L.; Mills, D.; Mitchell, P. The Space Shuttle Main Engine liquid oxygen pump high-synchronous vibration issue, the problem, the resolution approach, the solution. In Proceedings of the 30th Joint Propulsion Conference and Exhibit, Indianapolis, IN, USA, 27–29 June 1994; American Institute of Aeronautics and Astronautics (AIAA): Indianapolis, IN, USA, 1994. [Google Scholar]
- Sekita, R.; Watanabe, A.; Hirata, K.; Imoto, T. Lessons learned from H-2 failure and enhancement of H-2A project. Acta Astronaut. 2001, 48, 431–438. [Google Scholar] [CrossRef]
- Hashimoto, T.; Yamada, H.; Funatsu, S.; Ishimoto, J.; Kamijo, K.; Tsujimoto, Y.; Hashimoto, T.; Yamada, H.; Funatsu, S.; Ishimoto, J.; et al. Rotating cavitation in three and four-bladed inducers. In Proceedings of the 33rd Joint Propulsion Conference and Exhibit, Seattle, WA, USA, 6–9 July 1997; American Institute of Aeronautics and Astronautics (AIAA): Reston, VA, USA, 1997. [Google Scholar]
- Kang, D.; Arimoto, Y.; Yonezawa, K.; Horiguchi, H.; Kawata, Y.; Hah, C.; Tsujimoto, Y. Suppression of Cavitation Instabilities in an Inducer by Circumferential Groove and Explanation of Higher Frequency Components. Int. J. Fluid Mach. Syst. 2010, 3, 137–149. [Google Scholar] [CrossRef]
- Torre, L.; Pasini, A.; Cervone, A.; Pace, G.; Miloro, P.; D’Agostino, L. Effect of Tip Clearance on the Performance of a Three-Bladed Axial Inducer. J. Propuls. Power 2011, 27, 890–898. [Google Scholar] [CrossRef]
- Shimiya, N.; Fujii, A.; Horiguchi, H.; Uchiumi, M.; Kurokawa, J.; Tsujimoto, Y. Suppression of Cavitation Instabilities in an Inducer by J Groove. J. Fluids Eng. 2008, 130, 021302. [Google Scholar] [CrossRef]
- Xu, B.; Shen, X.; Zhang, D.; Zhang, W. Experimental and Numerical Investigation on the Tip Leakage Vortex Cavitation in an Axial Flow Pump with Different Tip Clearances. Processes 2019, 7, 935. [Google Scholar] [CrossRef]
- Shimagaki, M.; Watanabe, M.; Hashimoto, T.; Hasegawa, S.; Yoshida, Y.; Nakamura, N. Effect of the casing configurations on the internal flow in rocket pump inducer. In Proceedings of the 42nd AIAA/ASME/SAE/ASEE Joint Propulsion Conference & Exhibit, Sacramento, CA, USA, 9–12 July 2006; American Institute of Aeronautics and Astronautics (AIAA): Sacramento, CA, USA, 2006. [Google Scholar]
- Fujii, A.; Azuma, S.; Yoshida, Y.; Tsujimoto, Y.; Uchiumi, M.; Warashina, S. Effects of Inlet Casing Geometries on Unsteady Cavitation in an Inducer. Trans. Jpn. Soc. Mech. Eng. B 2004, 16, 1450–1458. [Google Scholar]
- Tang, F.; Li, J.; Chen, H.; Li, X.; Xuan, T. Study on Cavitation Performance of Inducer with Annulus Inlet Casing. J. Mech. Eng. 2011, 47, 171–176. [Google Scholar] [CrossRef]
- Menter, F.R. Two-equation eddy-viscosity turbulence models for engineering applications. AIAA J. 1994, 32, 1598–1605. [Google Scholar] [CrossRef]
- Zwart, P.J.; Gerber, A.G.; Belamri, T. A two-phase flow model for predicting cavitation dynamics. In Proceedings of the Fifth international conference on multiphase flow, Yokohama, Japan, 30 May–3 June 2004; International Conference on Multiphase Flow (ICMF): Yokohama, Japan, 2004. [Google Scholar]
- Yu, L.; Zhang, H.; Chen, H.; Li, Y.; Zuo, Z.; Liu, S. Geometrical optimization of an inducer with respect to rotating cavitation generated radial forces by using an orthogonal experiment. J. Appl. Fluid Mech. 2018, 11, 1591–1598. [Google Scholar] [CrossRef]


| Model | Inlet Blade Angle β1 | Outlet Blade Angle β2 | Pitch Variation | Casing Geometry |
|---|---|---|---|---|
| O | β | β | Constant | Straight |
| OE | β | β | Constant | Step |
| Model | Inlet Blade Angle β1 | Outlet Blade Angle β2 | Pitch Variation | Casing Geometry |
|---|---|---|---|---|
| A | β − 1.8° | β + 0.6° | Linear | Straight |
| AE | β − 1.8° | β + 0.6° | Linear | Step |
| Model | Region | θ | Δθ | (Δr)max | (Δz)max |
|---|---|---|---|---|---|
| O | I | 75°~85° | 10° | 11.9% | 13.5% |
| II | 85°~160° | 75° | |||
| OE | I | 80°~90° | 10° | 19.8% | 11.1% |
| II | 90°~170° | 80° |
| Model | Region | θ | Δθ | (Δr)max | (Δz)max |
|---|---|---|---|---|---|
| A | I | 75°~93° | 18° | 11.9% | 9.0% |
| II | 93°~146° | 53° | |||
| AE | I | 80°~150° | 70° | 4.1% | 6.8% |
| Model | Δp (Pa) | Average Velocity at the Clearance (m/s) | Leakage Flow Rate (kg/s) |
|---|---|---|---|
| O | 1.11 × 10⁶ | −16.18 | 0.094 |
| OE | 1.04 × 10⁶ | −10.69 | 0.230 |
| Model | Δp (Pa) | Average Velocity at the Clearance (m/s) | Leakage Flow Rate (kg/s) |
|---|---|---|---|
| A | 8.40 × 10⁵ | −7.45 | 0.045 |
| AE | 6.70 × 10⁵ | −1.33 | 0.070 |
© 2020 by the authors. Licensee MDPI, Basel, Switzerland. This article is an open access article distributed under the terms and conditions of the Creative Commons Attribution (CC BY) license (http://creativecommons.org/licenses/by/4.0/).
Share and Cite
Yu, L.; Zhang, H.; Chen, H.; Zuo, Z.; Liu, S. Numerical Study on the Influence of Step Casing on Cavitating Flows and Instabilities in Inducers with Equal and Varying Pitches. Processes 2020, 8, 1103. https://doi.org/10.3390/pr8091103
Yu L, Zhang H, Chen H, Zuo Z, Liu S. Numerical Study on the Influence of Step Casing on Cavitating Flows and Instabilities in Inducers with Equal and Varying Pitches. Processes. 2020; 8(9):1103. https://doi.org/10.3390/pr8091103
Chicago/Turabian StyleYu, Lu, Haochen Zhang, Hui Chen, Zhigang Zuo, and Shuhong Liu. 2020. "Numerical Study on the Influence of Step Casing on Cavitating Flows and Instabilities in Inducers with Equal and Varying Pitches" Processes 8, no. 9: 1103. https://doi.org/10.3390/pr8091103
APA StyleYu, L., Zhang, H., Chen, H., Zuo, Z., & Liu, S. (2020). Numerical Study on the Influence of Step Casing on Cavitating Flows and Instabilities in Inducers with Equal and Varying Pitches. Processes, 8(9), 1103. https://doi.org/10.3390/pr8091103