Multi-Condition Optimization of Cavitation Performance on a Double-Suction Centrifugal Pump Based on ANN and NSGA-II

 ,
,  ,
,
Abstract
:1. Introduction
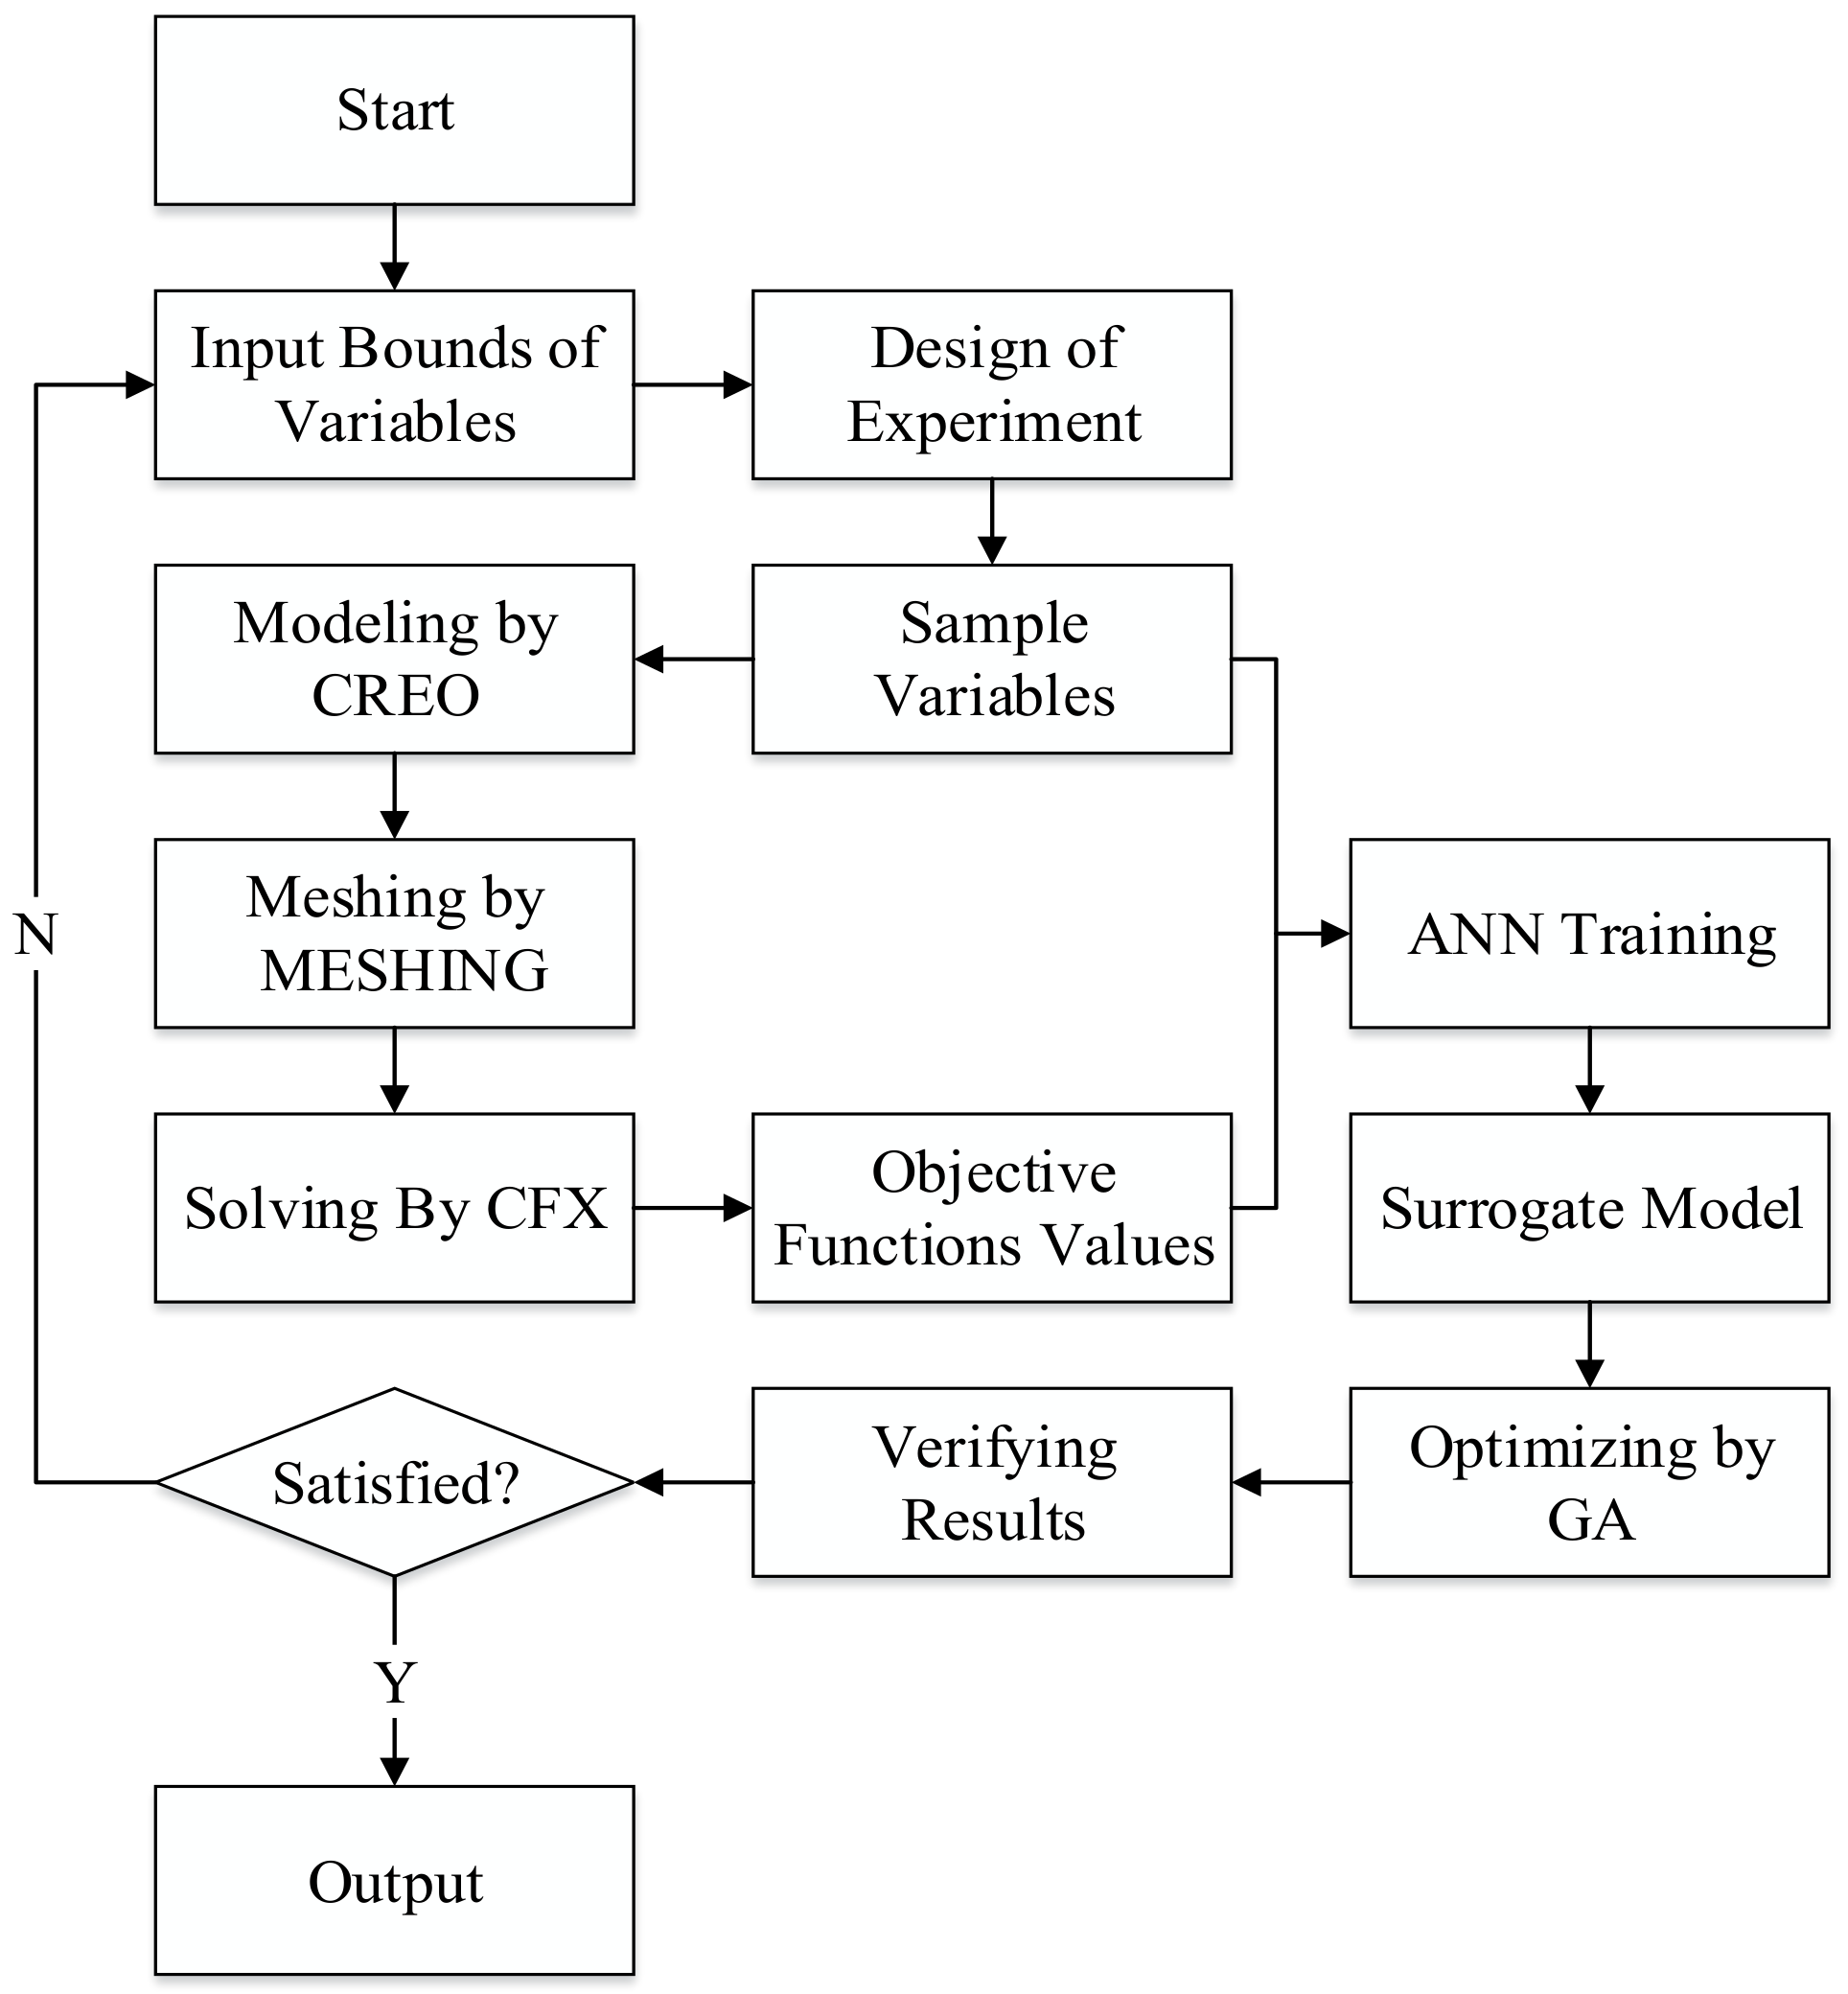
2. Optimization Procedure
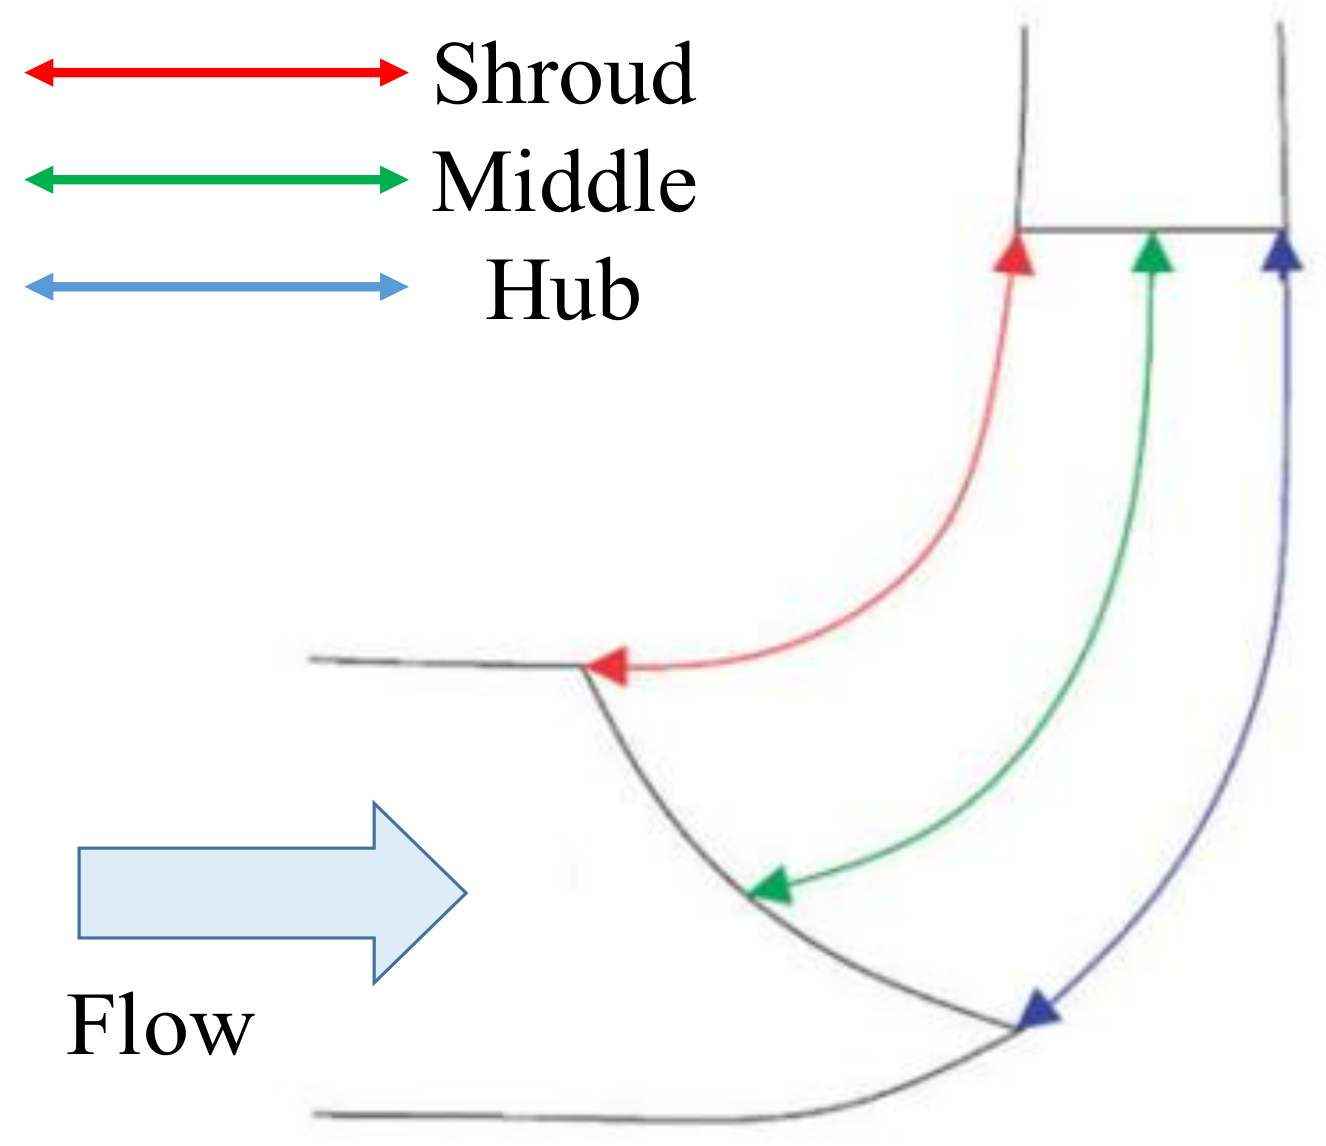
2.1. Objective Functions
2.2. Design of Experiment
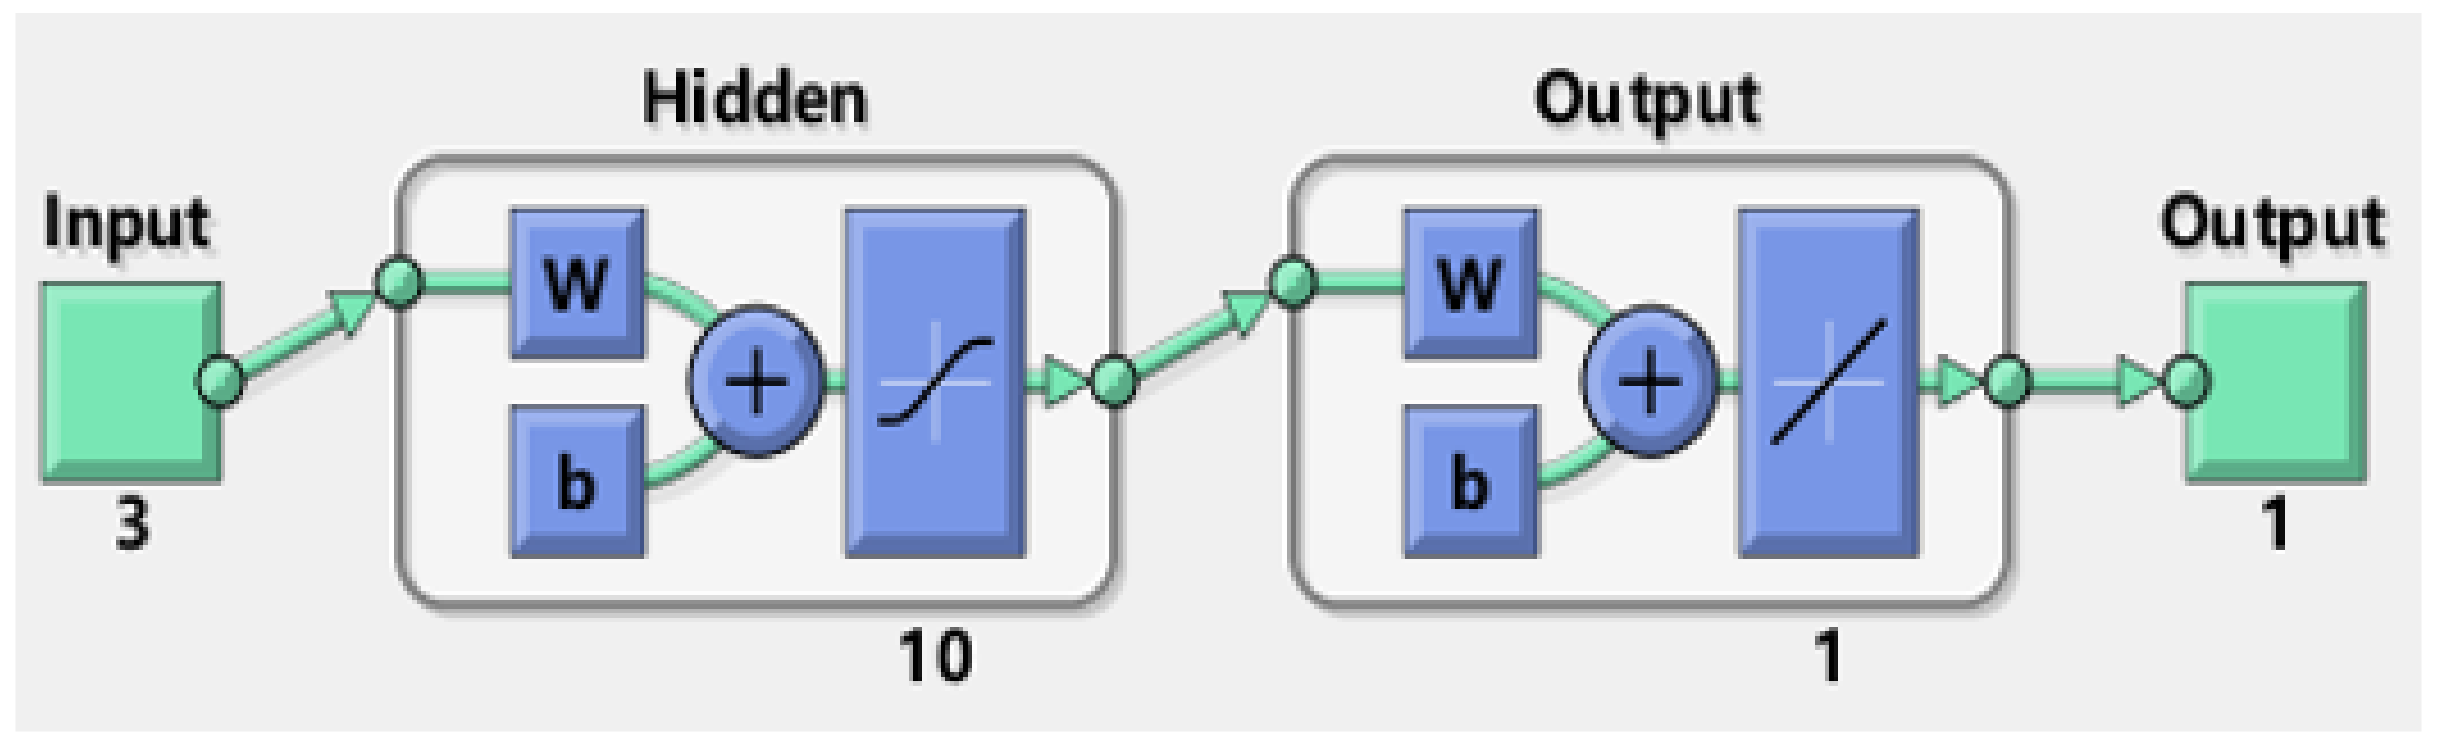
2.3. Surrogate Training and Optimum Solution Solving
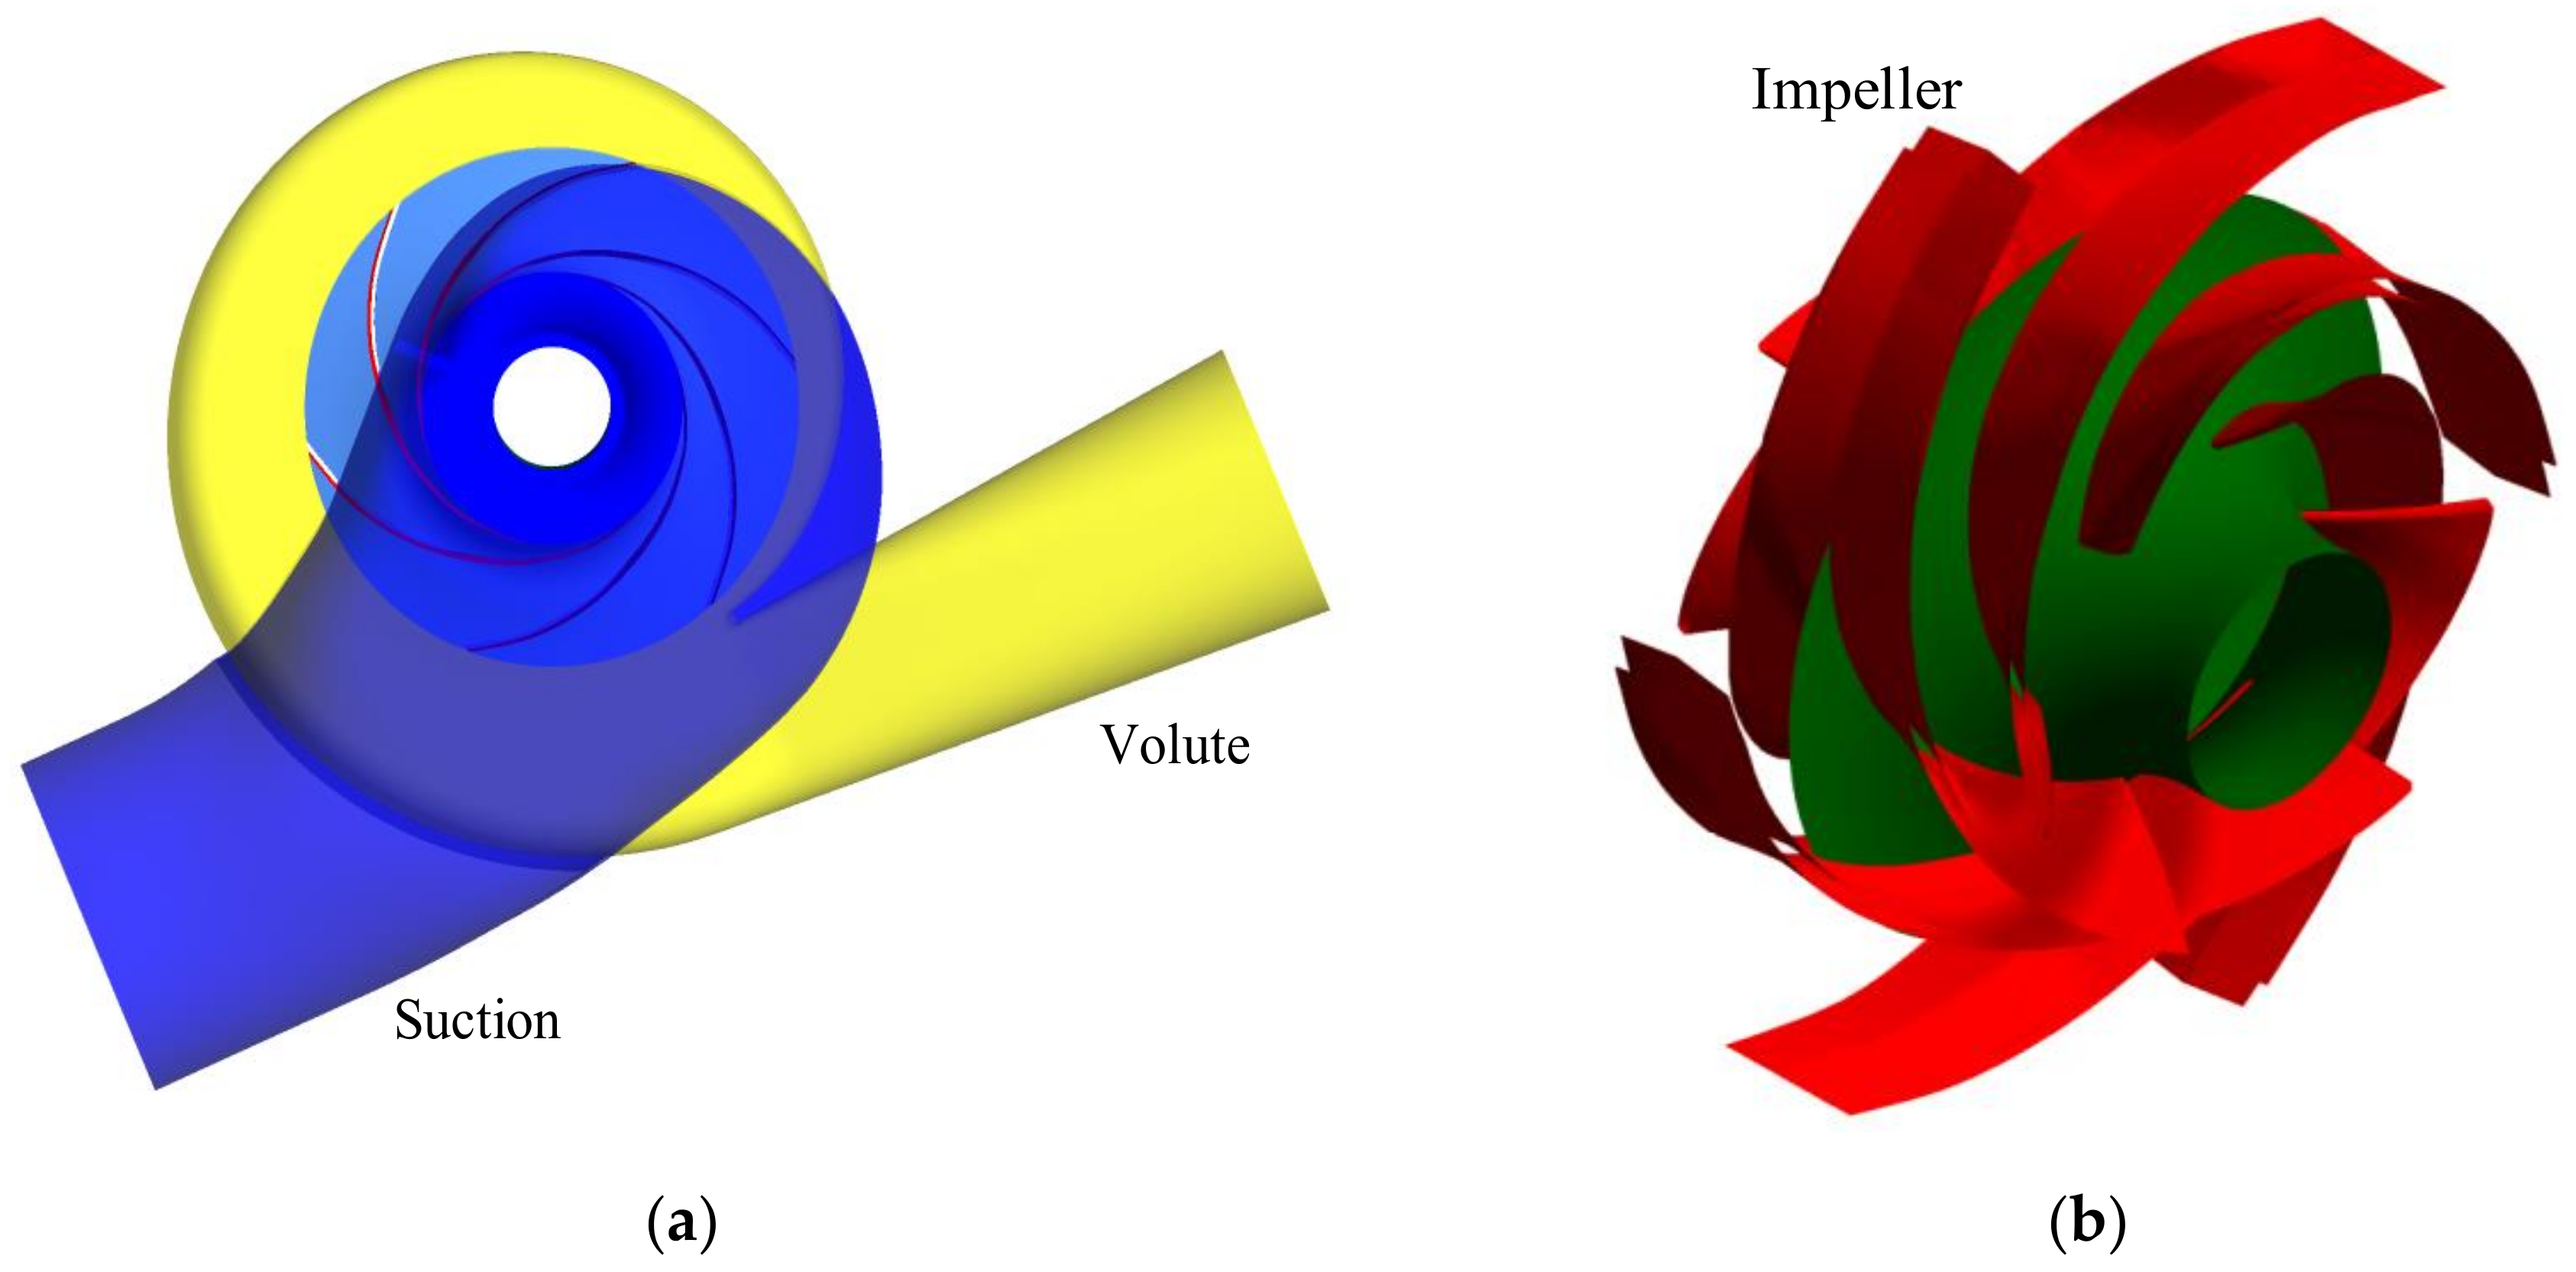
3. Tested Pump and Computational Domain
3.1. Description of Test Pump
3.2. NPSHr Prediction Procedure
3.3. Governing Equations
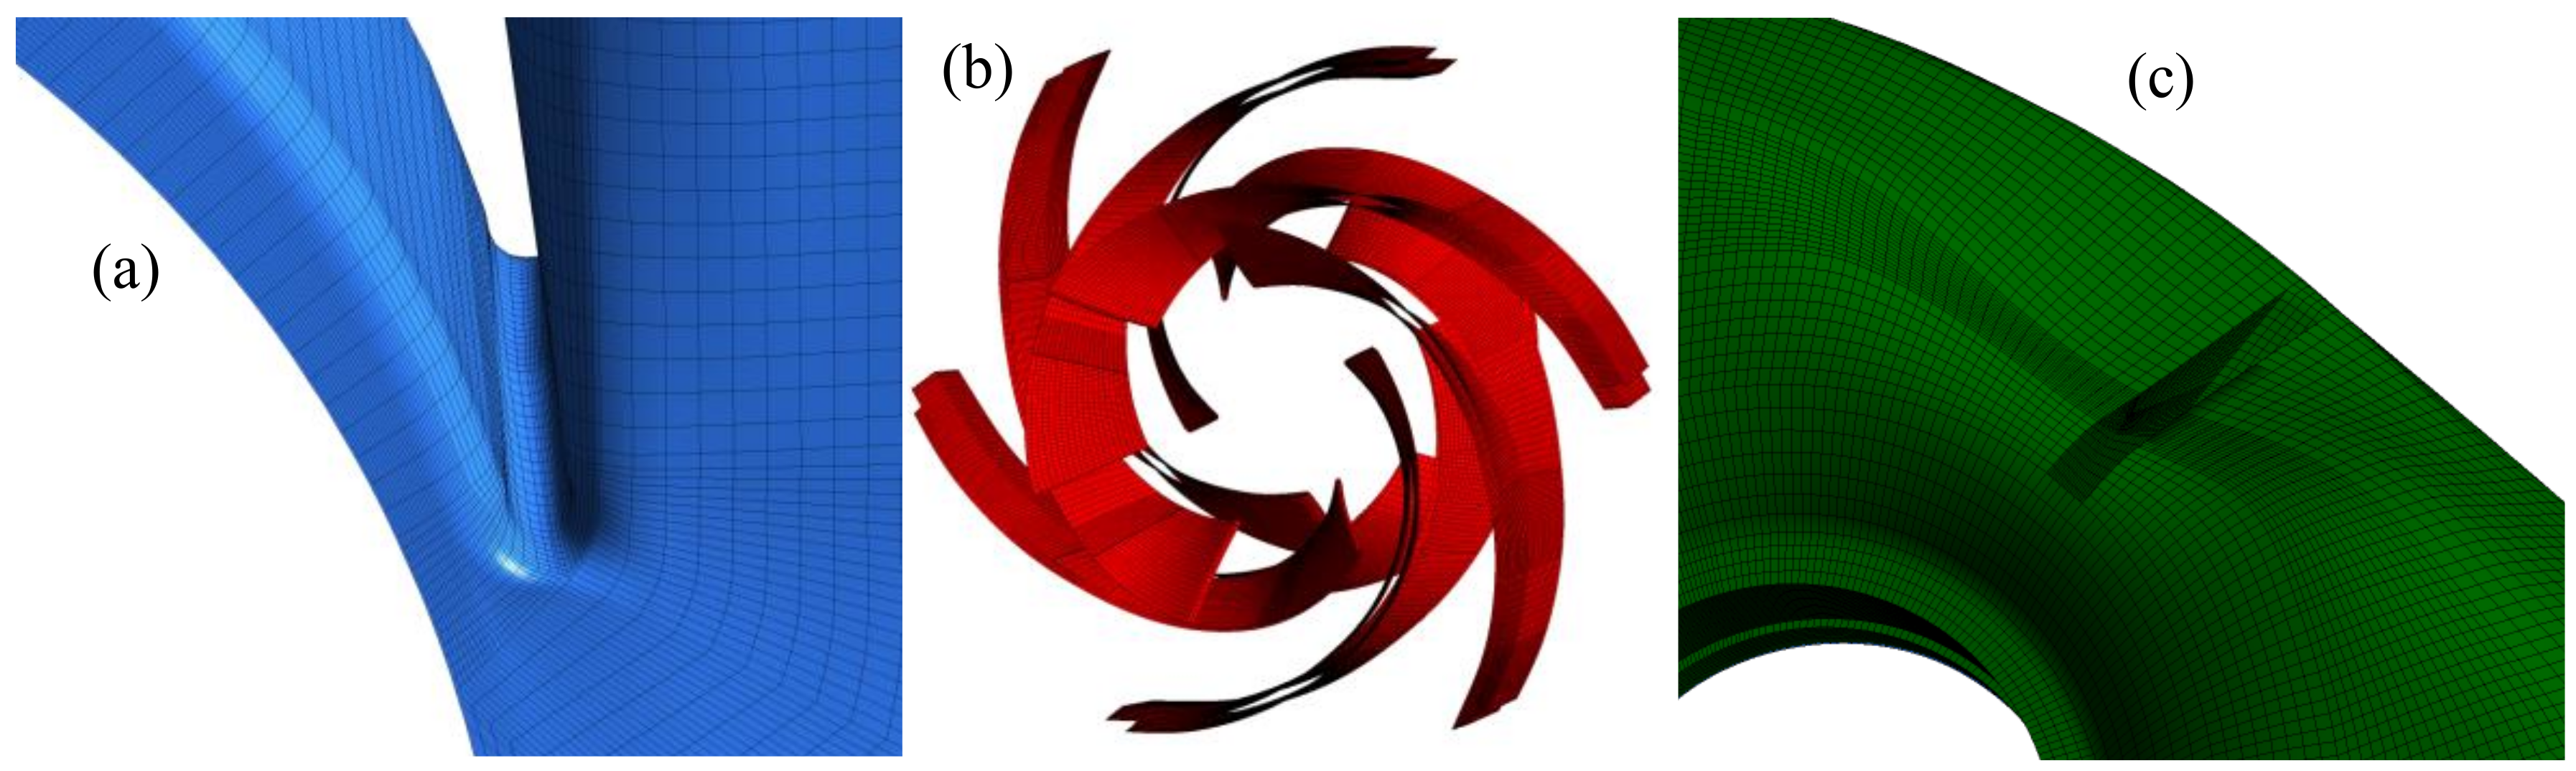
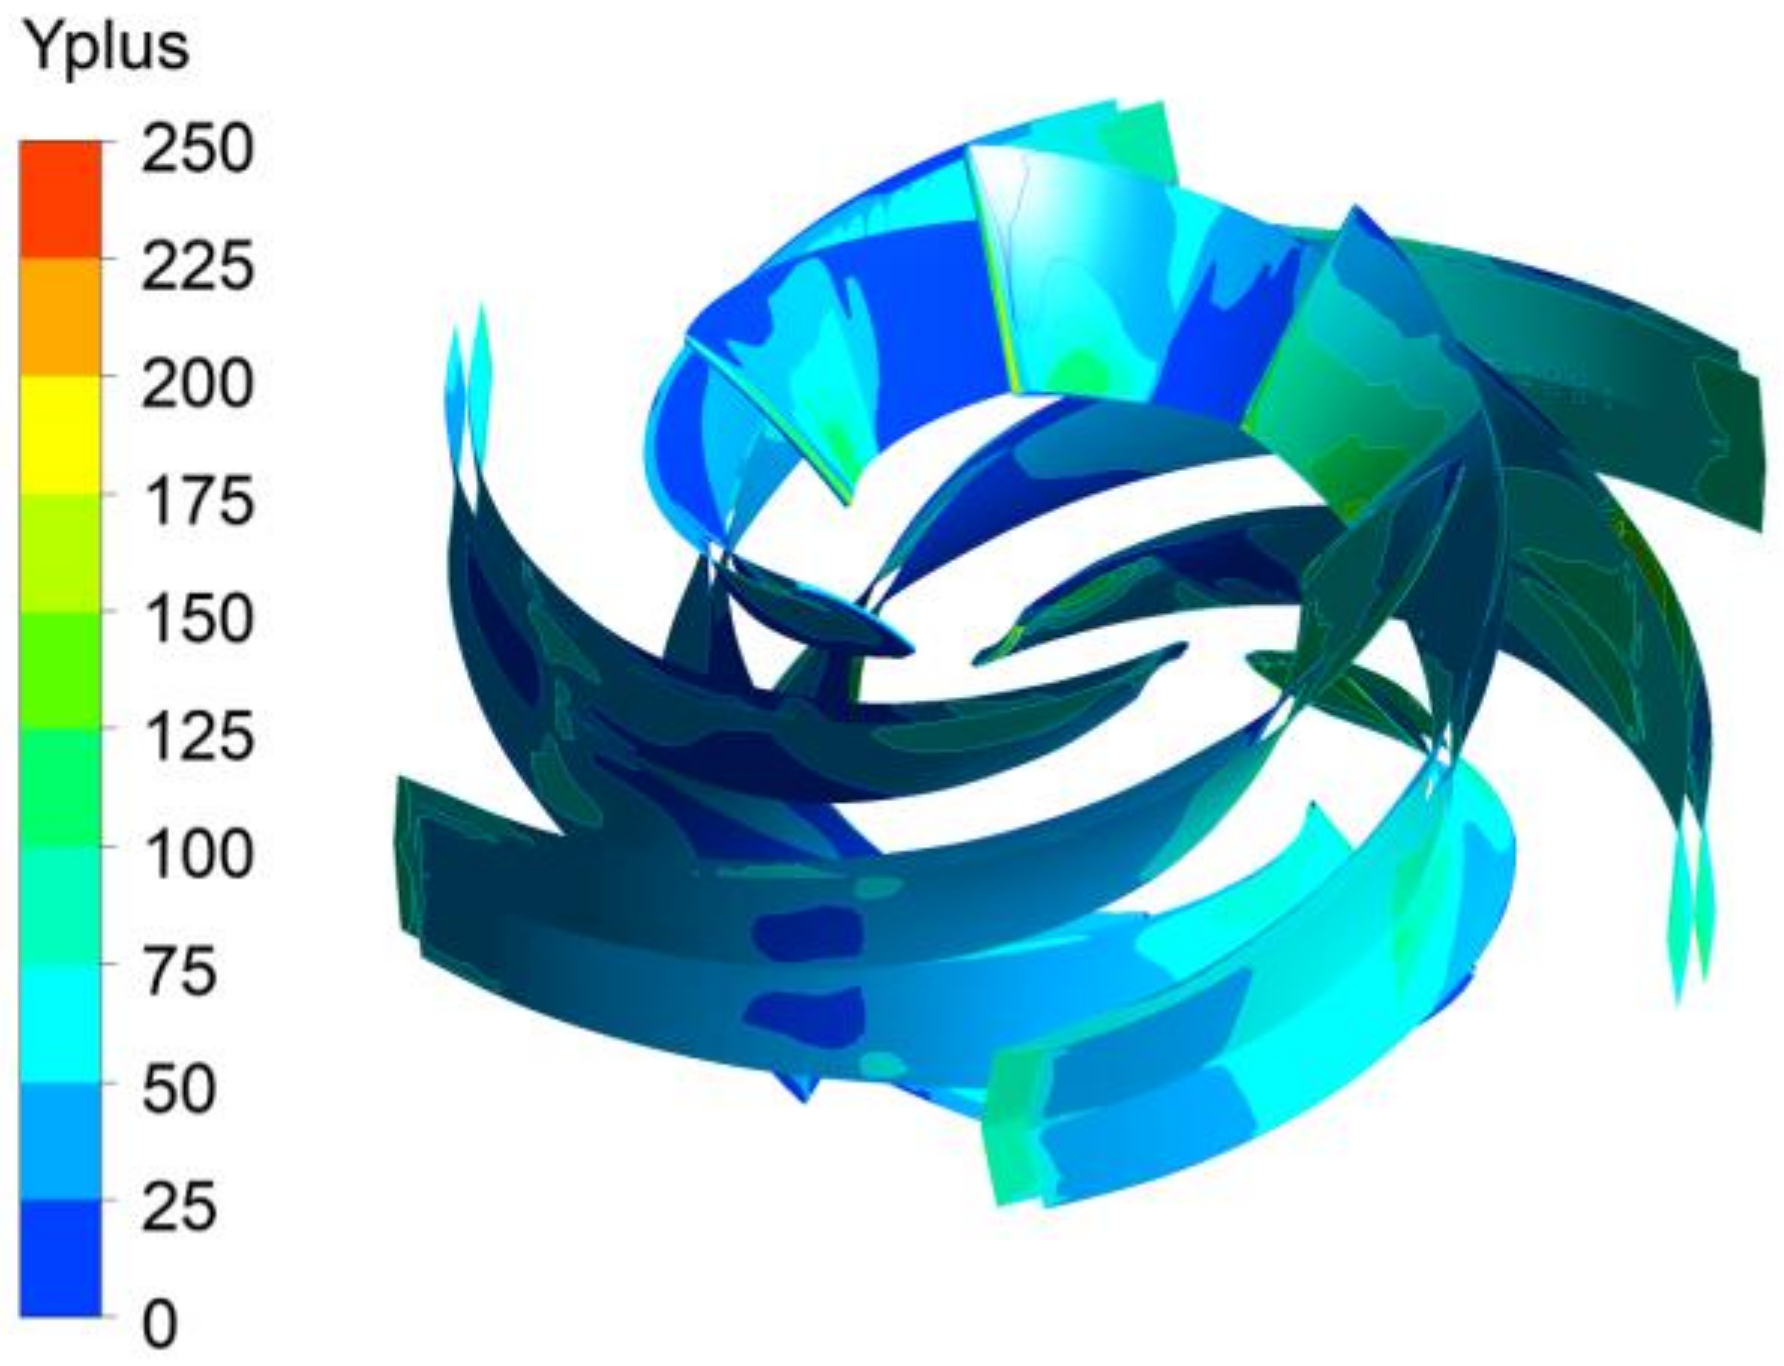
3.4. Test of Grid Independence
3.5. Numerical Calculation Setup
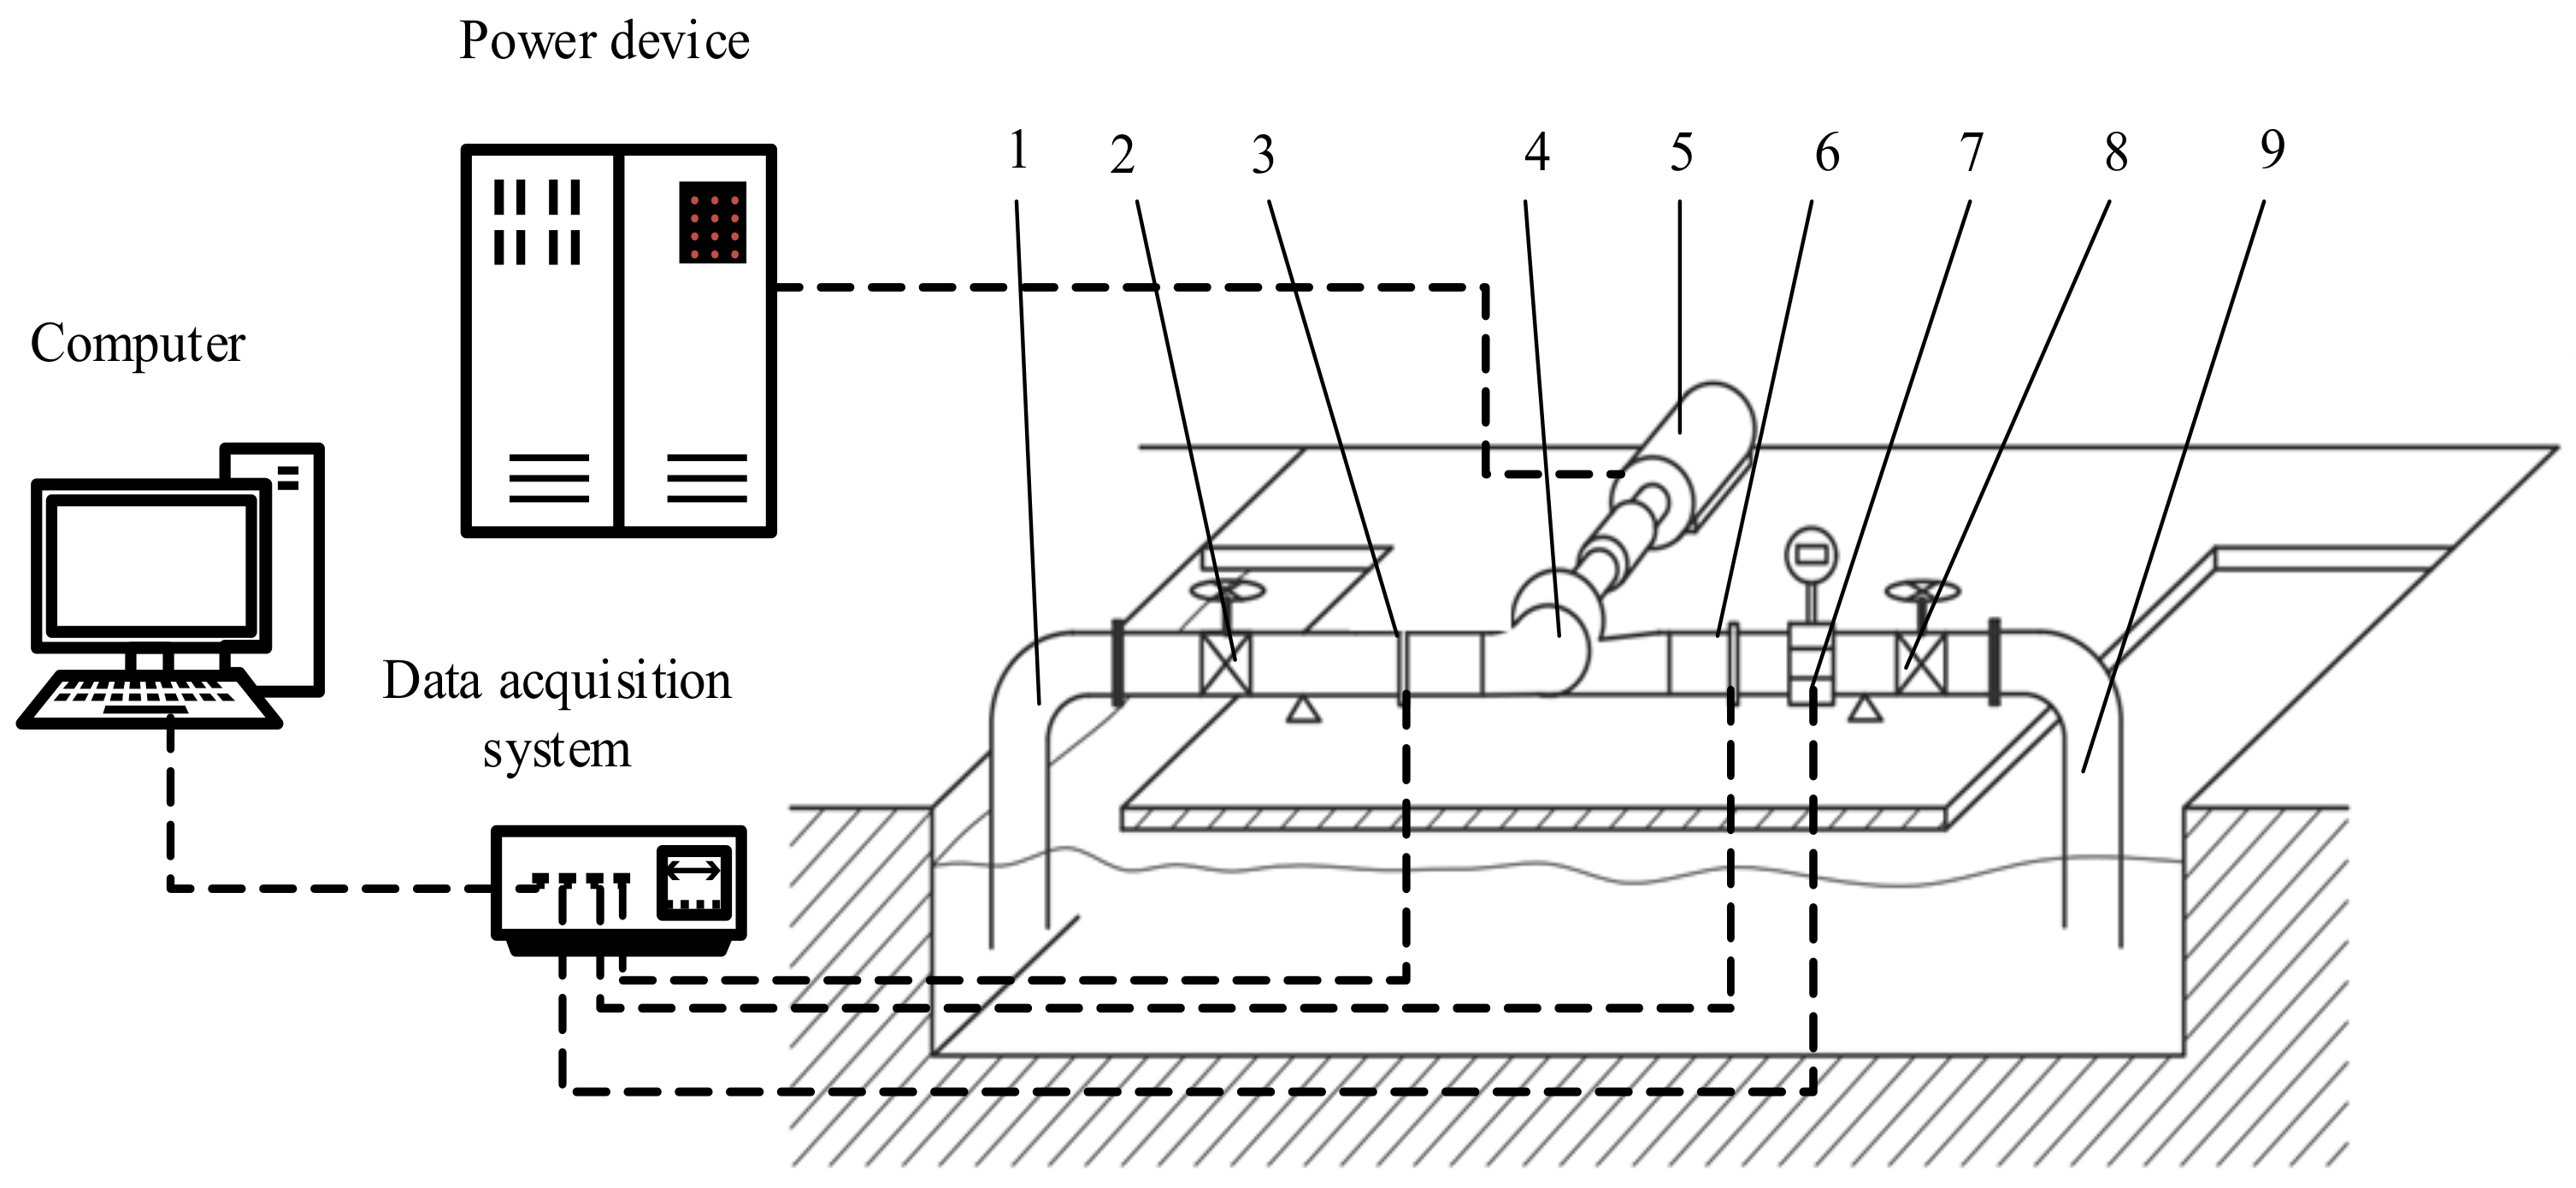
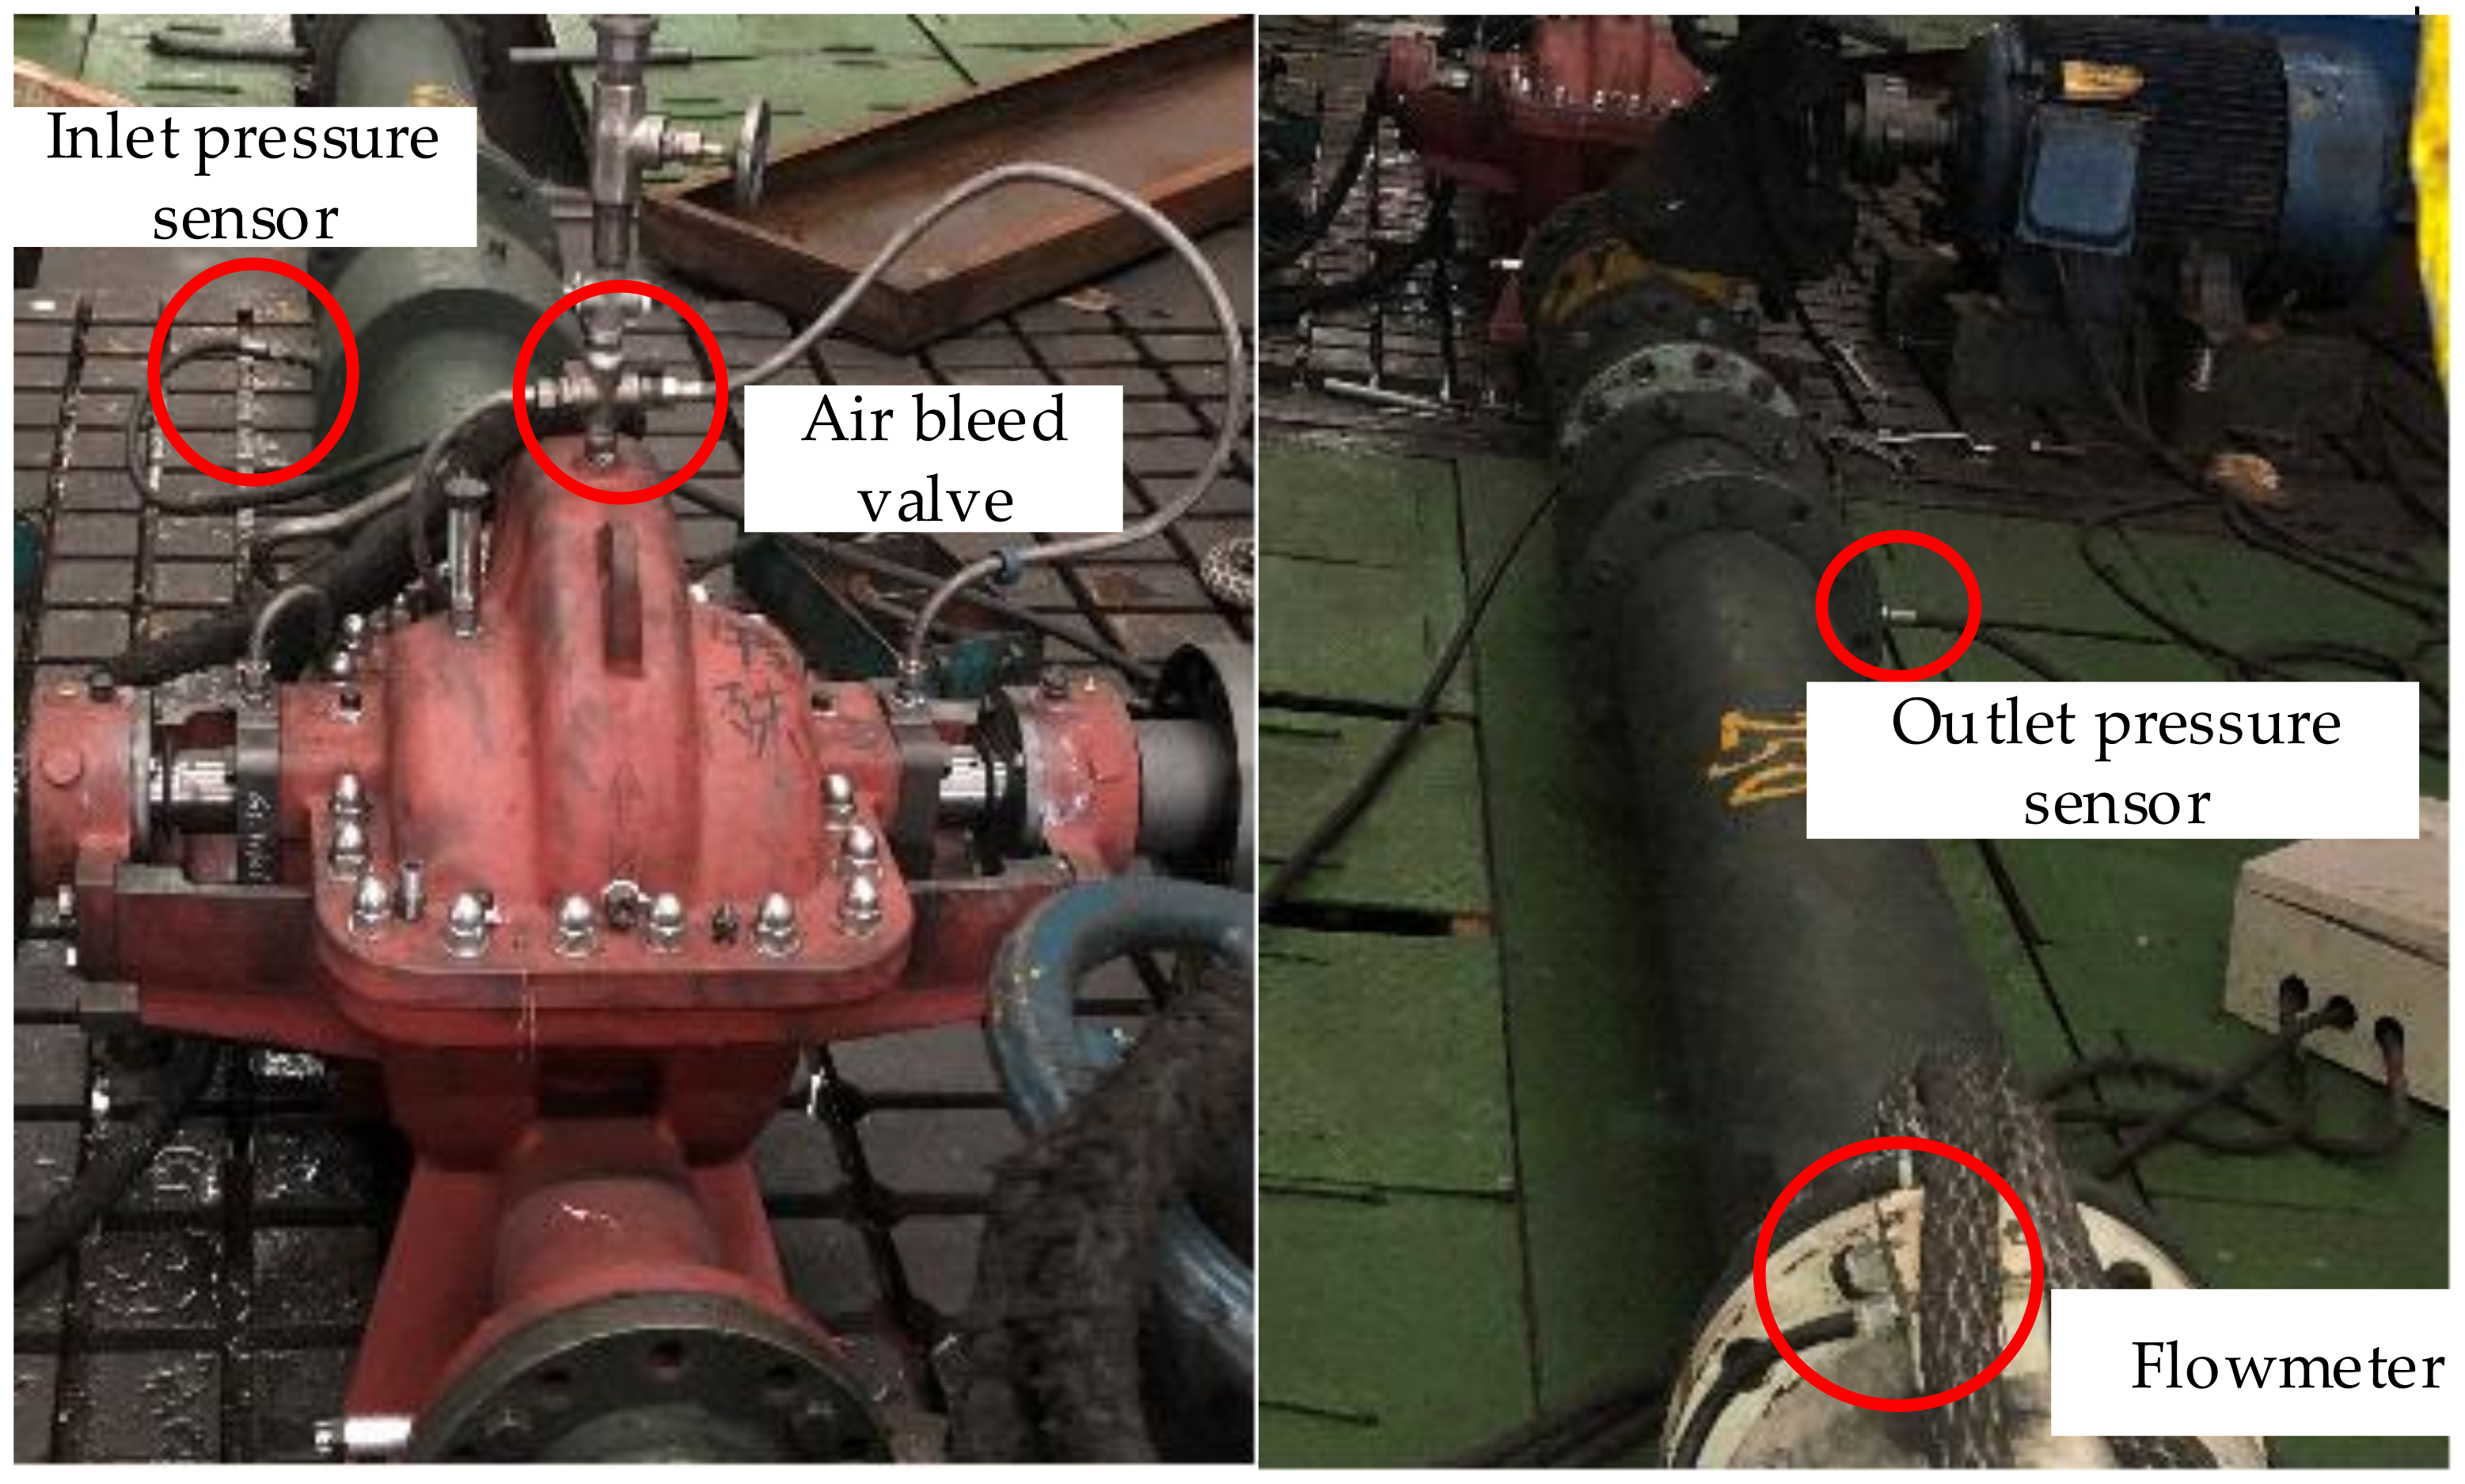
3.6. Description of Test System
4. Discussion of Results
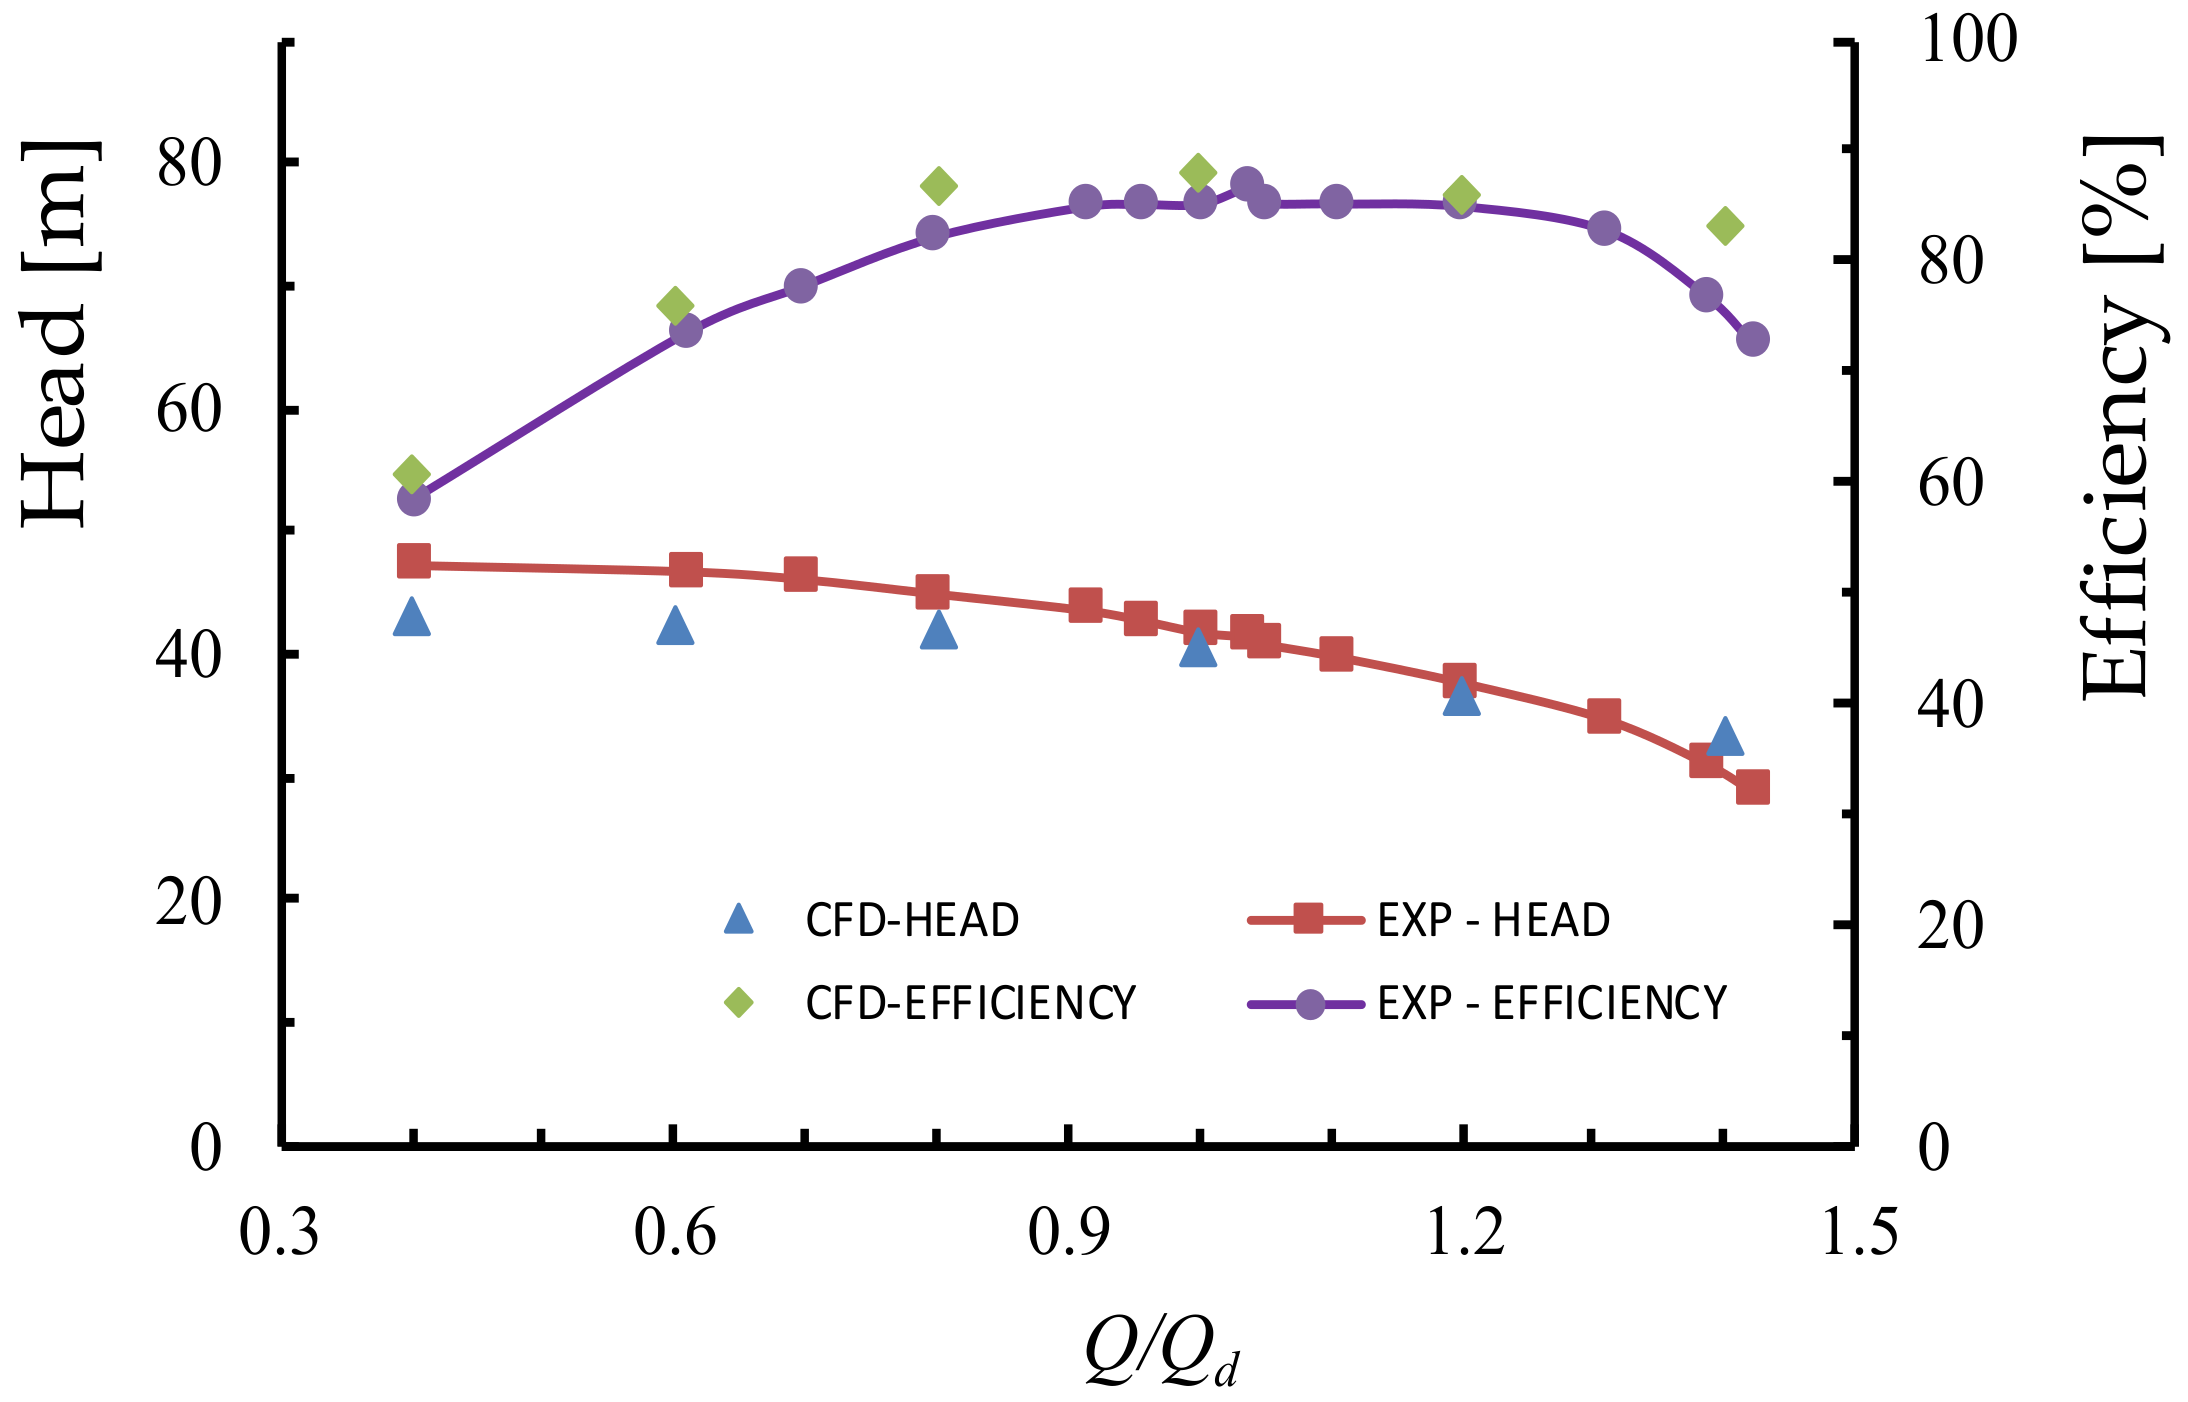
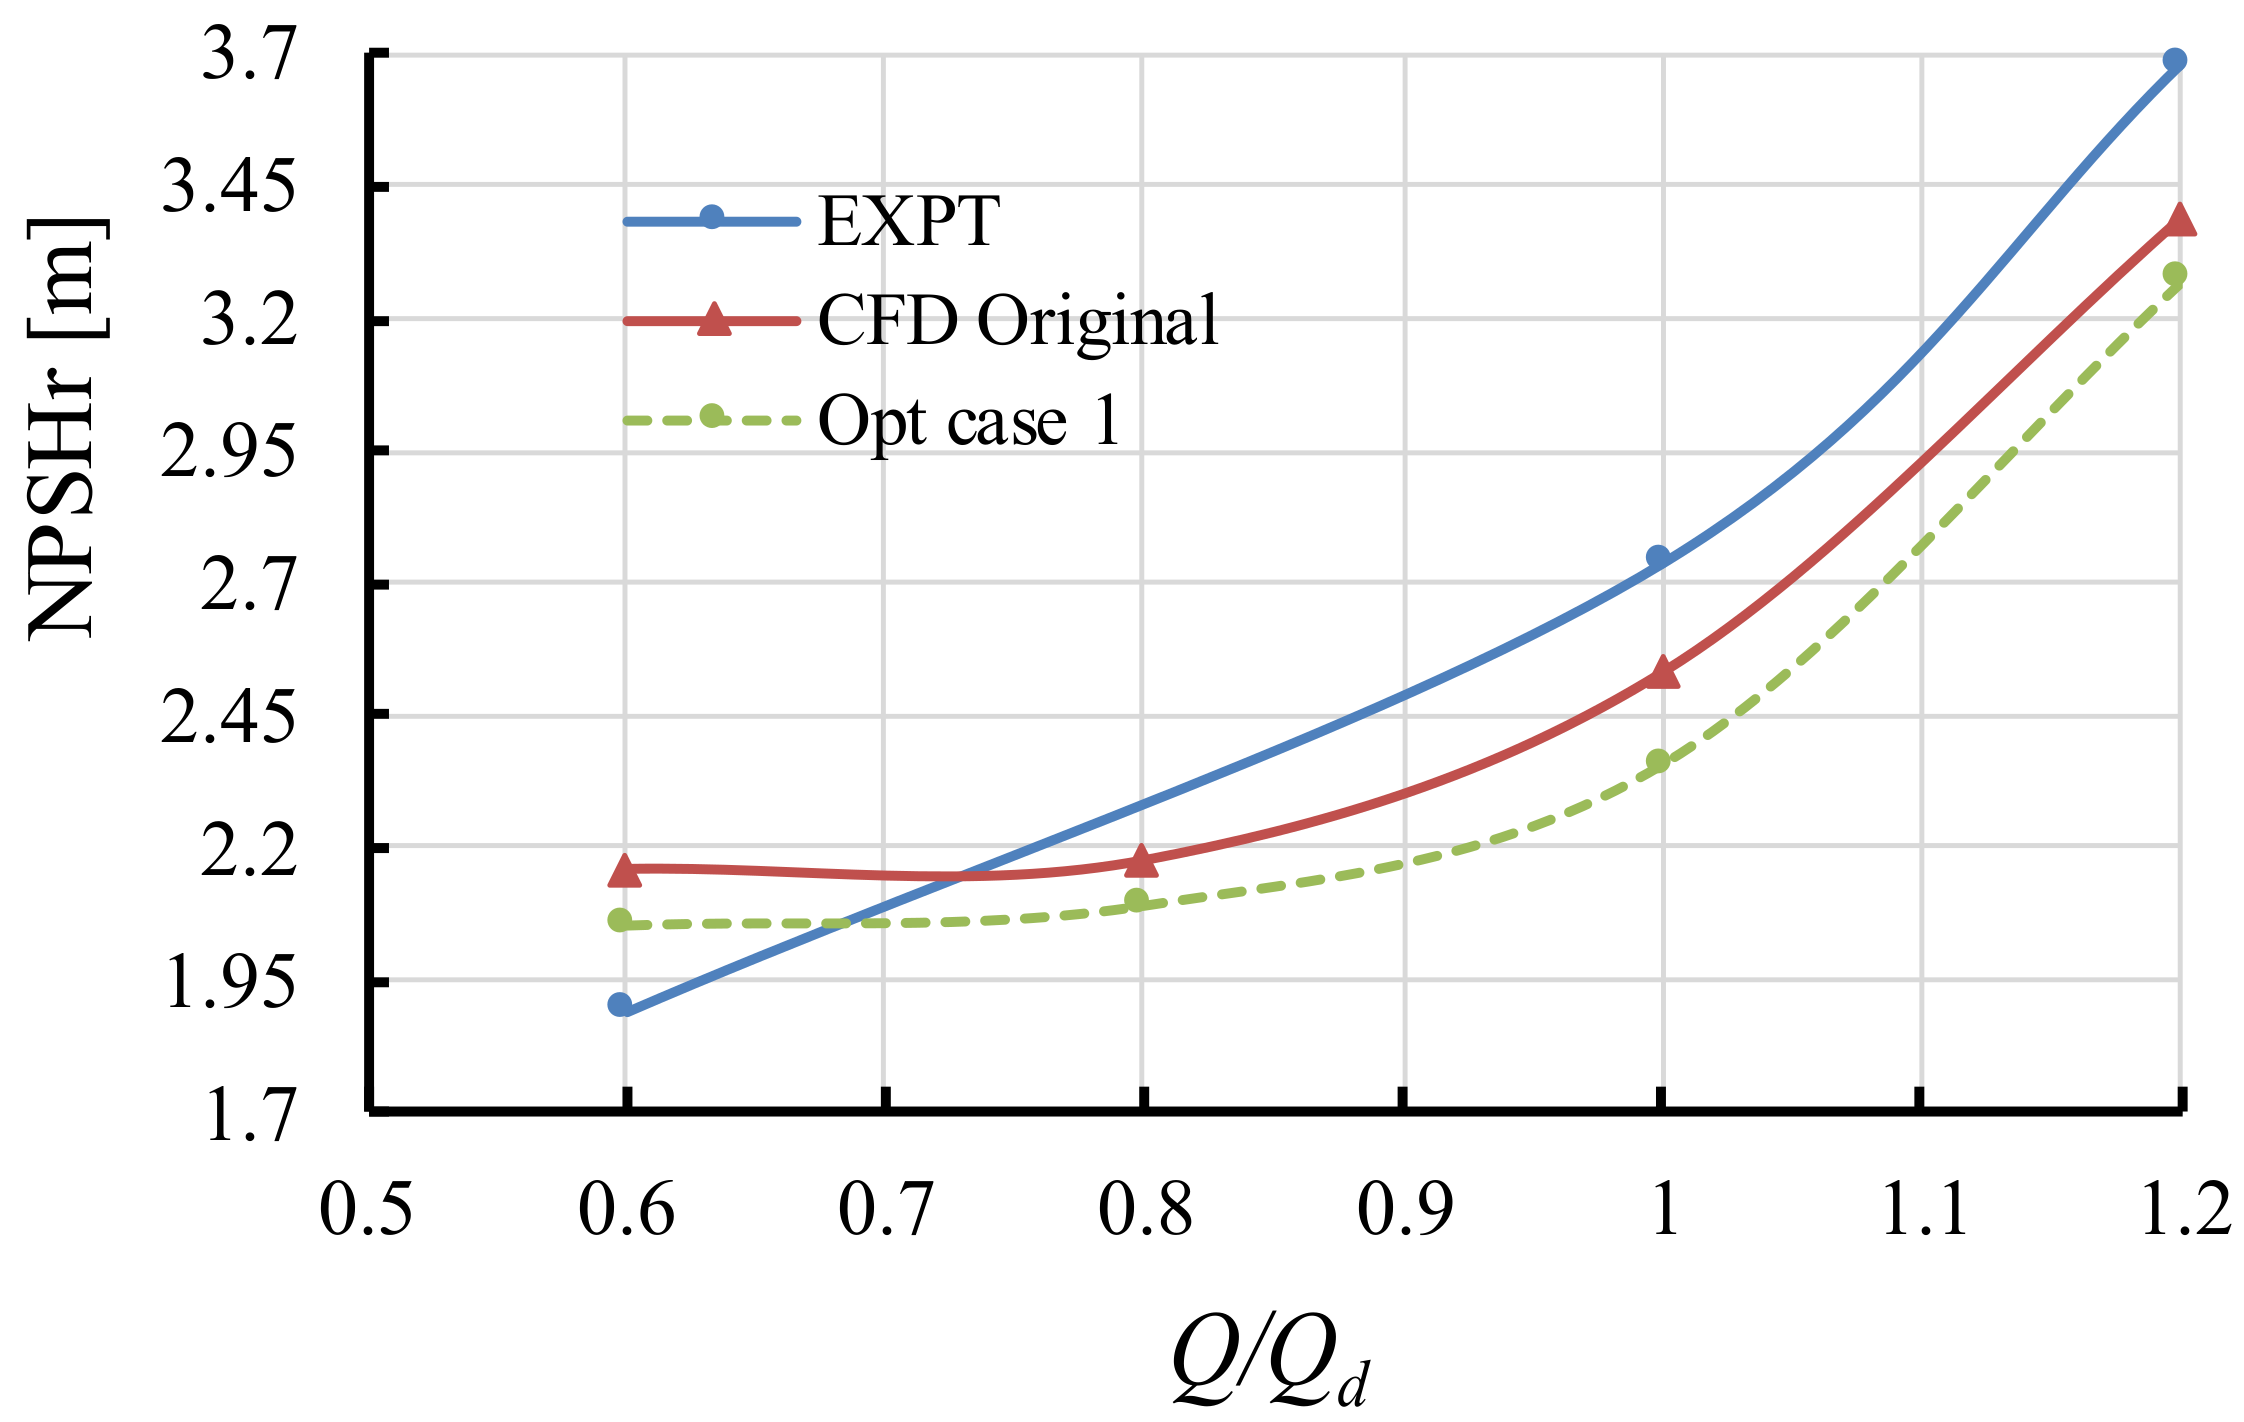
4.1. Validation of Numerical Method
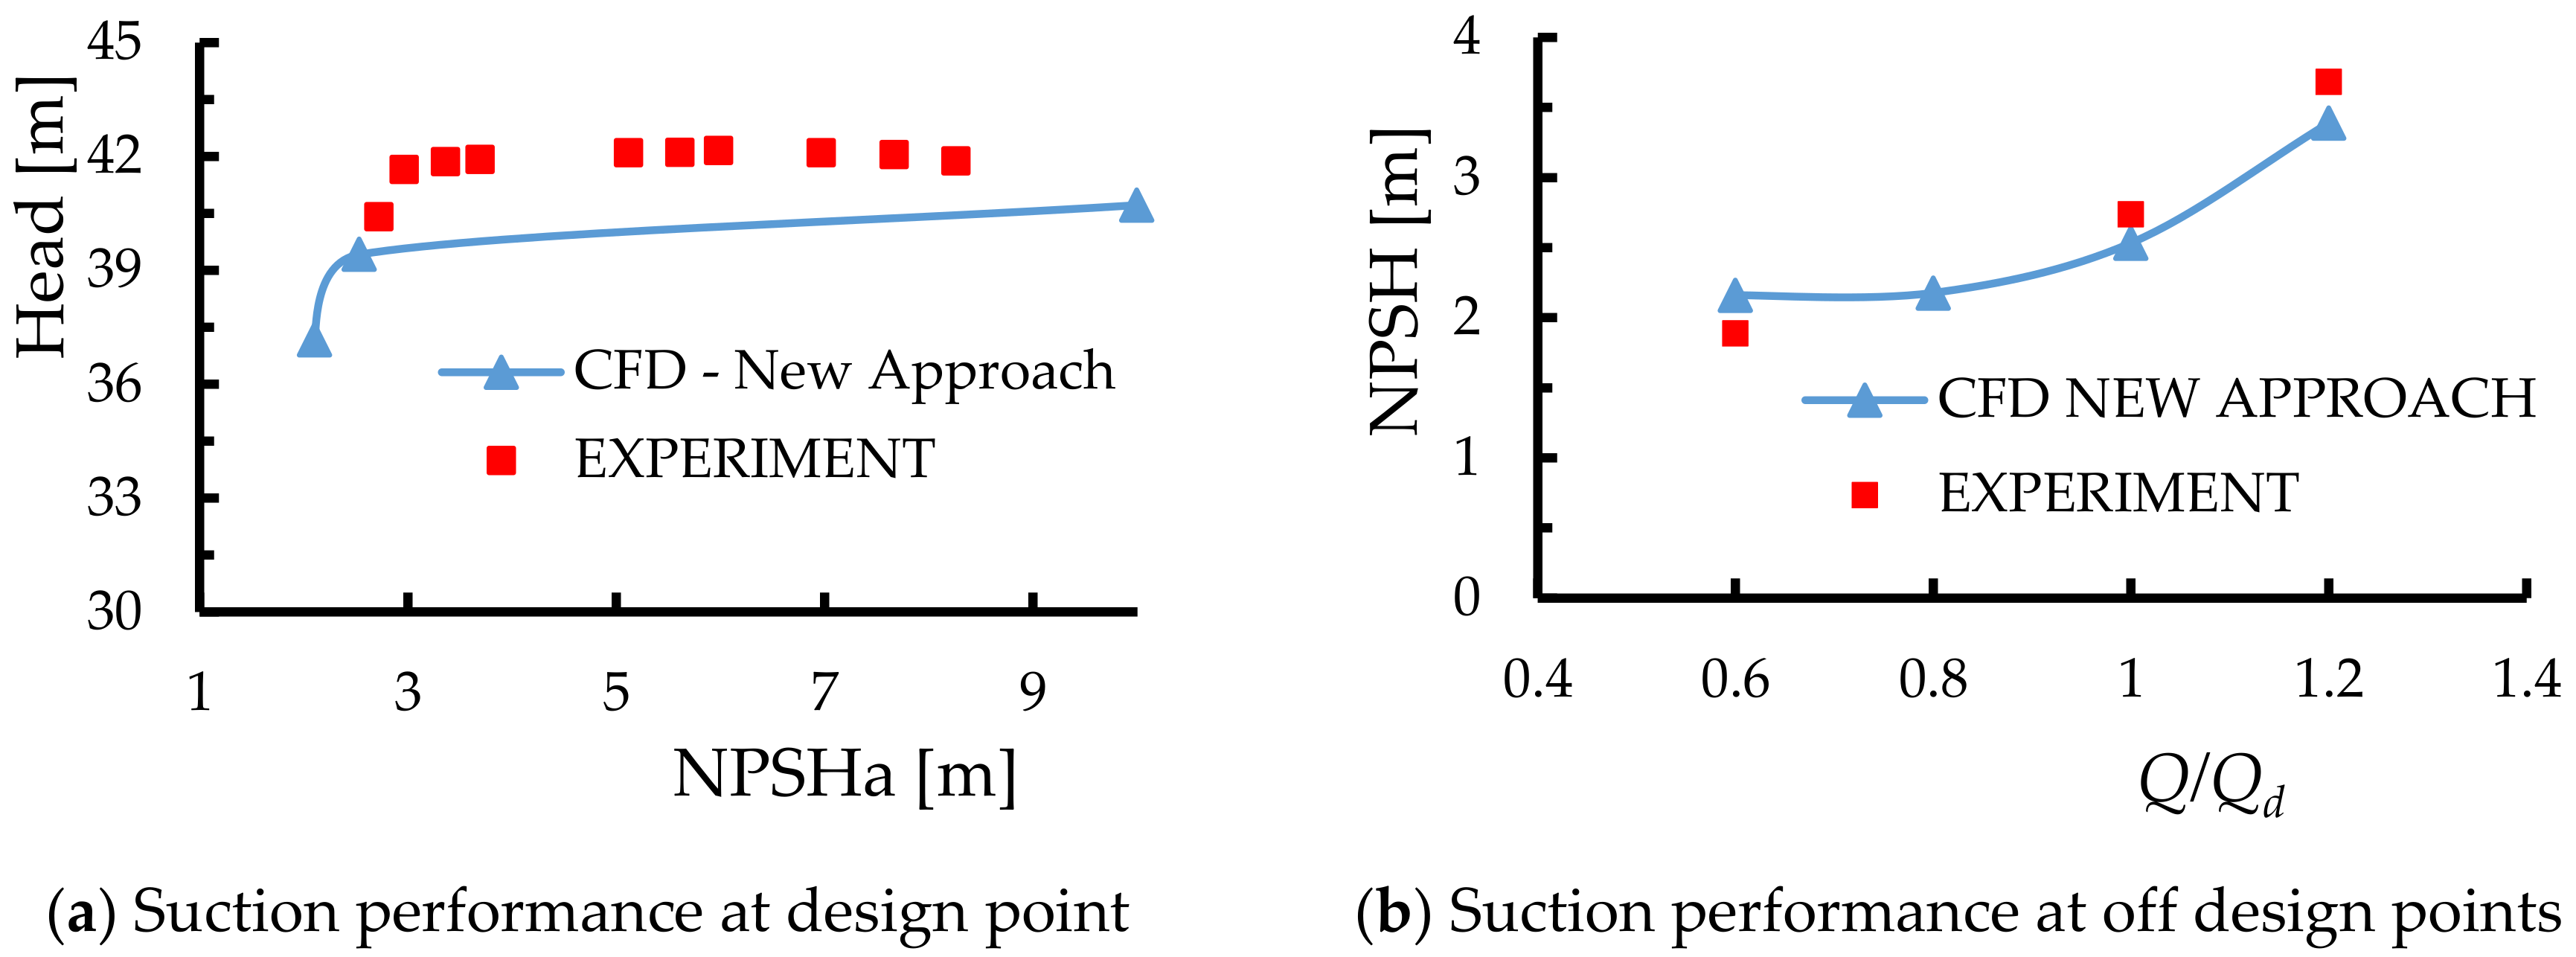
4.2. Cavitation Model Validation
4.3. Results from Optimization Studies
4.3.1. Orthogonal Test Results
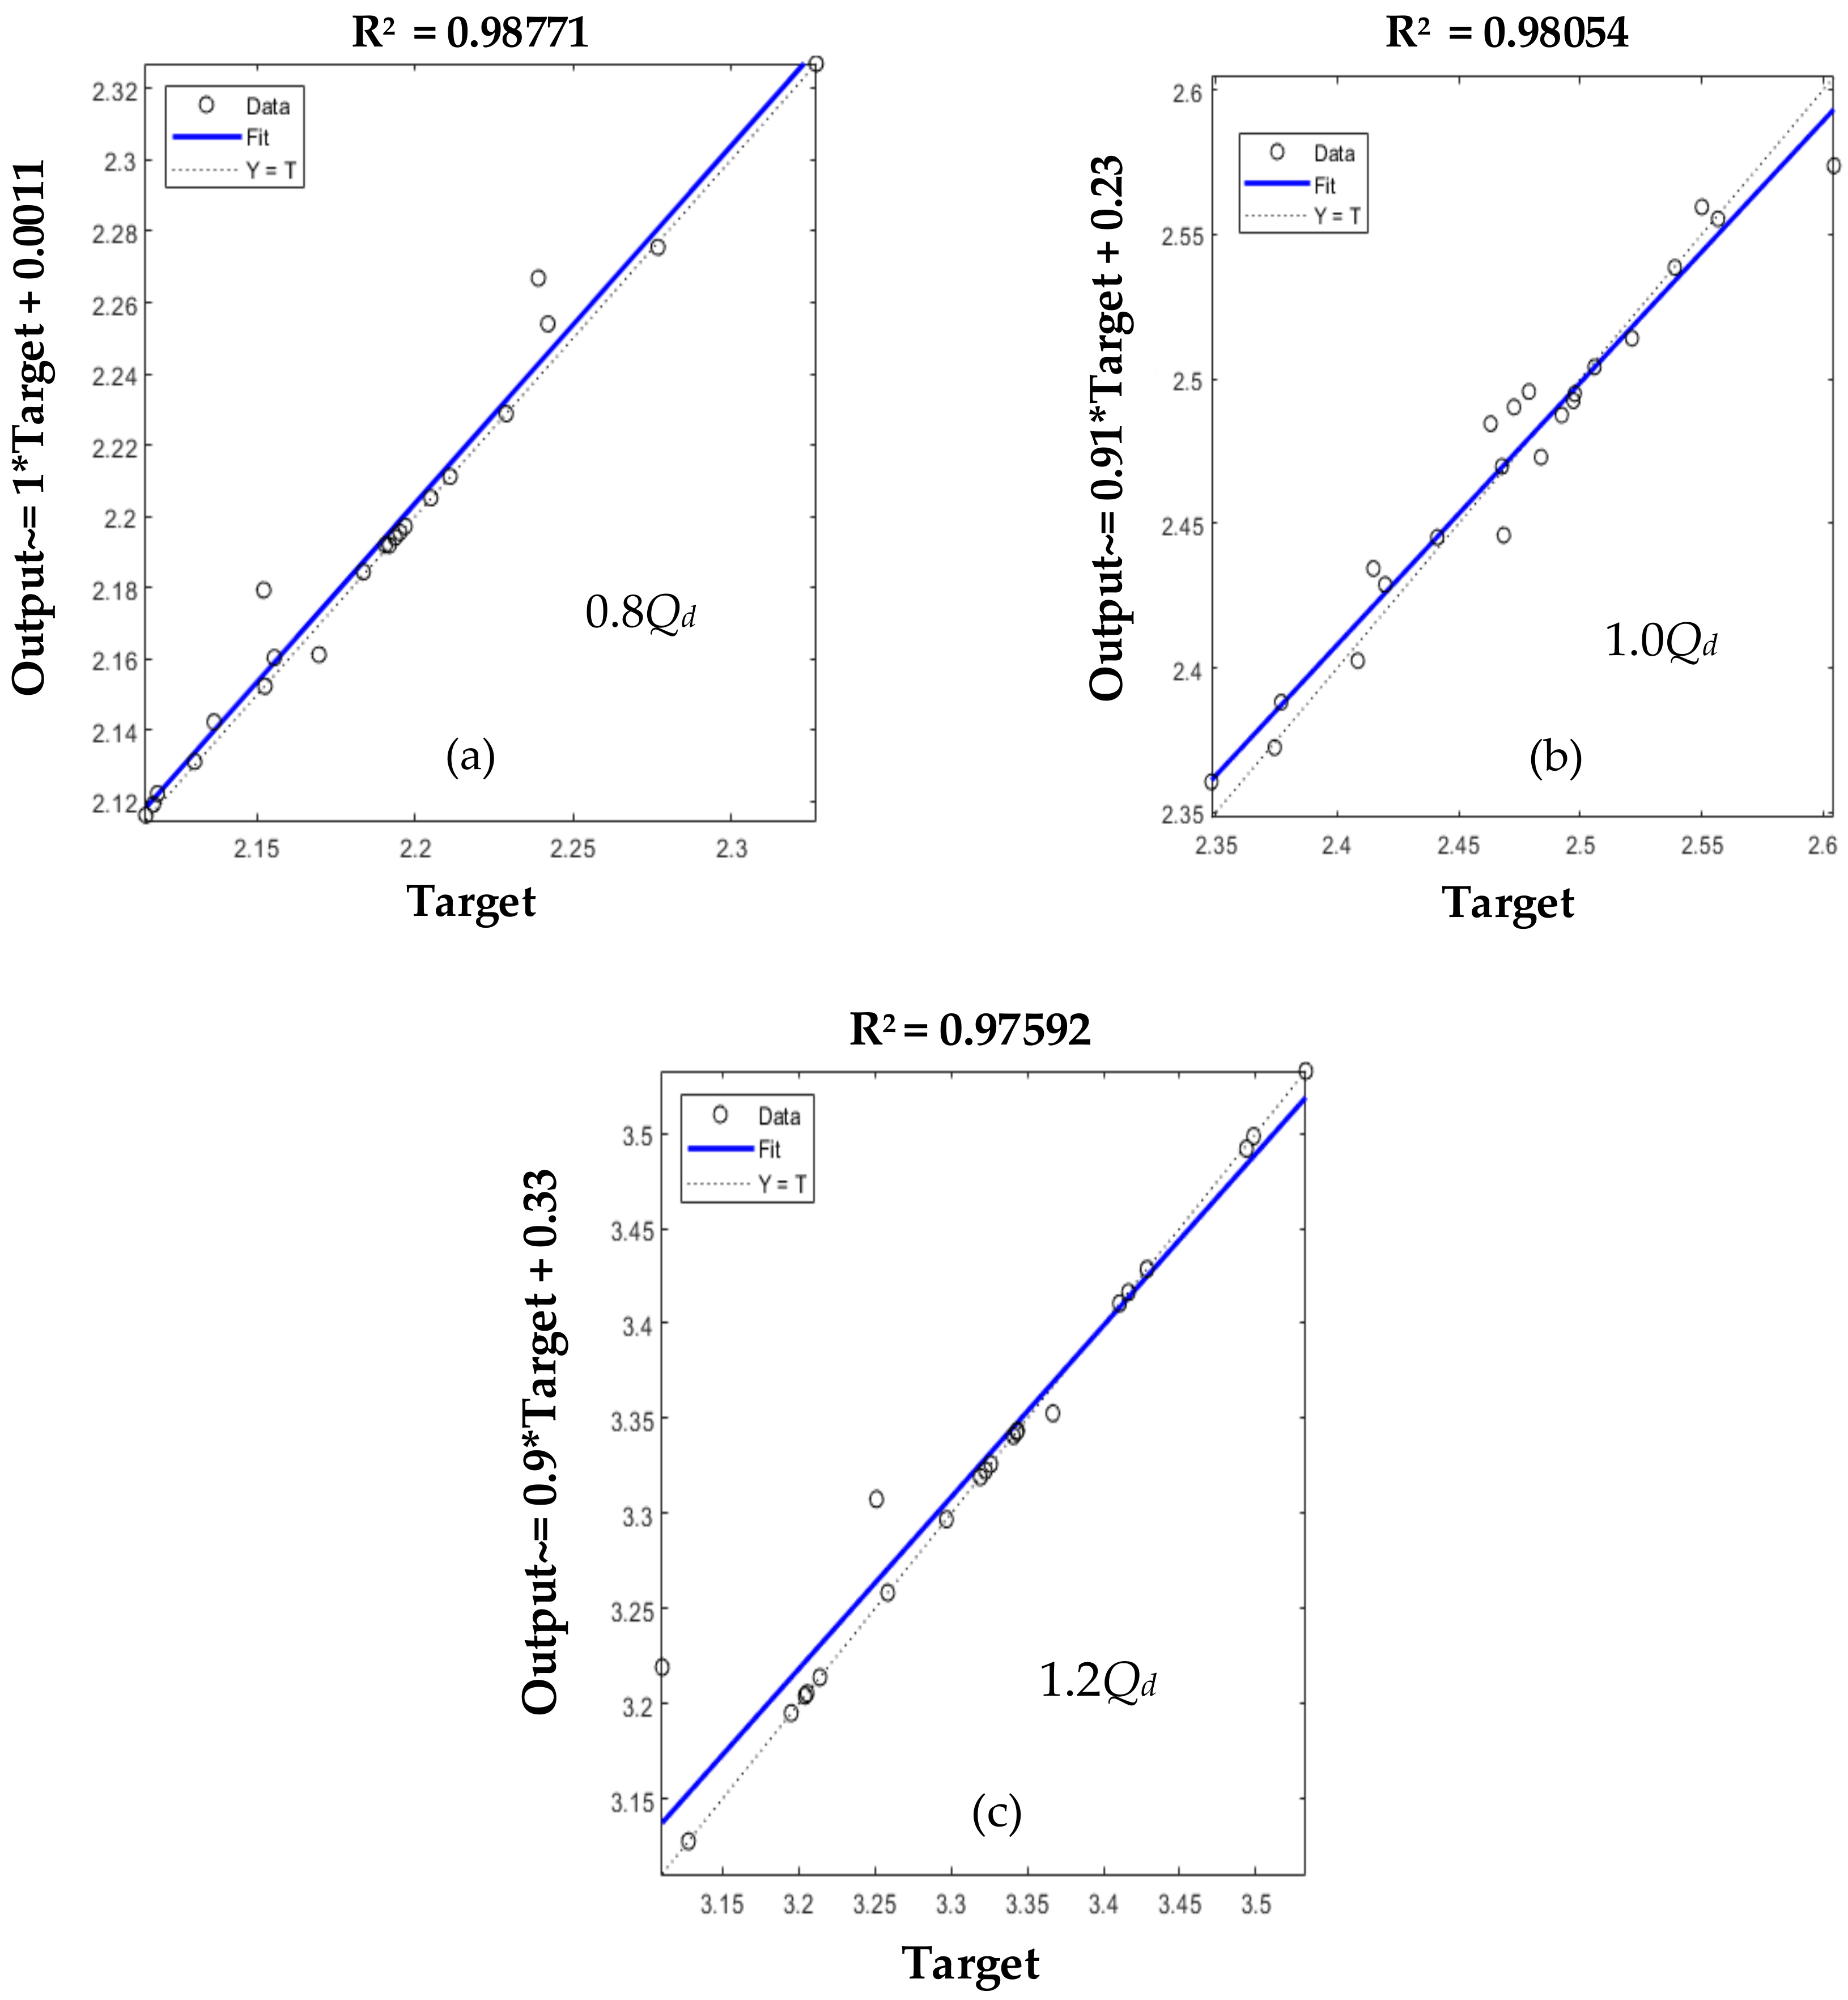
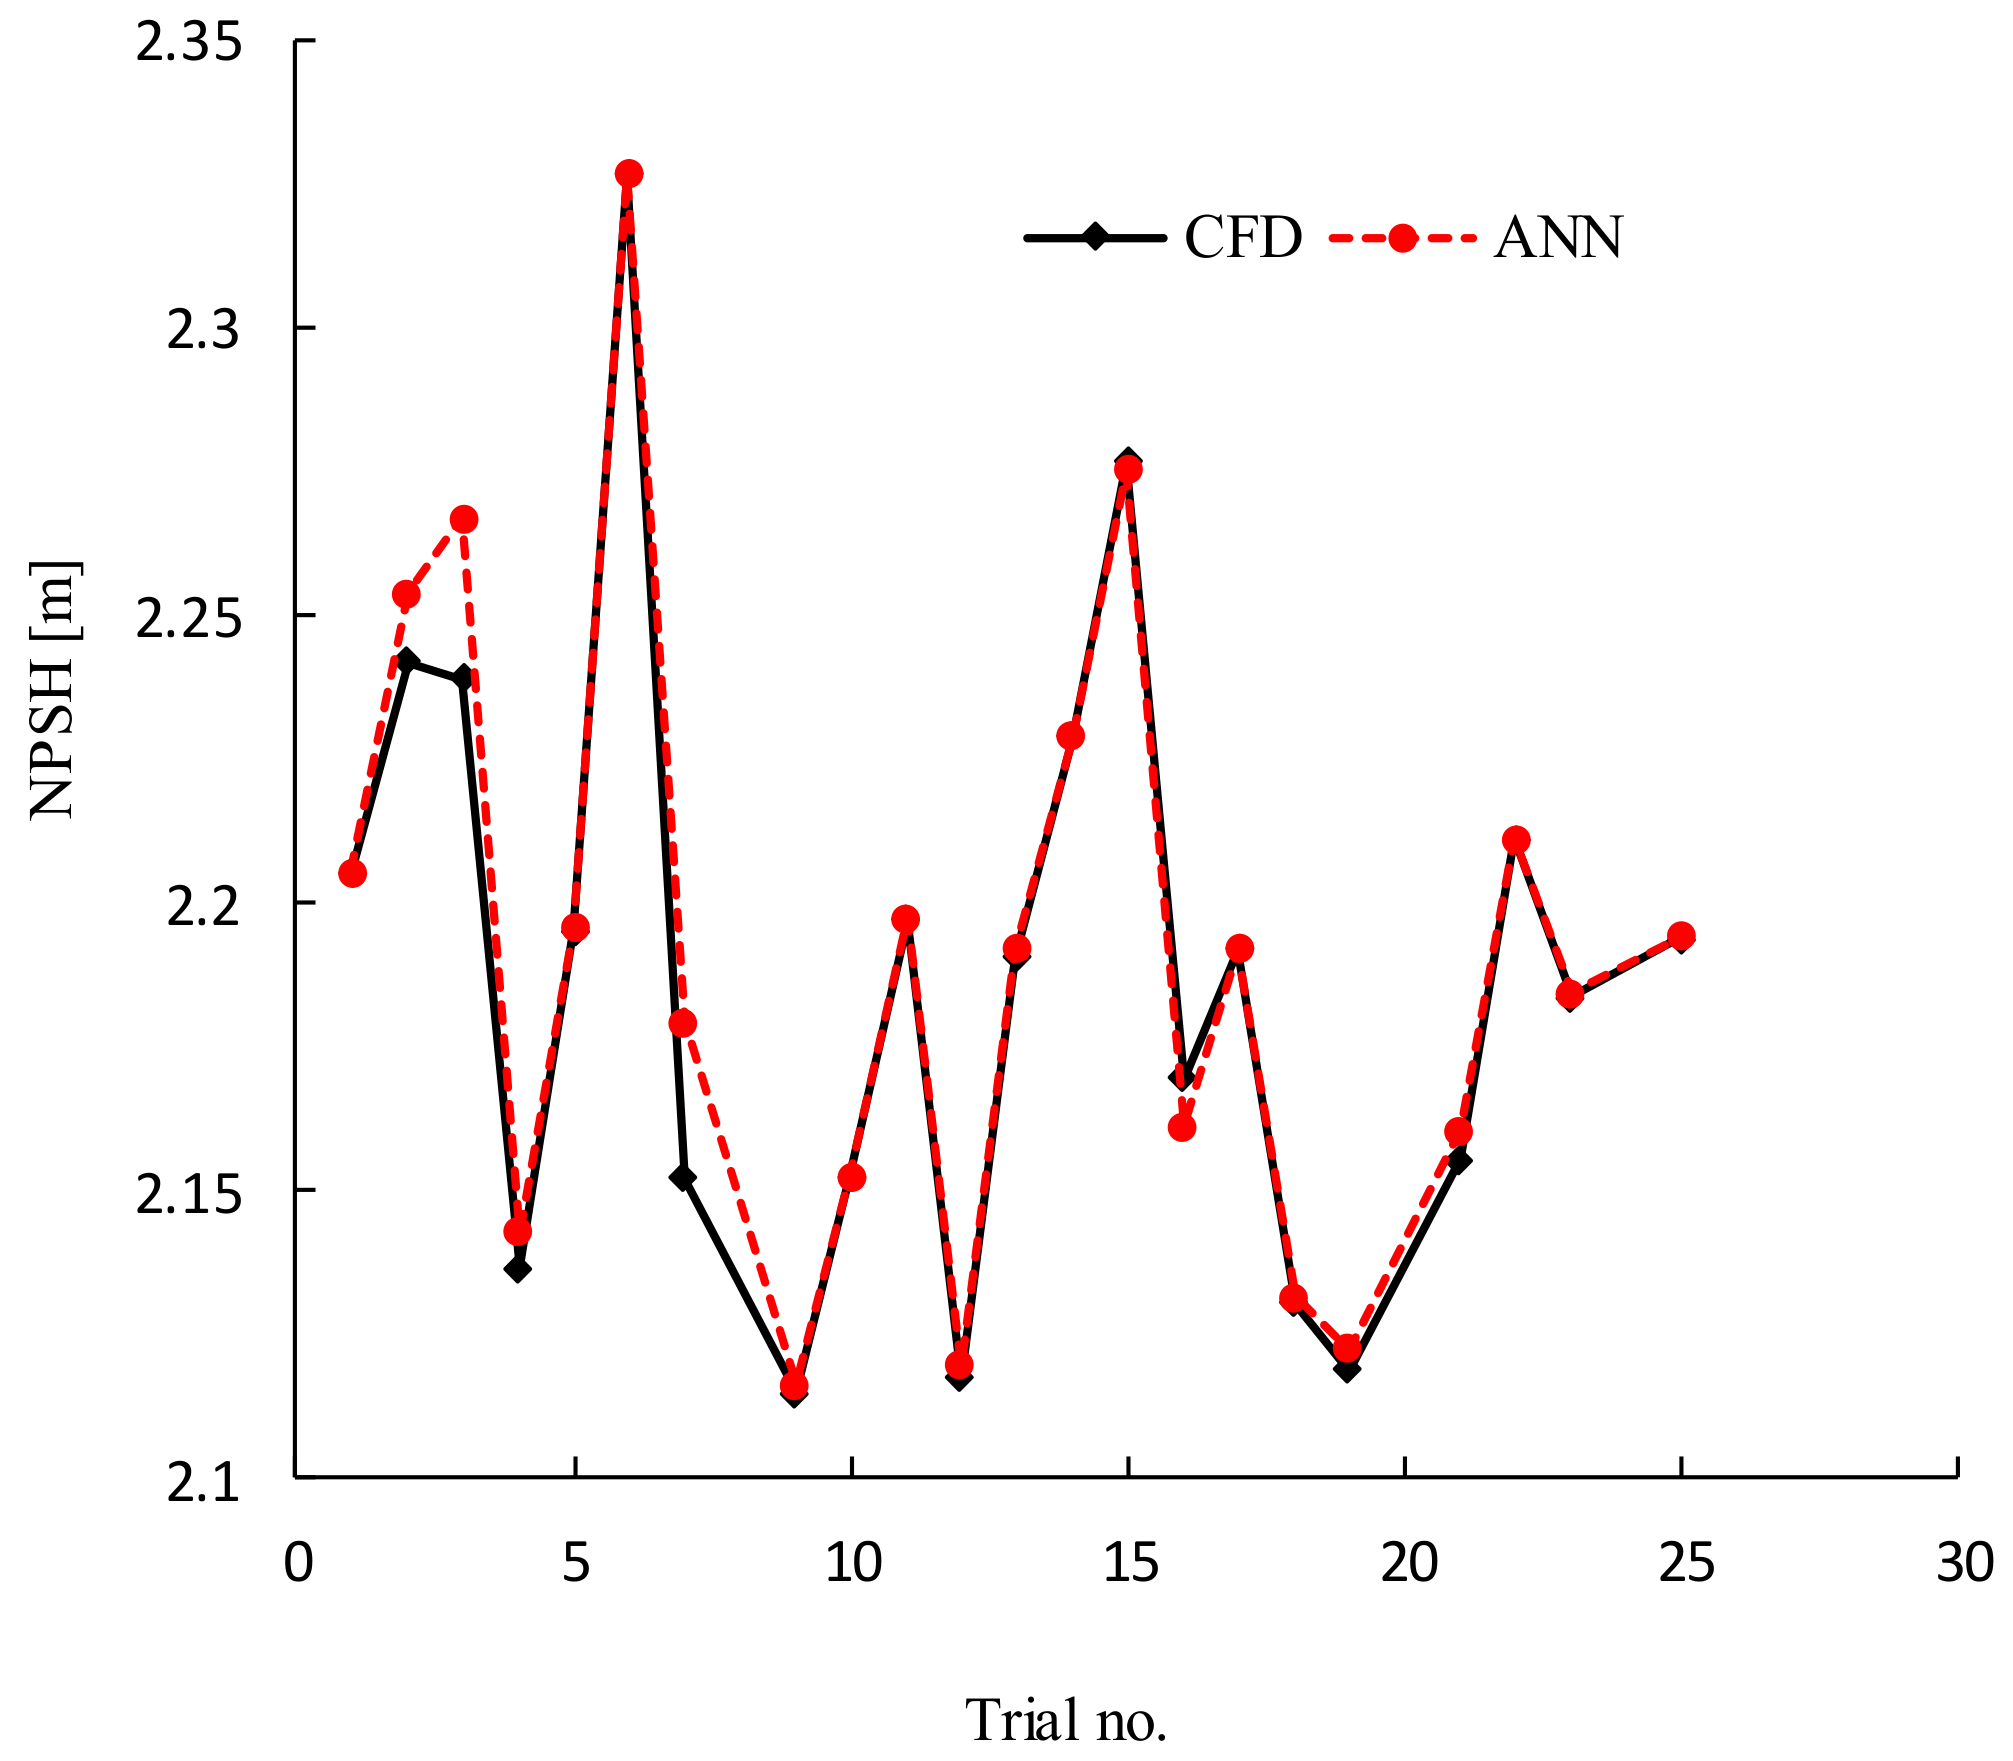
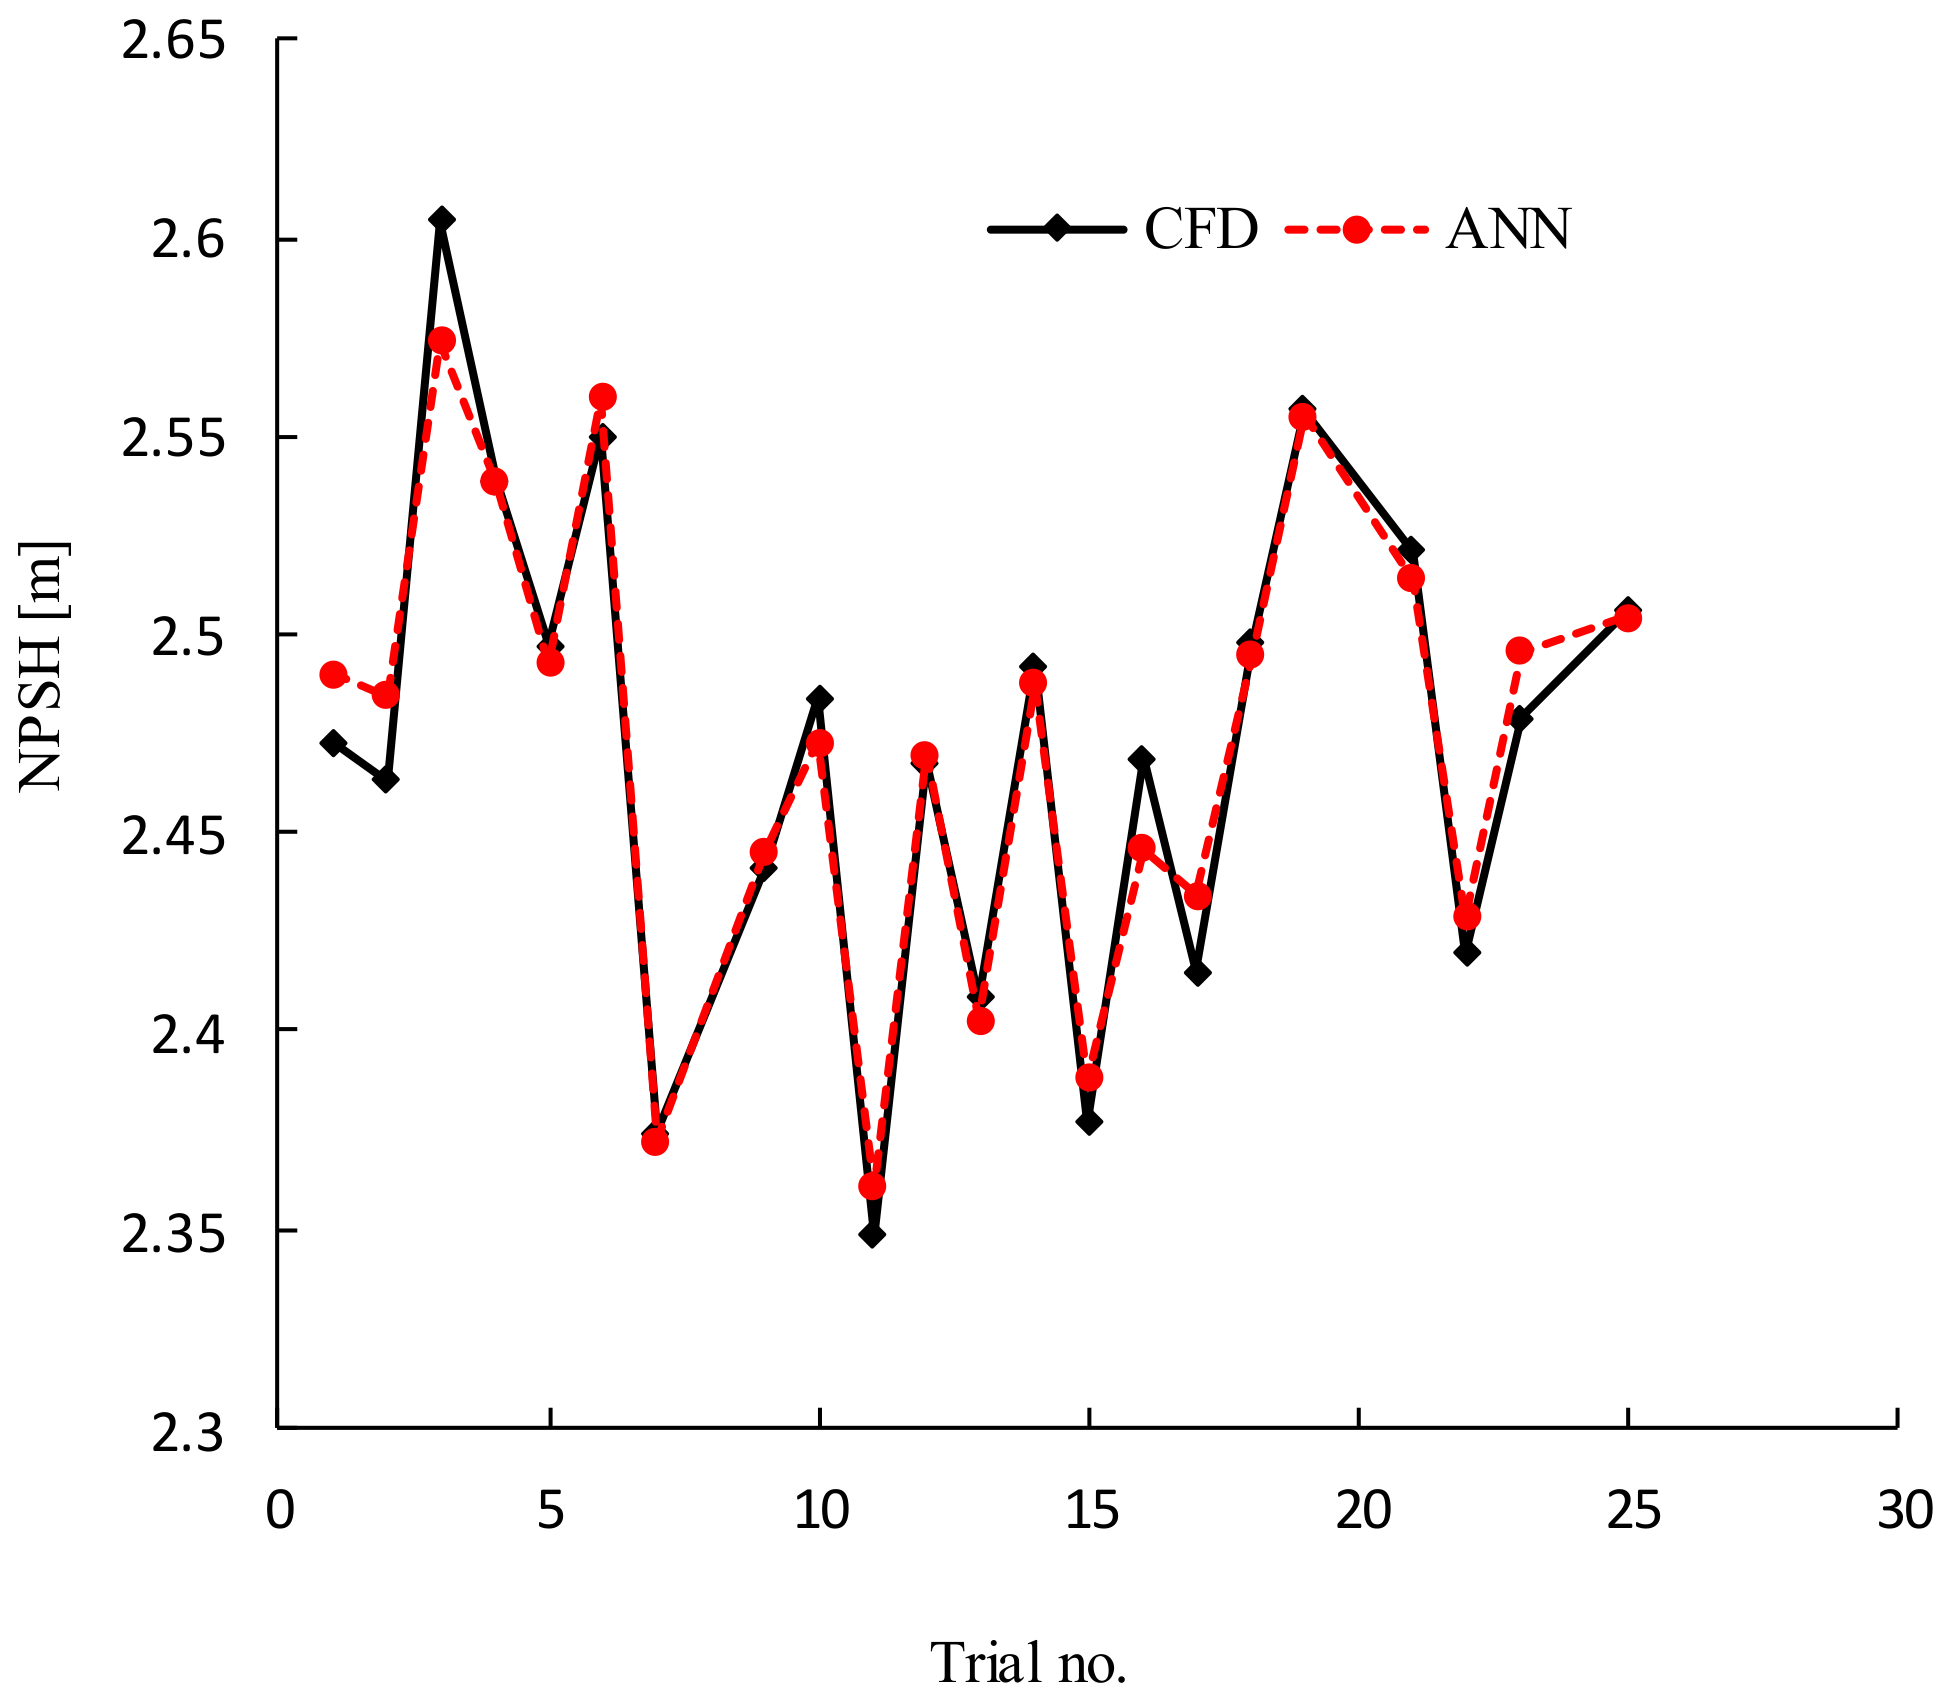
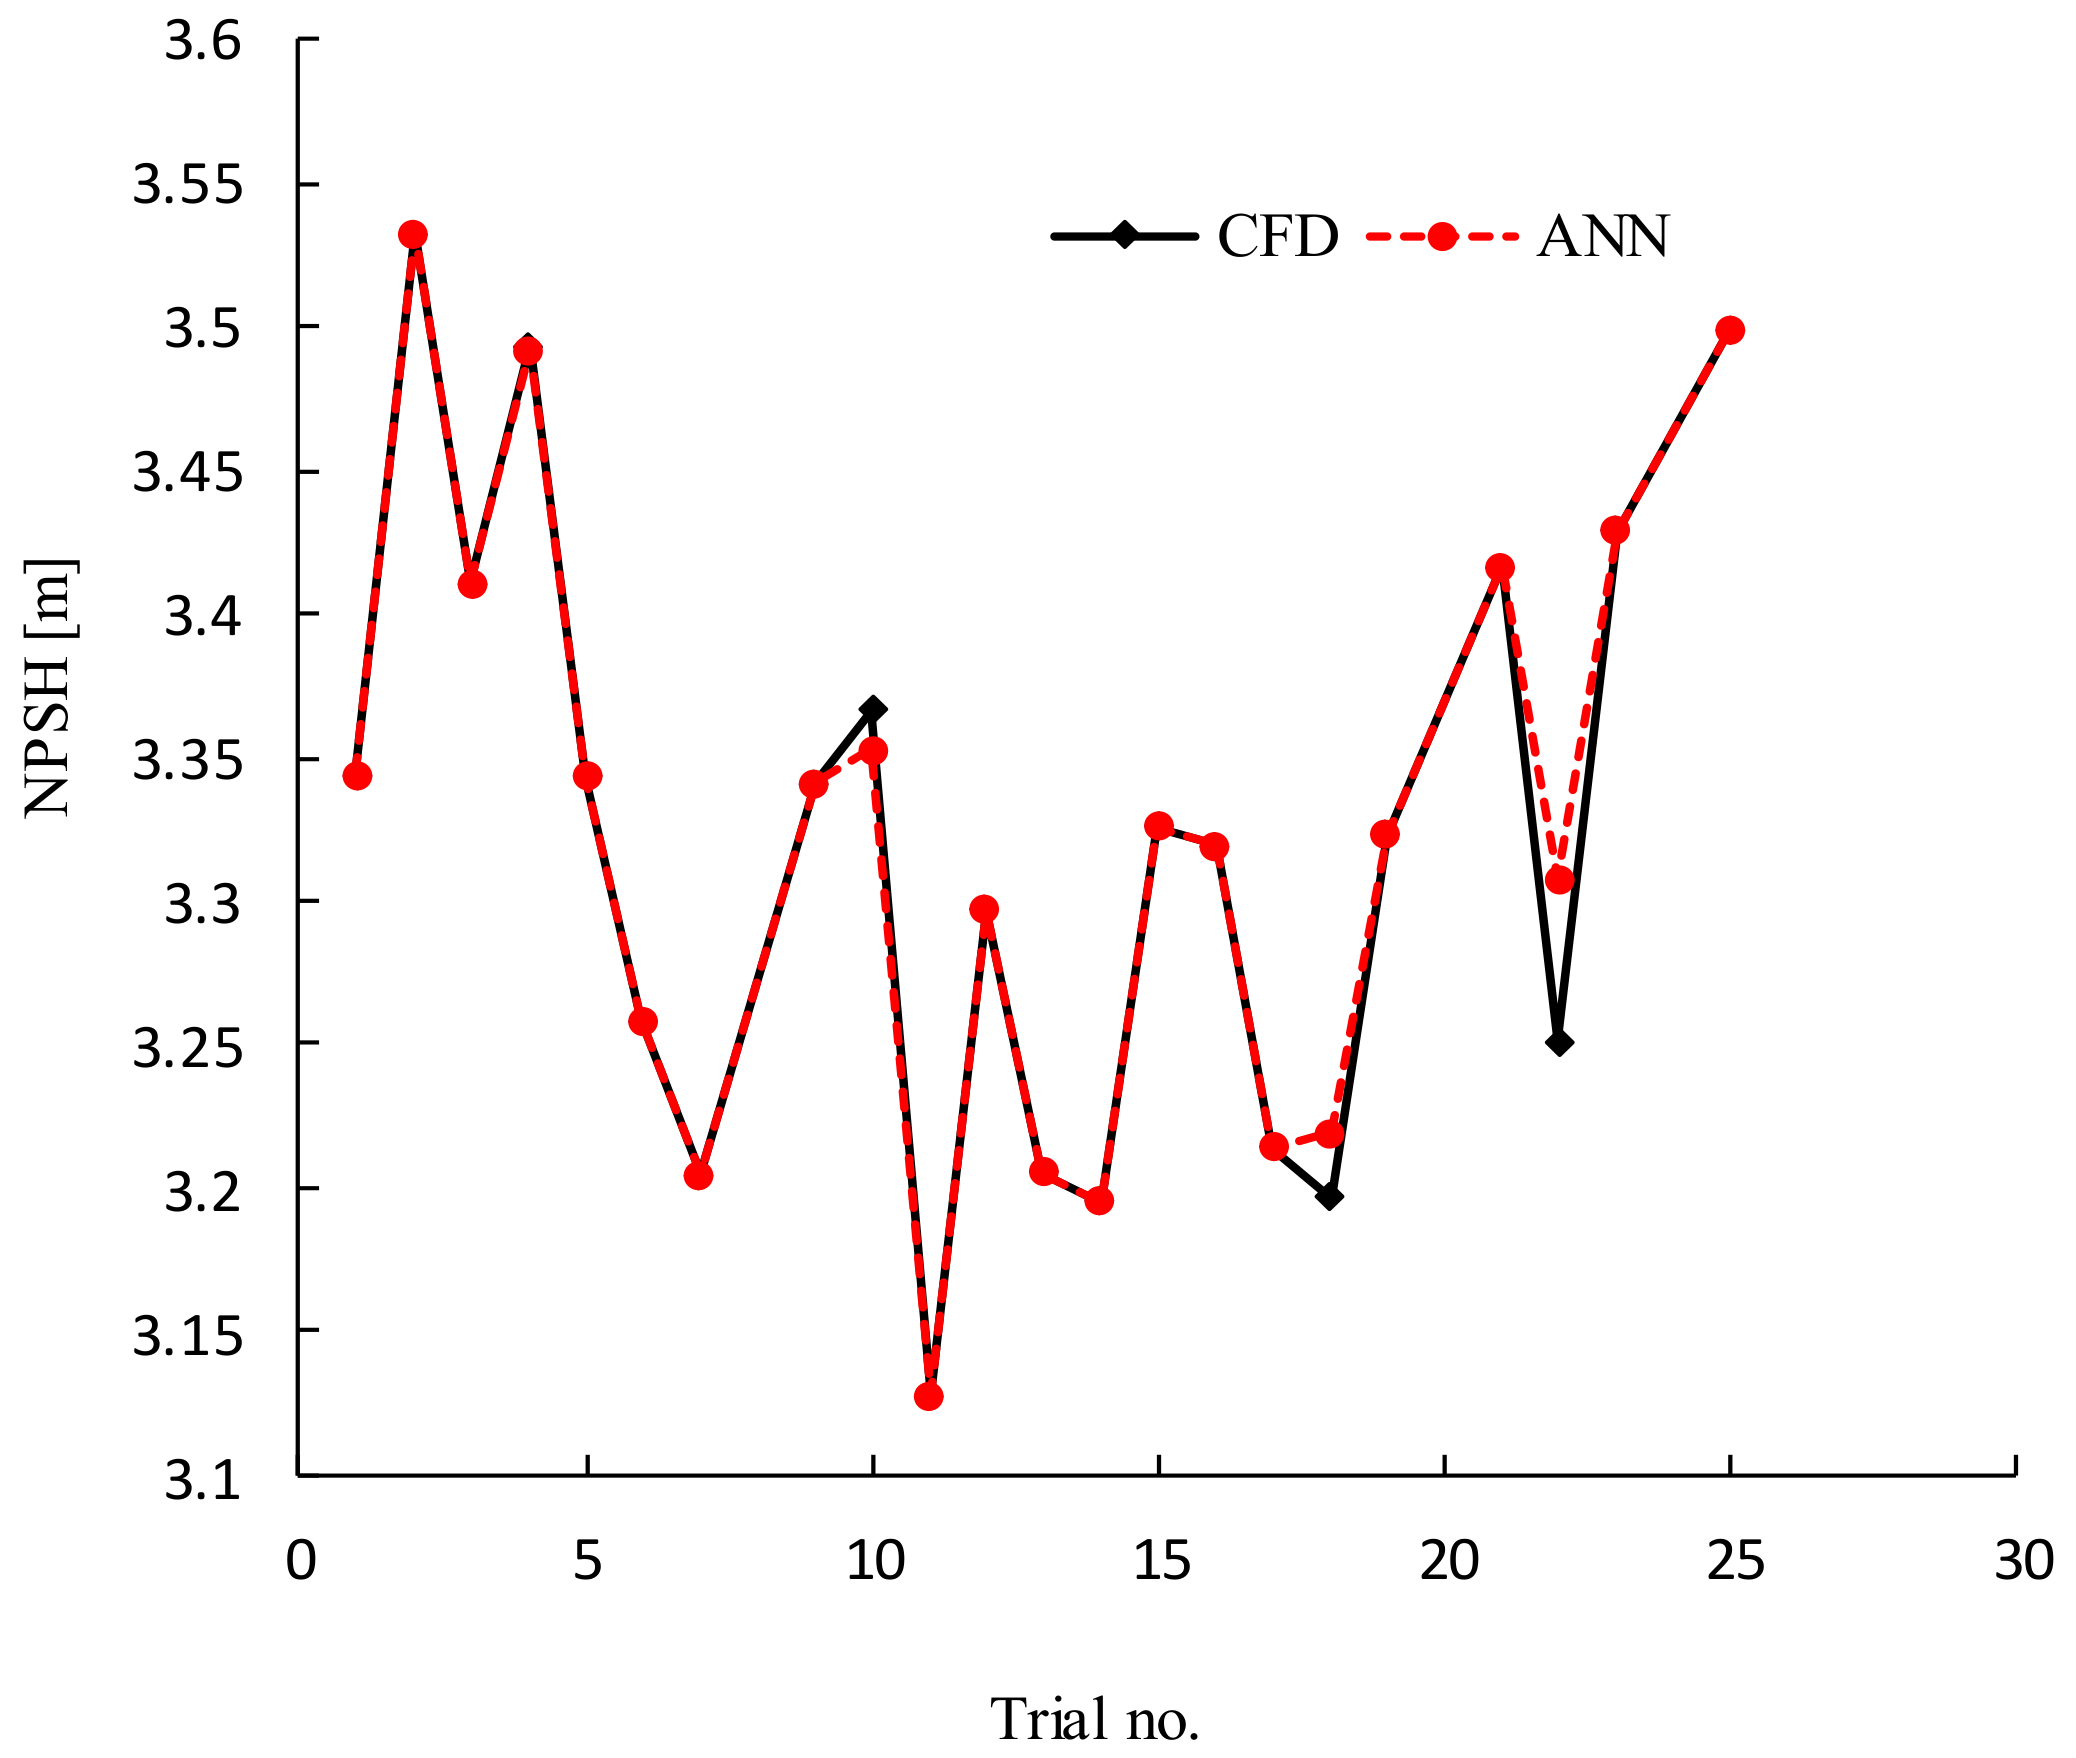
4.3.2. Training of Surrogate Model
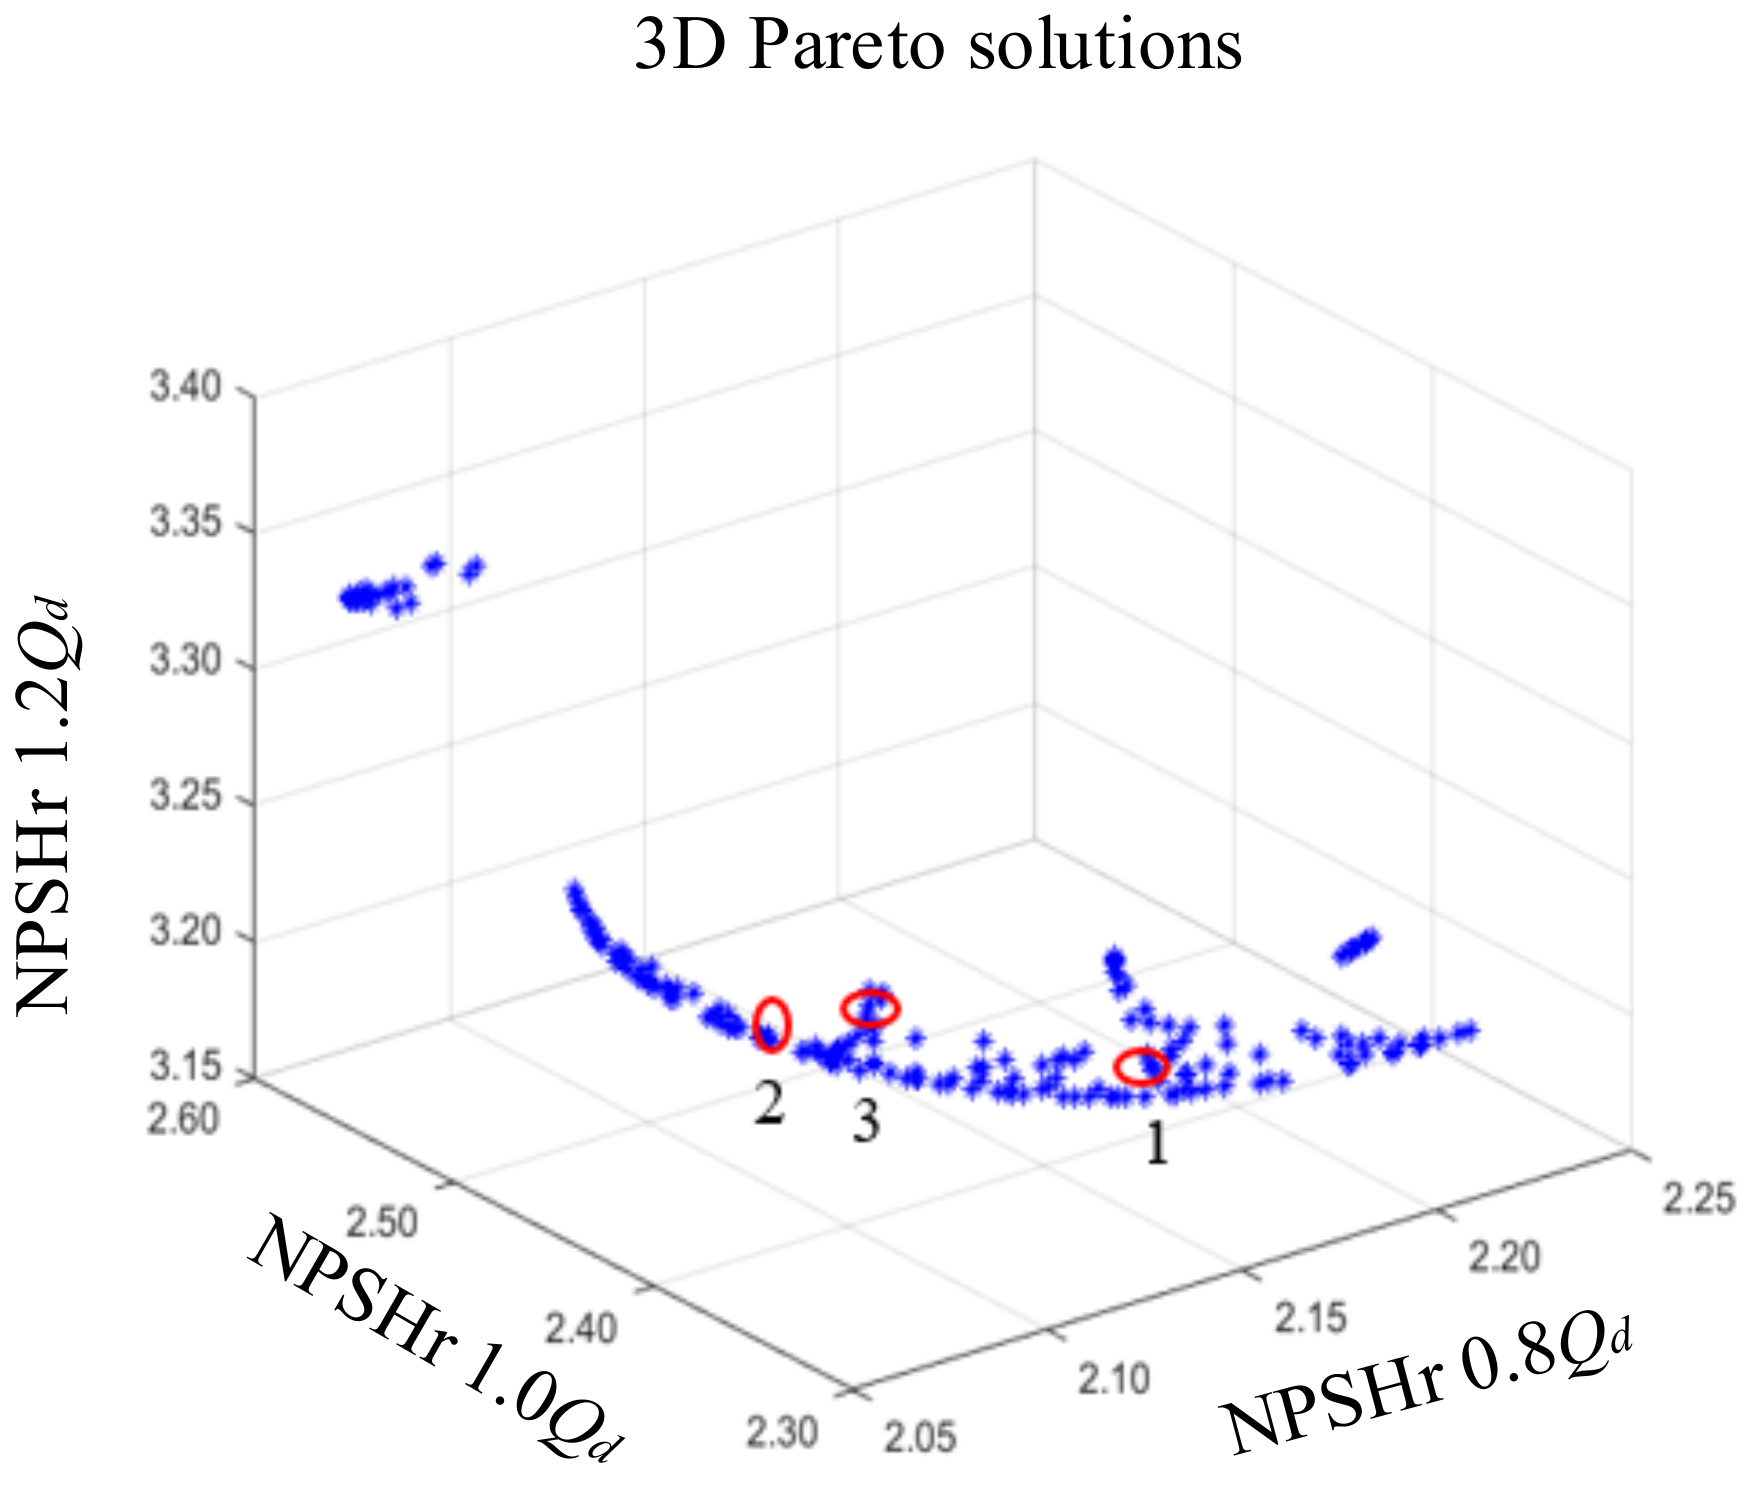
4.3.3. Solutions to the Three-Objective Problem
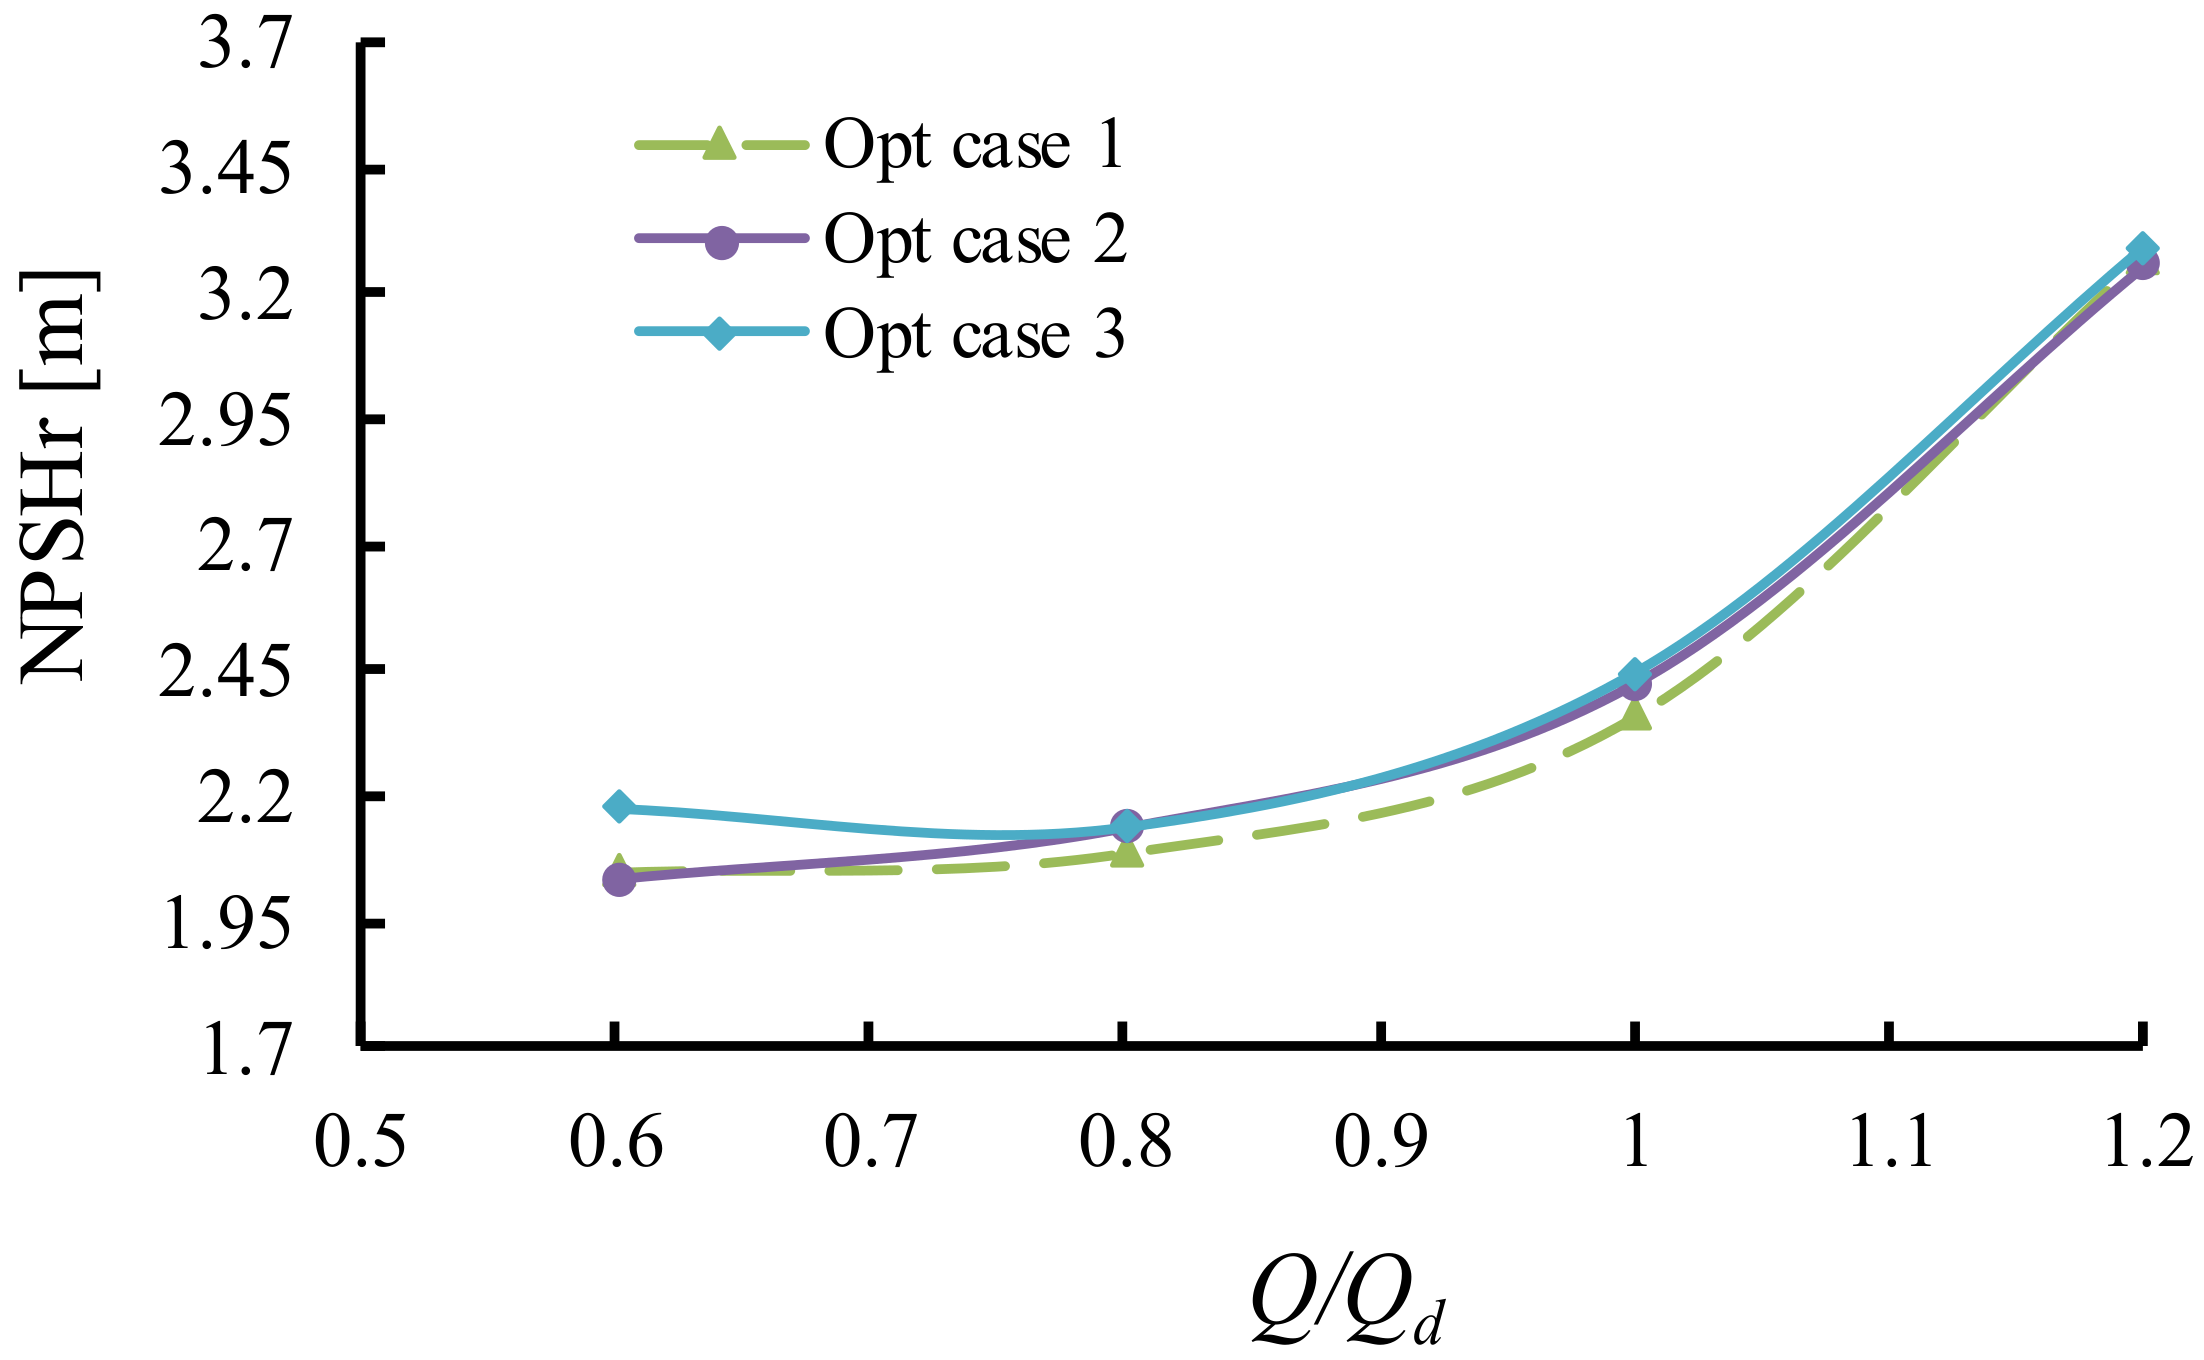
4.3.4. Comparison of Suction Performance—Optimized and Original Design
4.3.5. Internal Flow Analysis
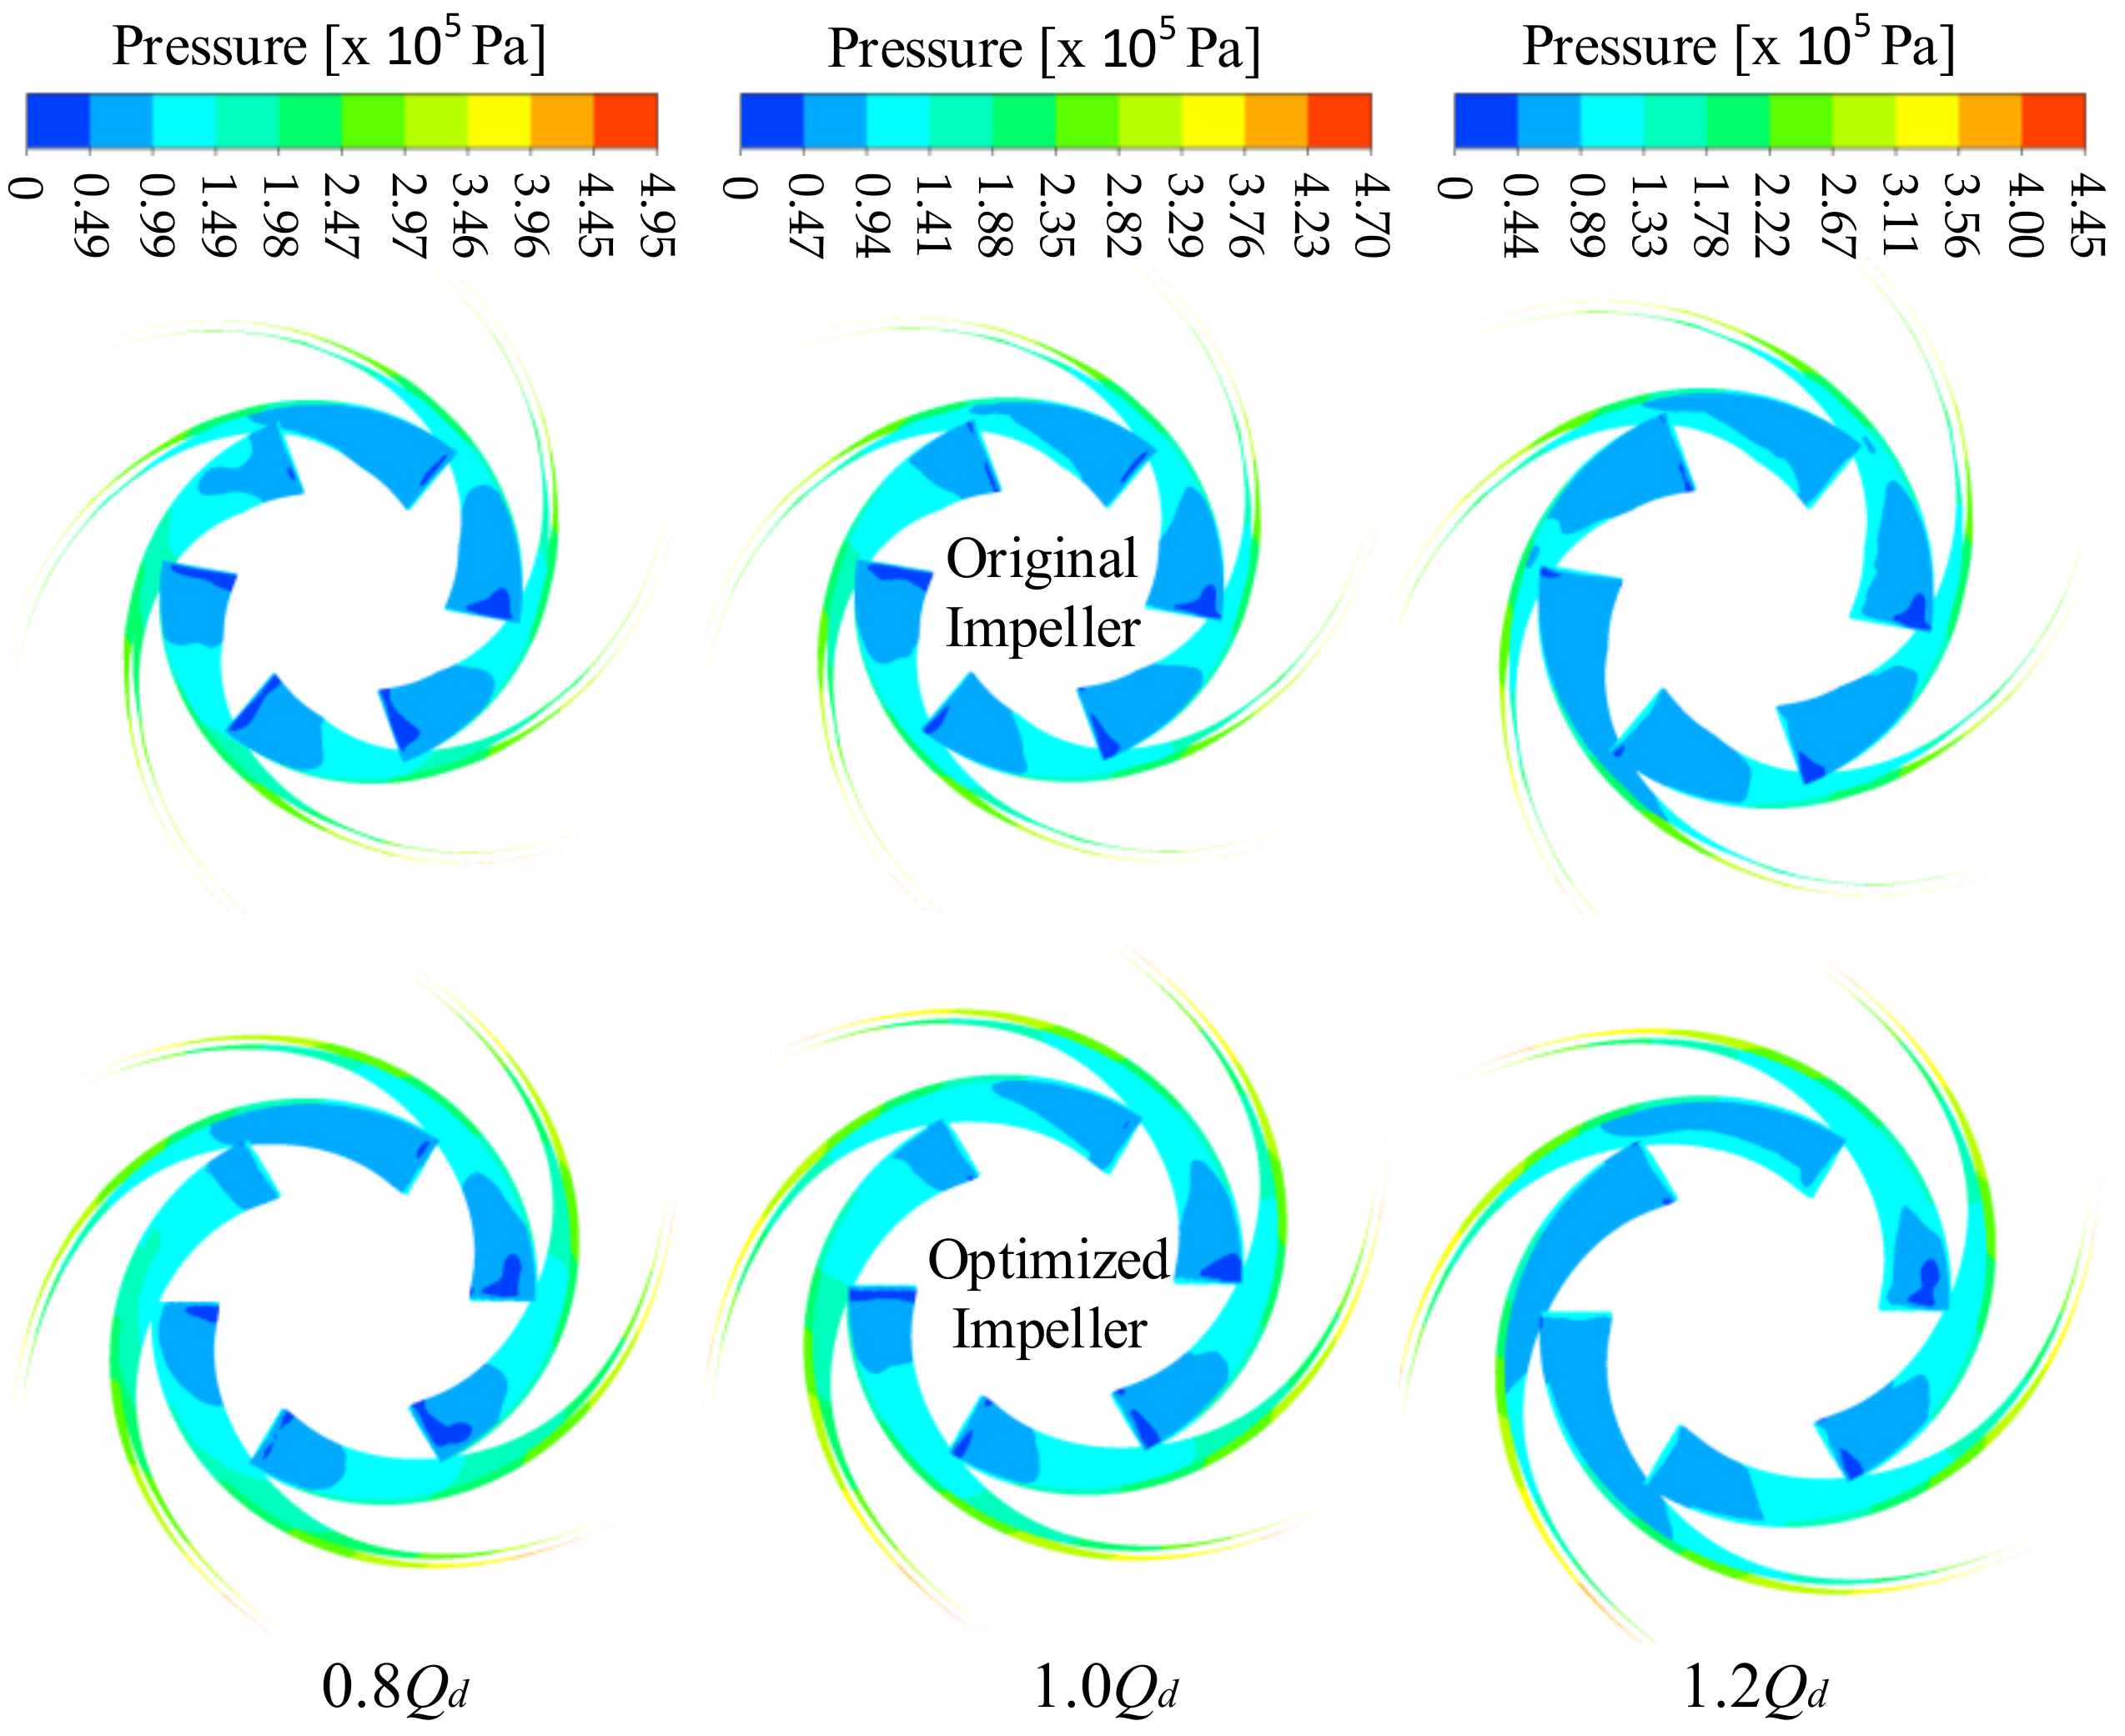
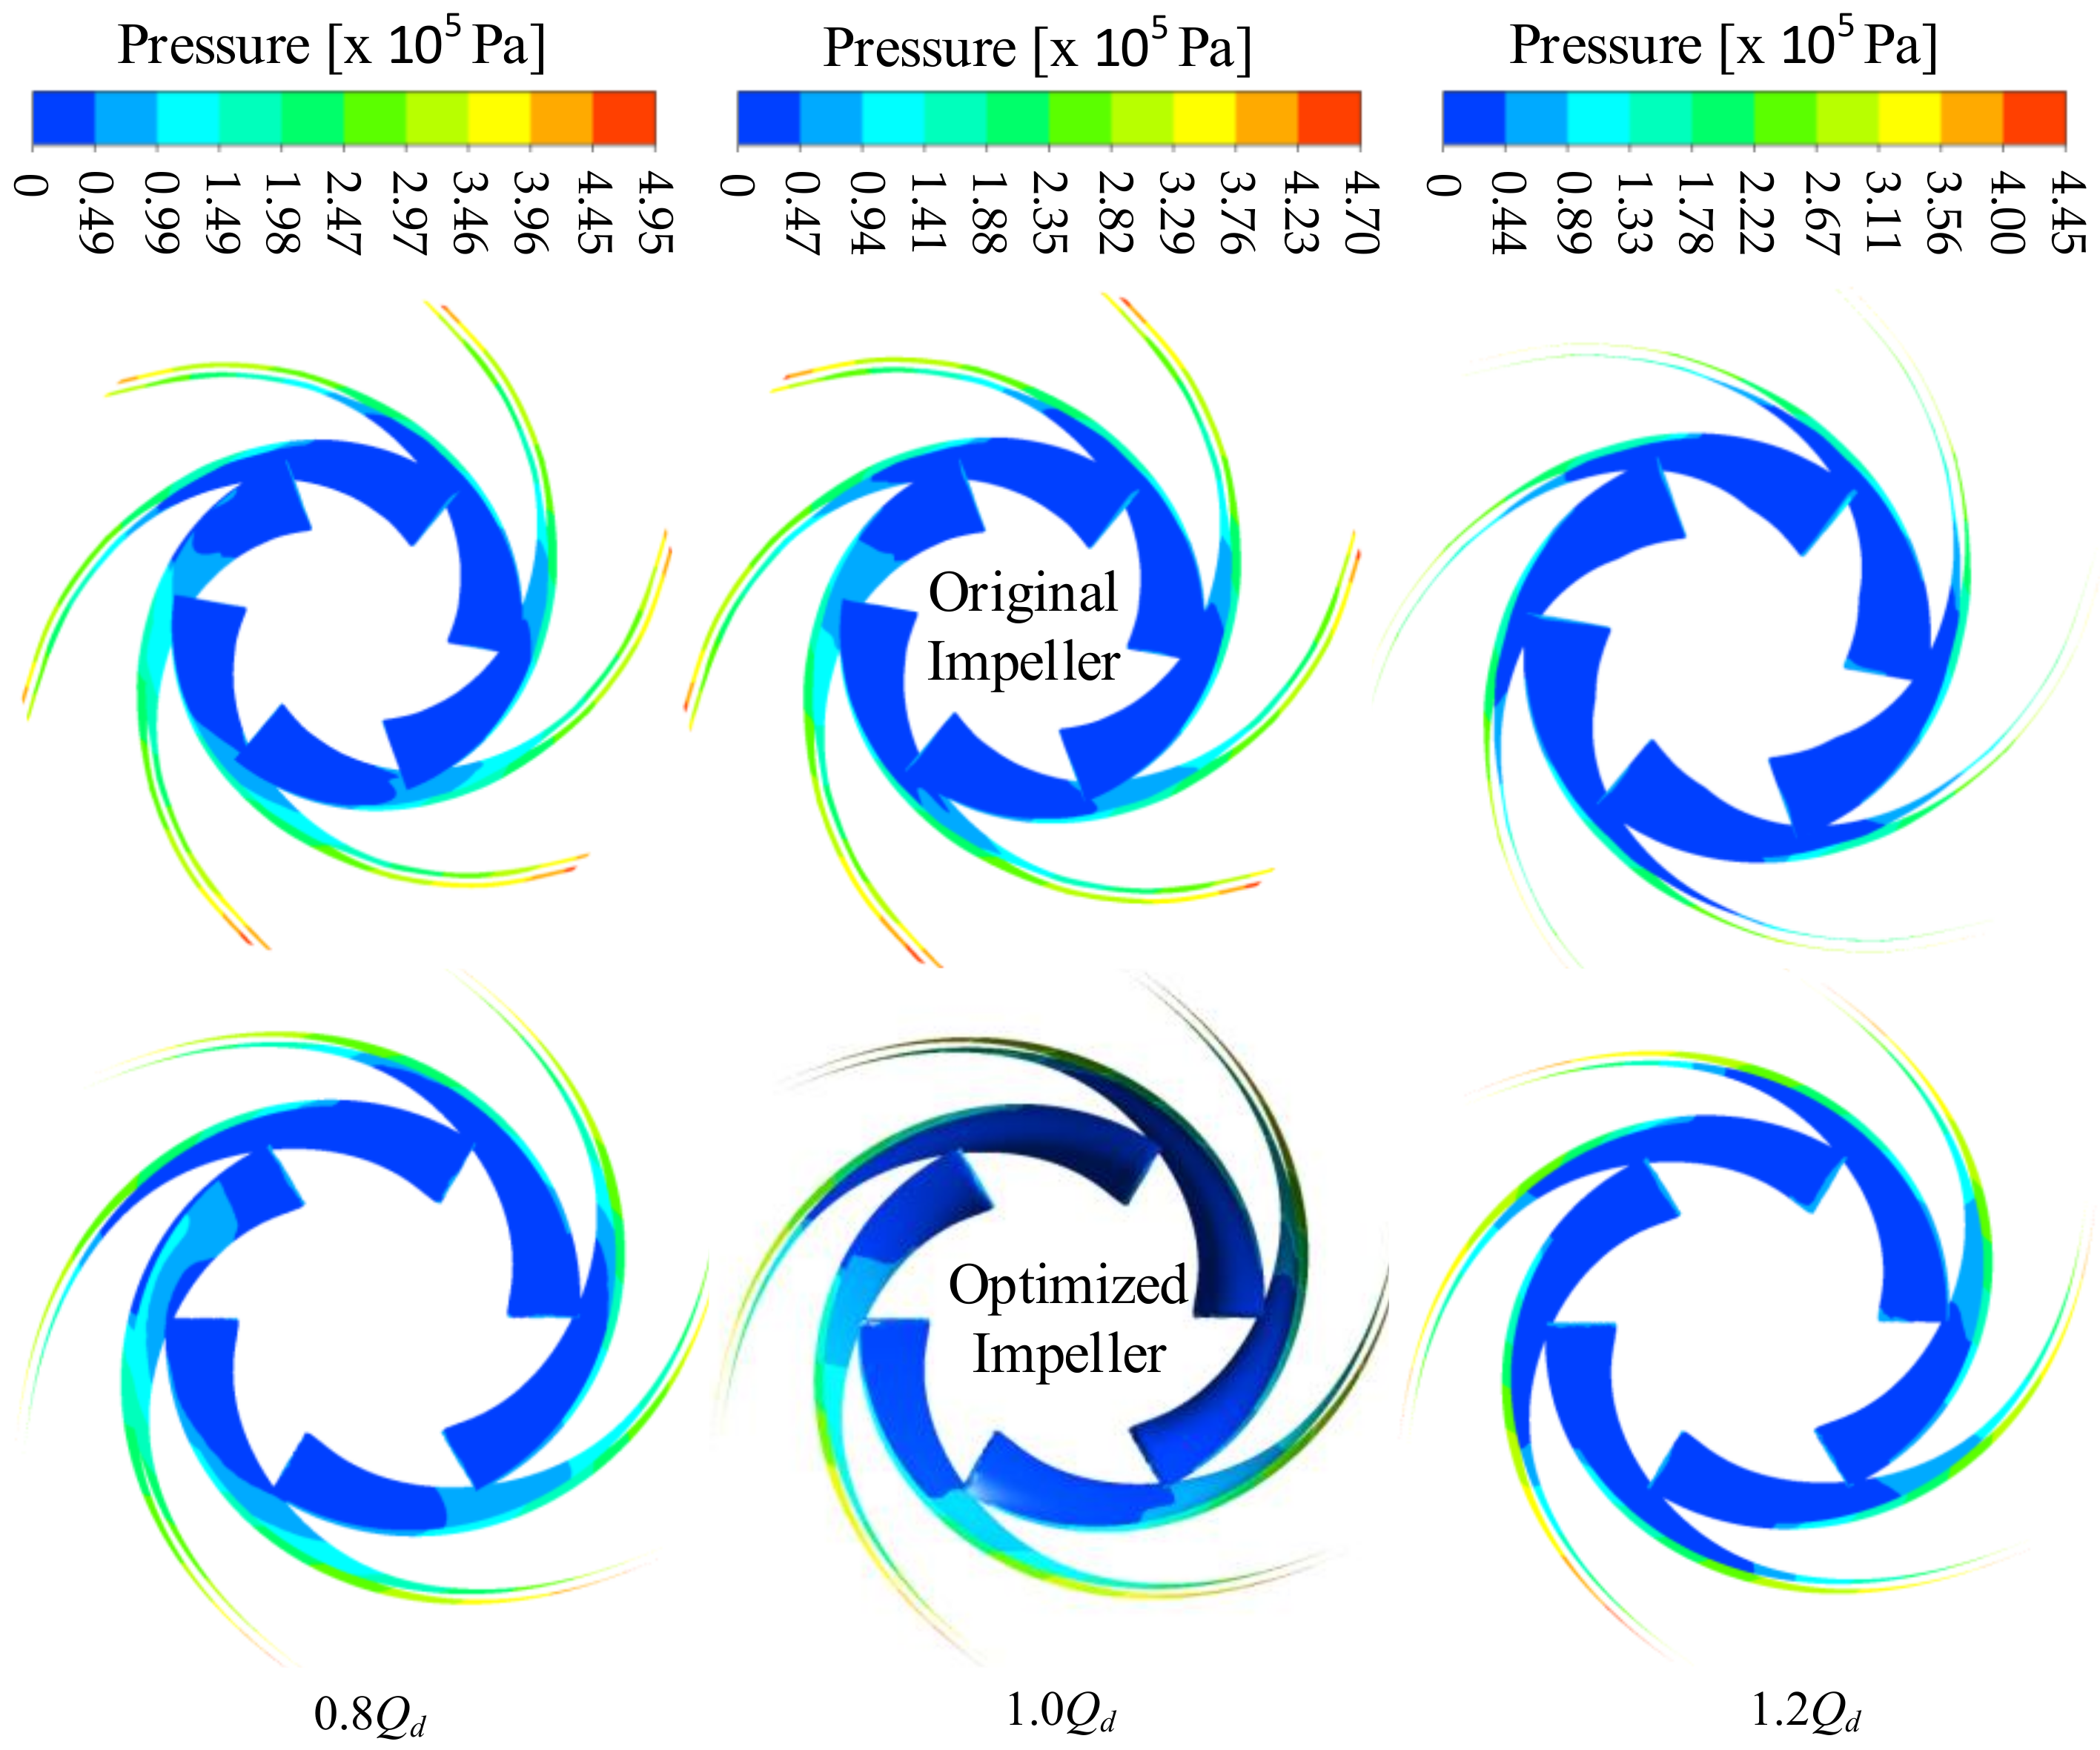
4.3.6. Attached Cavity Distribution in the Flow Domain
5. Conclusions
- For the best case, there was a 6.9% improvement of suction performance at the design point. At non-design flow conditions, the cavitation performance was improved by 3.5% at 1.2Qd overload condition, 4% at 0.8Qd, and 5% at 0.6Qd.
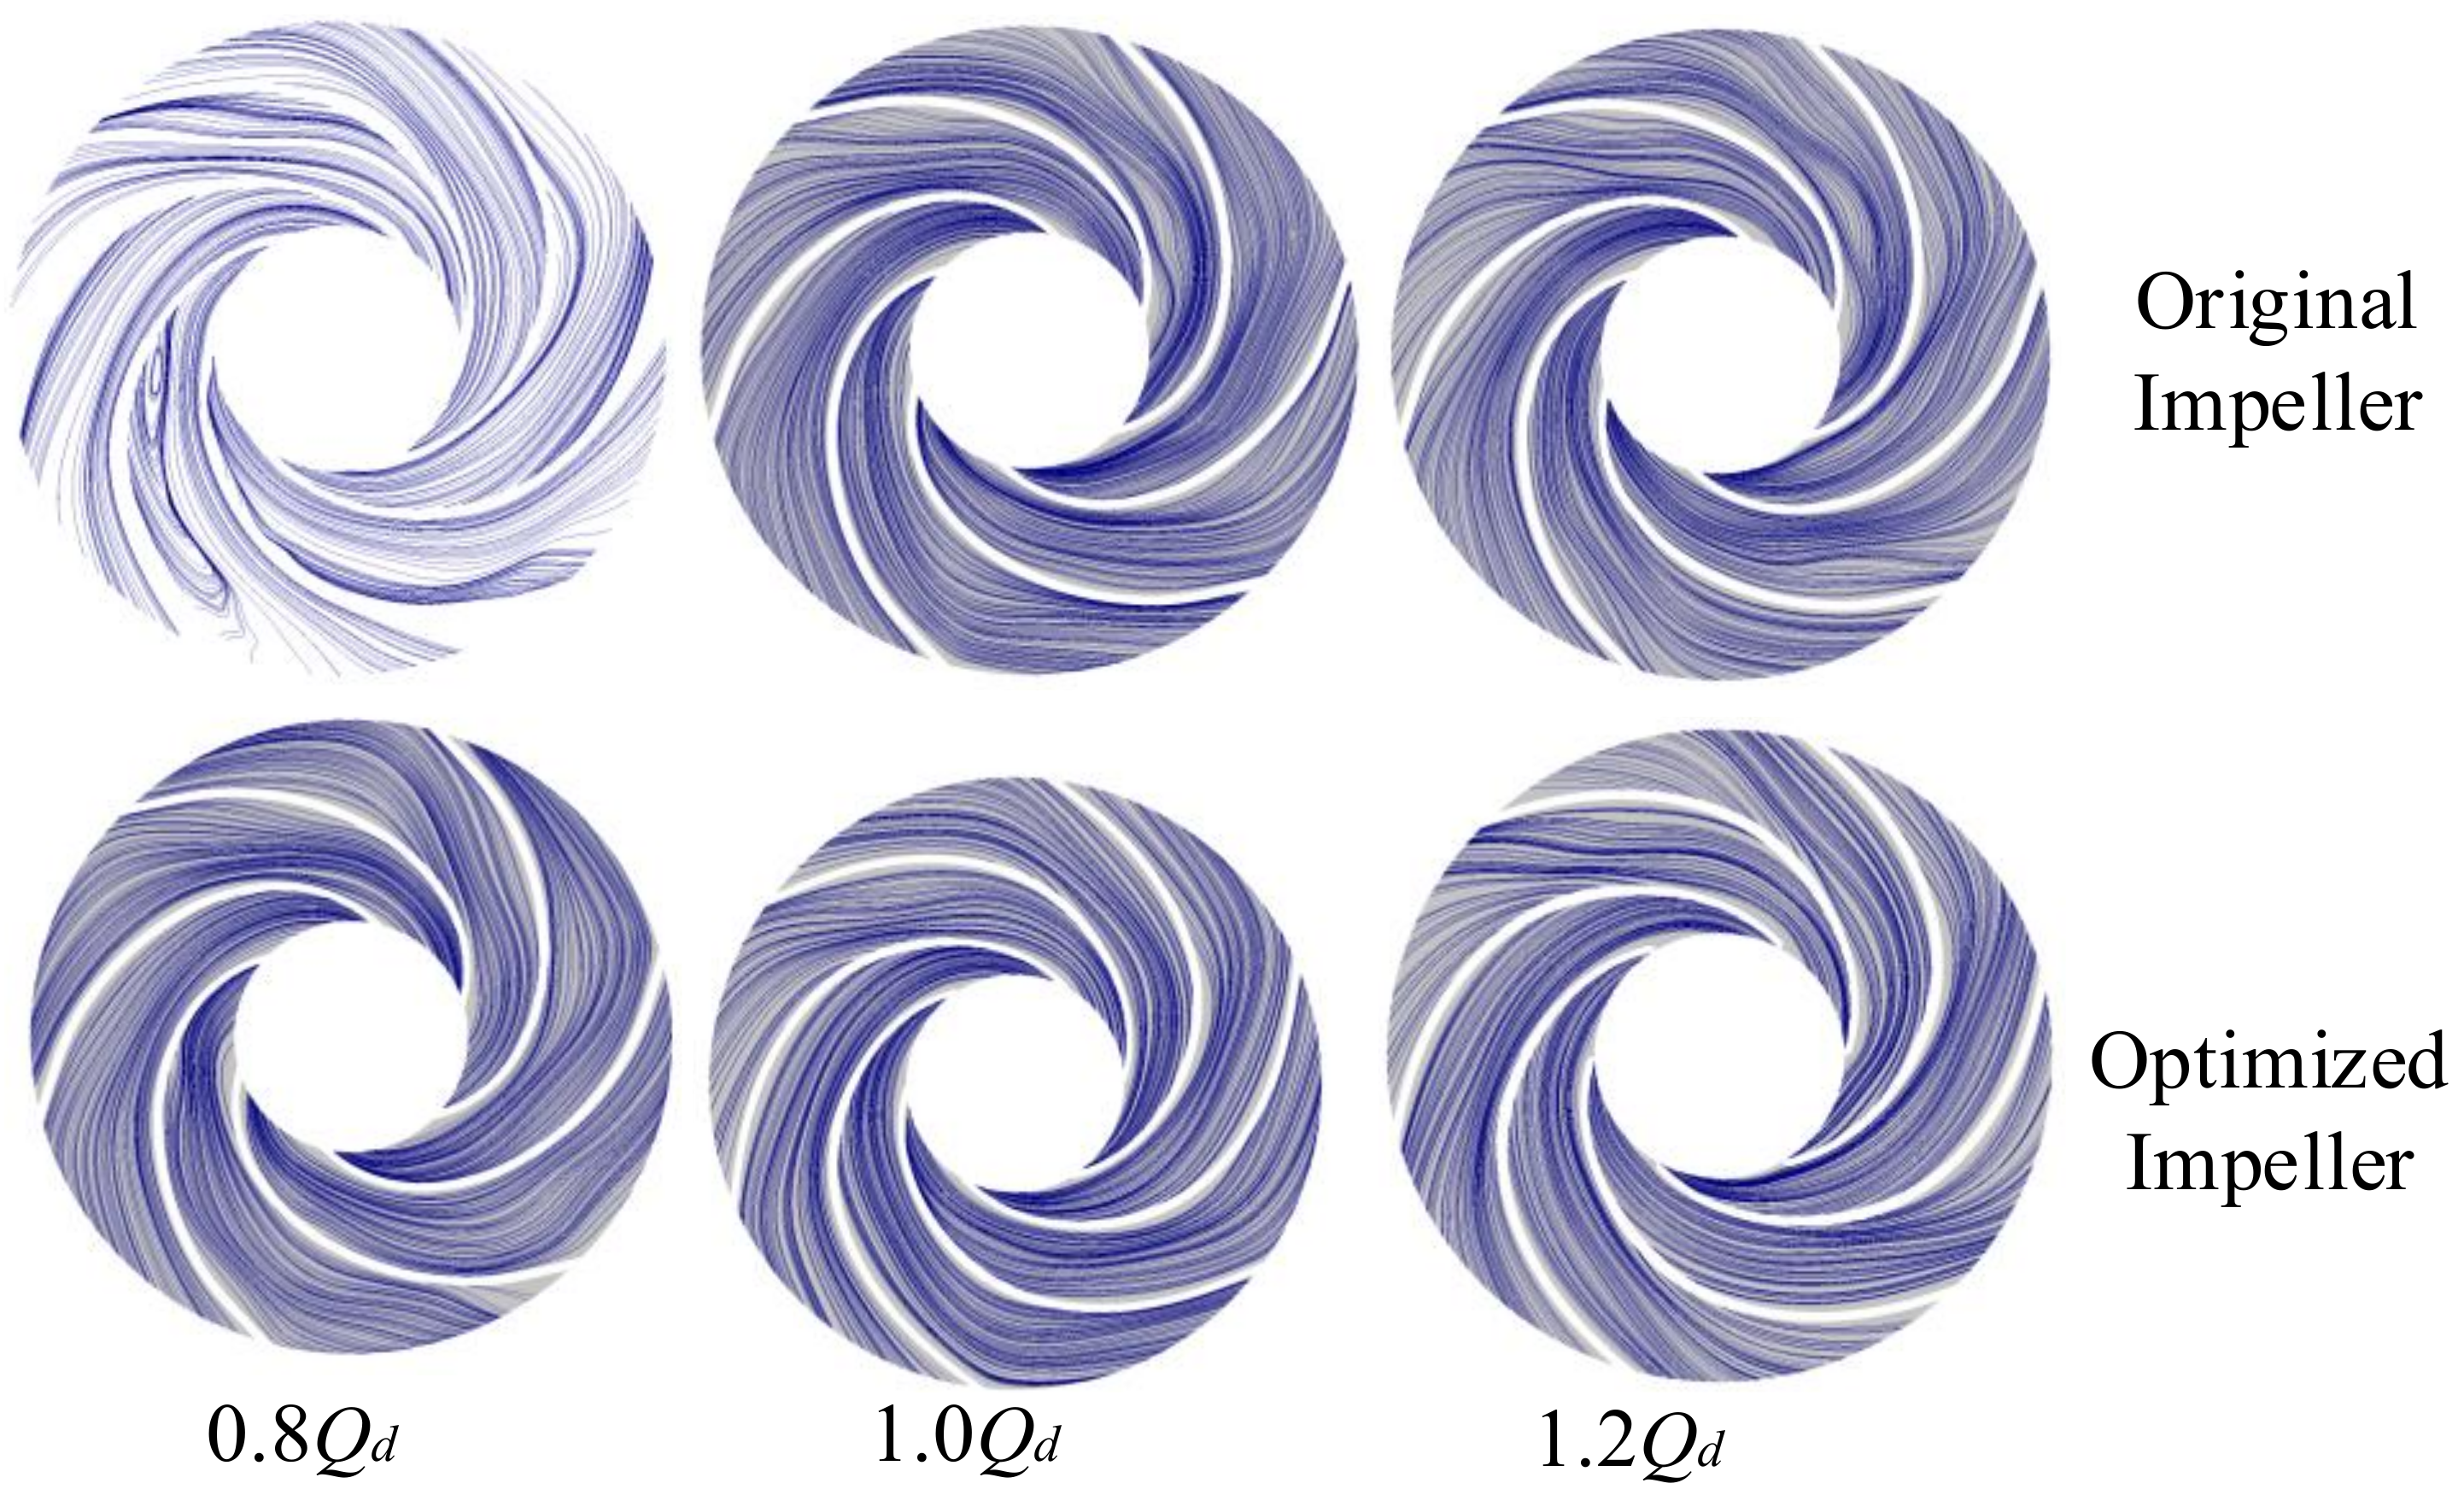
- The pressure distribution on the blade was improved compared to the original model, and the streamline at 0.8Qd was improved also.
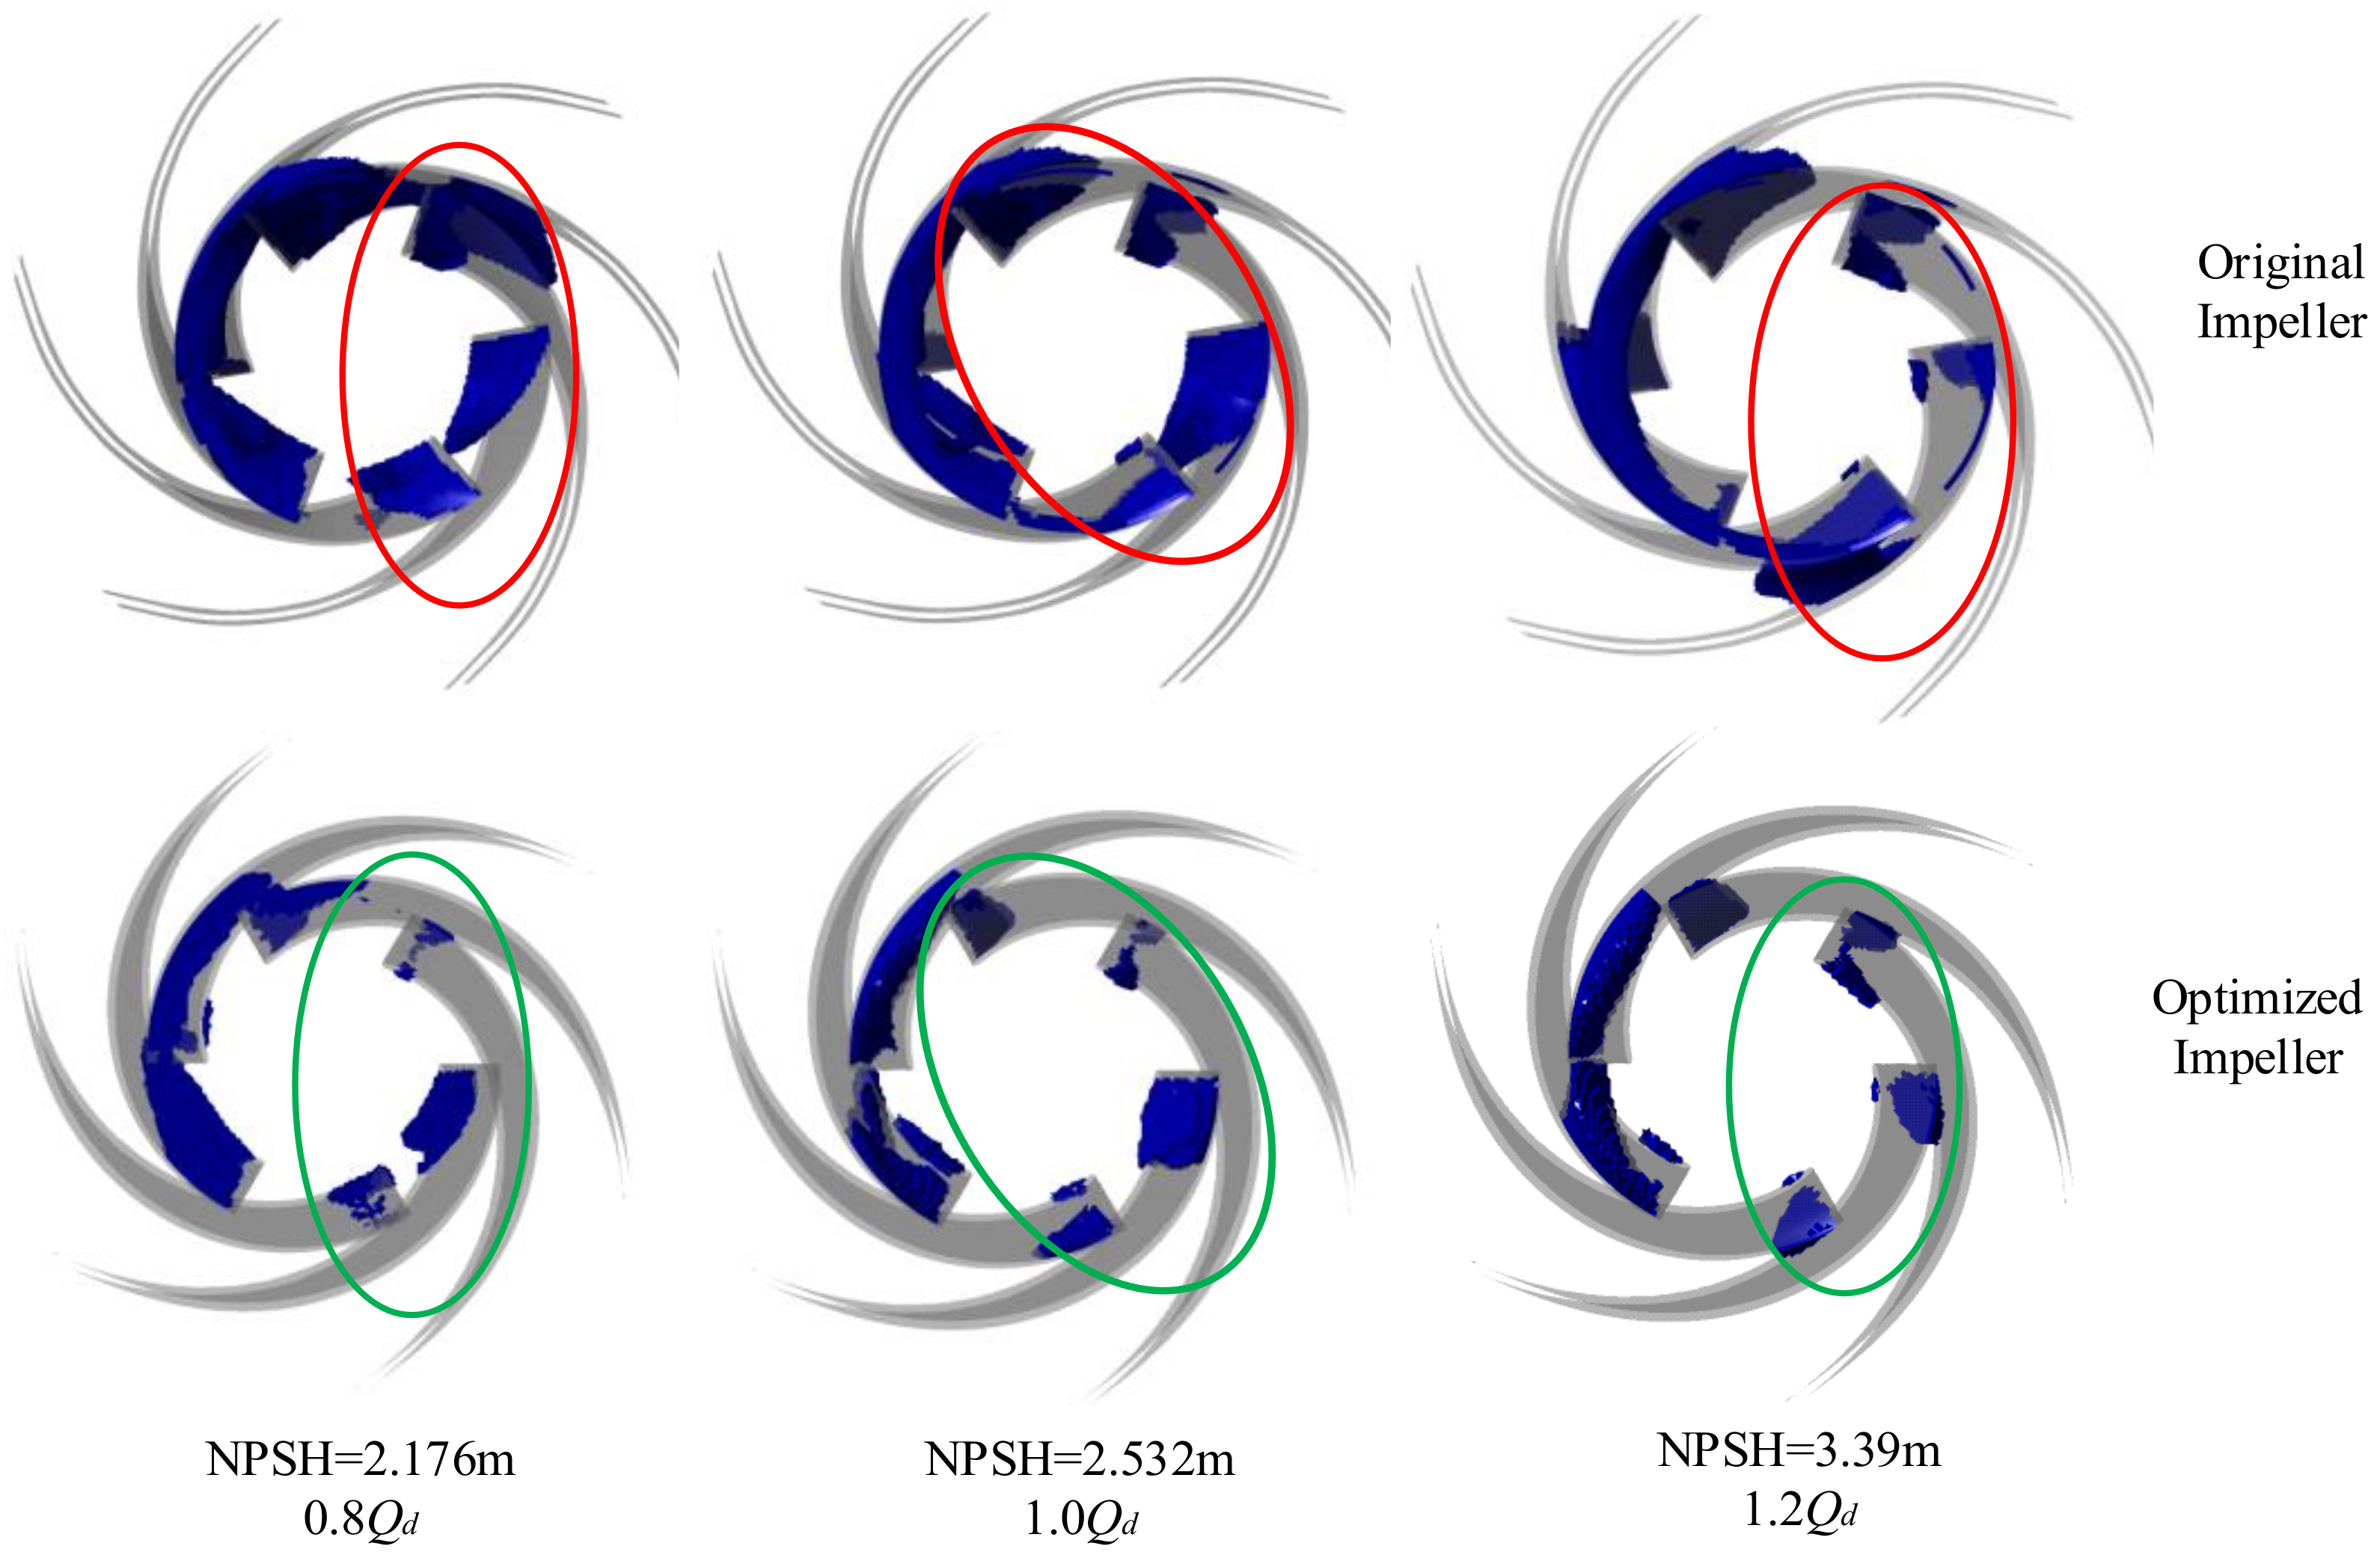
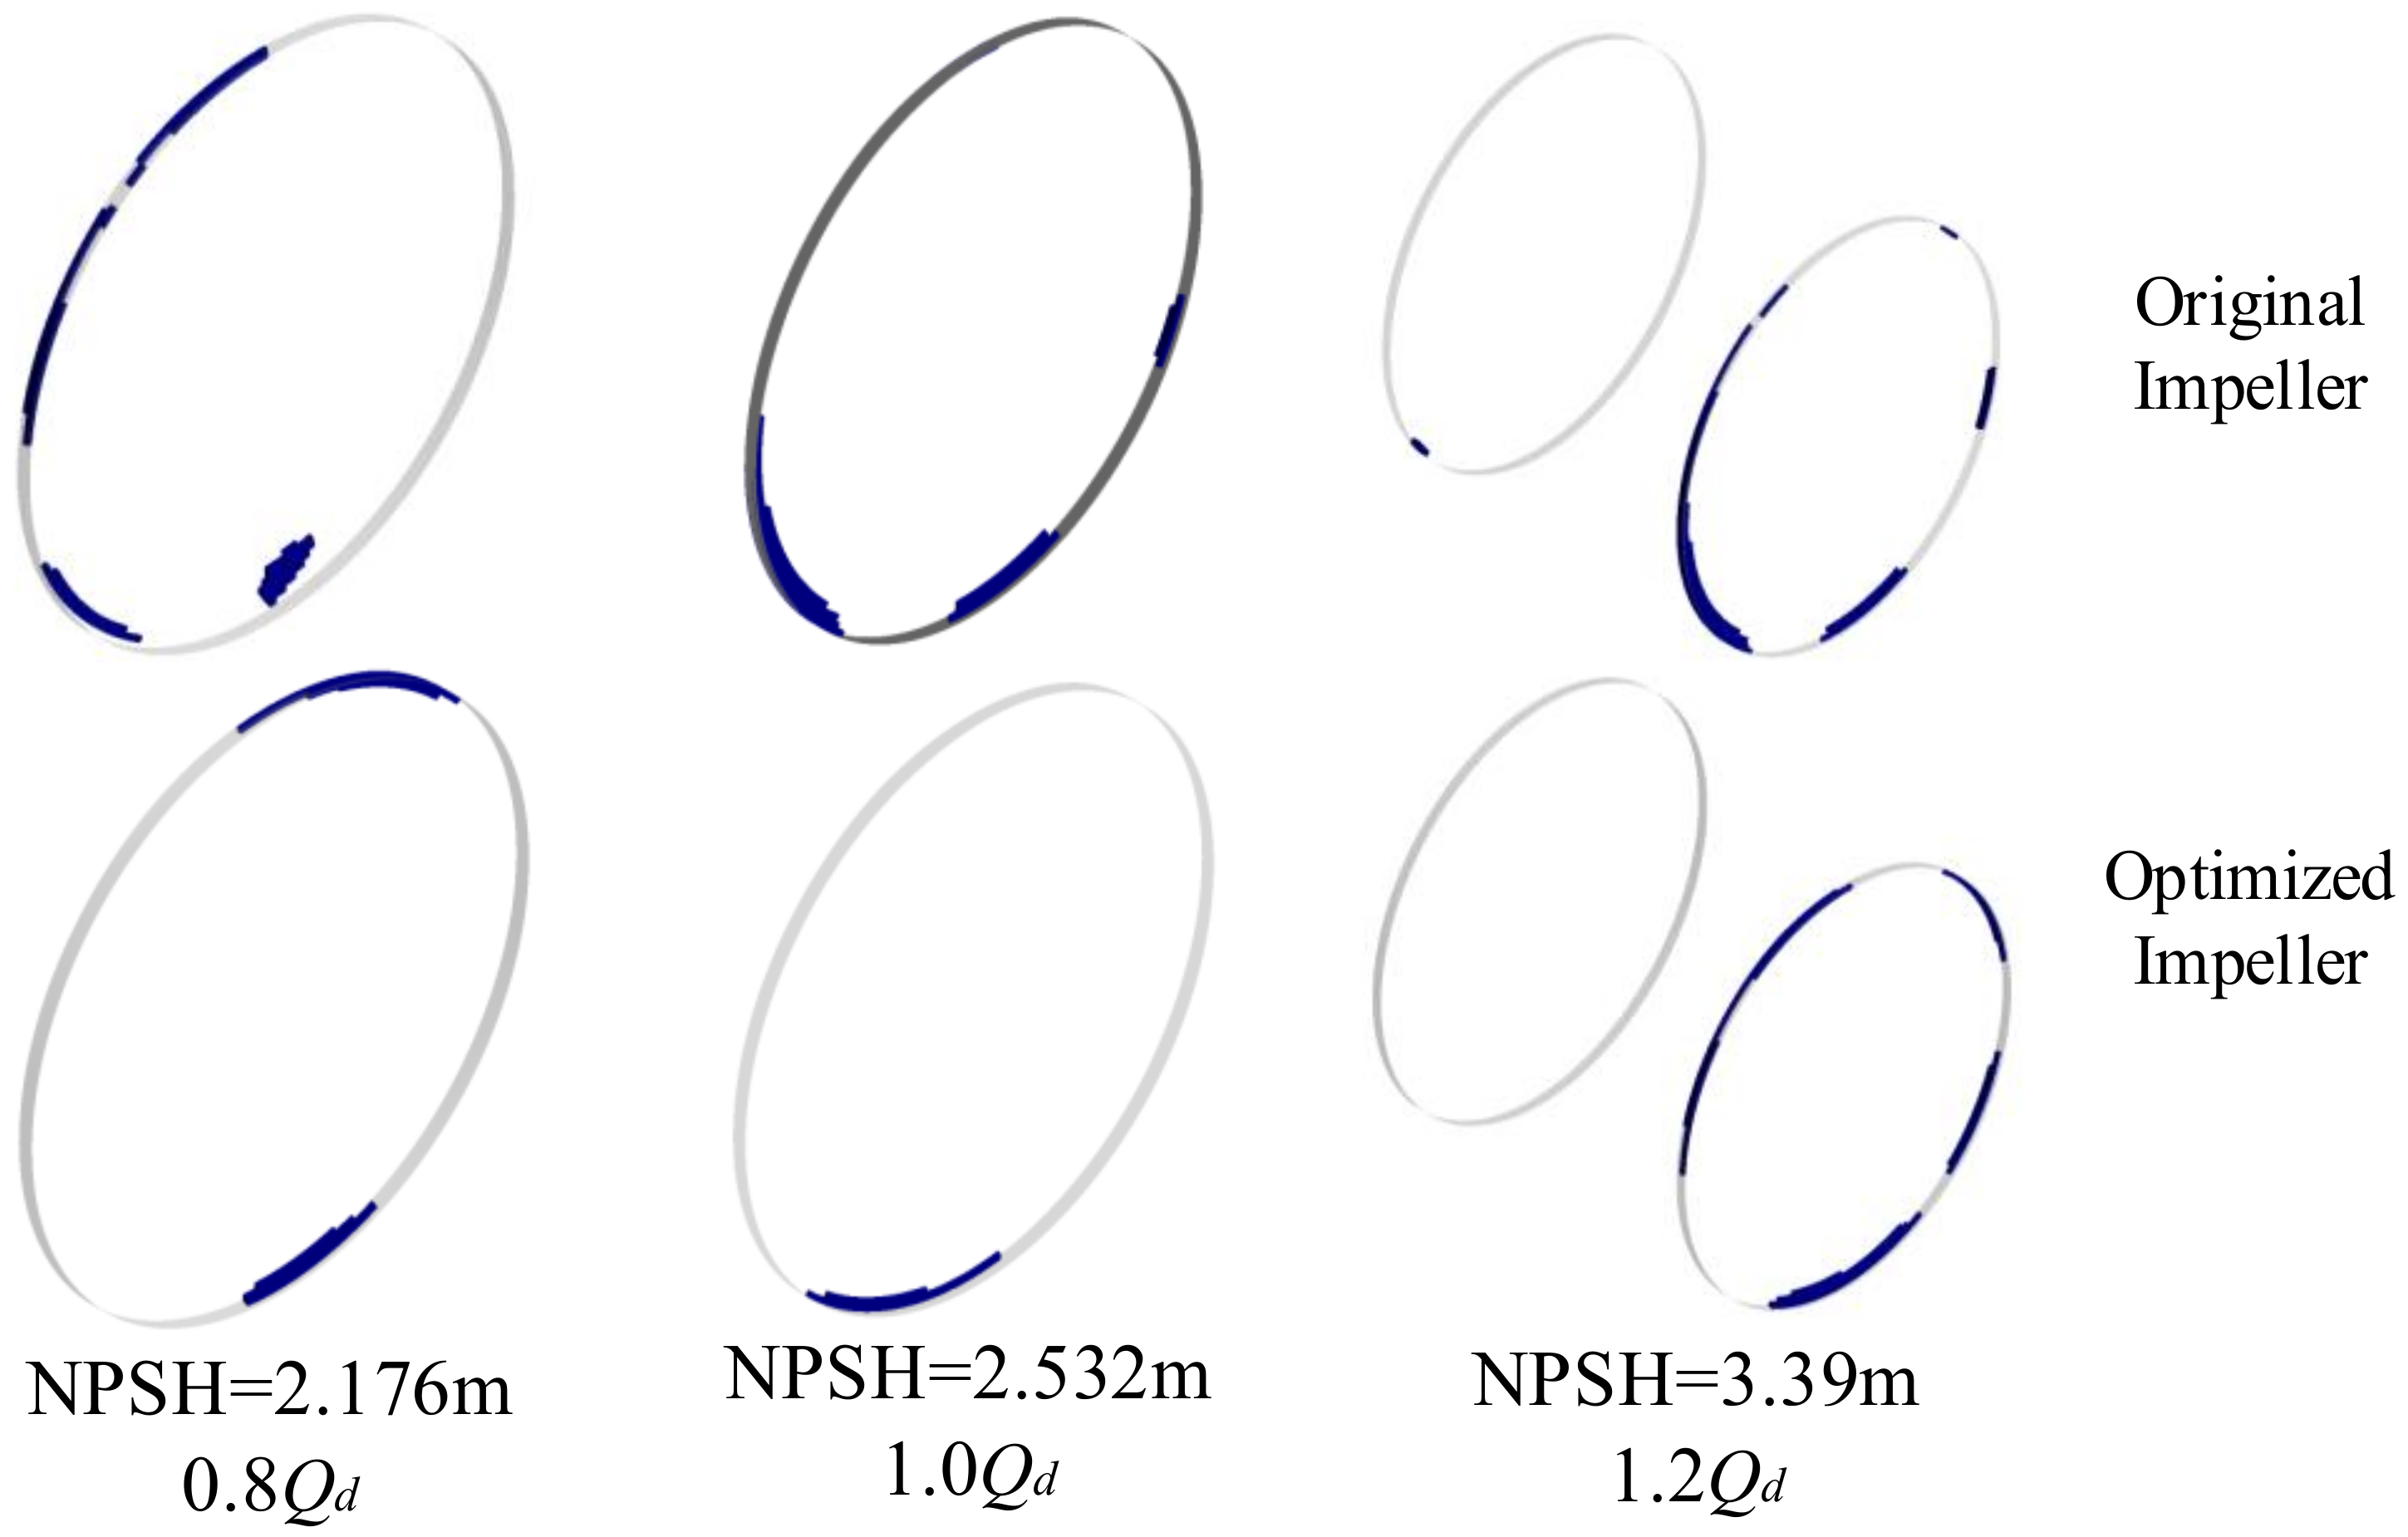
- The attached cavity distribution in the impeller and suction were lower than the original model when they were compared at NPSH = 2.176 m for 0.8Qd, at NPSH = 2.532 m for the nominal flow condition, and at NPSH = 3.36 m overload condition of 1.2Qd.
- Finally, in this optimization, the suction performance of the double-suction centrifugal pump was improved at non-design flow conditions using a faster method for cavitation flow simulations. This can serve as a theoretical reference for pump optimization design against cavitation.
Author Contributions
Funding
Conflicts of Interest
References
- Osman, M.K.; Wang, W.; Yuan, J.; Zhao, J.; Wang, Y.; Liu, J. Flow loss analysis of a two-stage axially split centrifugal pump with double inlet under different channel designs. Proc. Inst. Mech. Eng. Part C J. Mech. Eng. Sci. 2019, 233, 5316–5328. [Google Scholar] [CrossRef]
- Pei, J.; Wang, W.; Pavesi, G.; Osman, M.K.; Meng, F. Experimental investigation of the nonlinear pressure fluctuations in a residual heat removal pump. Ann. Nucl. Energy 2019, 131, 63–79. [Google Scholar] [CrossRef]
- Kang, C.; Mao, N.; Zhang, W.; Gu, Y. The influence of blade configuration on cavitation performance of a condensate pump. Ann. Nucl. Energy 2017, 110, 789–797. [Google Scholar] [CrossRef]
- Wei, Z.; Yang, W.; Xiao, R. Pressure Fluctuation and Flow Characteristics in a Two-Stage Double-Suction Centrifugal Pump. Symmetry 2019, 11, 65. [Google Scholar] [CrossRef] [Green Version]
- Tani, N.; Yamanishi, N.; Tsujimoto, Y. Influence of flow coefficient and flow structure on rotational cavitation in inducer. J. Fluids Eng. 2012, 134, 021302. [Google Scholar] [CrossRef]
- Kobayashi, K.; Chiba, Y. Numerical simulation of cavitating flow in mixed flow pump with closed type impeller. In Proceedings of the ASME 2009 Fluids Engineering Division Summer Meeting, Vail, CO, USA, 2–6 August 2009; pp. 339–347. [Google Scholar]
- Li, X.; Yuan, S.; Pan, Z.; Yuan, J.; Fu, Y. Numerical simulation of leading edge cavitation within the whole flow passage of a centrifugal pump. Sci. China Technol. Sci. 2013, 56, 2156–2162. [Google Scholar] [CrossRef]
- Fu, Q.; Zhang, F.; Zhu, R.; He, B. A systematic investigation on flow characteristics of impeller passage in a nuclear centrifugal pump under cavitation state. Ann. Nucl. Energy 2016, 97, 190–197. [Google Scholar] [CrossRef]
- Pei, J.; Yin, T.; Yuan, S.; Wang, W.; Wang, J. Cavitation optimization for a centrifugal pump impeller by using orthogonal design of experiment. Chin. J. Mech. Eng. 2017, 30, 103–109. [Google Scholar] [CrossRef]
- Dönmez, A.H.; Yumurtacı, Z.; Kavurmacıoğlu, L. The Effect of Inlet Blade Angle Variation on Cavitation Performance of a Centrifugal Pump: A Parametric Study. J. Fluids Eng. 2018, 141, 021101. [Google Scholar] [CrossRef]
- Bonaiuti, D.; Zangeneh, M.; Aartojarvi, R.; Eriksson, J. Parametric Design of a Waterjet Pump by Means of Inverse Design, CFD Calculations and Experimental Analyses. J. Fluids Eng. 2010, 132, 031104. [Google Scholar] [CrossRef]
- Xu, Y.; Tan, L.; Cao, S.; Qu, W. Multiparameter and multiobjective optimization design of centrifugal pump based on orthogonal method. Proc. Inst. Mech. Eng. Part C J. Mech. Eng. Sci. 2017, 231, 2569–2579. [Google Scholar] [CrossRef]
- Pei, J.; Gan, X.; Wang, W.; Yuan, S.; Tang, Y. Multi-objective Shape Optimization on the Inlet Pipe of a Vertical Inline Pump. J. Fluids Eng. 2019. [Google Scholar] [CrossRef]
- Wang, W.; Osman, M.K.; Pei, J.; Gan, X.; Yin, T. Artificial Neural Networks Approach for a Multi-Objective Cavitation Optimization Design in a Double-Suction Centrifugal Pump. Processes 2019, 7, 246. [Google Scholar] [CrossRef] [Green Version]
- Jin, R.; Wei, C.; Simpson, T.W. Comparative studies of metamodelling techniques under multiple modelling criteria. Struct. Multidiscip. Optim. 2001, 23, 1–13. [Google Scholar] [CrossRef]
- Wang, W.; Pei, J.; Yuan, S.; Zhang, J.; Yuan, J.; Xu, C. Application of different surrogate models on the optimization of centrifugal pump. J. Mech. Sci. Technol. 2016, 30, 567–574. [Google Scholar] [CrossRef]
- Pei, J.; Wang, W.; Osman, M.K.; Gan, X. Multiparameter optimization for the nonlinear performance improvement of centrifugal pumps using a multilayer neural network. J. Mech. Sci. Technol. 2019, 33, 2681–2691. [Google Scholar] [CrossRef]
- Tao, R.; Xiao, R.; Zhu, D.; Wang, F. Multi-objective optimization of double suction centrifugal pump. Proc. Inst. Mech. Eng. Part C J. Mech. Eng. Sci. 2018, 232, 1108–1117. [Google Scholar] [CrossRef]
- Ding, H.; Visser, F.; Jiang, Y. A practical approach to speed up NPSHR prediction of centrifugal pumps using CFD cavitation model. In Proceedings of the ASME 2012 Fluids Engineering Division Summer Meeting collocated with the ASME 2012 Heat Transfer Summer Conference and the ASME 2012 10th International Conference on Nanochannels, Microchannels, and Minichannels, Rio Grande, PR, USA, 8–12 July 2012; pp. 505–514. [Google Scholar]
- Pei, J.; Osman, M.K.; Wang, W.; Appiah, D.; Yin, T.; Deng, Q. A Practical Method for Speeding up the Cavitation Prediction in an Industrial Double-Suction Centrifugal Pump. Energies 2019, 12, 2088. [Google Scholar] [CrossRef] [Green Version]
- Gülich, J.F. Centrifugal Pumps; Springer: Berlin/Heidelberg, Germany, 2010. [Google Scholar]
- Pei, J.; Osman, M.K.; Wang, W.; Yuan, J.; Yin, T.; Appiah, D. Unsteady flow characteristics and cavitation prediction in the double-suction centrifugal pump using a novel approach. Proc. Inst. Mech. Eng. Part A J. Power Energy 2020, 234, 283–299. [Google Scholar] [CrossRef]
- Medvitz, R.B.; Kunz, R.F.; Boger, D.A.; Lindau, J.W.; Yocum, A.M.; Pauley, L.L. Performance analysis of cavitating flow in centrifugal pumps using multiphase CFD. J. Fluids Eng. 2002, 124, 377–383. [Google Scholar] [CrossRef]
- Menter, F.R. Two-equation eddy-viscosity turbulence models for engineering applications. AIAA J. 1994, 32, 1598–1605. [Google Scholar] [CrossRef] [Green Version]
- Bardina, J.; Huang, P.; Coakley, T.; Bardina, J.; Huang, P.; Coakley, T. Turbulence modeling validation. In Proceedings of the 28th Fluid Dynamics Conference, Snowmass Village, CO, USA, 29 June–2 July 1997; p. 2121. [Google Scholar]
- Zwart, P.J.; Gerber, A.G.; Belamri, T. A two-phase flow model for predicting cavitation dynamics. In Proceedings of the Fifth International Conference on Multiphase Flow, Yokohama, Japan, 30 May–3 June 2004. [Google Scholar]
- Mejri, I.; Bakir, F.; Rey, R.; Belamri, T. Comparison of computational results obtained from a homogeneous cavitation model with experimental investigations of three inducers. J. Fluids Eng. 2006, 128, 1308–1323. [Google Scholar] [CrossRef]
- Pei, J.; Zhang, F.; Appiah, D.; Hu, B.; Yuan, S.; Chen, K.; Asomani, S. Performance Prediction Based on Effects of Wrapping Angle of a Side Channel Pump. Energies 2019, 12, 139. [Google Scholar] [CrossRef] [Green Version]
- Tang, X.; Zou, M.; Wang, F.; Li, X.; Shi, X. Comprehensive Numerical Investigations of Unsteady Internal Flows and Cavitation Characteristics in Double-Suction Centrifugal Pump. Math. Probl. Eng. 2017, 2017, 1–13. [Google Scholar] [CrossRef]


| A | B | C | |
|---|---|---|---|
| No | β1hub/° | β2middle/° | β3shroud/° |
| 1 | 17 | 13 | 11 |
| 2 | 19 | 16 | 14 |
| 3 | 21 | 18 | 17 |
| 4 | 23 | 21 | 19 |
| 5 | 25 | 23 | 21 |
| A | B | C | A | B | C | ||
|---|---|---|---|---|---|---|---|
| No | β1hub/° | β2middle/° | β3shroud/° | No | β1hub/° | β2middle/° | β3shroud/° |
| 1 | 17 | 18 | 17 | 14 | 25 | 23 | 17 |
| 2 | 17 | 16 | 14 | 15 | 19 | 18 | 21 |
| 3 | 19 | 13 | 17 | 16 | 25 | 16 | 21 |
| 4 | 21 | 16 | 11 | 17 | 17 | 21 | 19 |
| 5 | 23 | 16 | 17 | 18 | 17 | 23 | 21 |
| 6 | 21 | 13 | 21 | 19 | 17 | 13 | 11 |
| 7 | 21 | 21 | 17 | 20 | 23 | 21 | 21 |
| 8 | 23 | 18 | 19 | 21 | 25 | 18 | 11 |
| 9 | 25 | 13 | 19 | 22 | 19 | 23 | 14 |
| 10 | 19 | 16 | 19 | 23 | 21 | 18 | 14 |
| 11 | 21 | 23 | 19 | 24 | 23 | 13 | 14 |
| 12 | 23 | 23 | 11 | 25 | 19 | 21 | 11 |
| 13 | 25 | 21 | 14 |
| Design Parameters | Value |
|---|---|
| Nominal flow rate, Qd (m3/h) | 500 |
| Head, H (m) | 40 |
| Rotating speed, N (rpm) | 1480 |
| Blade number, z | 6 |
| Diameter of suction, Ds (mm) | 250 |
| Diameter at impeller inlet, D1 (mm) | 192 |
| Diameter at impeller outlet, D2 (mm) | 365 |
| Diameter of discharge, Dd (mm) | 200 |
| Efficiency, η (%) | 84 |
| NPSHr (m) | 3.5 |
| Item | Mesh I | Mesh II | Mesh III | Mesh IV | Mesh V | |
|---|---|---|---|---|---|---|
| Total Mesh | 2,878,243 | 3,679,342 | 4,266,423 | 4,958,168 | 5,847,757 | |
| Ratio | H/H1 | 1.0000 | 1.1563 | 1.2211 | 1.2201 | 1.2213 |
| ƞ/ƞ1 | 1.0000 | 1.1324 | 1.3043 | 1.3044 | 1.3043 | |
| pv1/pv1,1 | 1.0000 | 1.1520 | 1.3112 | 1.3114 | 1.3111 | |
| pv7/pv7,1 | 1.0000 | 1.1562 | 1.2819 | 1.2822 | 1.2820 | |
| Variables | A | B | C |
|---|---|---|---|
| Upper Bounds | 17 | 13 | 11 |
| Lower Bounds | 25 | 23 | 21 |
| Trial No. | β1/° | NPSHr (m) | ||||
|---|---|---|---|---|---|---|
| Hub | Middle | Shroud | 0.8Qd | 1.0Qd | 1.2Qd | |
| 1 | 17 | 18 | 17 | 2.20493 | 2.47272 | 3.34366 |
| 2 | 17 | 16 | 14 | 2.242 | 2.4631 | 3.5327 |
| 3 | 19 | 13 | 17 | 2.239 | 2.60439 | 3.41053 |
| 4 | 21 | 16 | 11 | 2.13633 | 2.5389 | 3.49375 |
| 5 | 23 | 16 | 17 | 2.19513 | 2.49717 | 3.34304 |
| 6 | 21 | 13 | 21 | 2.32698 | 2.55007 | 3.25851 |
| 7 | 21 | 21 | 17 | 2.15205 | 2.37423 | 3.20435 |
| 9 | 25 | 13 | 19 | 2.11472 | 2.44115 | 3.34089 |
| 10 | 19 | 16 | 19 | 2.15242 | 2.48385 | 3.36682 |
| 11 | 21 | 23 | 19 | 2.1968 | 2.34822 | 3.12789 |
| 12 | 23 | 23 | 11 | 2.11707 | 2.46779 | 3.29704 |
| 13 | 25 | 21 | 14 | 2.19055 | 2.40843 | 3.20562 |
| 14 | 25 | 23 | 17 | 2.22882 | 2.49238 | 3.19525 |
| 15 | 19 | 18 | 21 | 2.27685 | 2.37688 | 3.32605 |
| 16 | 25 | 16 | 21 | 2.16954 | 2.46852 | 3.31924 |
| 17 | 17 | 21 | 19 | 2.19175 | 2.41485 | 3.21403 |
| 18 | 17 | 23 | 21 | 2.13016 | 2.49771 | 3.11064 |
| 19 | 17 | 13 | 11 | 2.11841 | 2.55672 | 3.32263 |
| 21 | 25 | 18 | 11 | 2.15538 | 2.52129 | 3.41646 |
| 22 | 19 | 23 | 14 | 2.21103 | 2.41971 | 3.2512 |
| 23 | 21 | 18 | 14 | 2.18358 | 2.47889 | 3.42864 |
| 25 | 19 | 21 | 11 | 2.19366 | 2.50587 | 3.49847 |
| A | B | C | Results | |||
|---|---|---|---|---|---|---|
| No | β1hub/° | β2middle/° | β3shroud/° | 0.8Qd | 1.0Qd | 1.2Qd |
| 1 | 19.4863 | 21 | 16.767 | 2.108 | 2.353 | 3.215 |
| 2 | 19.3992 | 21 | 17.262 | 2.124 | 2.340 | 3.210 |
| 3 | 19.3079 | 21 | 17.566 | 2.134 | 2.334 | 3.208 |
| Name | NPSHr 0.8Q | NPSHr 1.0Q | NPSHr 1.2Q |
|---|---|---|---|
| Original | 2.176 m | 2.532 m | 3.39 m |
| Case 1 | 2.089 m | 2.358 m | 3.271 m |
| Case 2 | 2.132 m | 2.419 m | 3.254 m |
| Case 3 | 2.132 m | 2.44 m | 3.288 m |
| Name | Head (m) |
|---|---|
| Original | 40.52 |
| Case 1 | 40.05 |
| Case 2 | 39.98 |
| Case 3 | 38.73 |
© 2020 by the authors. Licensee MDPI, Basel, Switzerland. This article is an open access article distributed under the terms and conditions of the Creative Commons Attribution (CC BY) license (http://creativecommons.org/licenses/by/4.0/).
Share and Cite
Wang, W.; Li, Y.; Osman, M.K.; Yuan, S.; Zhang, B.; Liu, J. Multi-Condition Optimization of Cavitation Performance on a Double-Suction Centrifugal Pump Based on ANN and NSGA-II. Processes 2020, 8, 1124. https://doi.org/10.3390/pr8091124
Wang W, Li Y, Osman MK, Yuan S, Zhang B, Liu J. Multi-Condition Optimization of Cavitation Performance on a Double-Suction Centrifugal Pump Based on ANN and NSGA-II. Processes. 2020; 8(9):1124. https://doi.org/10.3390/pr8091124
Chicago/Turabian StyleWang, Wenjie, Yanpin Li, Majeed Koranteng Osman, Shouqi Yuan, Benying Zhang, and Jun Liu. 2020. "Multi-Condition Optimization of Cavitation Performance on a Double-Suction Centrifugal Pump Based on ANN and NSGA-II" Processes 8, no. 9: 1124. https://doi.org/10.3390/pr8091124
APA StyleWang, W., Li, Y., Osman, M. K., Yuan, S., Zhang, B., & Liu, J. (2020). Multi-Condition Optimization of Cavitation Performance on a Double-Suction Centrifugal Pump Based on ANN and NSGA-II. Processes, 8(9), 1124. https://doi.org/10.3390/pr8091124