
Air Pollution Analysis during the Lockdown on the City of Milan


 ,
,  , and
, and 
Abstract
:1. Introduction
The Case Study
2. Materials and Methods
2.1. Data Sources
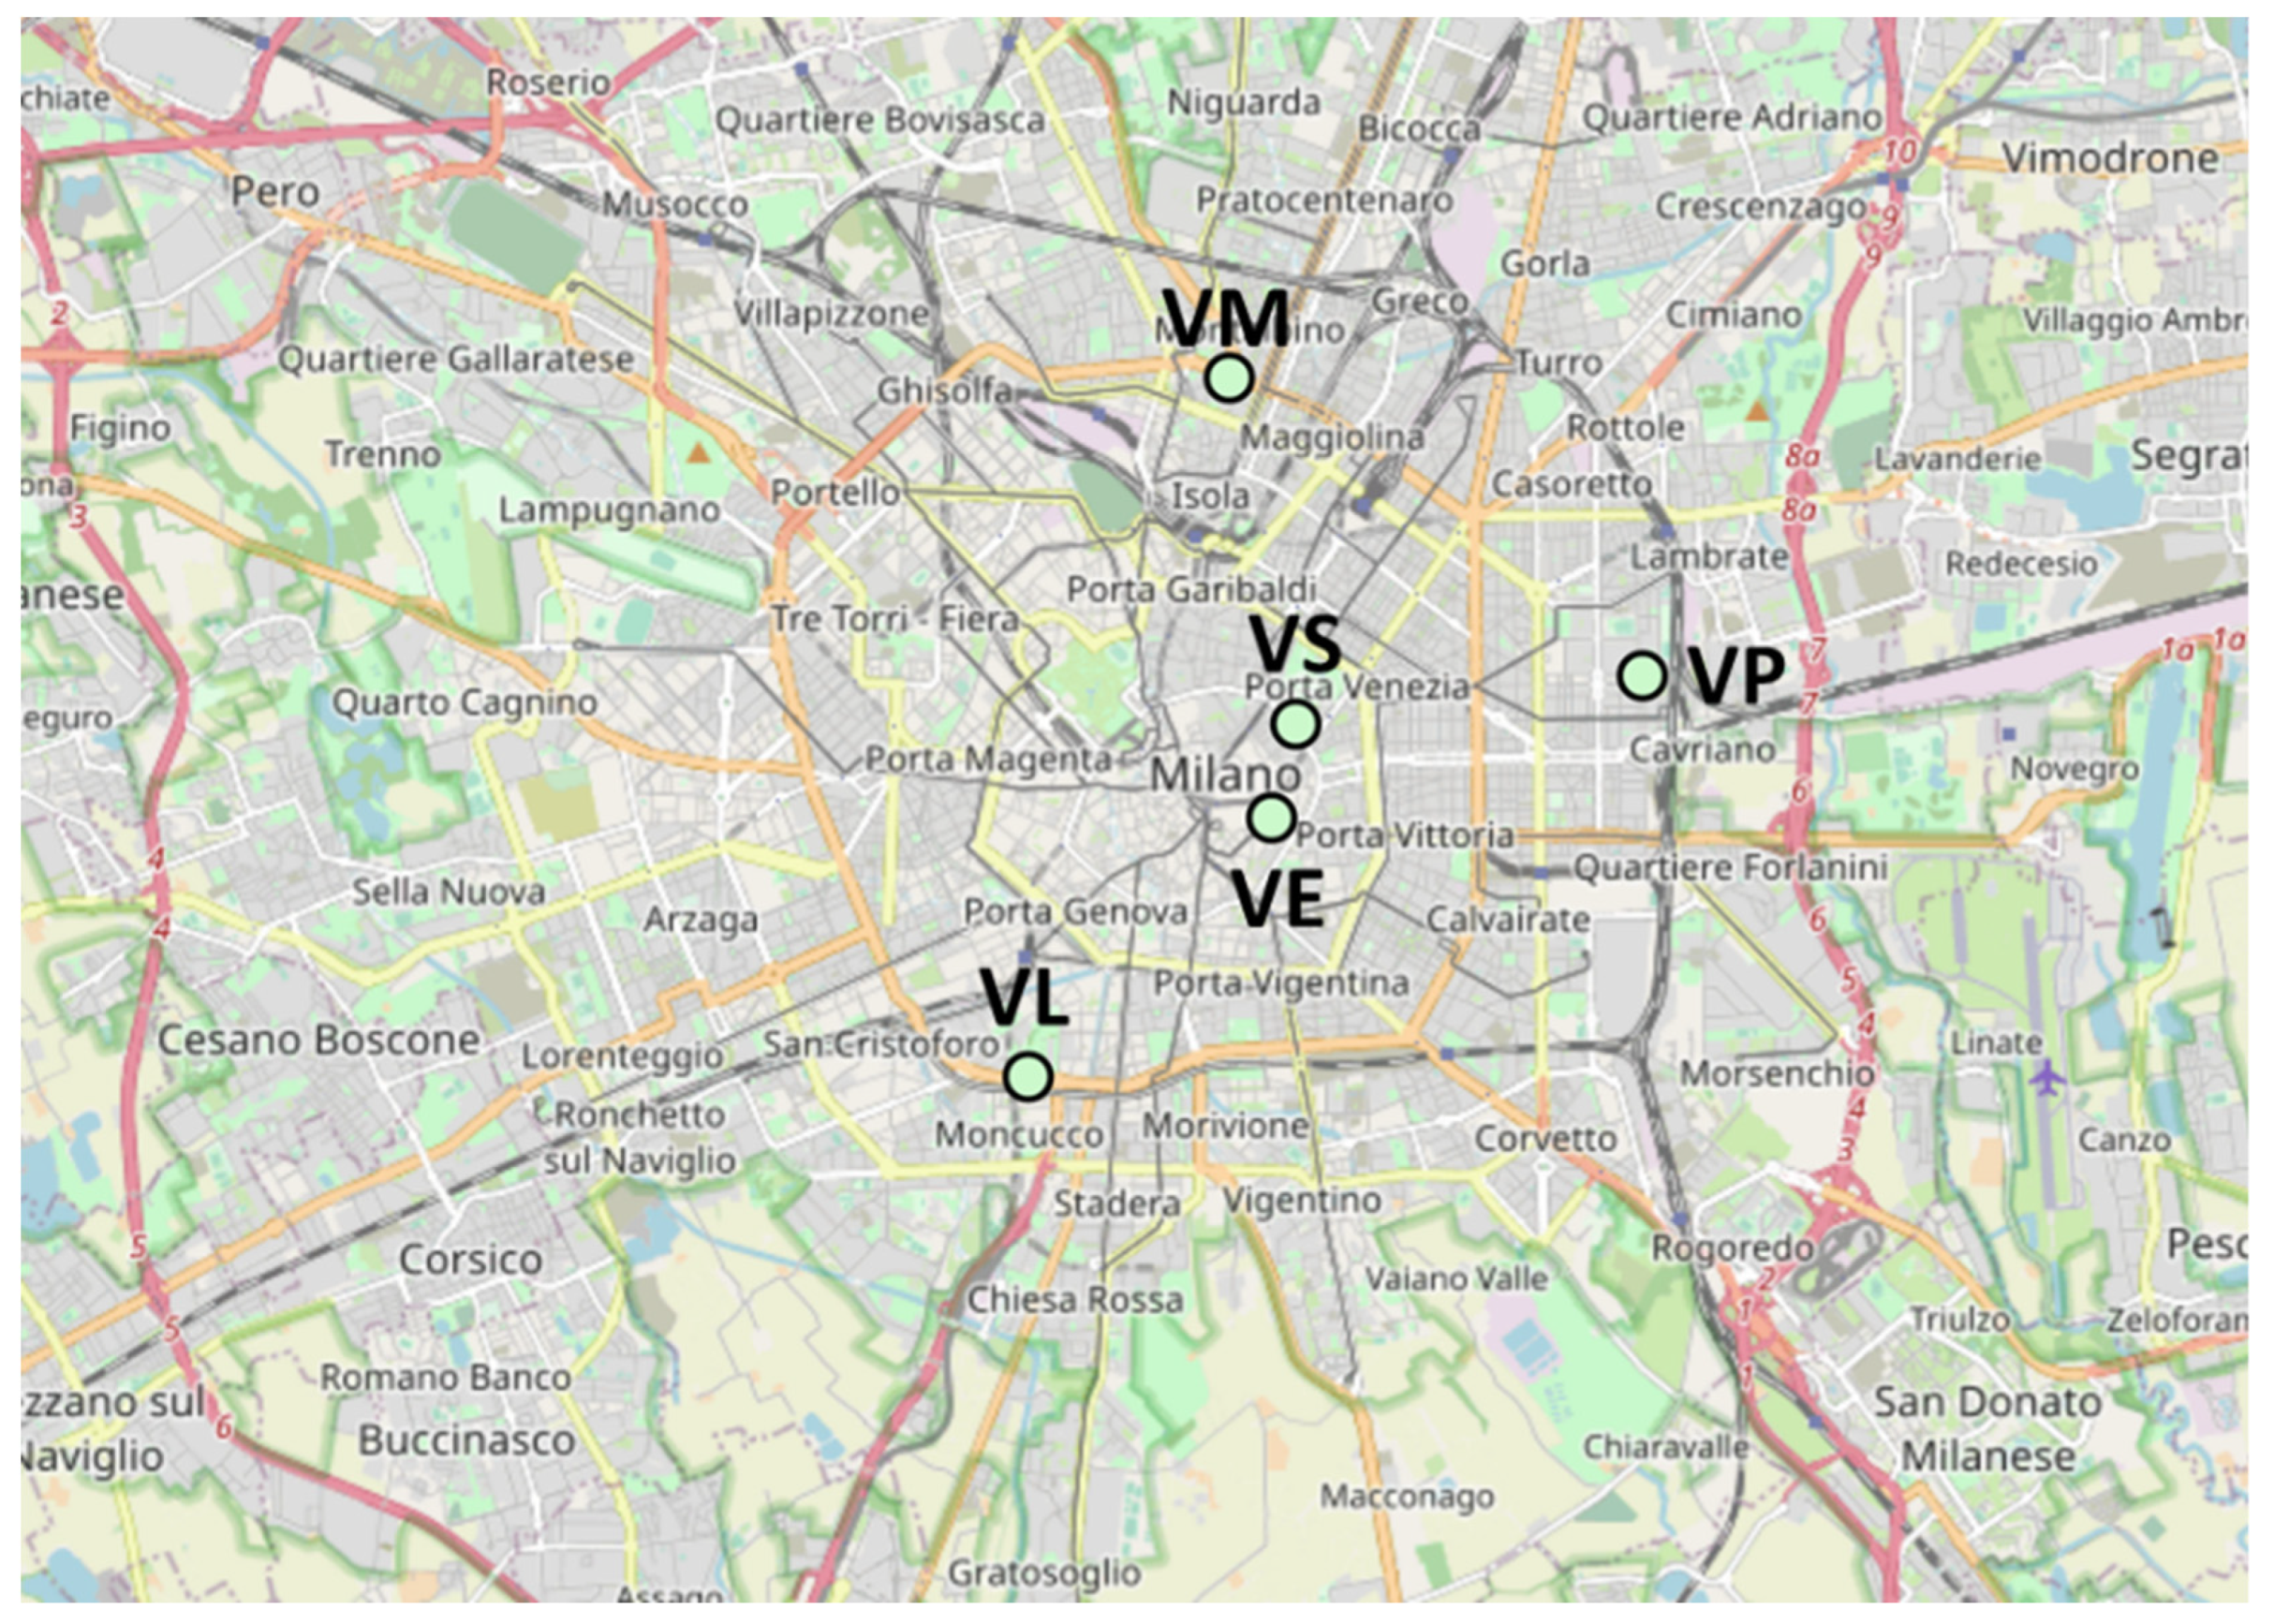
2.1.1. ARPA Lombardia
2.1.2. Real-Time On-Road Mobile Monitoring Network
2.2. Data Aggregation
Traffic Information
3. Results and Discussion
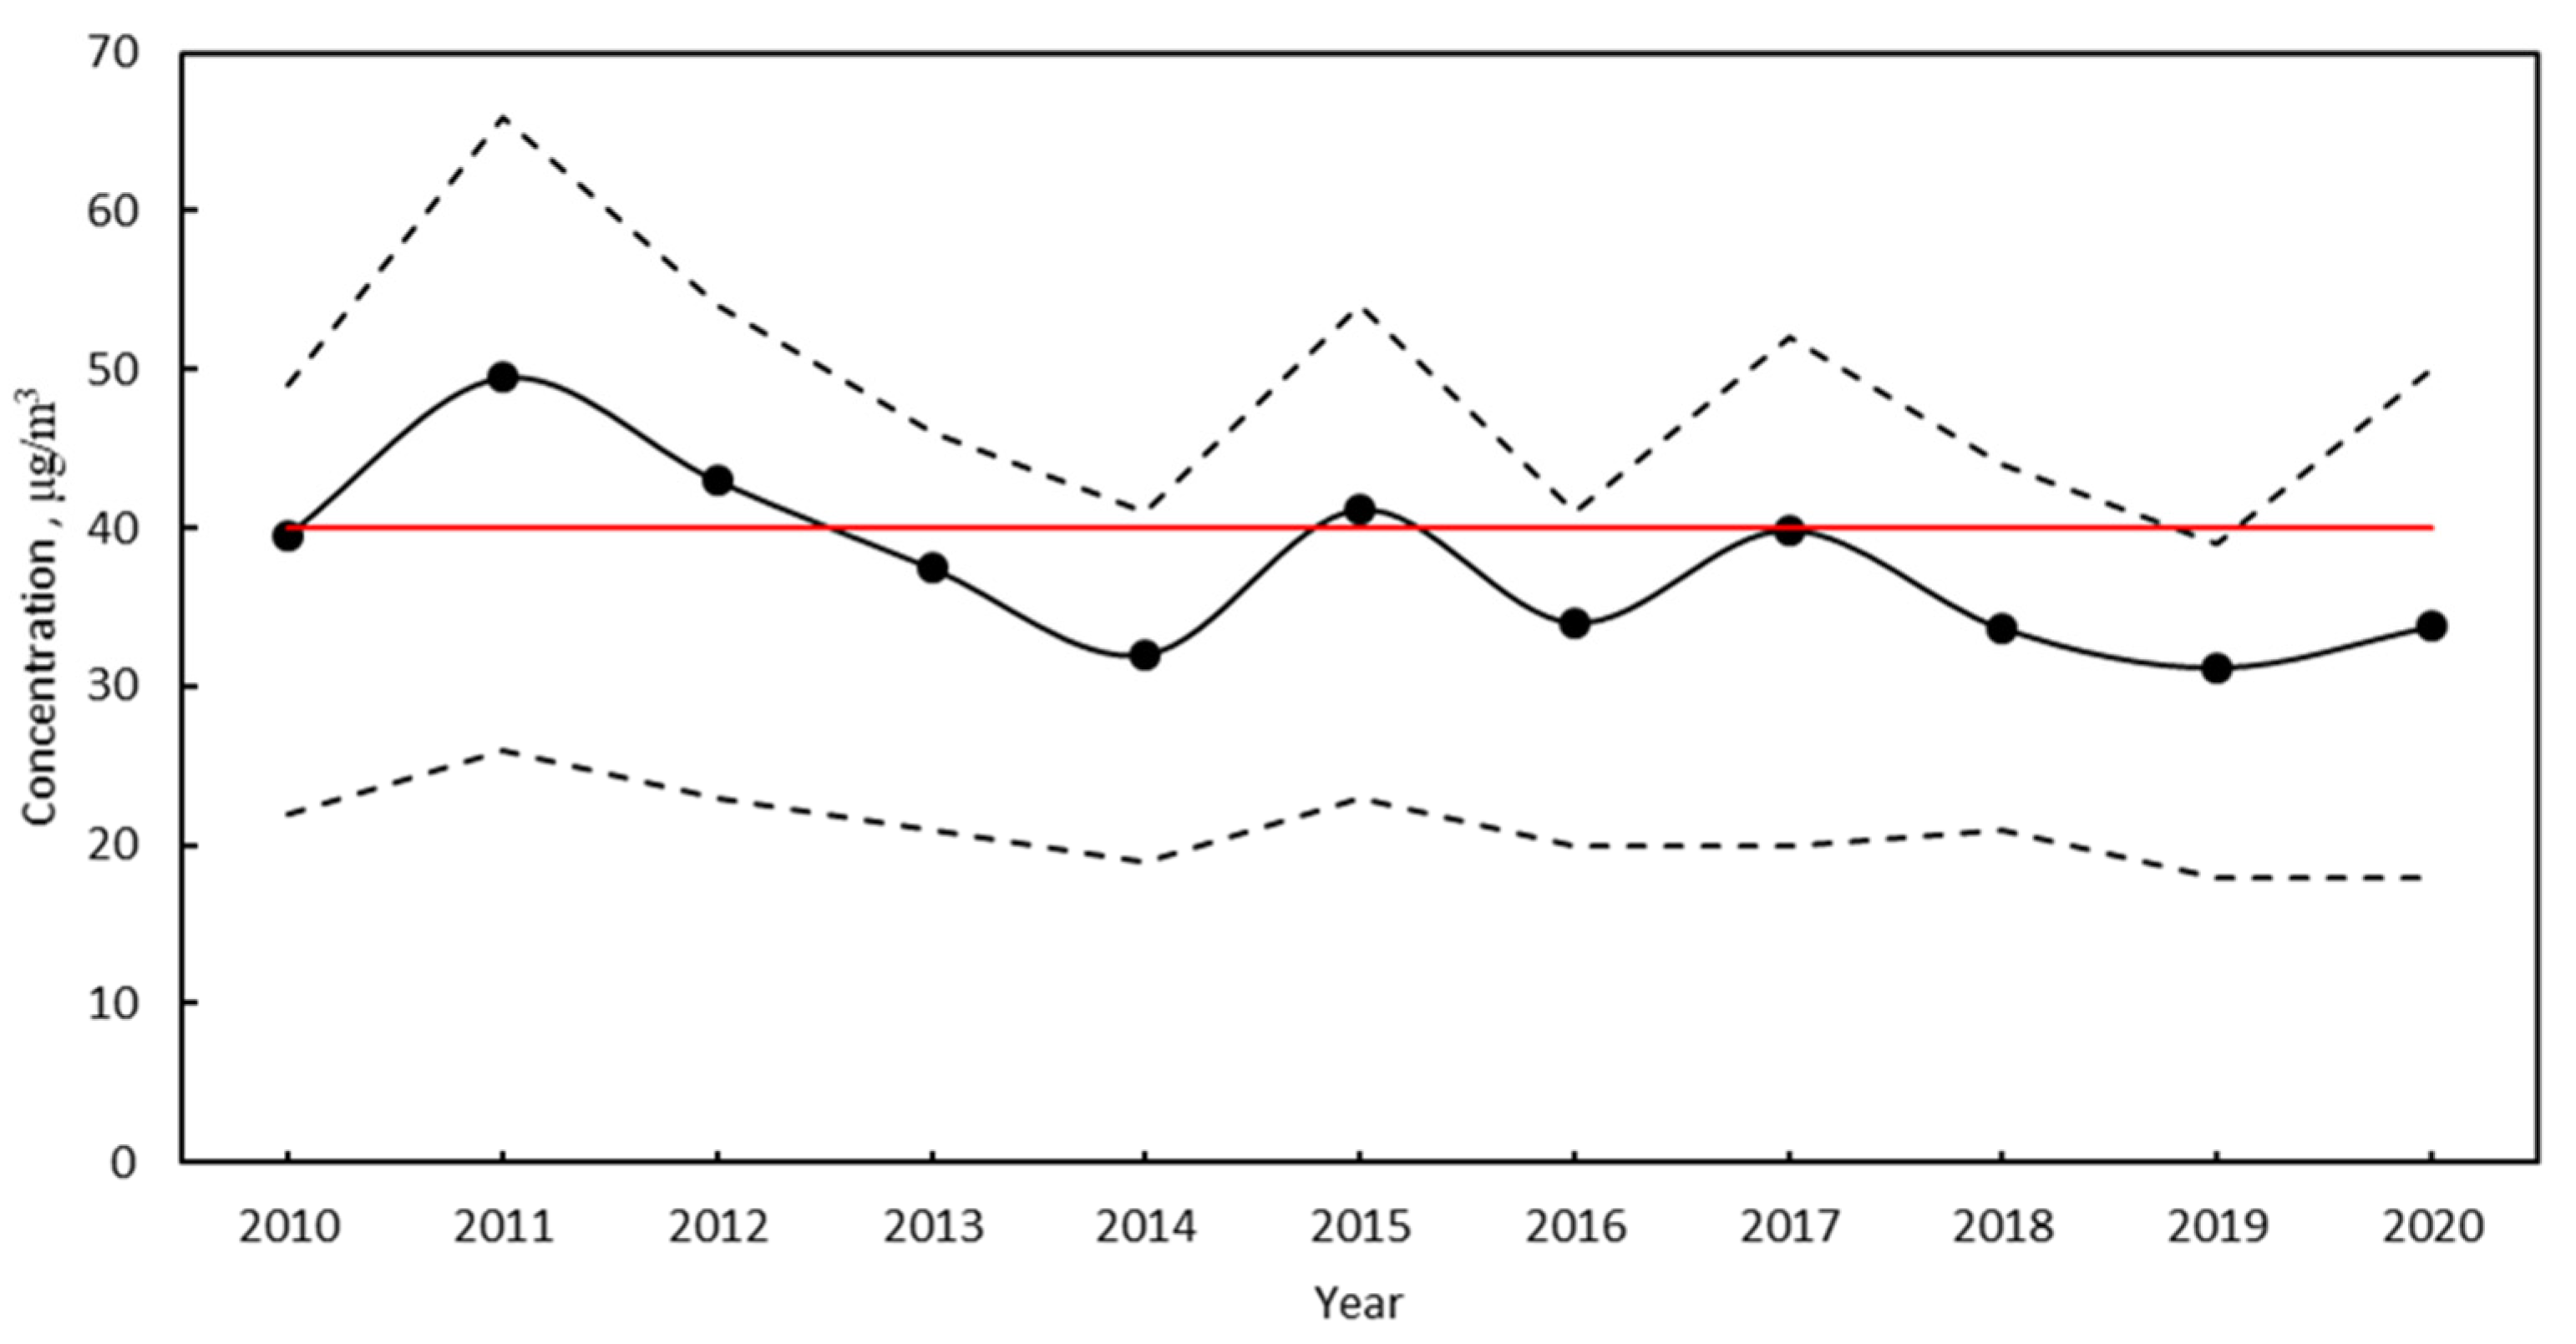
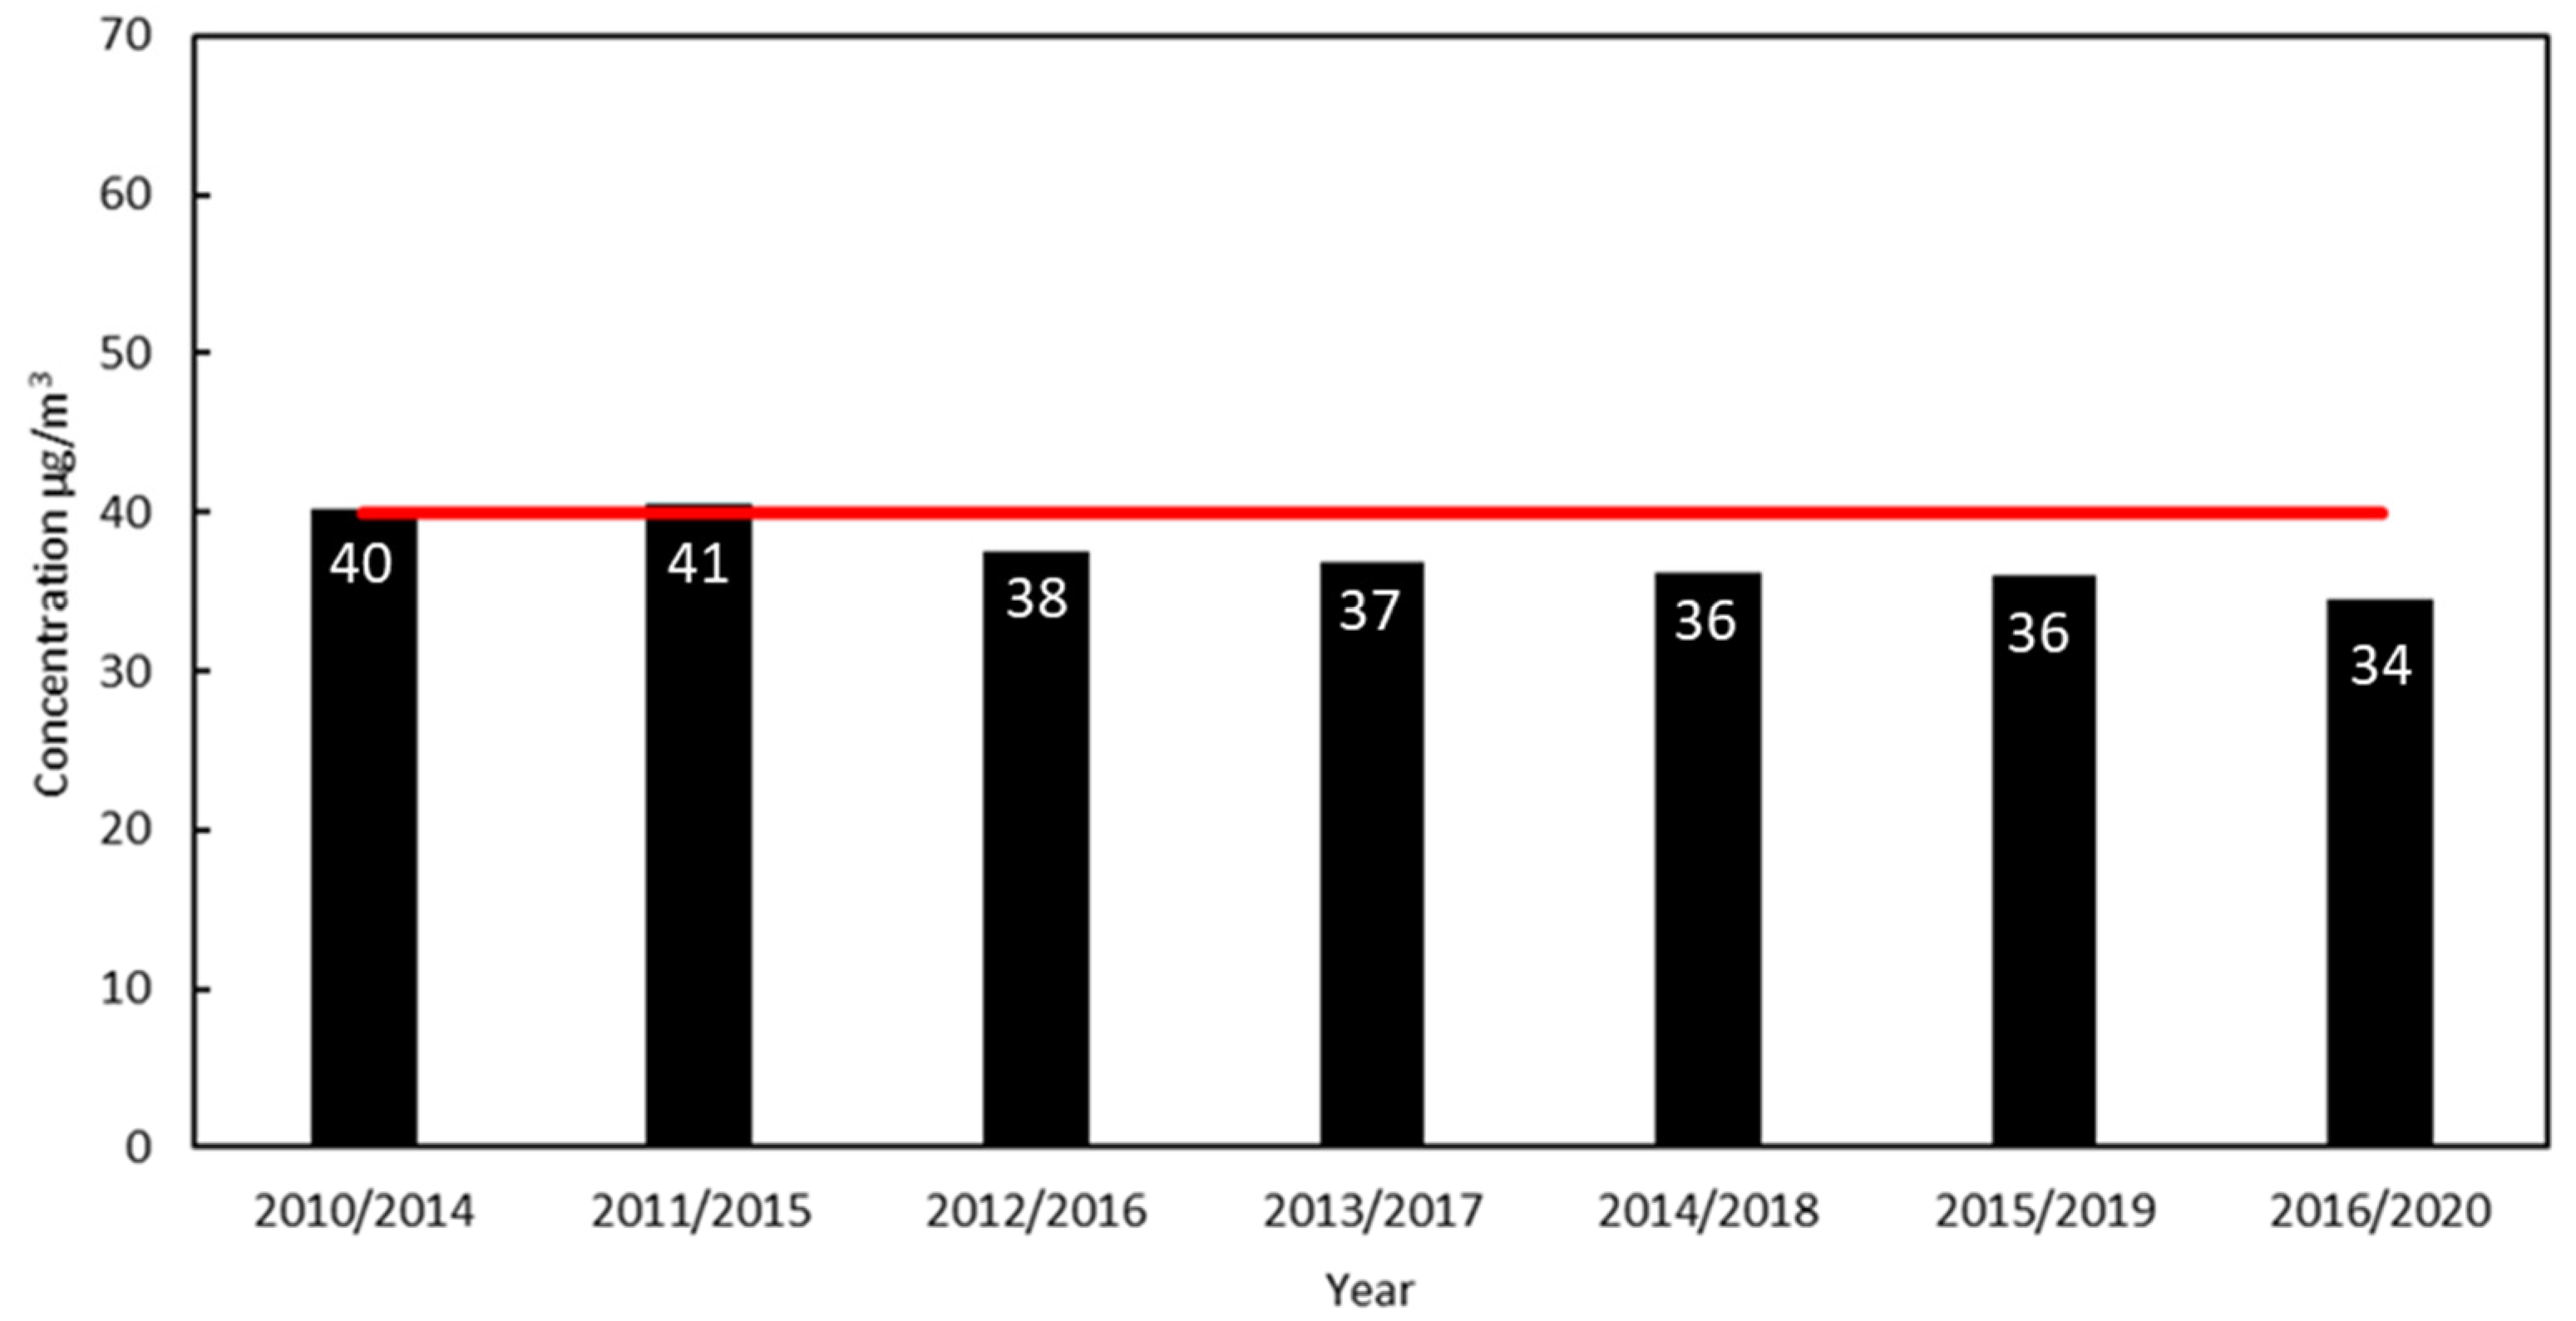
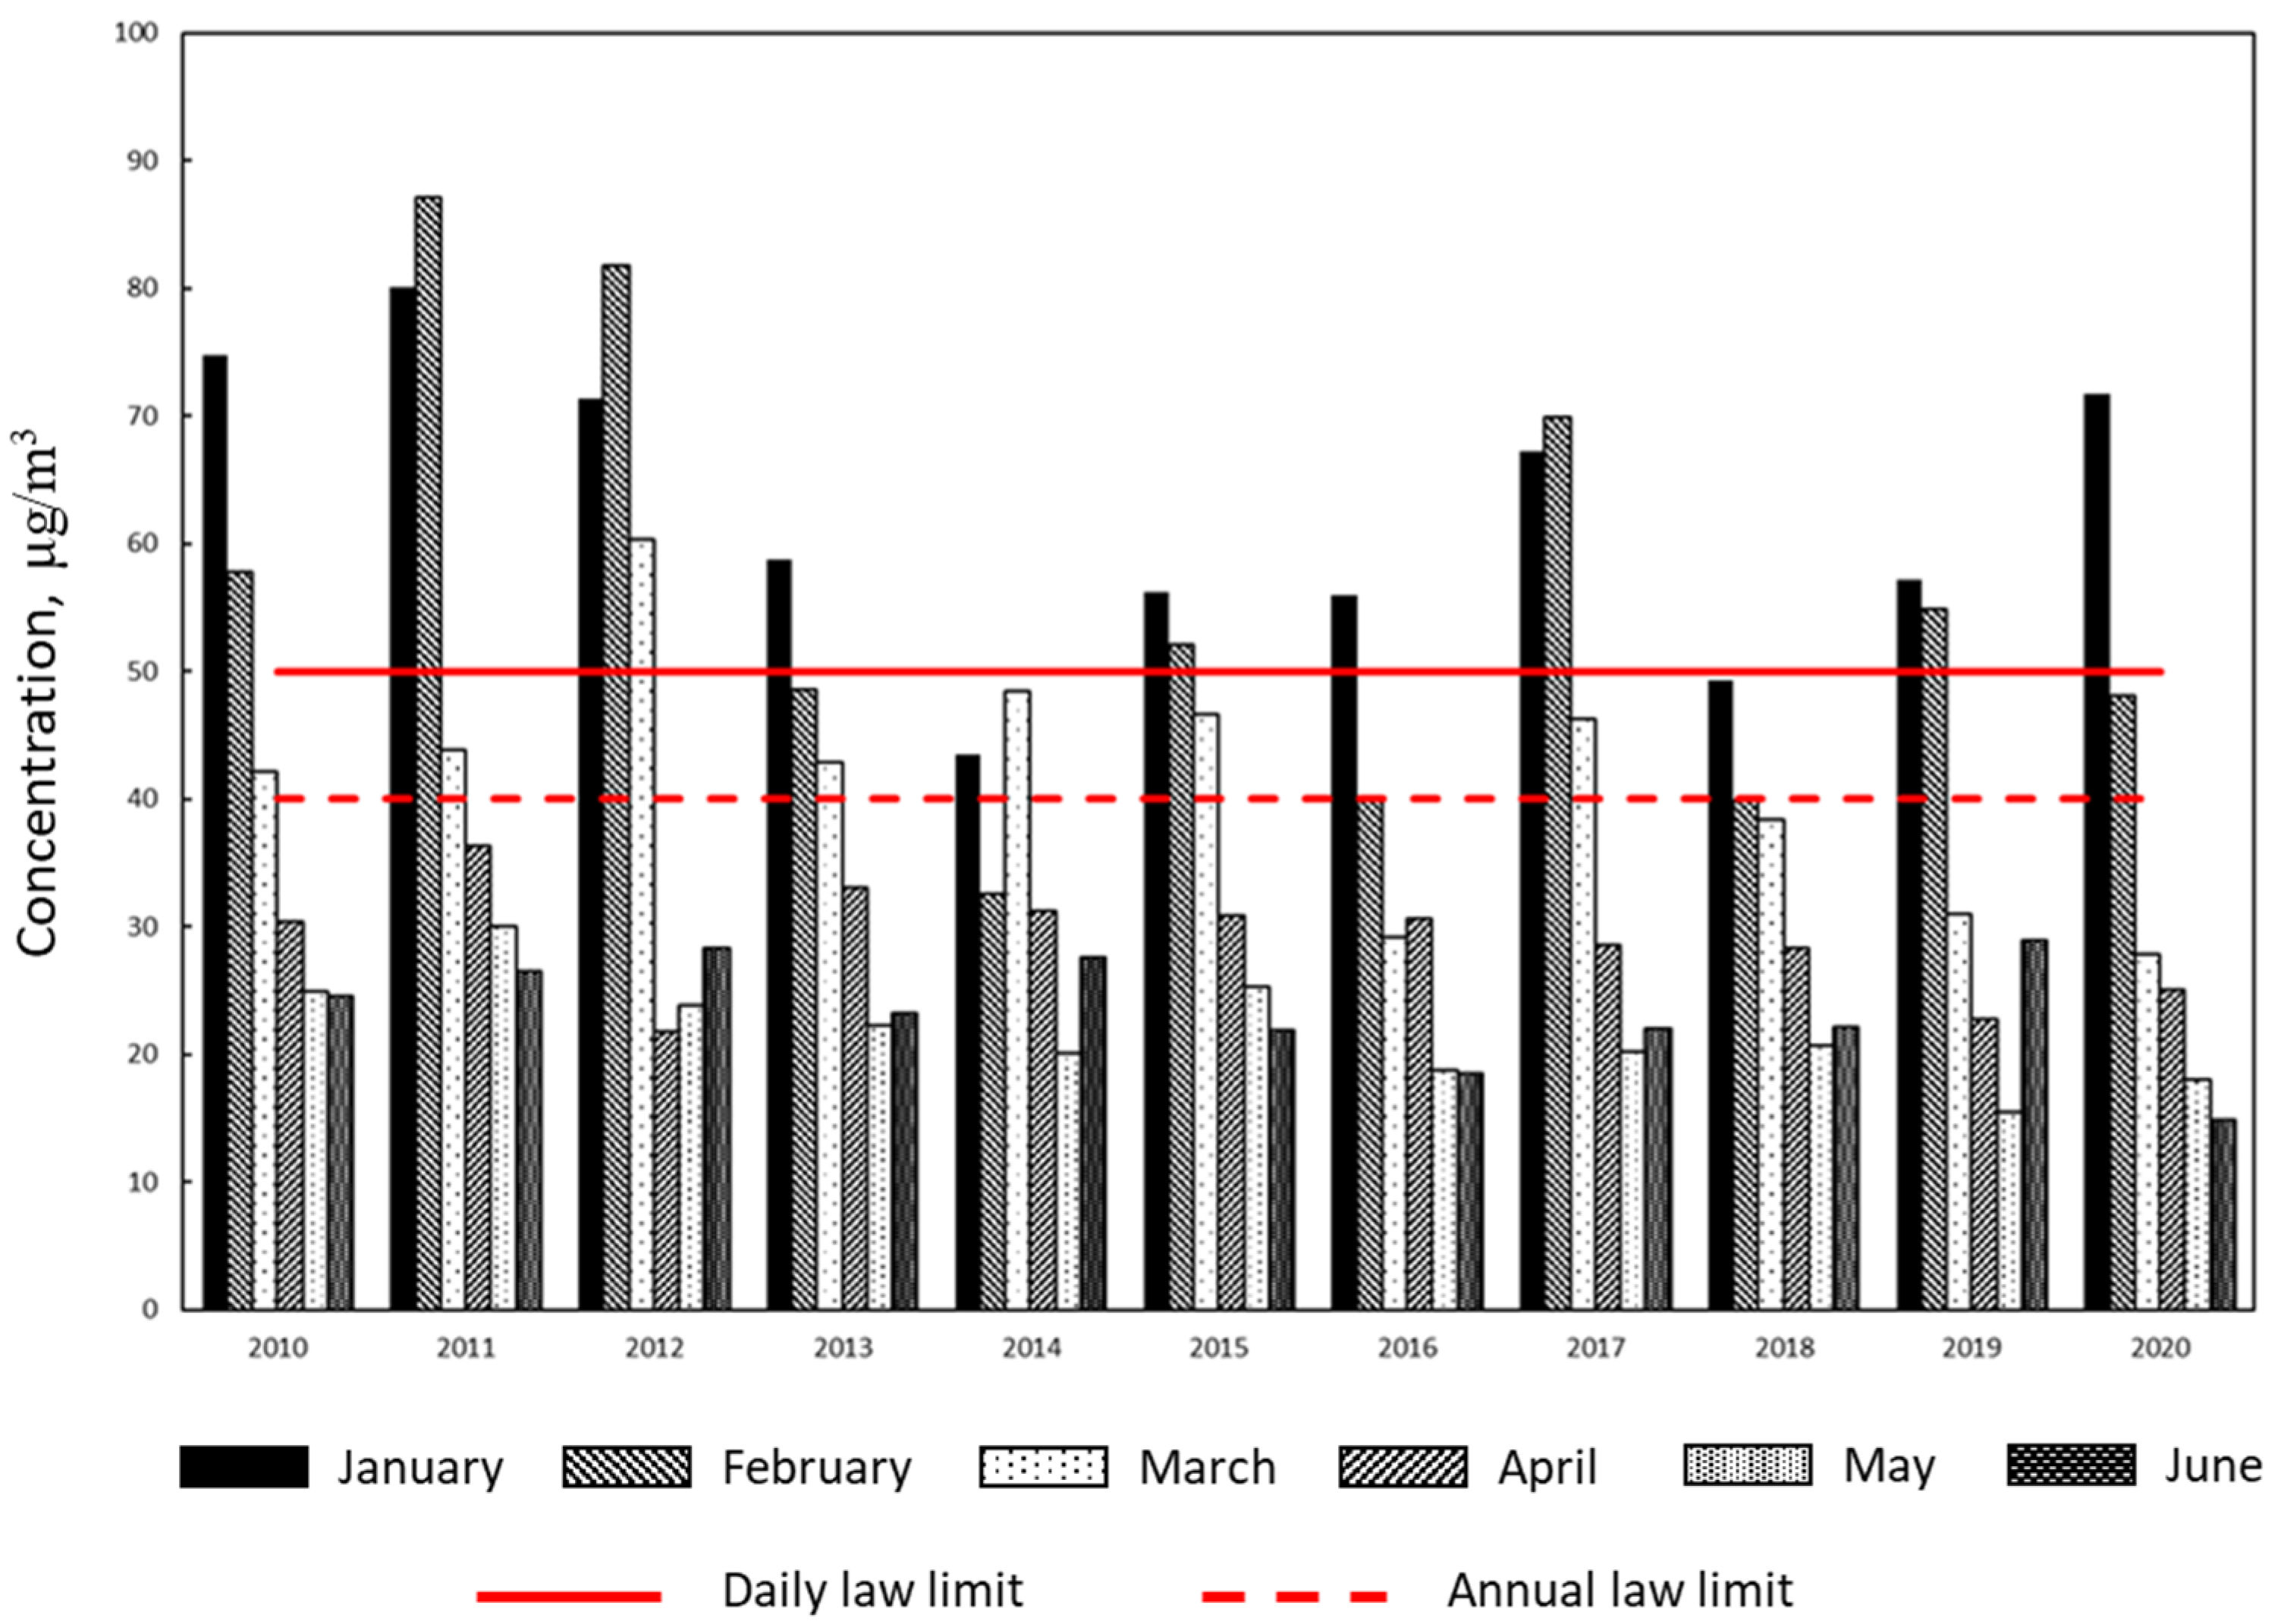
3.1. Annual Trend 2010–2020
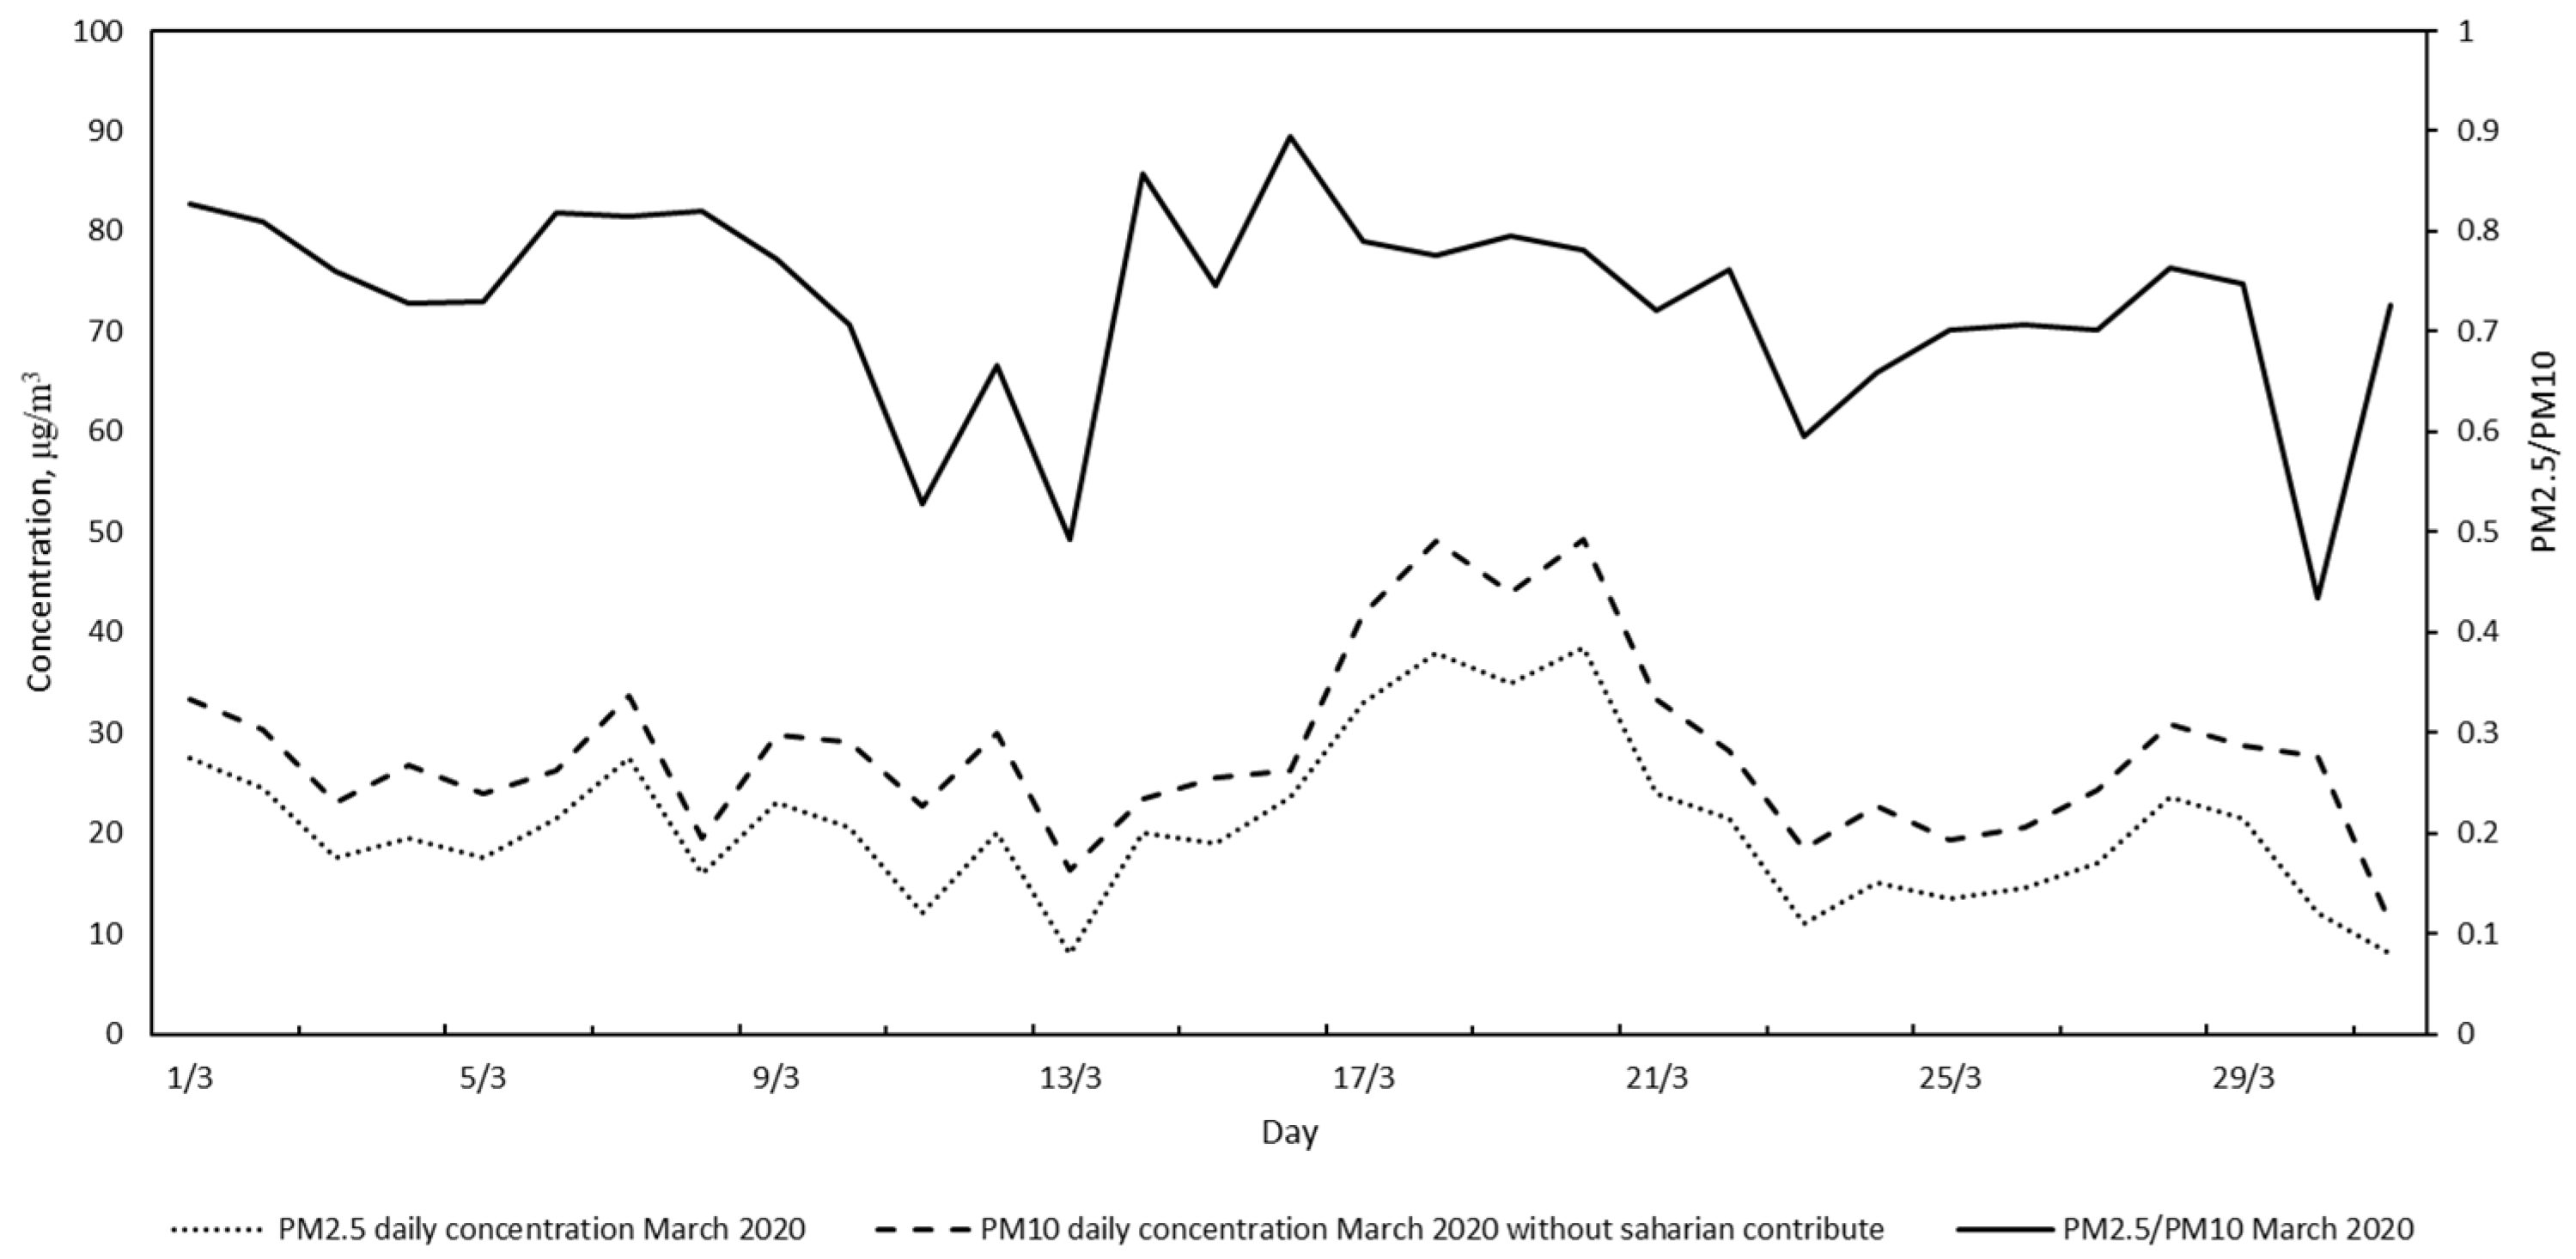
3.2. Trend Analysis of March 2020
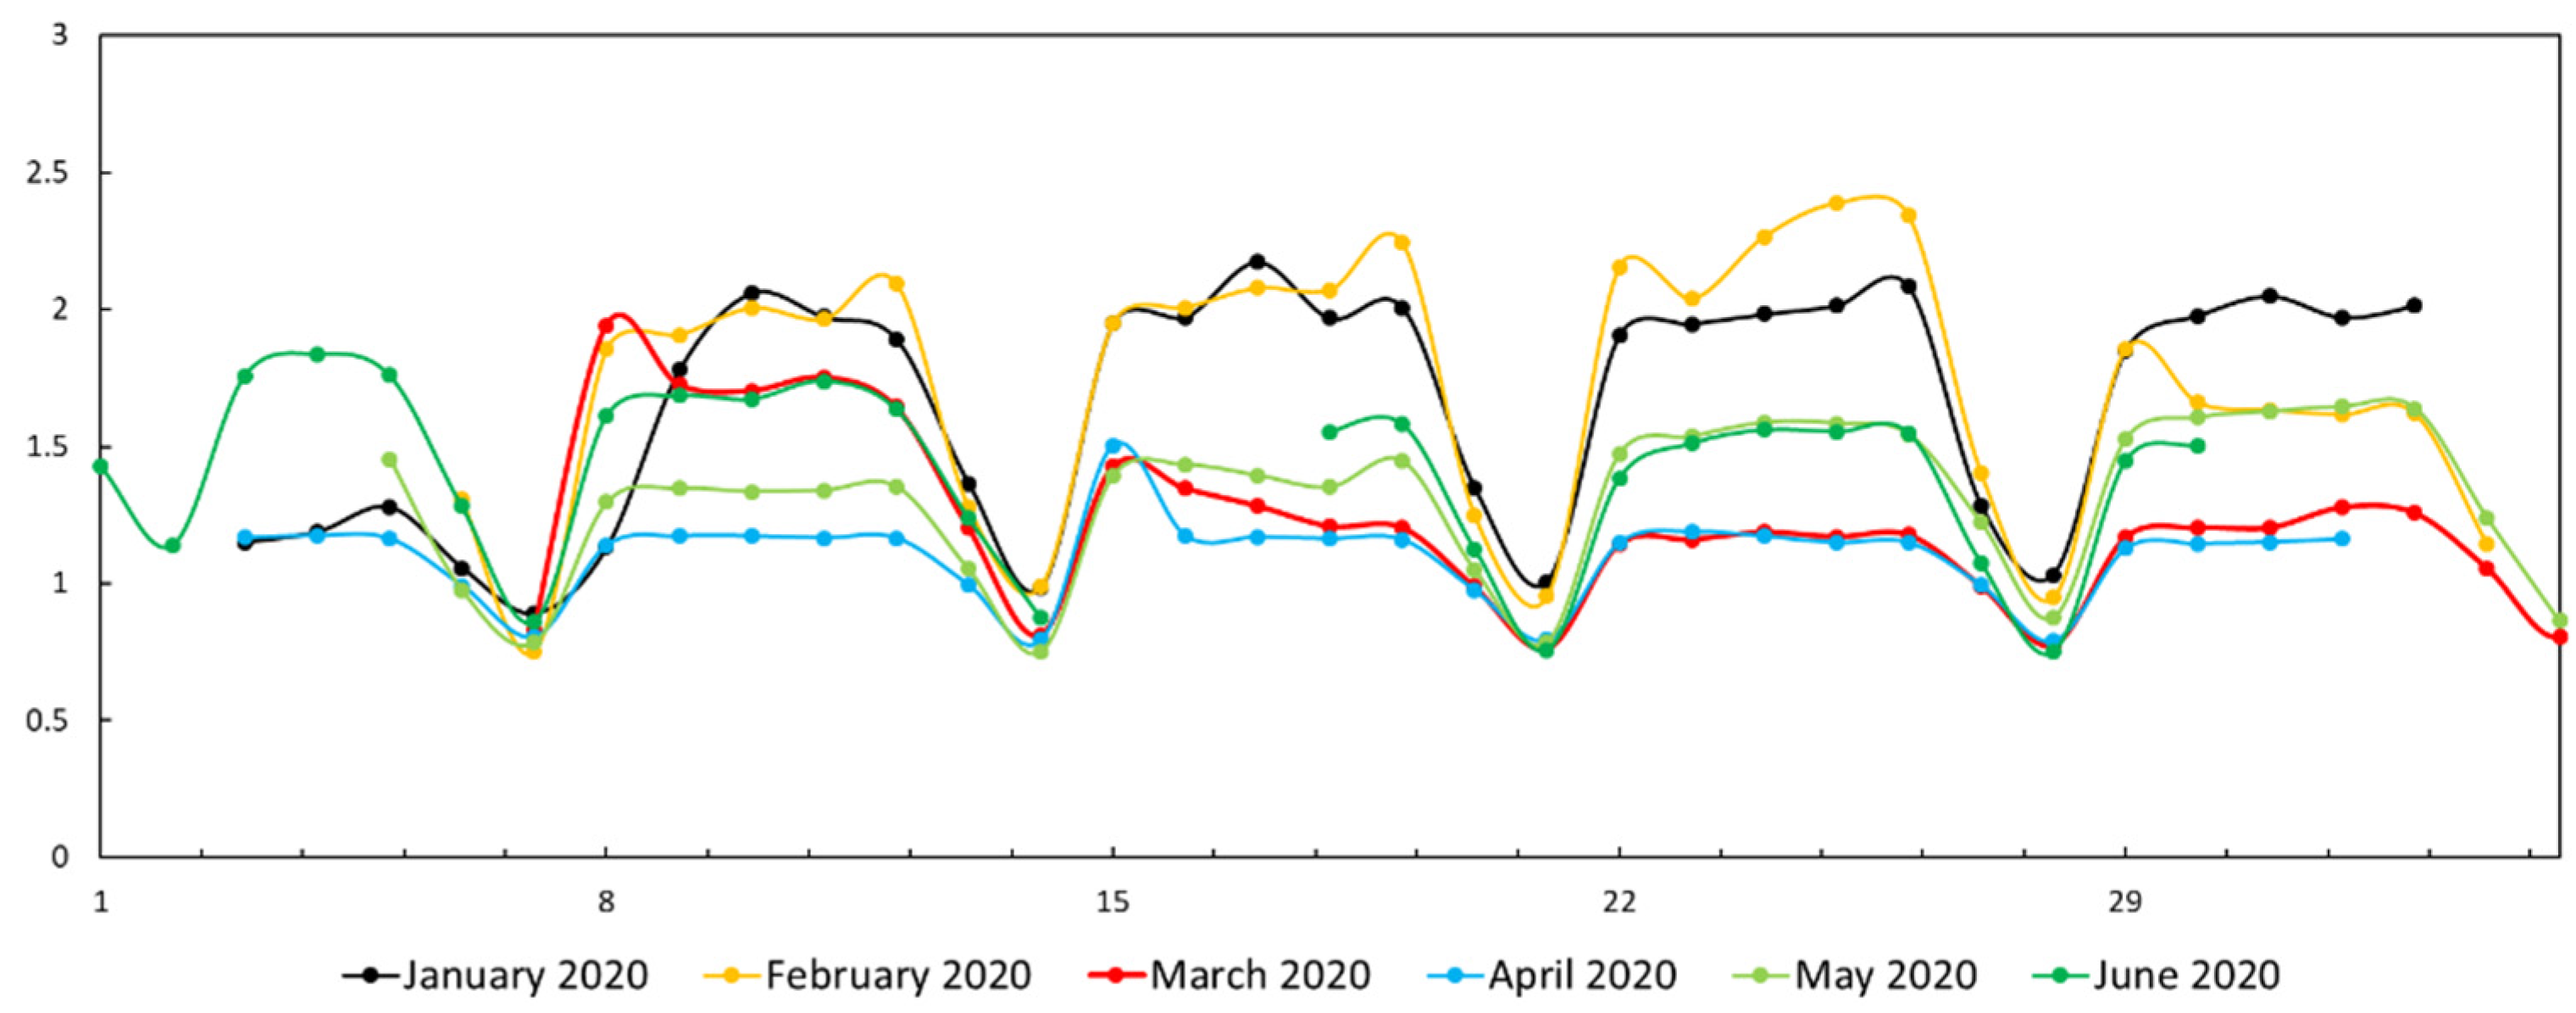
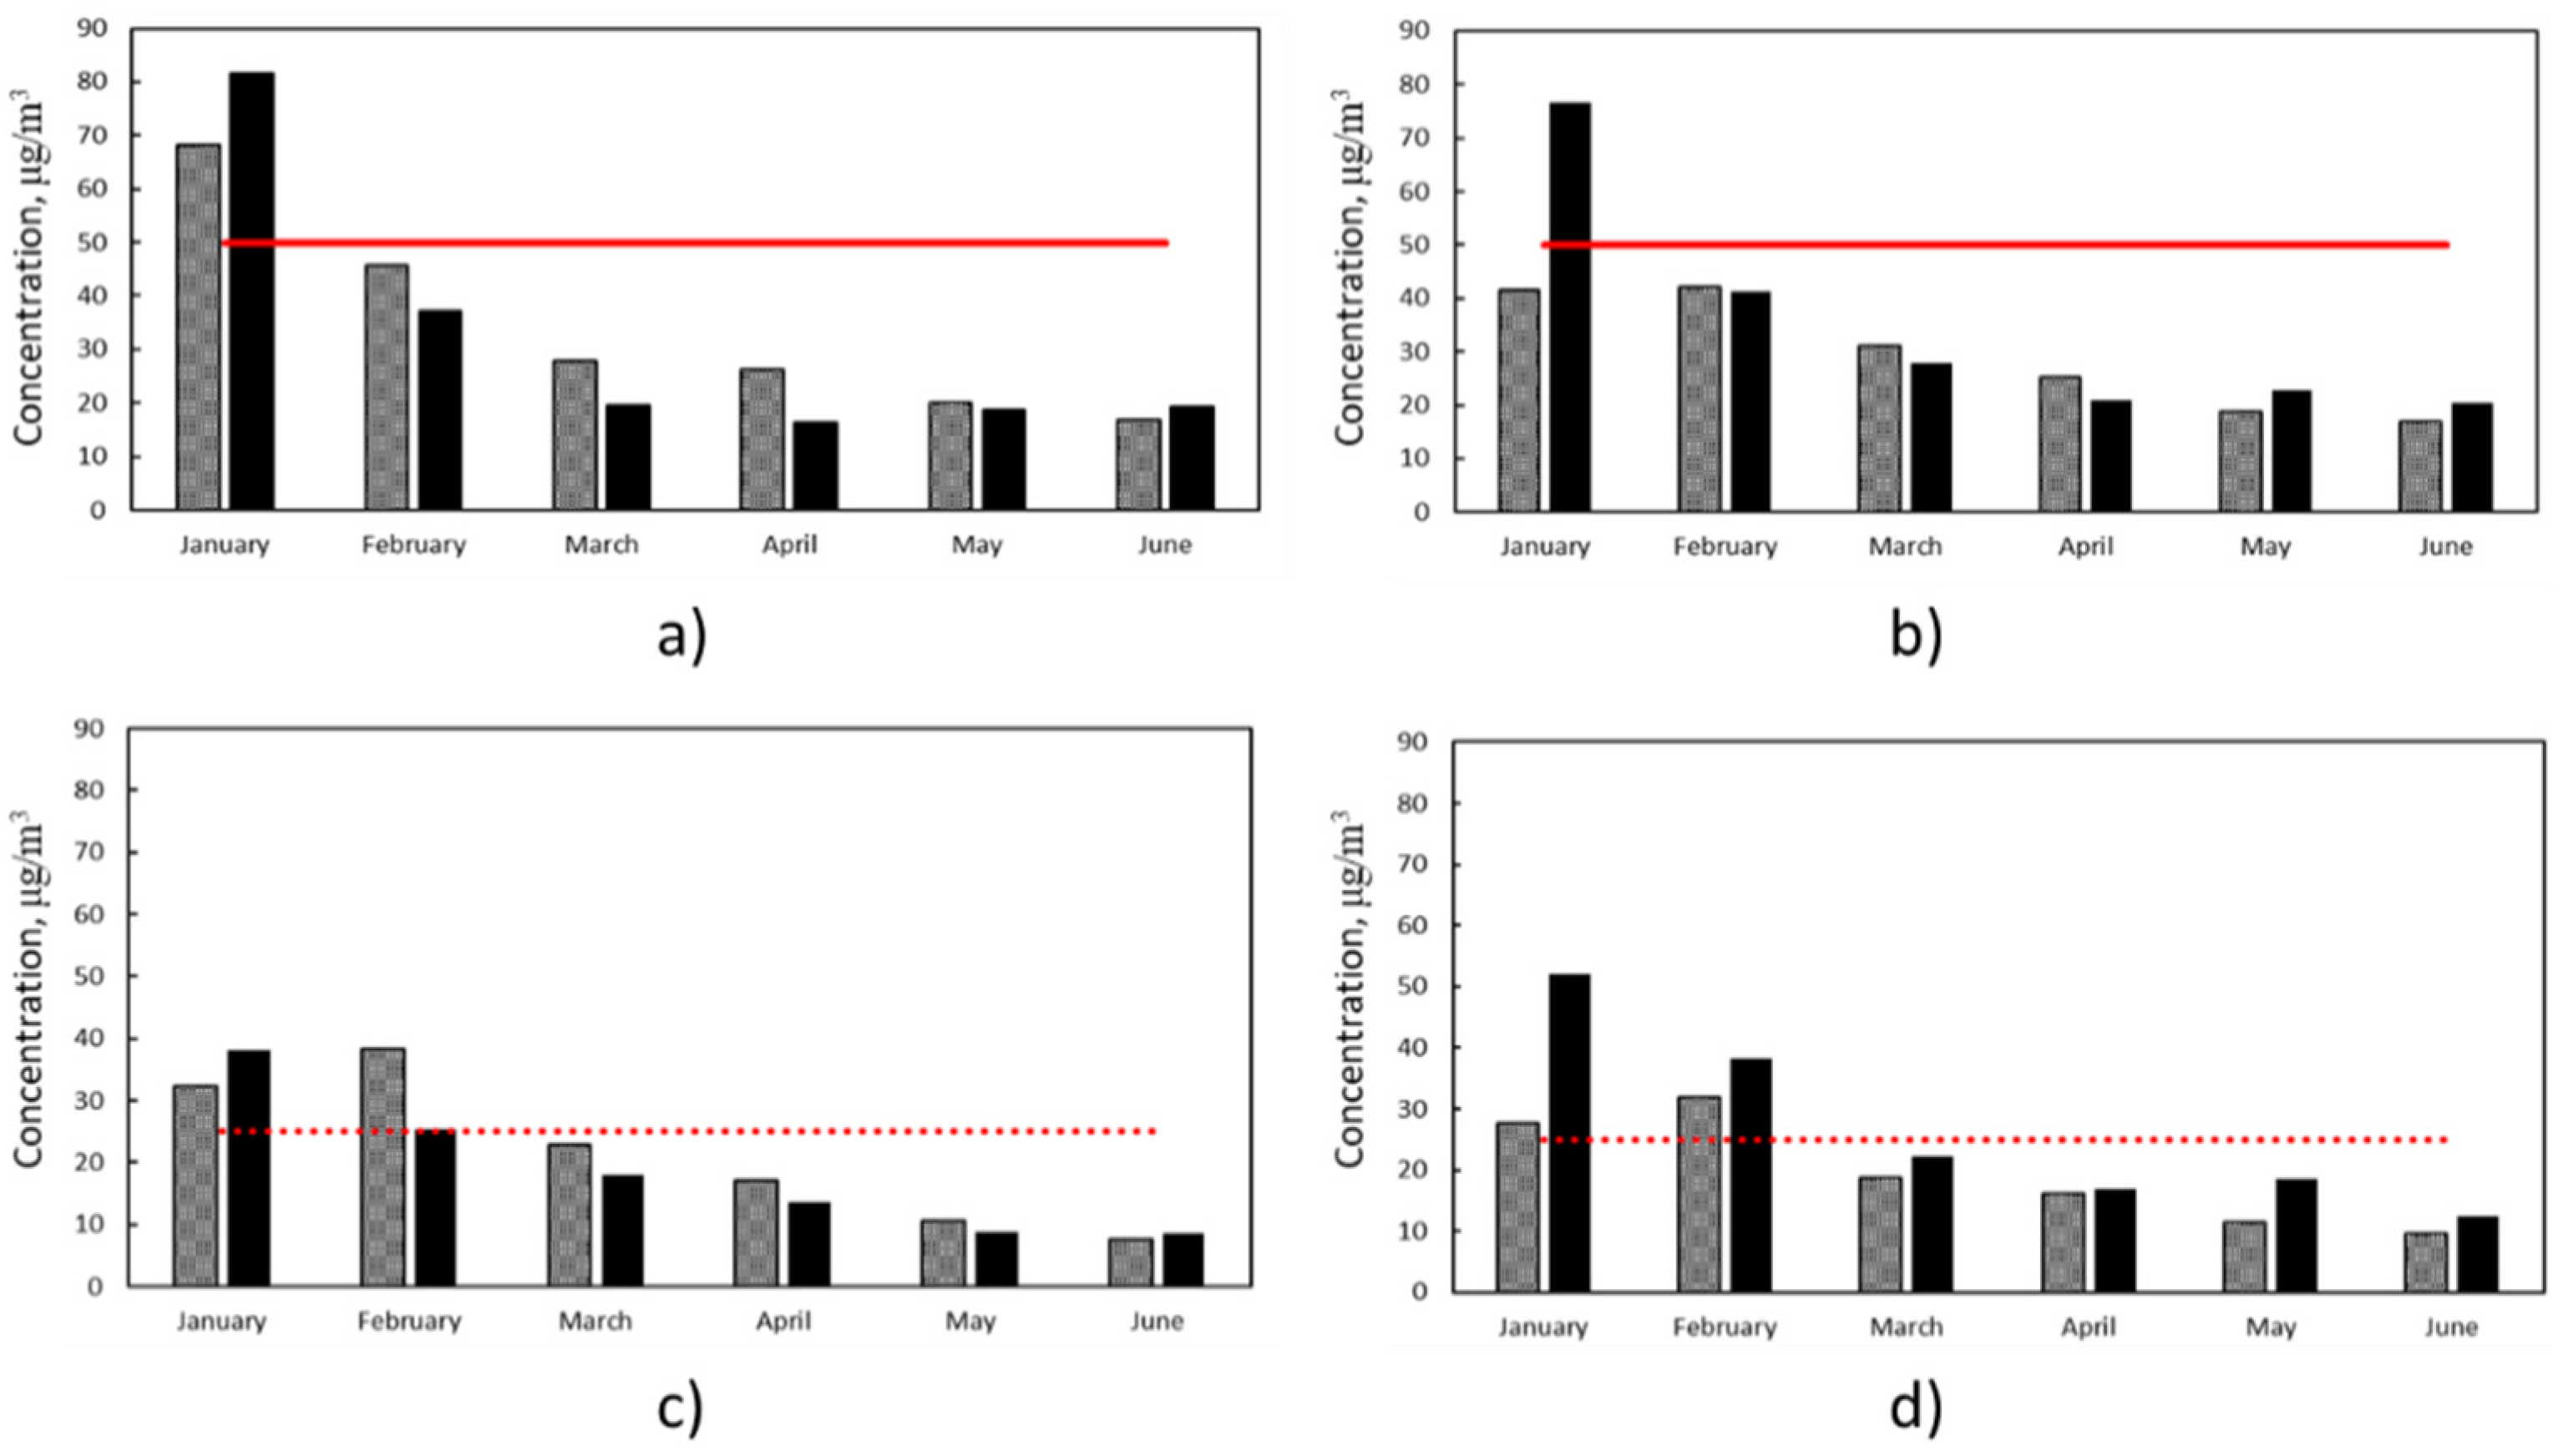
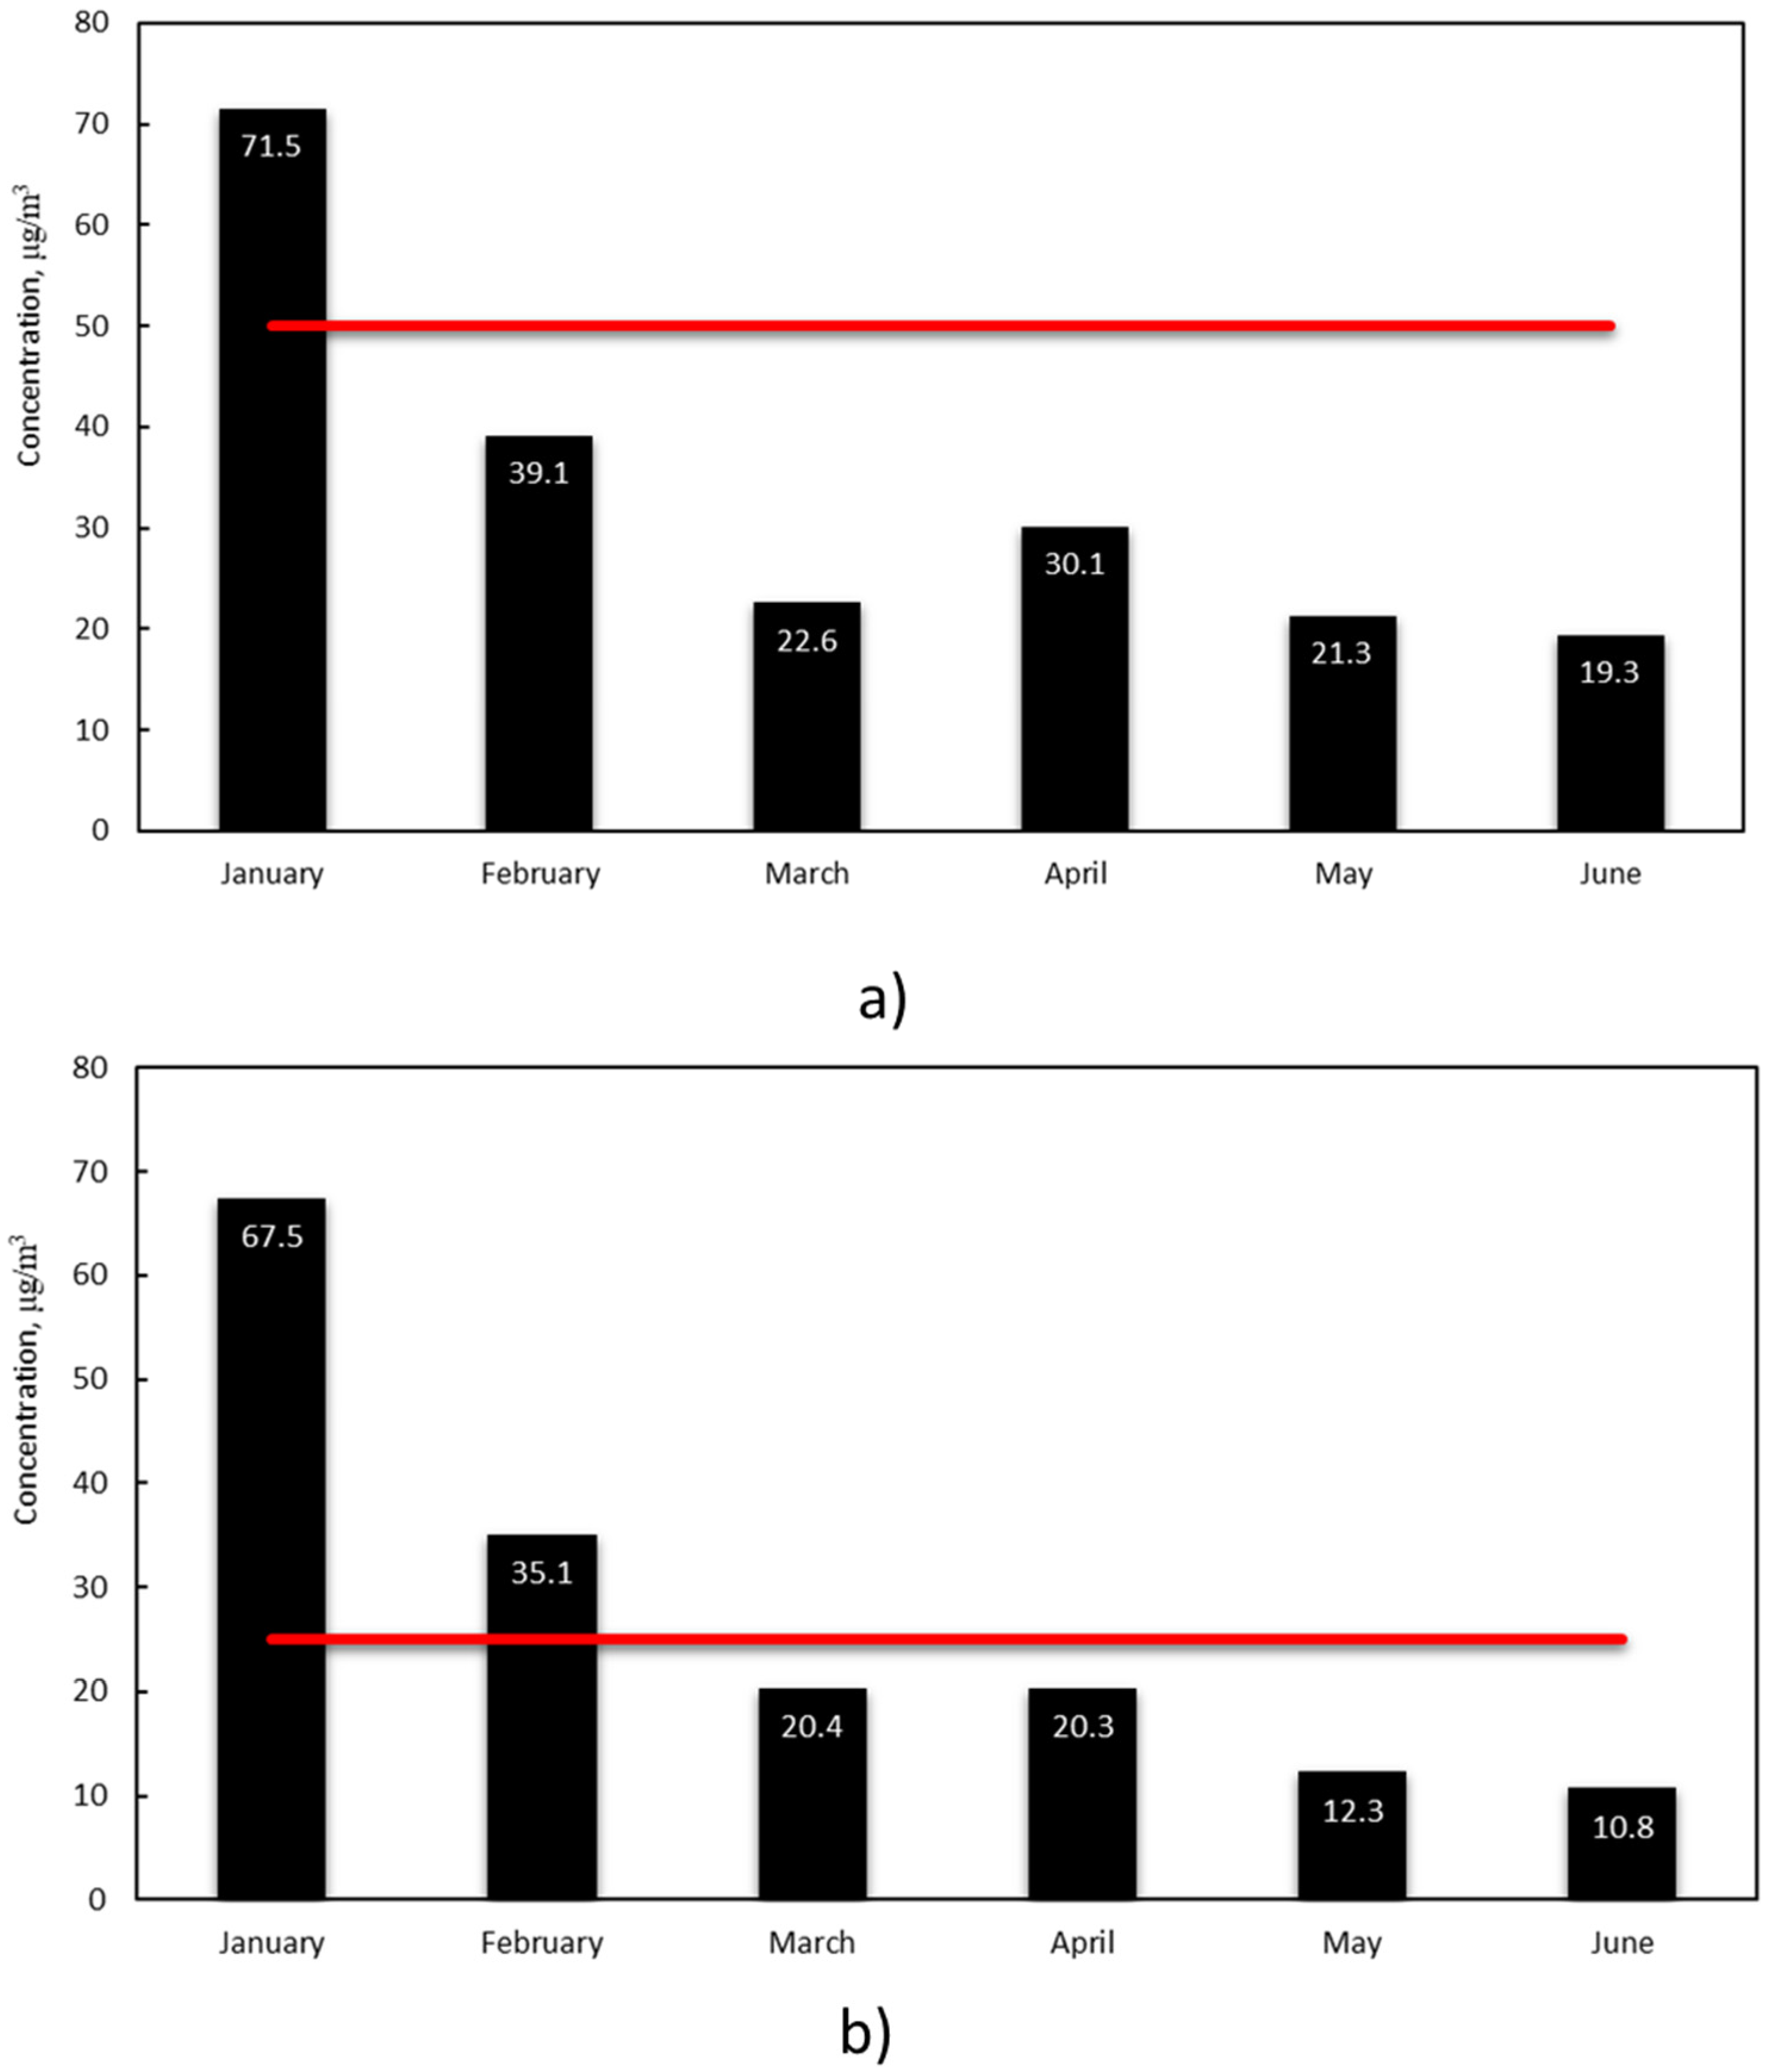
3.3. Trend Analysis of the First Six Months of the Years between 2010–2020
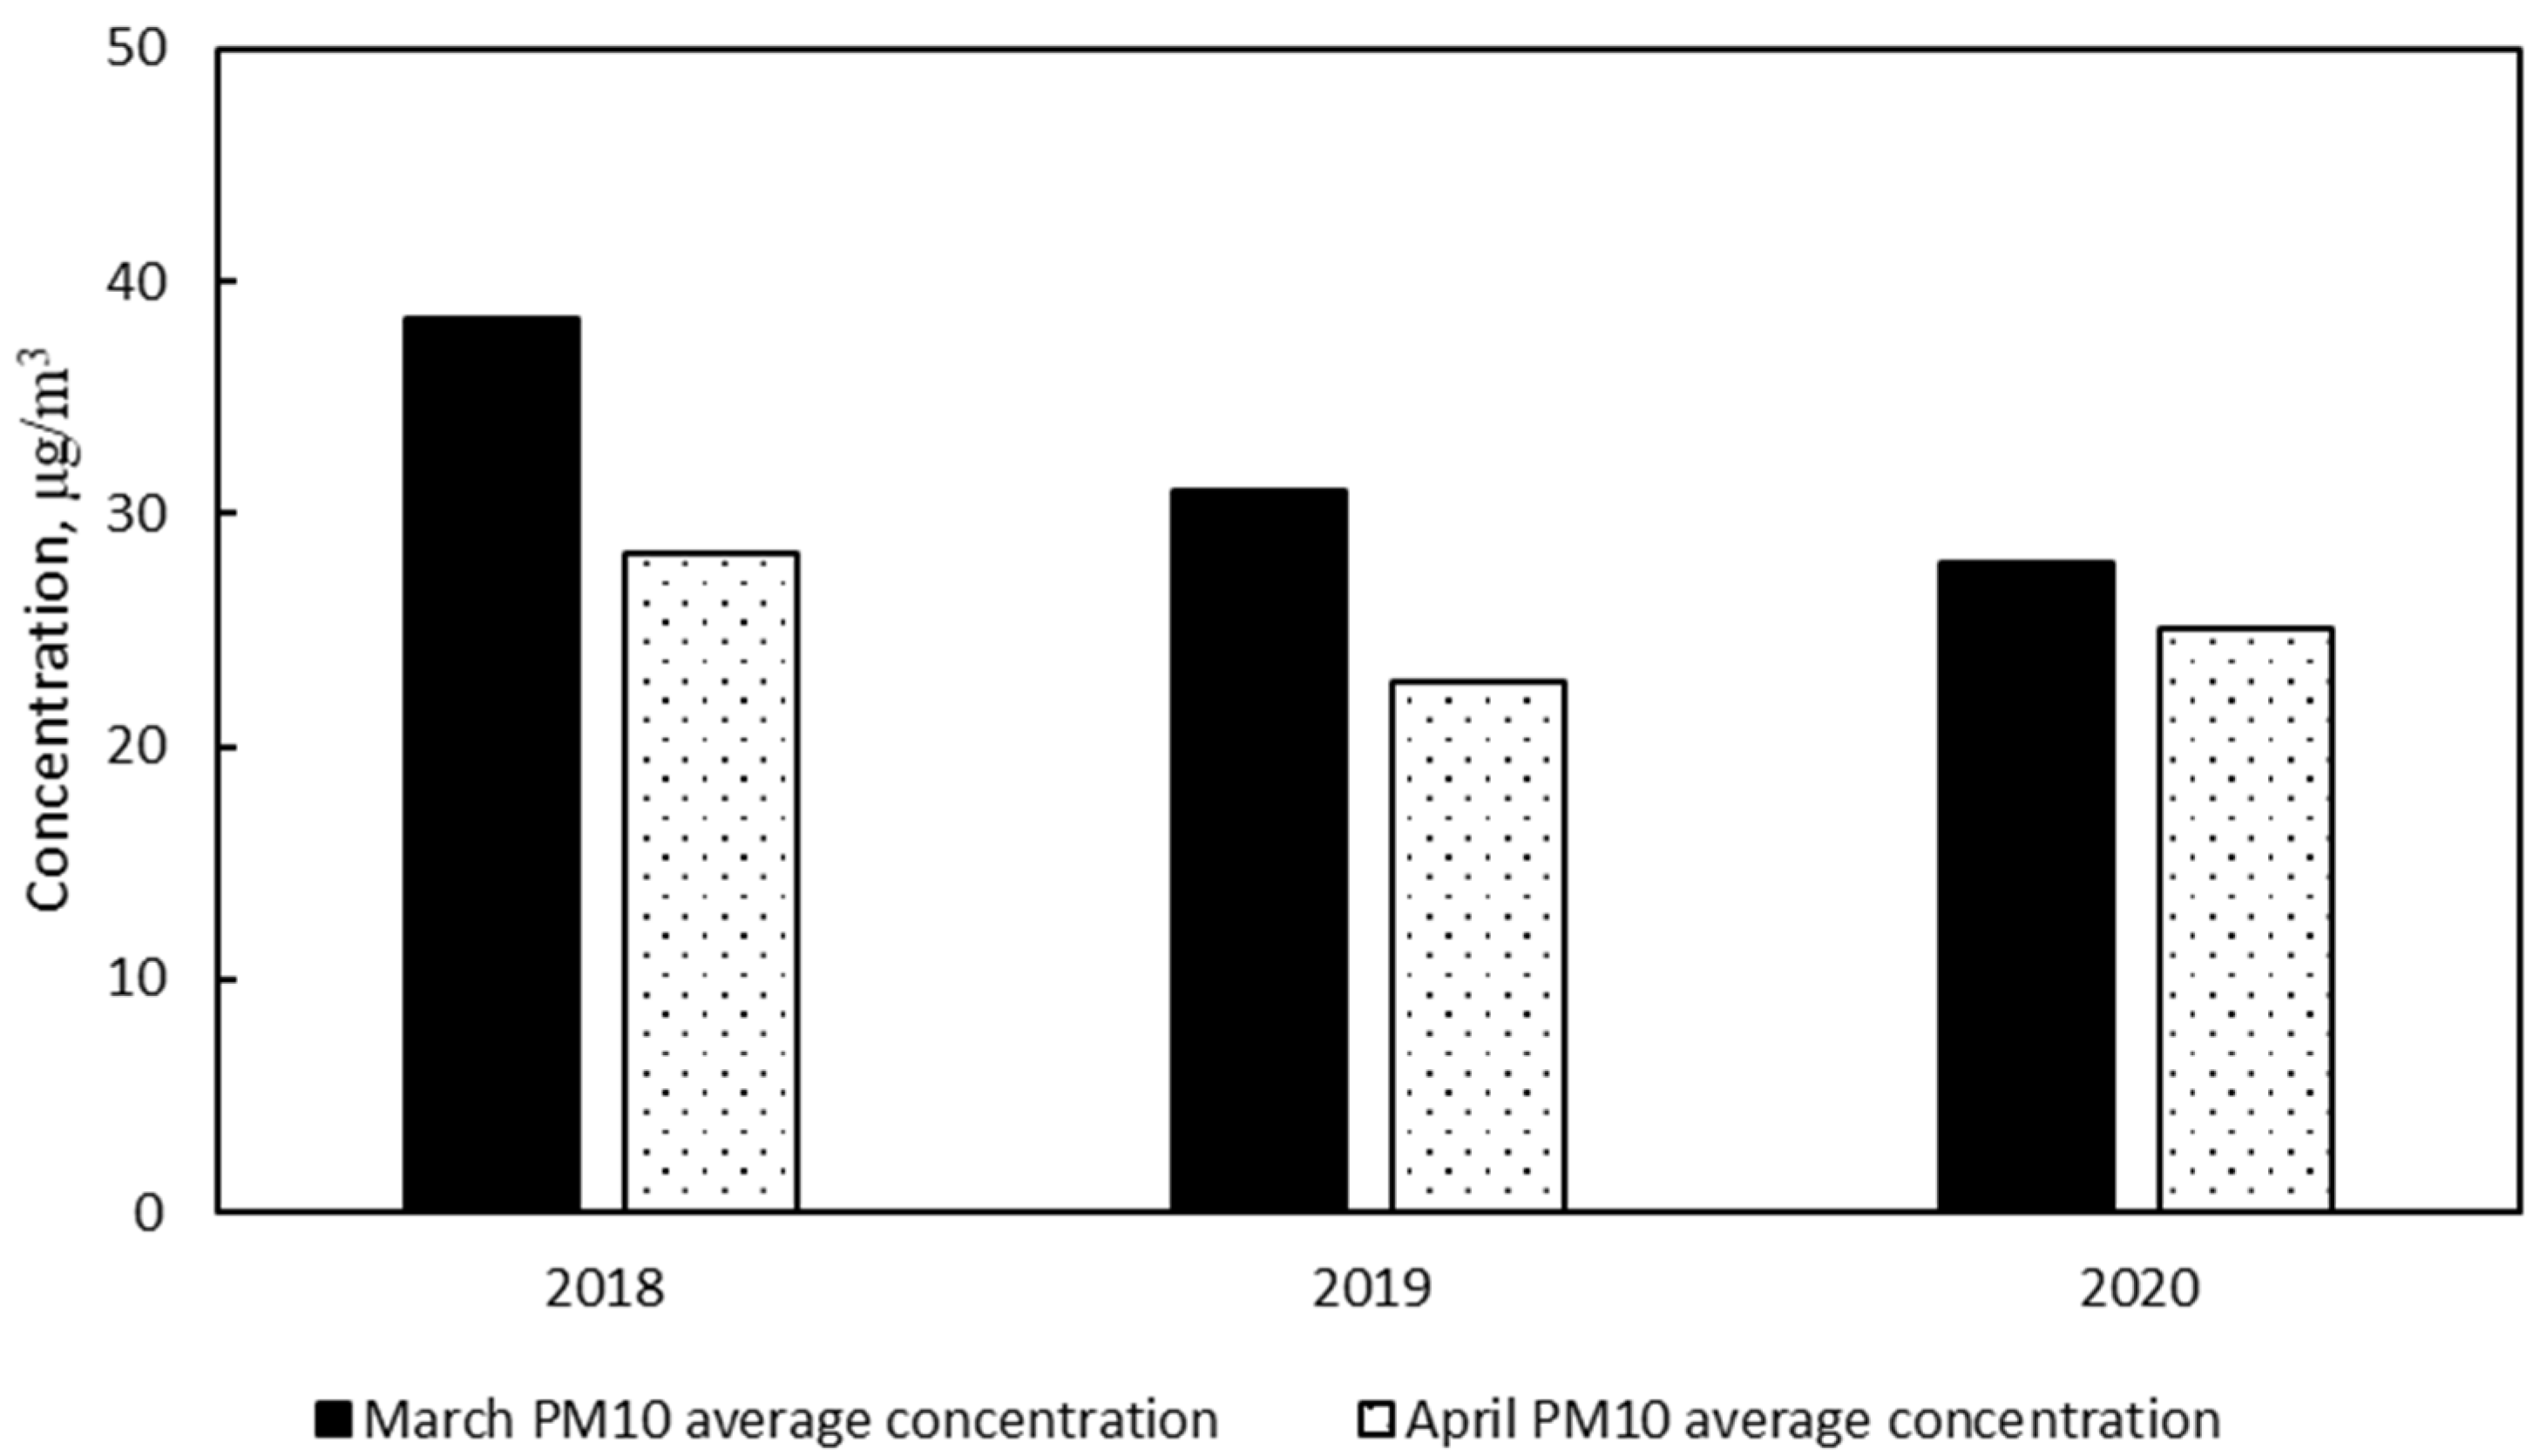
3.4. Trend Analysis of March–April 2018/2020
3.5. Traffic Analysis
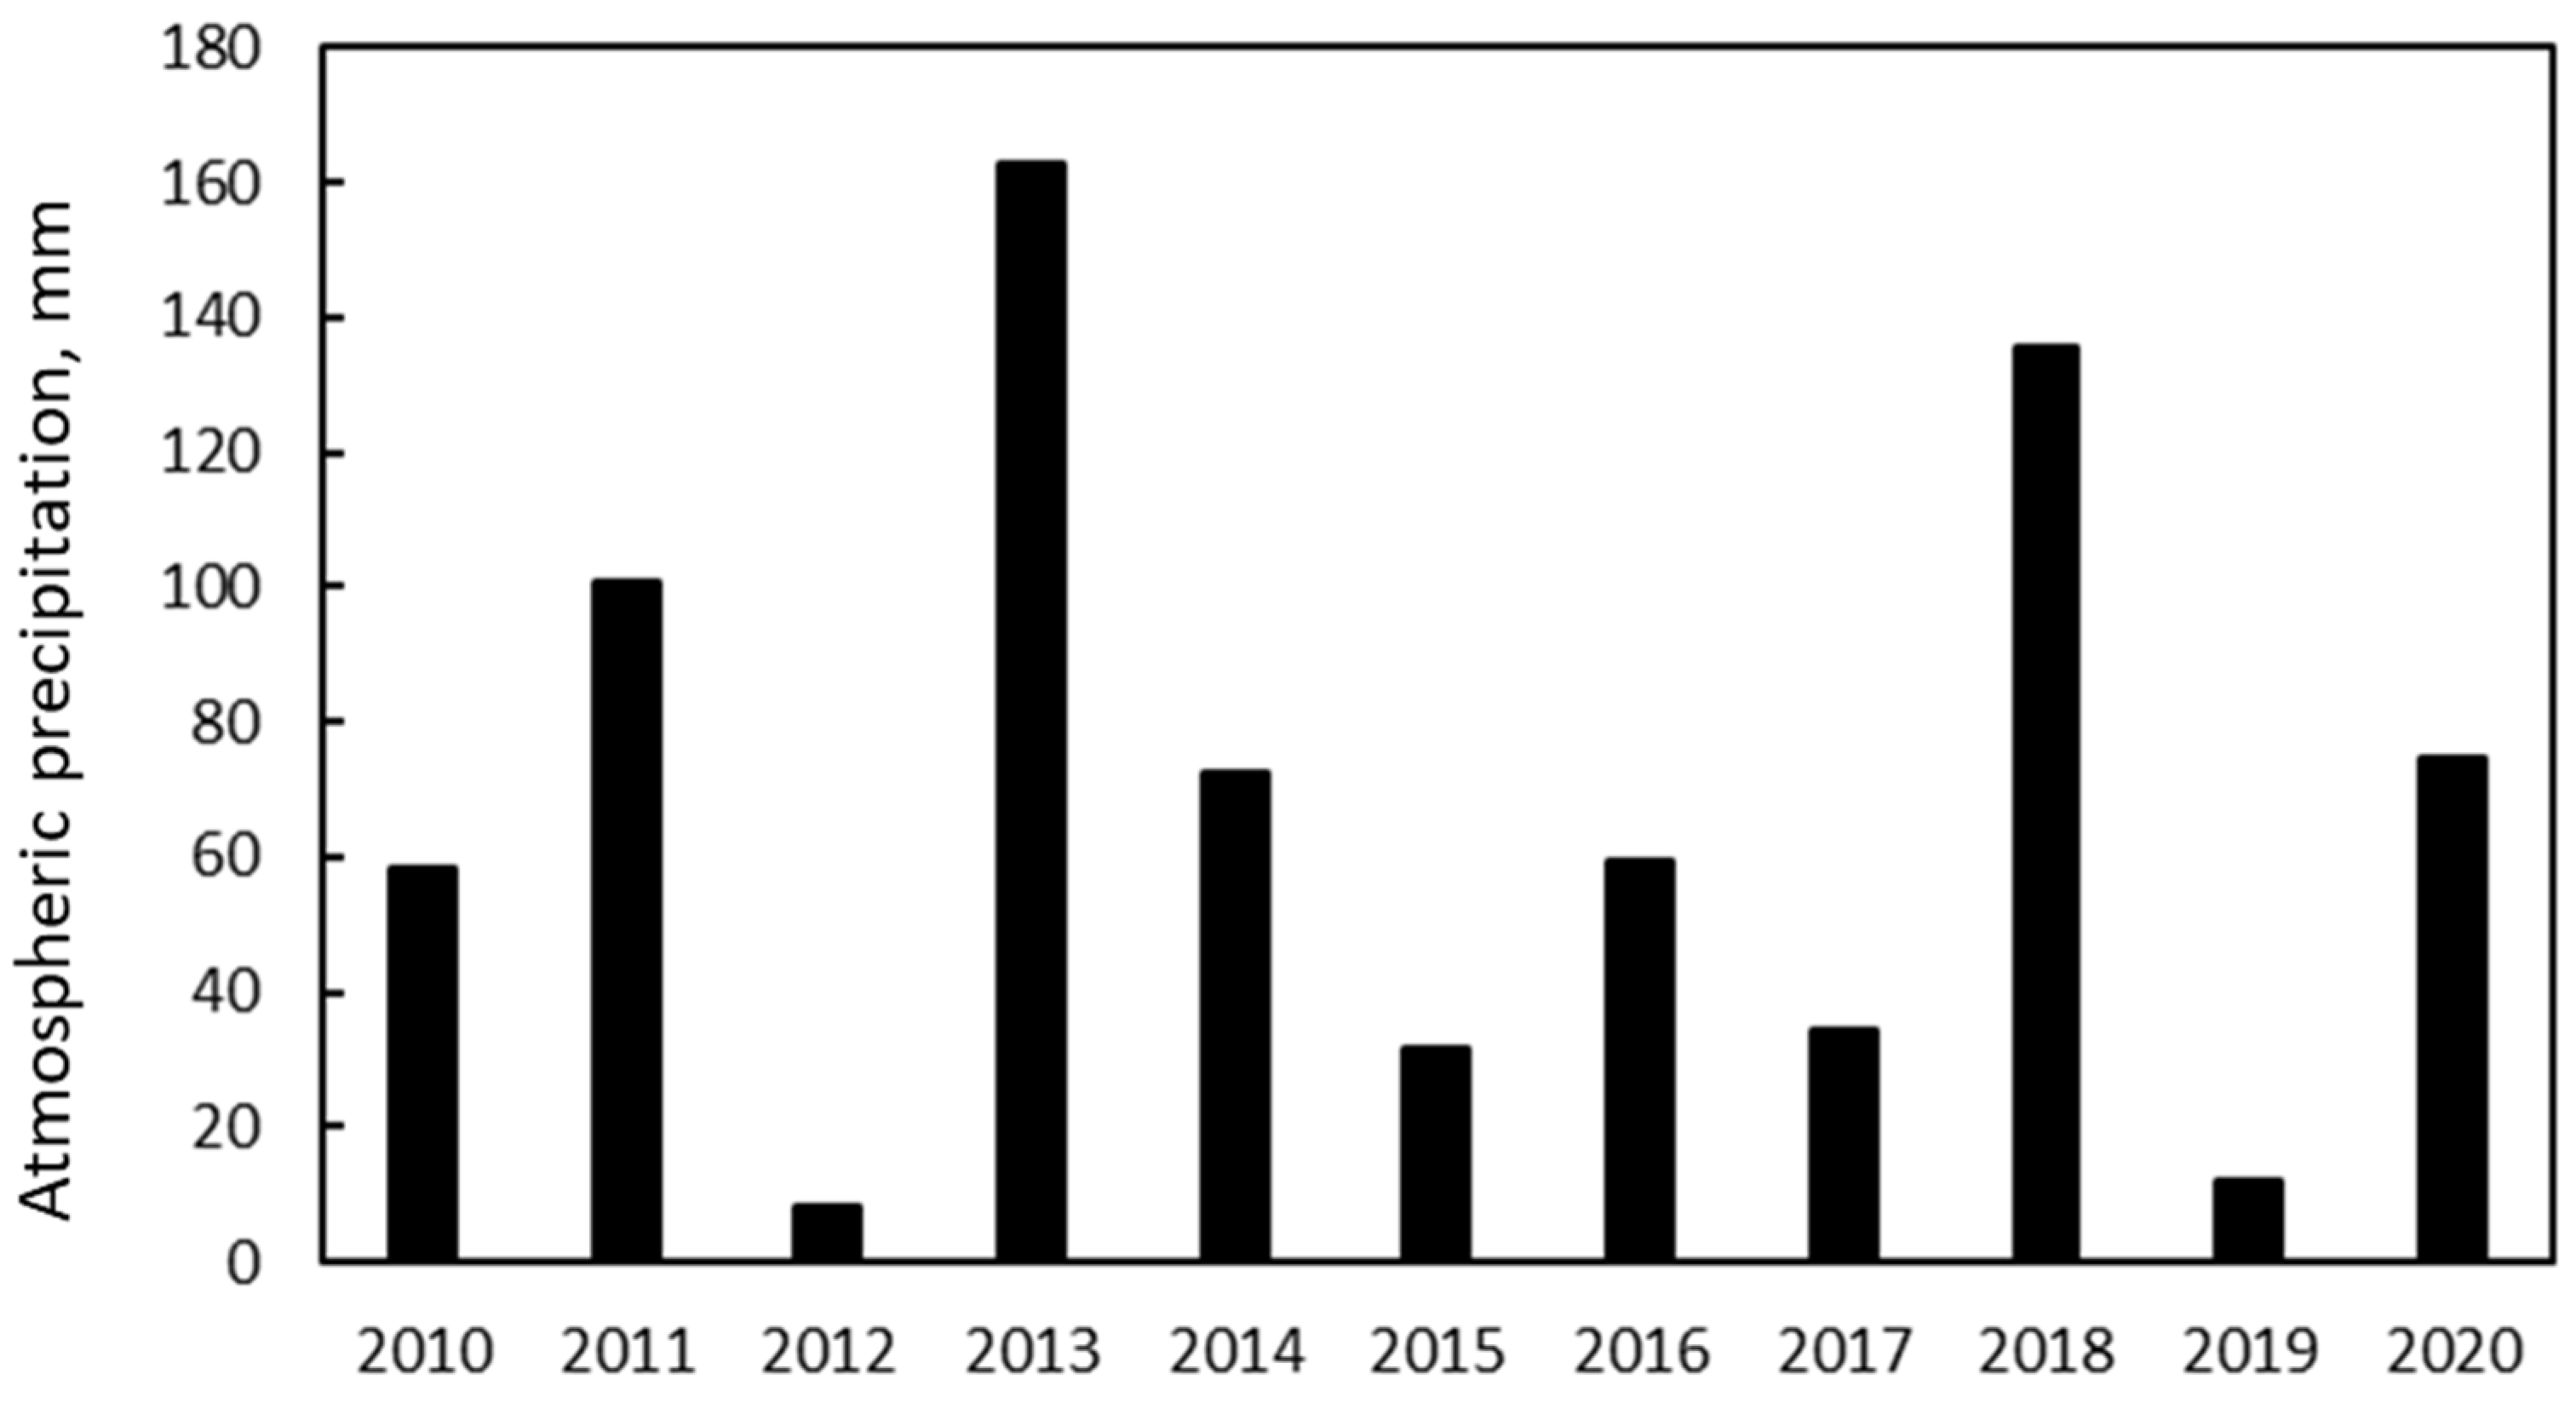
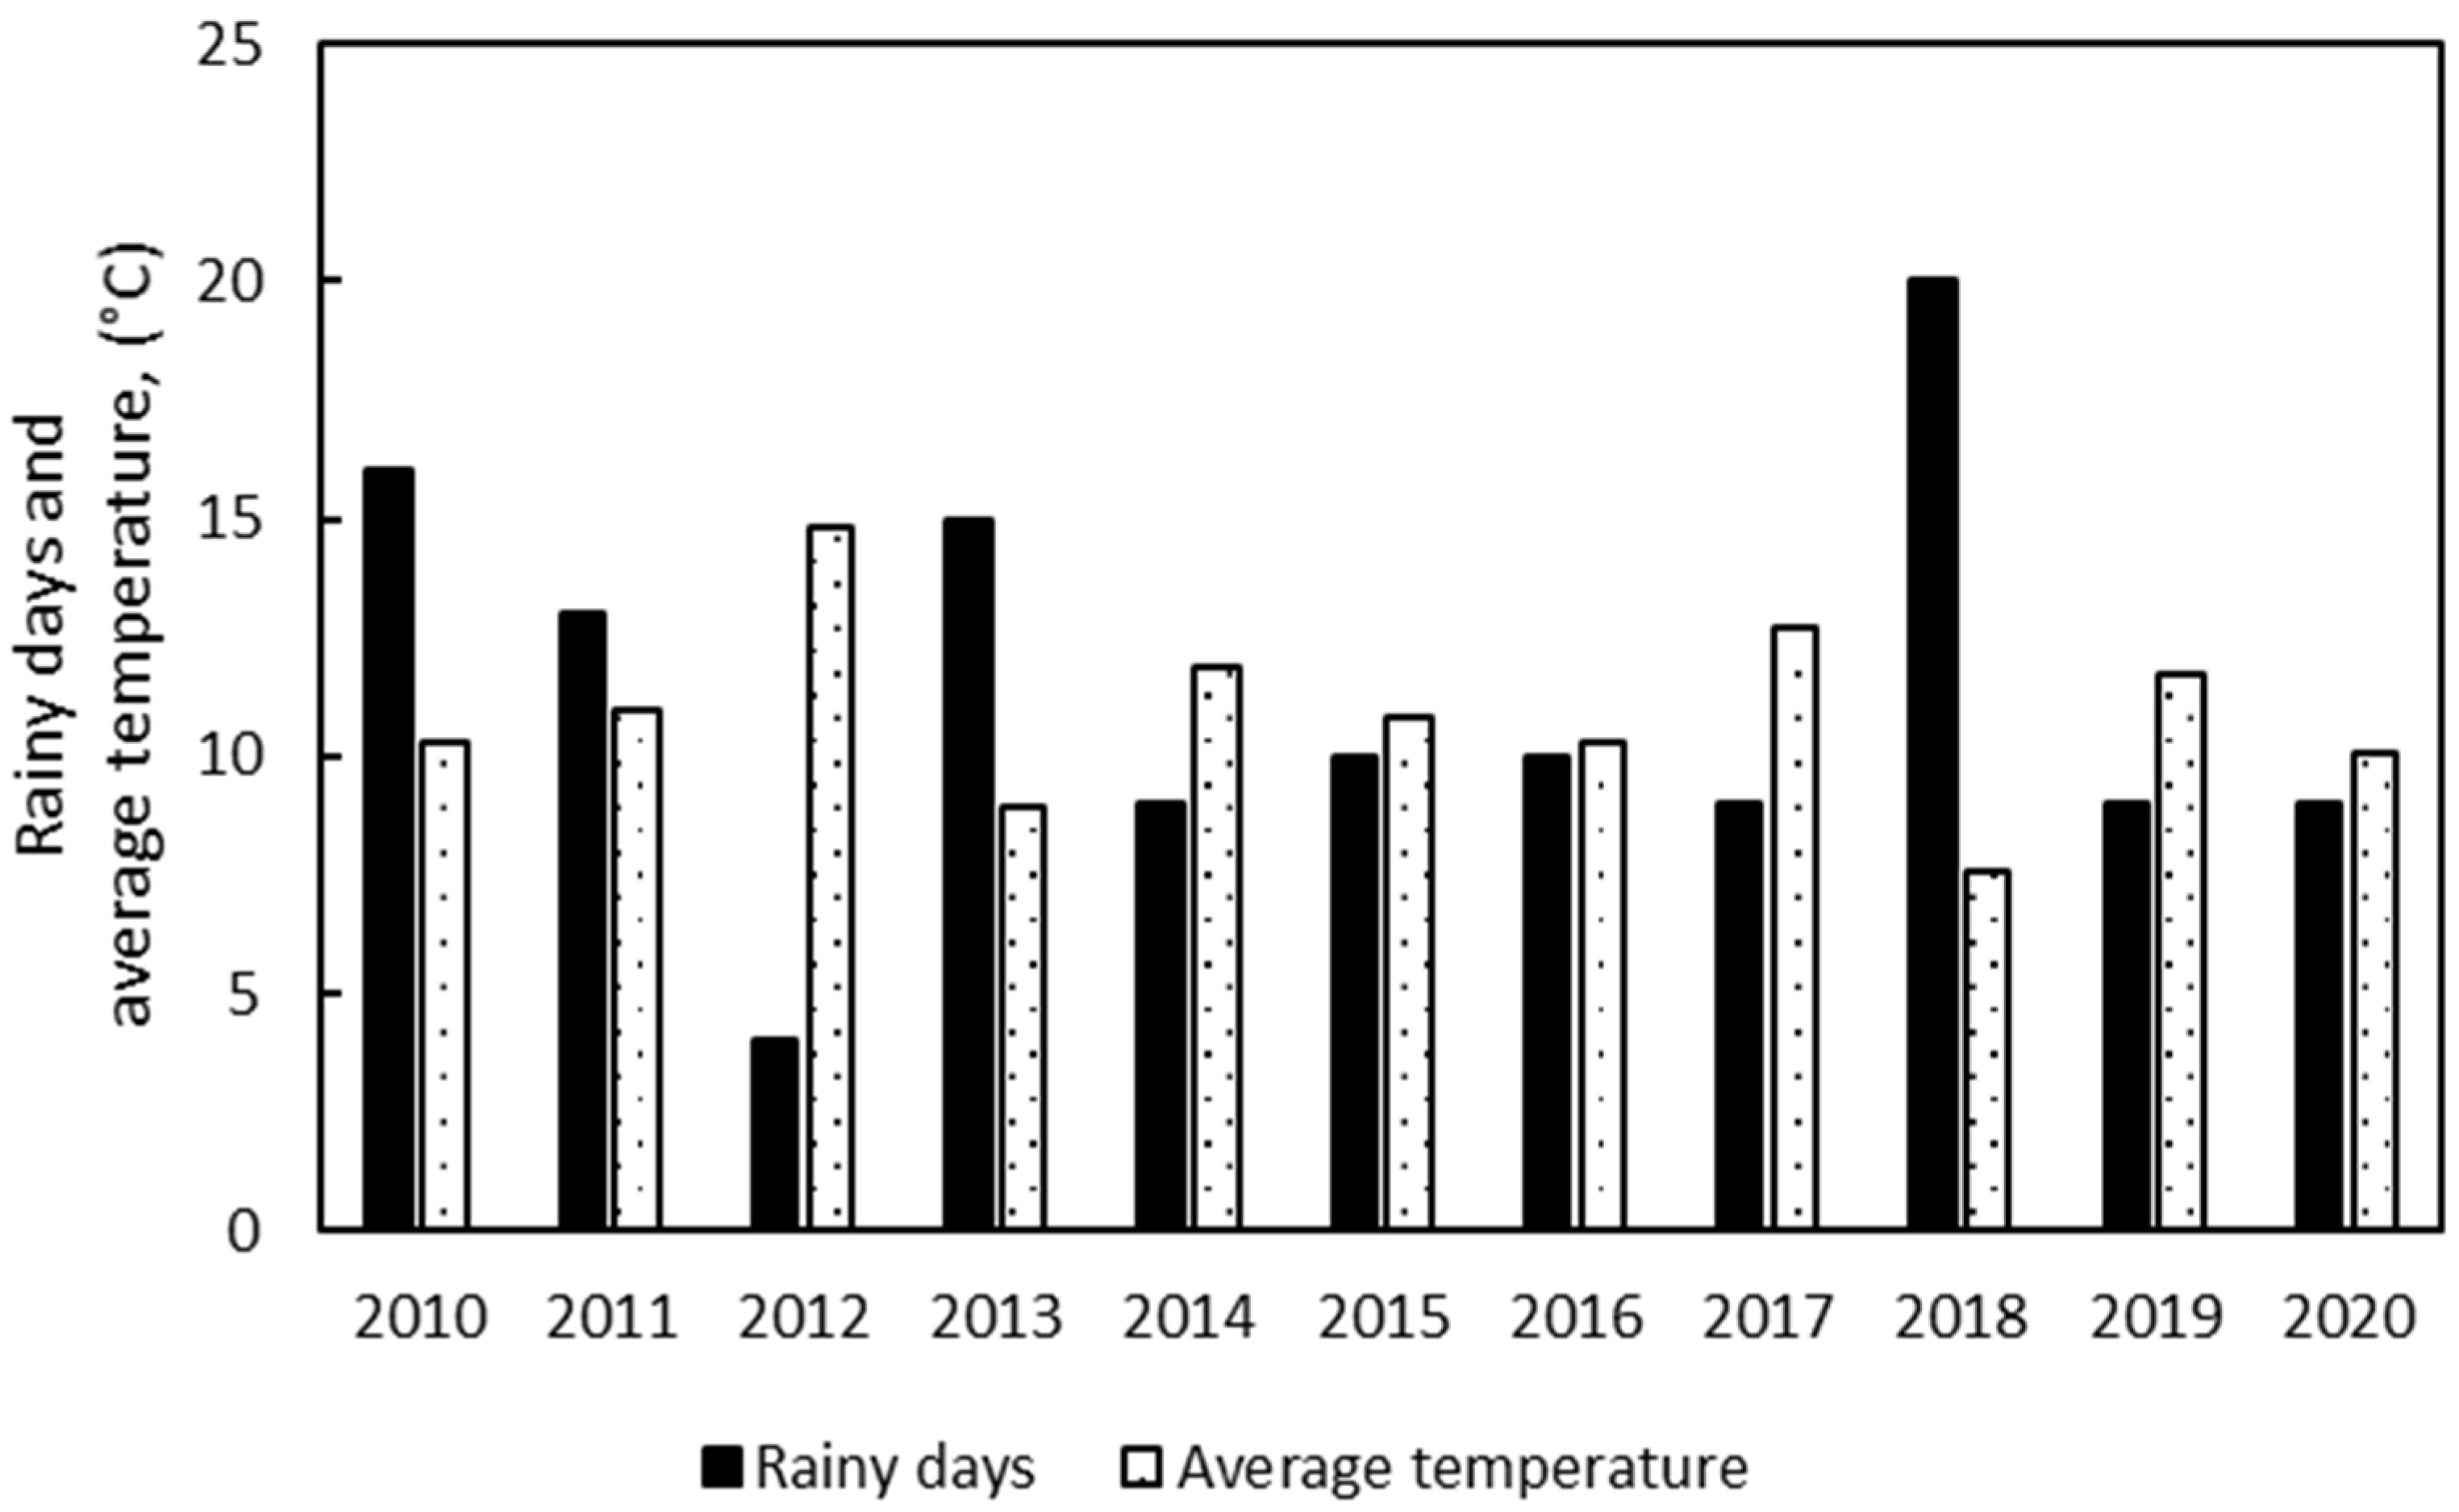
3.6. Meteorological Aspects
3.7. Comparison of Mobile Network Data with ARPA Lombardia Network
3.8. ROM Data Analysis between January and June 2020
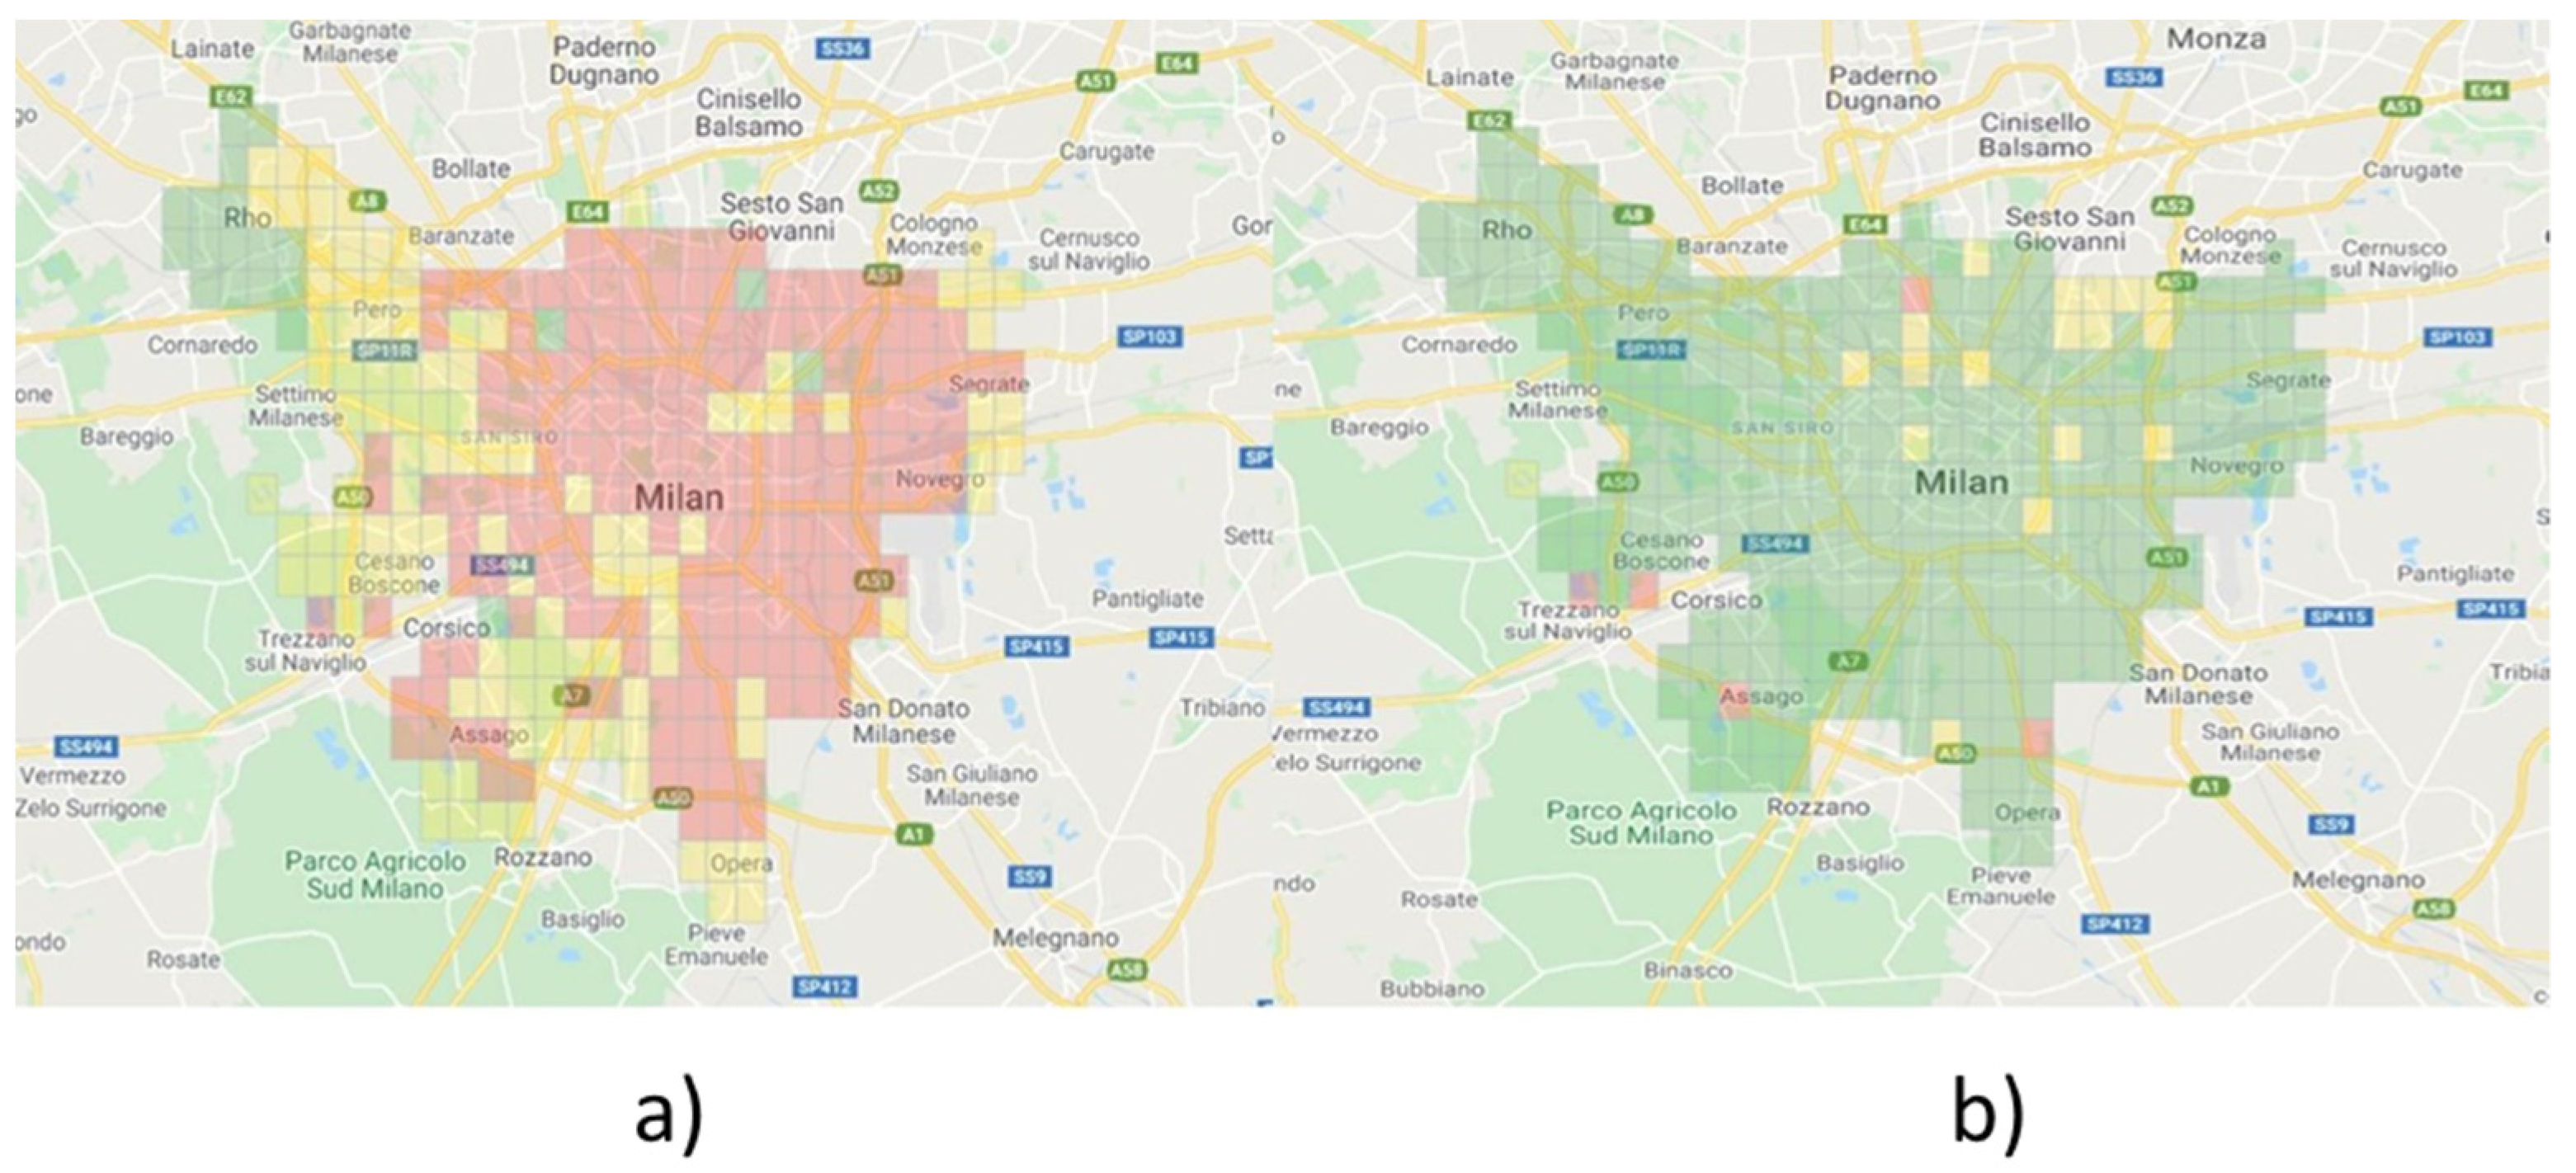
3.9. Pollution Analysis on a NIL Basis
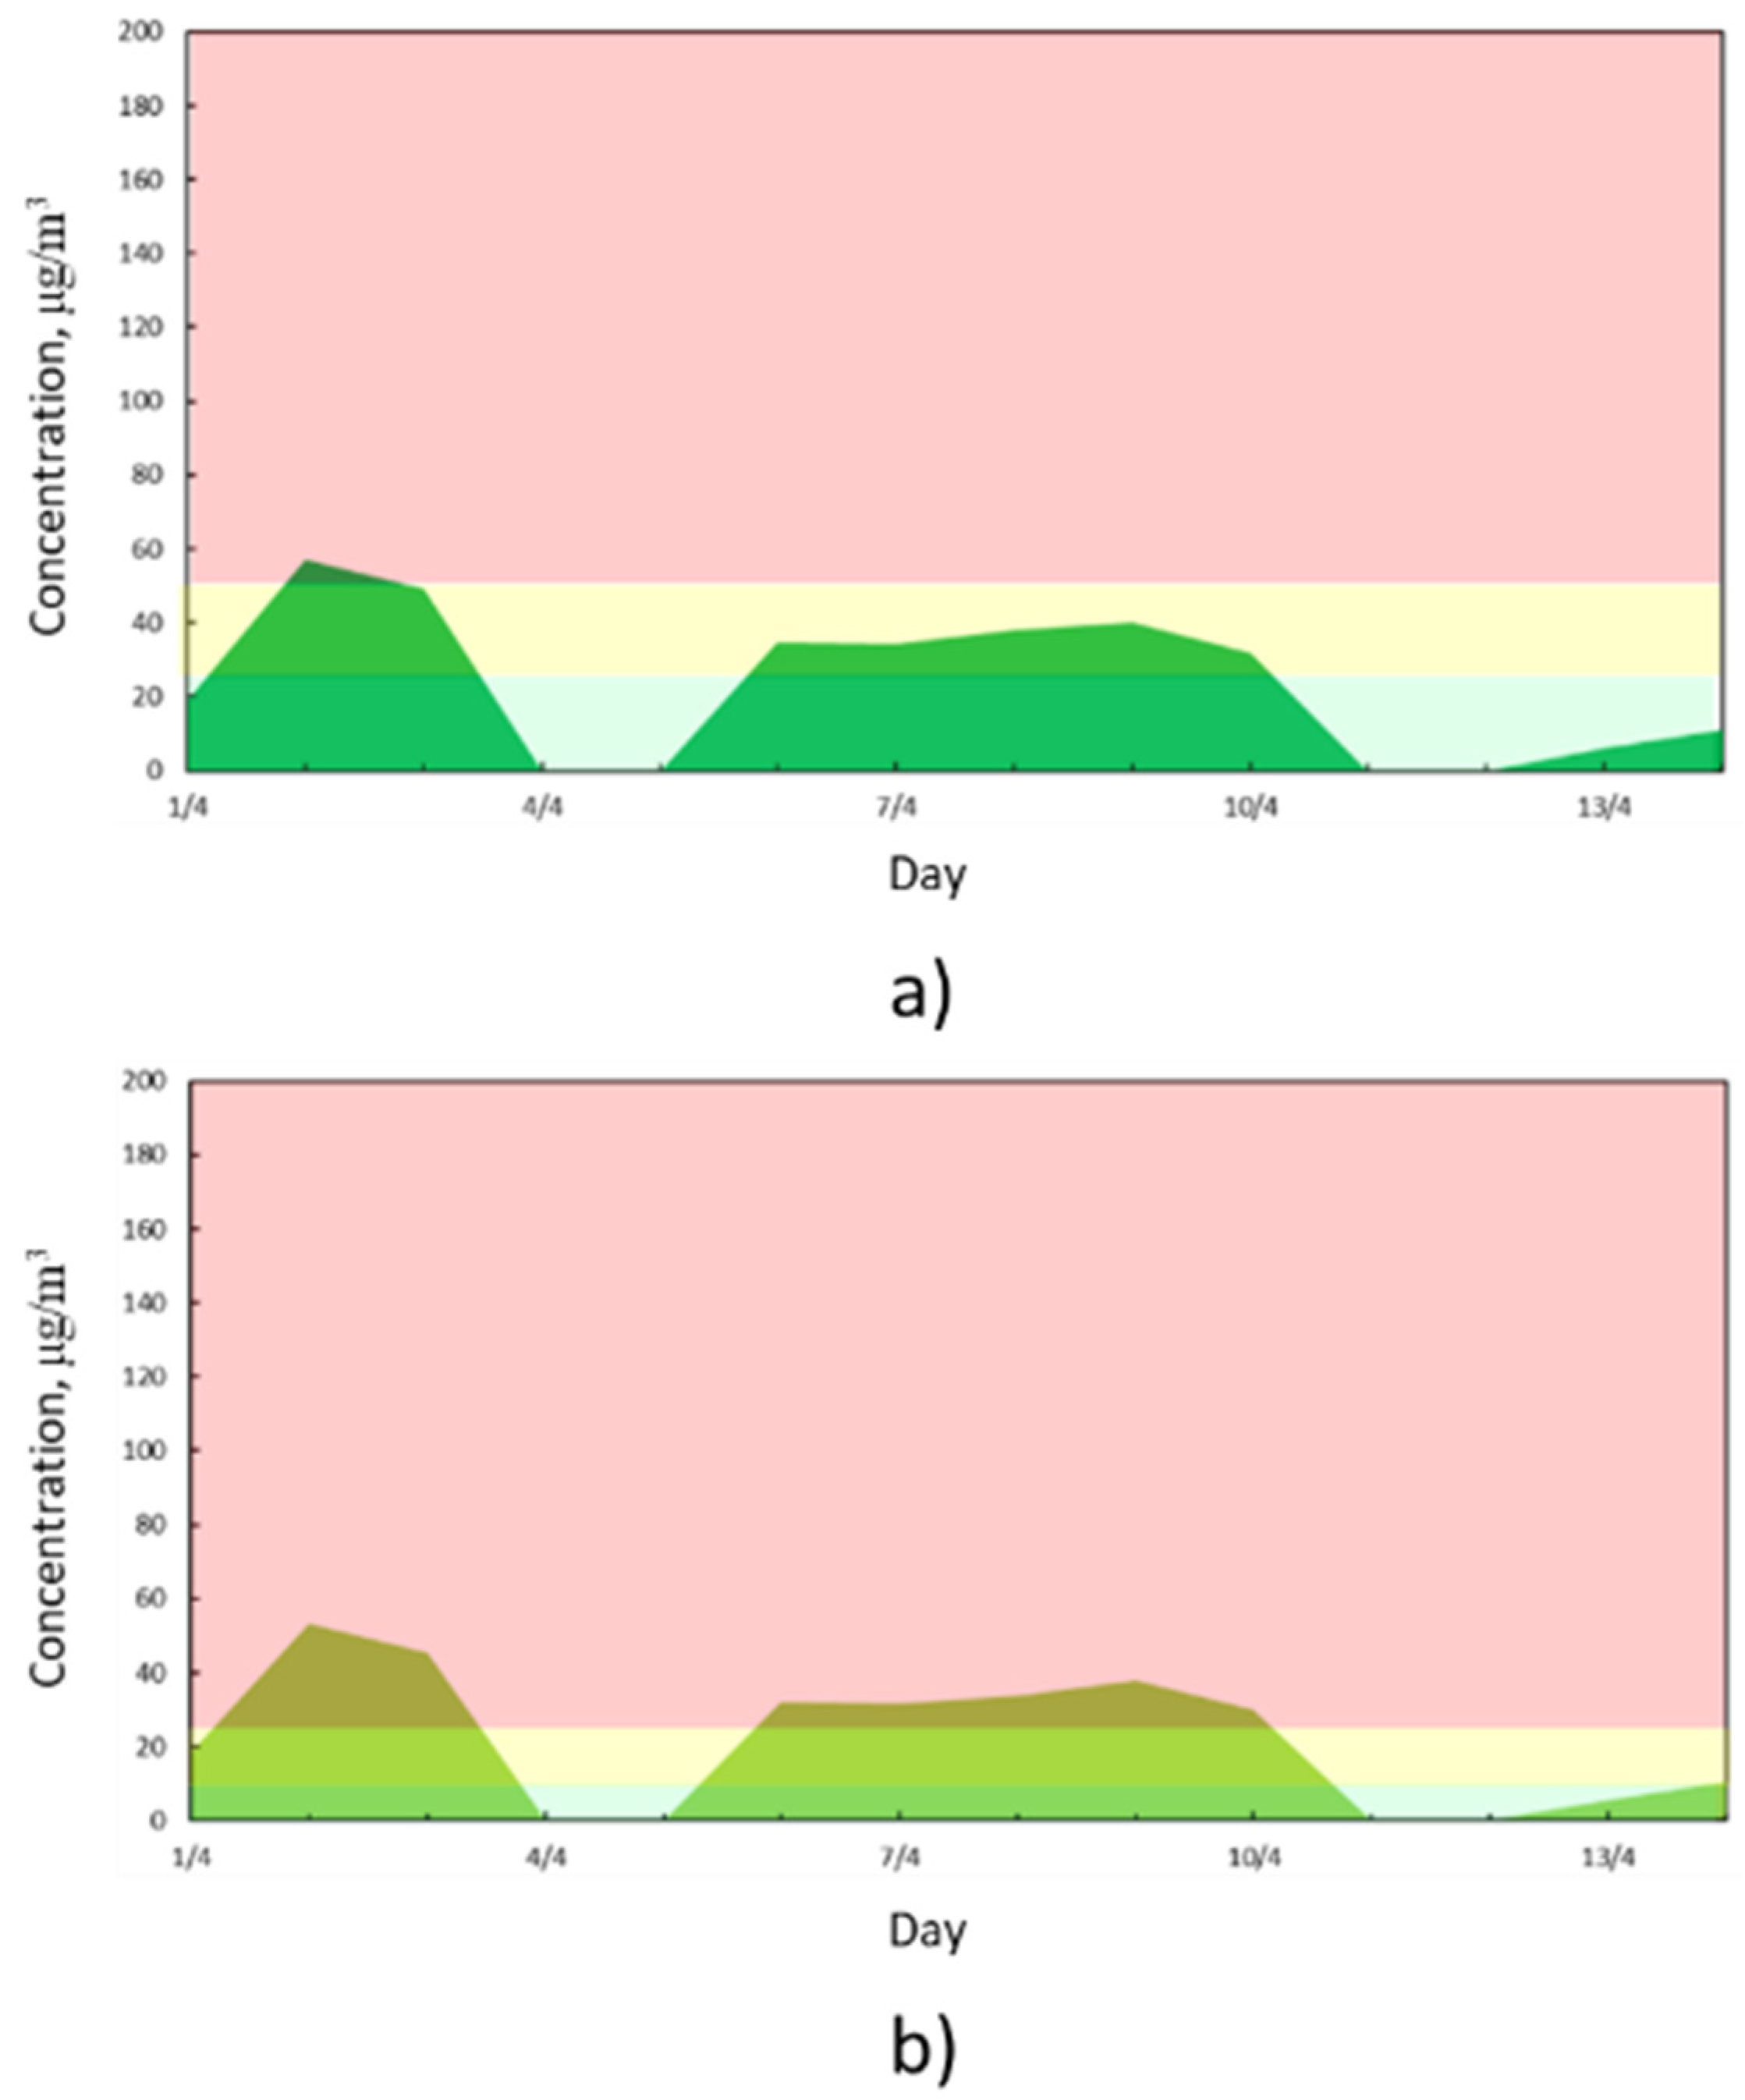
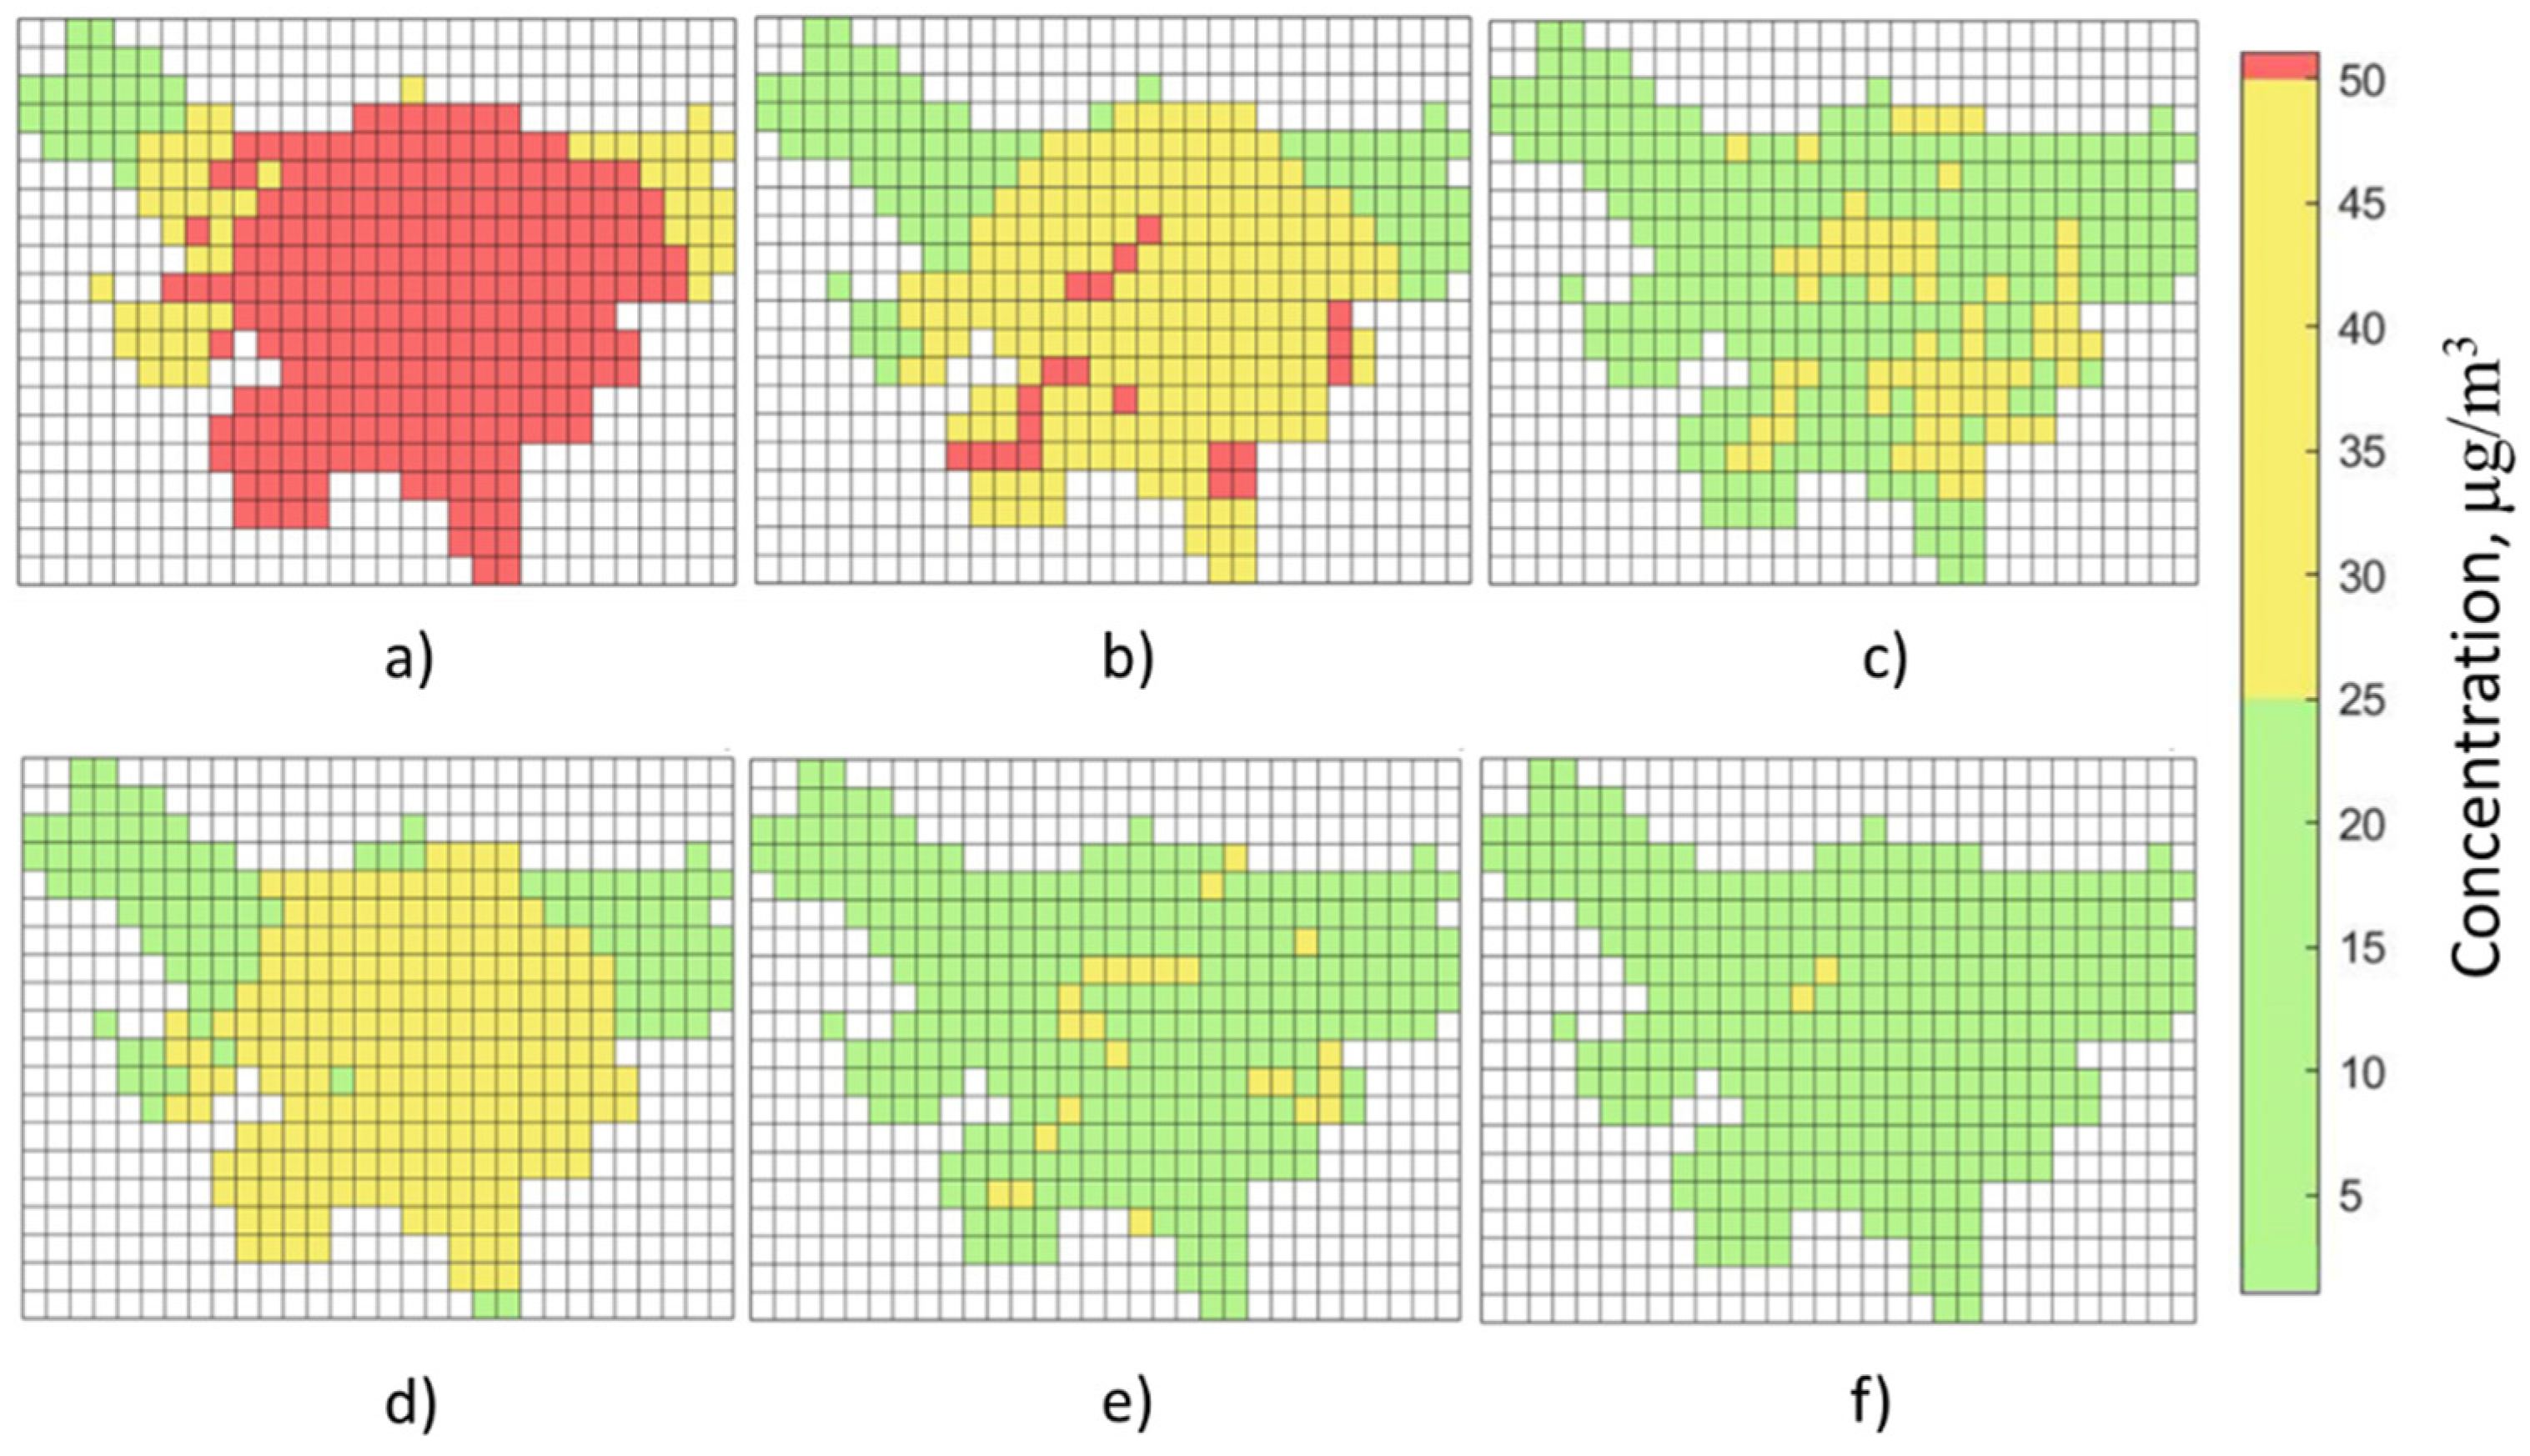
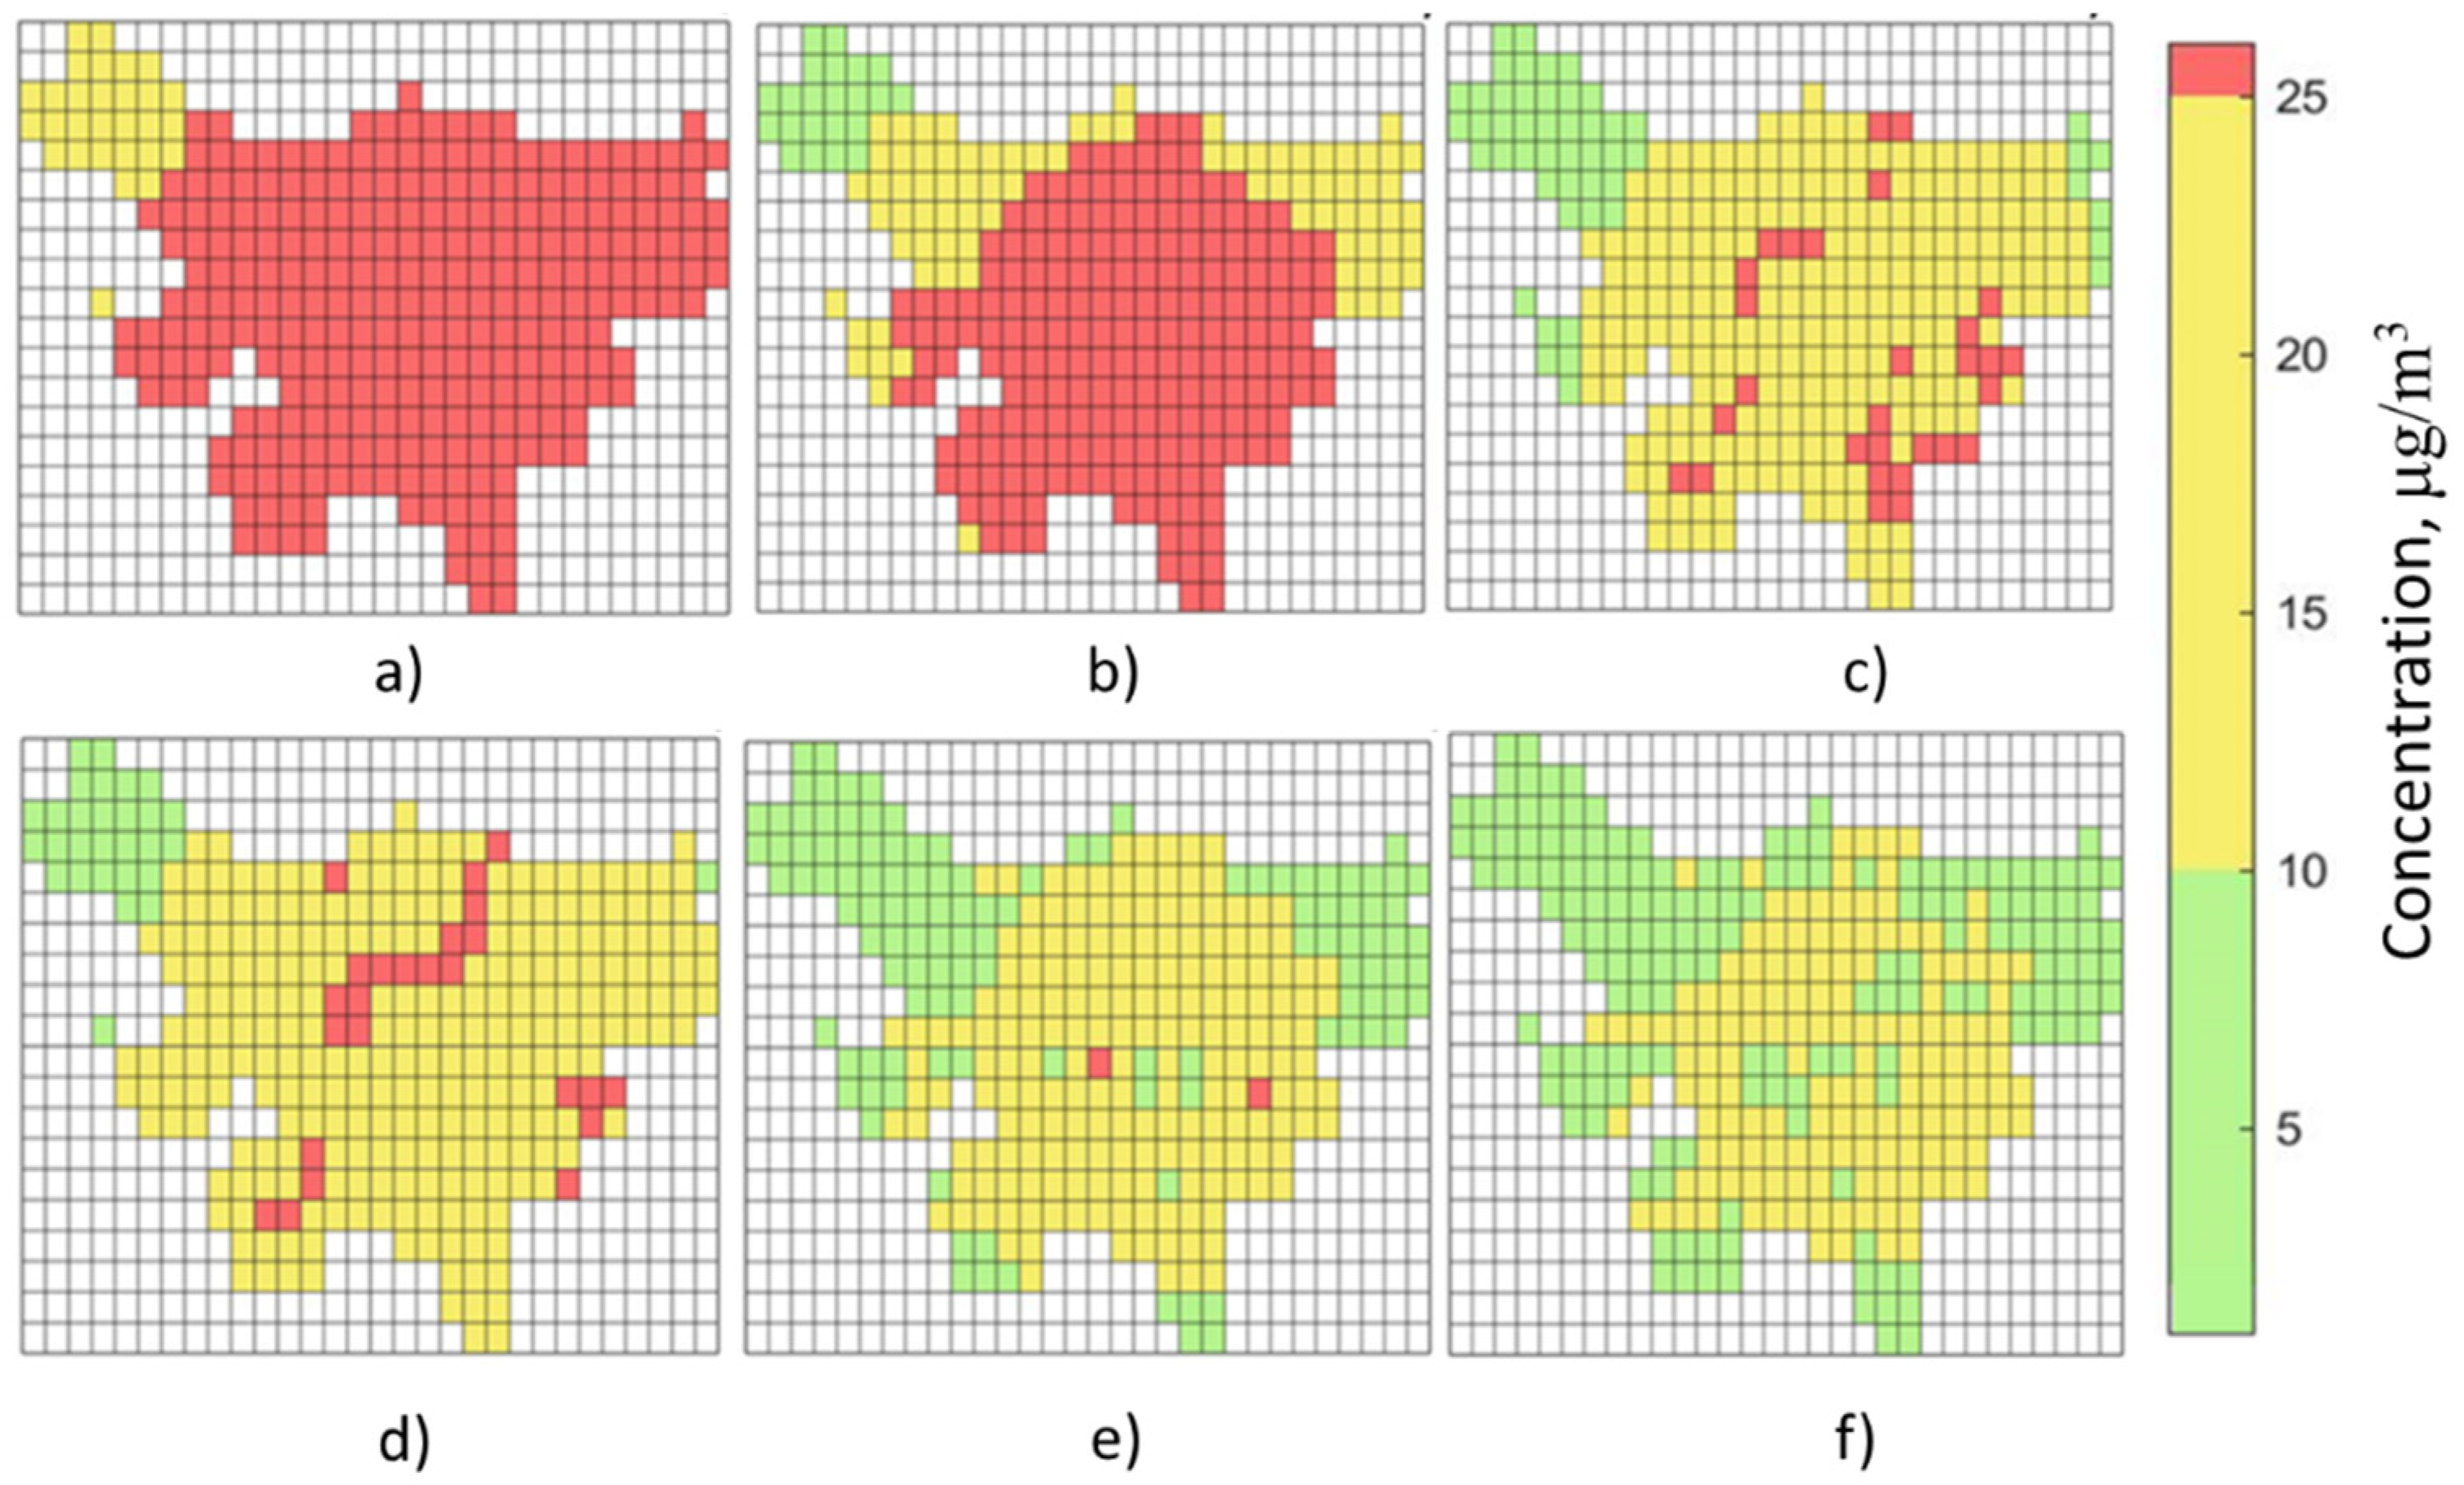
3.10. Comparison of Significant Day Maps before and during the Lockdown by COVID-19
4. Conclusions
Supplementary Materials
Author Contributions
Funding
Institutional Review Board Statement
Informed Consent Statement
Data Availability Statement
Conflicts of Interest
References
- Poli, P.; Boaga, J.; Molinari, I.; Cascone, V.; Boschi, L. The 2020 coronavirus lockdown and seismic monitoring of anthropic activities in Northern Italy. Sci. Rep. 2020, 10, 9404. [Google Scholar] [CrossRef]
- Piccinini, D.; Giunchi, C.; Olivieri, M.; Frattini, F.; Di Giovanni, M.; Prodi, G.; Chiarabba, C. COVID-19 lockdown and its latency in Northern Italy: Seismic evidence and socio-economic interpretation. Sci. Rep. 2020, 10, 16487. [Google Scholar] [CrossRef]
- IQAir and United Nations. 2020 World Air Quality Report. Available online: https://www.iqair.com/world-air-quality-report (accessed on 10 August 2020).
- Malpede, M.; Percoco, M. Lockdown measures and air quality: Evidence from Italian provinces. Lett. Spat. Resour. Sci. 2021, 14, 101–110. [Google Scholar] [CrossRef]
- Merico, E.; Grasso, F.M.; Cesari, D.; Decesari, S.; Belosi, F.; Manarini, F.; De Nuntiis, P.; Rinaldi, M.; Gambaro, A.; Morabito, E.; et al. Characterisation of atmospheric pollution near an industrial site with a biogas production and combustion plant in southern Italy. Sci. Total Environ. 2020, 717, 137220. [Google Scholar] [CrossRef]
- Istituto superiore per la protezione ambientale. La Qualità Dell’aria in Italia; Edizione 2020; Istituto Superiore Per la Protezione Ambientale: Ispra, Italy, 2020. [Google Scholar]
- Bassani, C.; Vichi, F.; Esposito, G.; Montagnoli, M.; Giusto, M.; Ianniello, A. Nitrogen dioxide reductions from satellite and surface observations during COVID-19 mitigation in Rome (Italy). Environ. Sci. Pollut. Res. 2021, 28, 22981–23004. [Google Scholar] [CrossRef]
- Scerri, M.M.; Kandler, K.; Weinbruch, S. Disentangling the contribution of Saharan dust and marine aerosol to PM10 levels in the Central Mediterranean. Atmos. Environ. 2016, 147, 395–408. [Google Scholar] [CrossRef]
- European Environmental Agency. Air Quality in Europe—2020 Report; European Environmental Agency: Luxembourg, 2020. [Google Scholar] [CrossRef]
- Rossi, R.; Ceccato, R.; Gastaldi, M. Effect of Road Traffic on Air Pollution. Experimental Evidence from COVID-19 Lockdown. Sustainability 2020, 12, 8984. [Google Scholar] [CrossRef]
- Piccoli, A.; Agresti, V.; Balzarini, A.; Bedogni, M.; Bonanno, R.; Collino, E.; Colzi, F.; Lacavalla, M.; Lanzani, G.; Pirovano, G.; et al. Modeling the Effect of COVID-19 Lockdown on Mobility and NO2 Concentration in the Lombardy Region. Atmosphere 2020, 11, 1319. [Google Scholar] [CrossRef]
- Sofia, D.; Giuliano, A.; Gioiella, F. Air quality monitoring network for tracking pollutants: The case study of salerno city center. Chem. Eng. Trans. 2018, 68, 67–72. [Google Scholar] [CrossRef]
- Sofia, D.; Lotrecchiano, N.; Giuliano, A.; Barletta, D.; Poletto, M. Optimization of number and location of sampling points of an air quality monitoring network in an urban contest. Chem. Eng. Trans. 2019, 74, 277–282. [Google Scholar] [CrossRef]
- Rovetta, A. The Impact of COVID-19 Lockdowns on Particulate Matter Emissions in Lombardy and Italian Citizens’ Consumption Habits. Front. Sustain. 2021, 2, 44. [Google Scholar] [CrossRef]
- Lotrecchiano, N.; Gioiella, F.; Giuliano, A.; Sofia, D. Forecasting Model Validation of Particulate Air Pollution by Low Cost Sensors Data. J. Model. Optim. 2019, 11, 63–68. [Google Scholar] [CrossRef] [Green Version]
- Sofia, D.; Lotrecchiano, N.; Cirillo, D.; Villetta, M.L.; Sofia, D. NO2 Dispersion model of emissions of a 20 kwe biomass gasifier. Chem. Eng. Trans. 2020, 82, 451–456. [Google Scholar] [CrossRef]
- Lotrecchiano, N.; Sofia, D.; Giuliano, A.; Barletta, D.; Poletto, M. Pollution dispersion from a fire using a Gaussian plume model. Int. J. Saf. Secur. Eng. 2020, 10, 431–439. [Google Scholar] [CrossRef]
- Sofia, D.; Lotrecchiano, N.; Trucillo, P.; Giuliano, A.; Terrone, L. Novel air pollution measurement system based on ethereum blockchain. J. Sens. Actuator Netw. 2020, 9, 49. [Google Scholar] [CrossRef]
- Sofia, D.; Gioiella, F.; Lotrecchiano, N.; Giuliano, A. Mitigation strategies for reducing air pollution. Environ. Sci. Pollut. Res. 2020, 27, 19226–19235. [Google Scholar] [CrossRef] [PubMed]
- Sofia, D.; Gioiella, F.; Lotrecchiano, N.; Giuliano, A. Cost-benefit analysis to support decarbonization scenario for 2030: A case study in Italy. Energy Policy 2020, 137, 111137. [Google Scholar] [CrossRef]
- Squizzato, S.; Masiol, M.; Brunelli, A.; Pistollato, S.; Tarabotti, E.; Rampazzo, G.; Pavoni, B. Factors determining the formation of secondary inorganic aerosol: A case study in the Po Valley (Italy). Atmos. Chem. Phys. 2013, 13, 1927–1939. [Google Scholar] [CrossRef] [Green Version]
- Pecorari, E.; Squizzato, S.; Masiol, M.; Radice, P.; Pavoni, B.; Rampazzo, G. Using a photochemical model to assess the horizontal, vertical and time distribution of PM2.5 in a complex area: Relationships between the regional and local sources and the meteorological conditions. Sci. Total Environ. 2012, 443C, 681–691. [Google Scholar] [CrossRef] [PubMed]
- Lotrecchiano, N.; Sofia, D.; Giuliano, A.; Barletta, D.; Poletto, M. Real-time on-road monitoring network of air quality. Chem. Eng. Trans. 2019, 74, 241–246. [Google Scholar] [CrossRef]
- Lotrecchiano, N.; Sofia, D.; Giuliano, A.; Barletta, D.; Poletto, M. Spatial Interpolation Techniques For innovative Air Quality Monitoring Systems. Chem. Eng. Trans. 2021, 86, 391–396. [Google Scholar] [CrossRef]
- Arnold, M.; Seghaier, A.; Martin, D.; Buat-Ménard, P.; Chesselet, R. Géochimie de L’aérosol Marin de la Méditerranée Occidentale; CIESM: Cannes, France, 1982; pp. 2–4. [Google Scholar]
- Bonasoni, P.; Cristofanelli, P.; Calzolari, F.; Bonafè, U.; Evangelisti, F.; Stohl, A.; Sajani, S.Z.; van Dingenen, R.; Colombo, T.; Balkanski, Y. Aerosol-ozone correlations during dust transport episodes. Atmos. Chem. Phys. Discuss. 2004, 4, 1201–1215. [Google Scholar] [CrossRef] [Green Version]
- Lotrecchiano, N.; Capozzi, V.; Sofia, D. An Innovative Approach to Determining the Contribution of Saharan Dust to Pollution. Int. J. Environ. Res. Public Health 2021, 18, 6100. [Google Scholar] [CrossRef] [PubMed]


| Station | Acronym | Type | Pollutants Measured |
|---|---|---|---|
| Viale Liguria | VL | Urban Traffic | NO2, CO |
| Viale Marche | VM | Urban Traffic | PM10, NO2, CO |
| Via Pascal | VP | Urban Background | SO2, PM10, PM2.5, CO, O3, Benzene |
| Via Senato | VS | Urban Traffic | PM10, PM2.5, CO, Benzene |
| Verziere | VE | Urban Traffic | PM10, PM2.5, CO, O3 |
| Month | NIL Name | PM10 Monthly Average, μg/m3 | PM2.5 Monthly Average, μg/m3 |
|---|---|---|---|
| January | 23 | 110 | 101 |
| 73 | 107 | 95 | |
| 17 | 101 | 94 | |
| 25 | 101 | 86 | |
| February | 44 | 65 | 60 |
| 73 | 65 | 58 | |
| 41 | 59 | 57 | |
| 63 | 58 | 54 | |
| March | 46 | 32 | 28 |
| 23 | 31 | 29 | |
| 17 | 30 | 28 | |
| 73 | 29 | 25 | |
| April | 38 | 39 | 35 |
| 42 | 37 | 32 | |
| 46 | 35 | 31 | |
| 23 | 32 | 30 |
| Ranking | Nil Name | Best PM10 Daily Average Concentration, μg/m3 | Worst PM10 Daily Average Concentration, μg/m3 | PM10 Monthly Average Concentration, μg/m3 | Reduction % | |||
|---|---|---|---|---|---|---|---|---|
| January | March | January | March | January | March | |||
| 1 | 25 | 18 | 7 | 174 | 50 | 101 | 23 | 77 |
| 2 | 57 | 6 | <5 | 200 | 34 | 59 | 13 | 77 |
| 3 | 74 | 6 | <5 | 192 | 84 | 78 | 18 | 76 |
| 4 | 1 | 7 | 6 | 168 | 41 | 81 | 20 | 75 |
| 5 | 59 | 7 | 5 | 155 | 46 | 81 | 20 | 75 |
| 6 | 43 | 6 | <5 | 183 | 28 | 55 | 14 | 75 |
| 7 | 54 | 5 | <5 | 82 | 21 | 43 | 11 | 74 |
| 8 | 68 | 5 | 5 | 134 | 44 | 71 | 19 | 74 |
| 9 | 70 | 5 | <5 | 84 | 23 | 44 | 12 | 74 |
| 10 | 22 | 11 | 6 | 190 | 62 | 92 | 24 | 74 |
| Ranking | Nil Name | Best PM10 Daily Average Concentration, μg/m3 | Worst PM10 Daily Average Concentration, μg/m3 | PM10 Monthly Average Concentration, μg/m3 | Reduction % | |||
|---|---|---|---|---|---|---|---|---|
| February | March | February | March | February | March | |||
| 1 | 57 | <5 | <5 | 136 | 34 | 48 | 13 | 72 |
| 2 | 41 | 6 | 5 | 162 | 39 | 59 | 19 | 67 |
| 3 | 65 | <5 | 5 | 149 | 33 | 54 | 19 | 65 |
| 4 | 44 | 5 | 6 | 169 | 52 | 65 | 26 | 60 |
| 5 | 63 | <5 | <5 | 195 | 101 | 58 | 23 | 60 |
| 6 | 73 | <5 | 9 | 166 | 60 | 65 | 29 | 56 |
| 7 | 62 | <5 | <5 | 140 | 44 | 39 | 18 | 54 |
| 8 | 55 | <5 | <5 | 123 | 36 | 36 | 17 | 52 |
| 9 | 77 | 5 | 6 | 139 | 47 | 49 | 24 | 51 |
| 10 | 43 | <5 | <5 | 71 | 28 | 28 | 14 | 50 |
| Ranking | Nil Name | Best PM2.5 Daily Average Concentration, μg/m3 | Worst PM2.5 Daily Average Concentration, μg/m3 | PM2.5 Monthly Average Concentration, μg/m3 | Reduction % | |||
|---|---|---|---|---|---|---|---|---|
| January | March | January | March | January | March | |||
| 1 | 57 | 6 | <5 | 166 | 29 | 56 | 12 | 79 |
| 2 | 54 | 5 | <5 | 82 | 19 | 43 | 10 | 77 |
| 3 | 70 | 5 | <5 | 84 | 21 | 44 | 10 | 77 |
| 4 | 43 | 6 | <5 | 161 | 26 | 54 | 13 | 76 |
| 5 | 74 | 6 | <5 | 153 | 73 | 68 | 16 | 76 |
| 6 | 25 | 22 | 6 | 156 | 46 | 86 | 21 | 76 |
| 7 | 1 | 5 | 5 | 149 | 38 | 72 | 18 | 75 |
| 8 | 53 | 7 | <5 | 166 | 41 | 73 | 18 | 75 |
| 9 | 59 | 5 | <5 | 137 | 42 | 73 | 18 | 75 |
| 10 | 56 | 7 | <5 | 153 | 38 | 75 | 19 | 75 |
| Ranking | Nil Name | Best PM2.5 Daily Average Concentration, μg/m3 | Worst PM2.5 Daily Average Concentration, μg/m3 | PM2.5 Monthly Average Concentration, μg/m3 | Reduction % | |||
|---|---|---|---|---|---|---|---|---|
| February | March | February | March | February | March | |||
| 1 | 57 | 5 | <5 | 137 | 29 | 48 | 12 | 75 |
| 2 | 41 | 6 | <5 | 155 | 36 | 57 | 17 | 69 |
| 3 | 65 | 4 | 4 | 141 | 30 | 53 | 17 | 68 |
| 4 | 63 | <5 | <5 | 164 | 90 | 54 | 20 | 63 |
| 5 | 44 | 5 | 5 | 155 | 47 | 60 | 23 | 62 |
| 6 | 77 | 5 | 5 | 157 | 43 | 55 | 22 | 61 |
| 7 | 62 | <5 | <5 | 119 | 38 | 35 | 15 | 56 |
| 8 | 43 | <5 | <5 | 76 | 26 | 29 | 13 | 56 |
| 9 | 73 | <5 | 8 | 146 | 50 | 58 | 25 | 56 |
| 10 | 55 | <5 | <5 | 109 | 32 | 34 | 17 | 51 |
Publisher’s Note: MDPI stays neutral with regard to jurisdictional claims in published maps and institutional affiliations. |
© 2021 by the authors. Licensee MDPI, Basel, Switzerland. This article is an open access article distributed under the terms and conditions of the Creative Commons Attribution (CC BY) license (https://creativecommons.org/licenses/by/4.0/).
Share and Cite
Lotrecchiano, N.; Trucillo, P.; Barletta, D.; Poletto, M.; Sofia, D. Air Pollution Analysis during the Lockdown on the City of Milan. Processes 2021, 9, 1692. https://doi.org/10.3390/pr9101692
Lotrecchiano N, Trucillo P, Barletta D, Poletto M, Sofia D. Air Pollution Analysis during the Lockdown on the City of Milan. Processes. 2021; 9(10):1692. https://doi.org/10.3390/pr9101692
Chicago/Turabian StyleLotrecchiano, Nicoletta, Paolo Trucillo, Diego Barletta, Massimo Poletto, and Daniele Sofia. 2021. "Air Pollution Analysis during the Lockdown on the City of Milan" Processes 9, no. 10: 1692. https://doi.org/10.3390/pr9101692
APA StyleLotrecchiano, N., Trucillo, P., Barletta, D., Poletto, M., & Sofia, D. (2021). Air Pollution Analysis during the Lockdown on the City of Milan. Processes, 9(10), 1692. https://doi.org/10.3390/pr9101692