
Determination of Heavy Metal Contamination and Pollution Indices of Roadside Dust in Dhaka City, Bangladesh

 , ,
, ,  , , and
Abstract
:1. Introduction
2. Materials and Methods
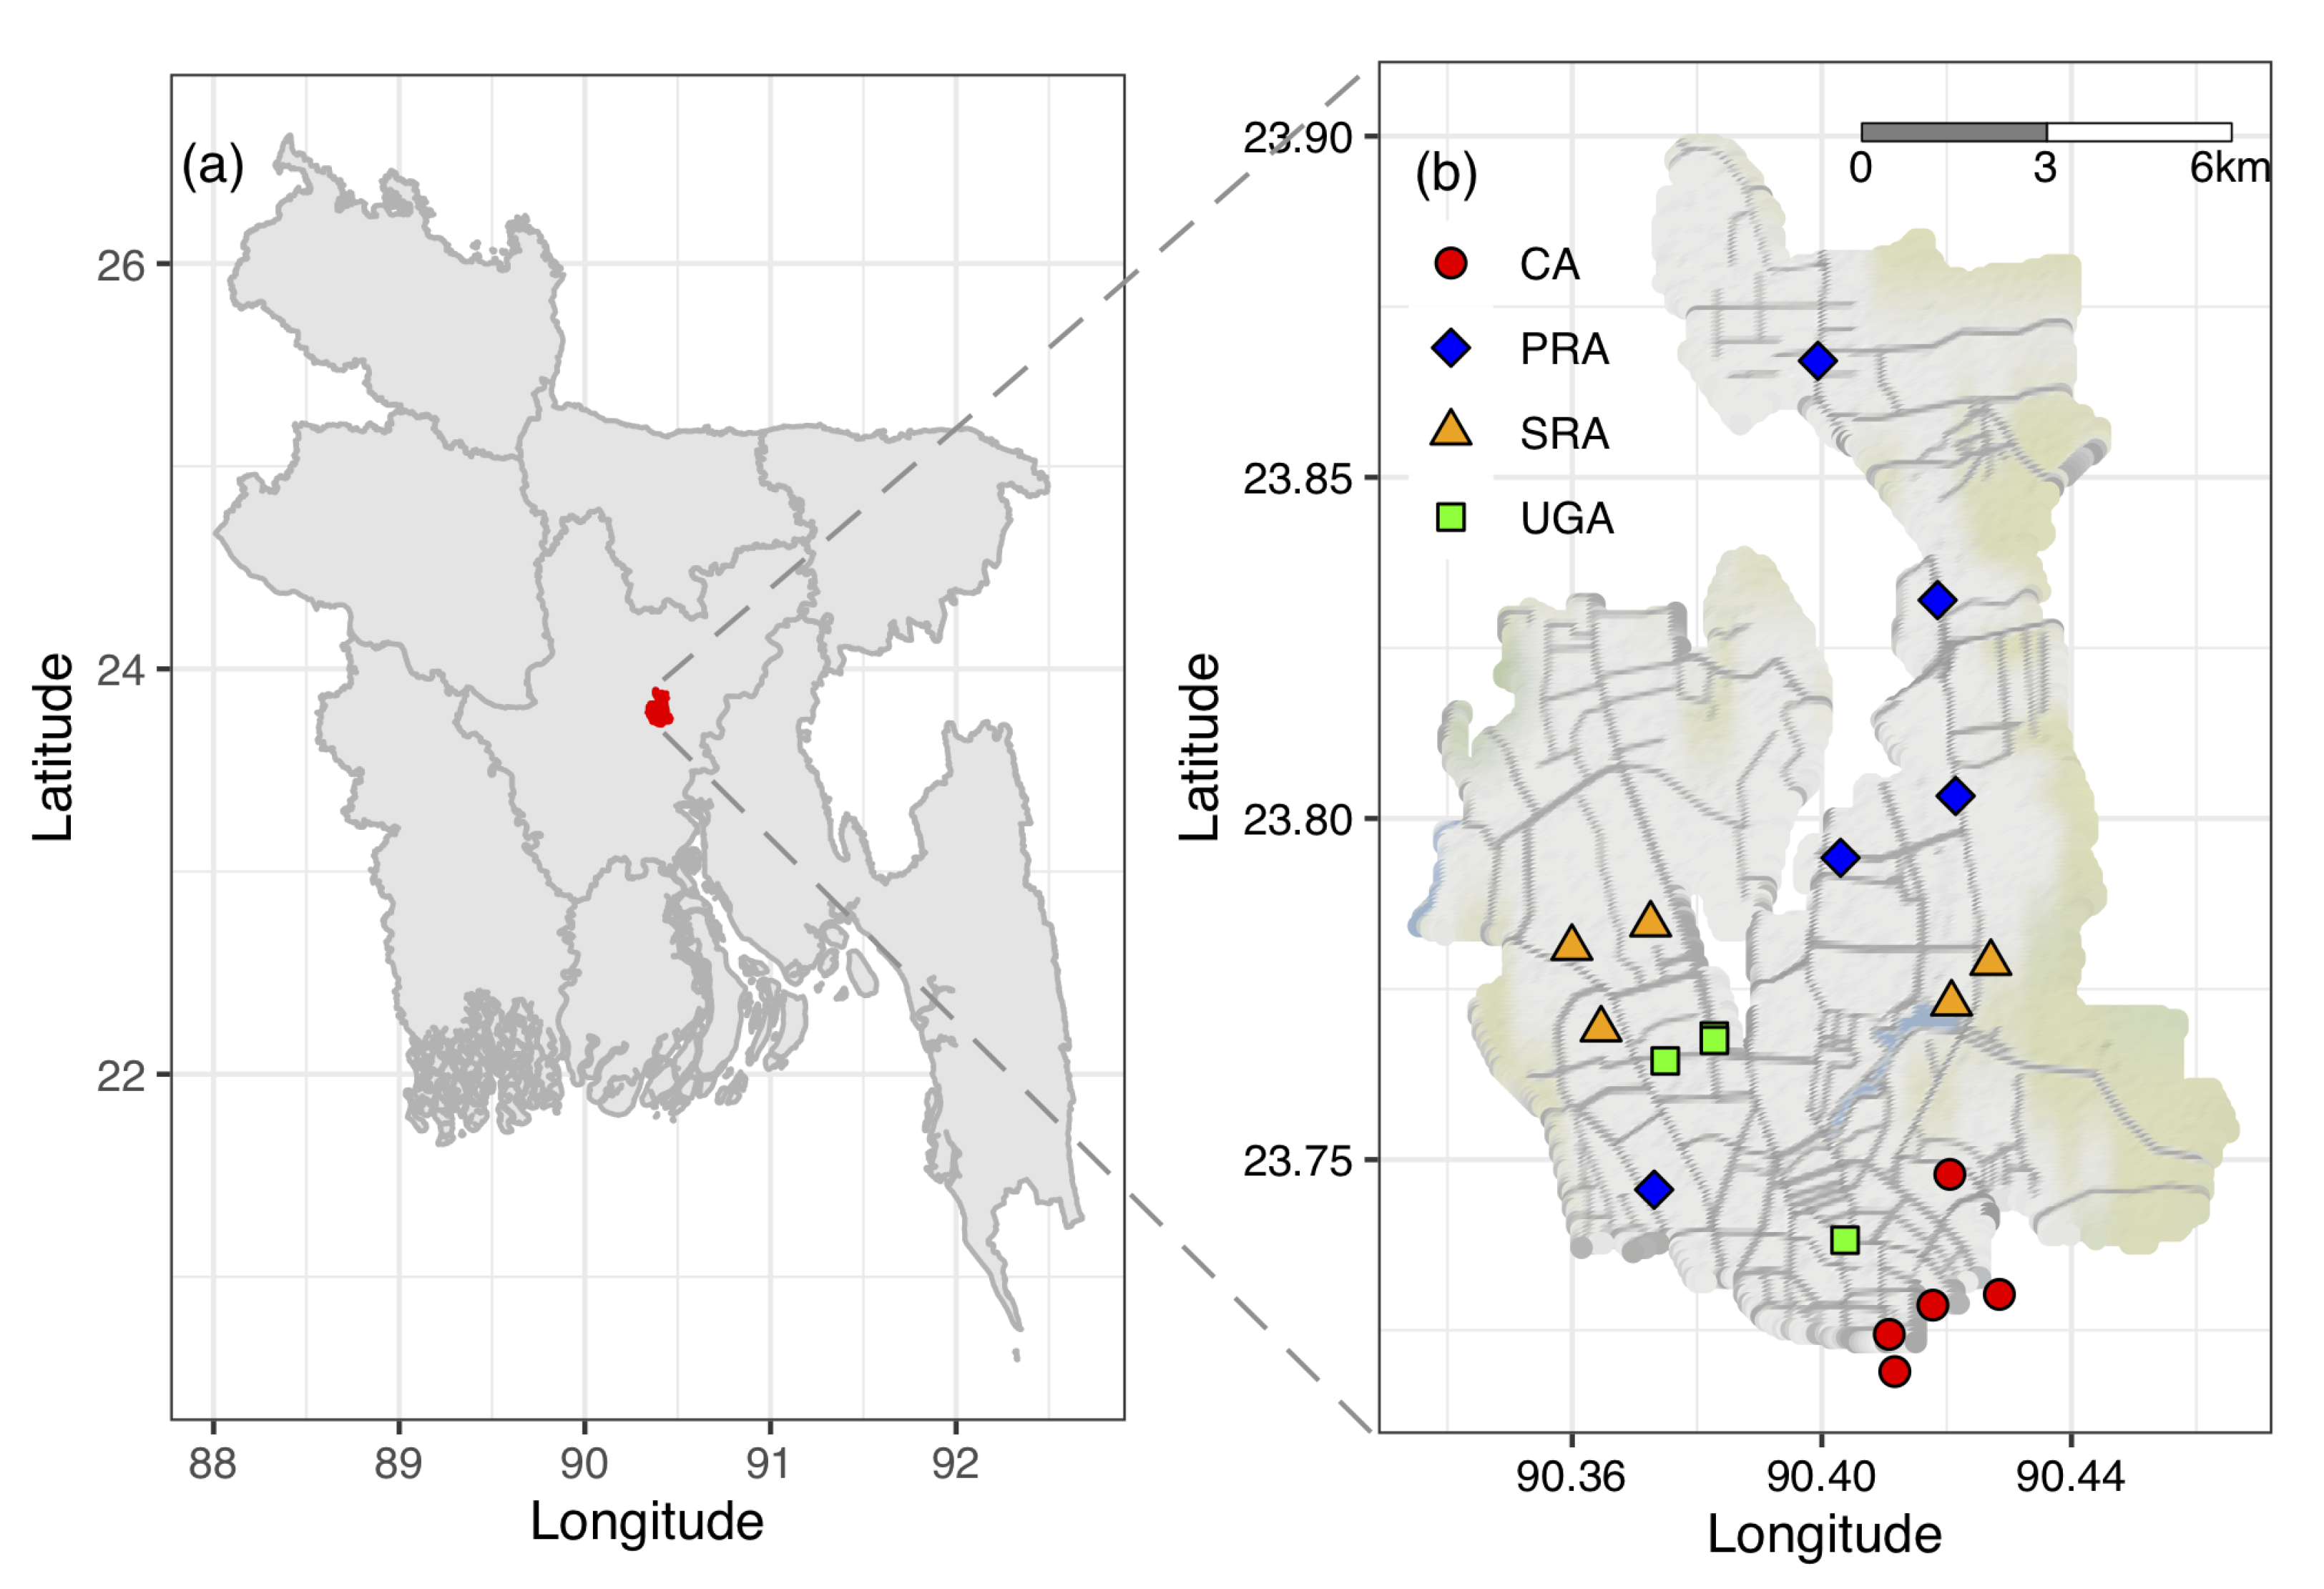
2.1. Study Site
2.2. Sample Collection in Roadside Dust
2.3. Determination of Heavy Metal Concentrations in Roadside Dust
2.4. Quality Assurance and Quality Control
2.5. Estimation Methods of Pollution Indices
2.5.1. Geo-Accumulation Index ()
2.5.2. Contamination Factor ()
2.5.3. Pollution Load Index ()
2.5.4. Ecological Risk ()
2.5.5. Enrichment Factor ()
2.6. Statistical Analysis
3. Results and Discussion
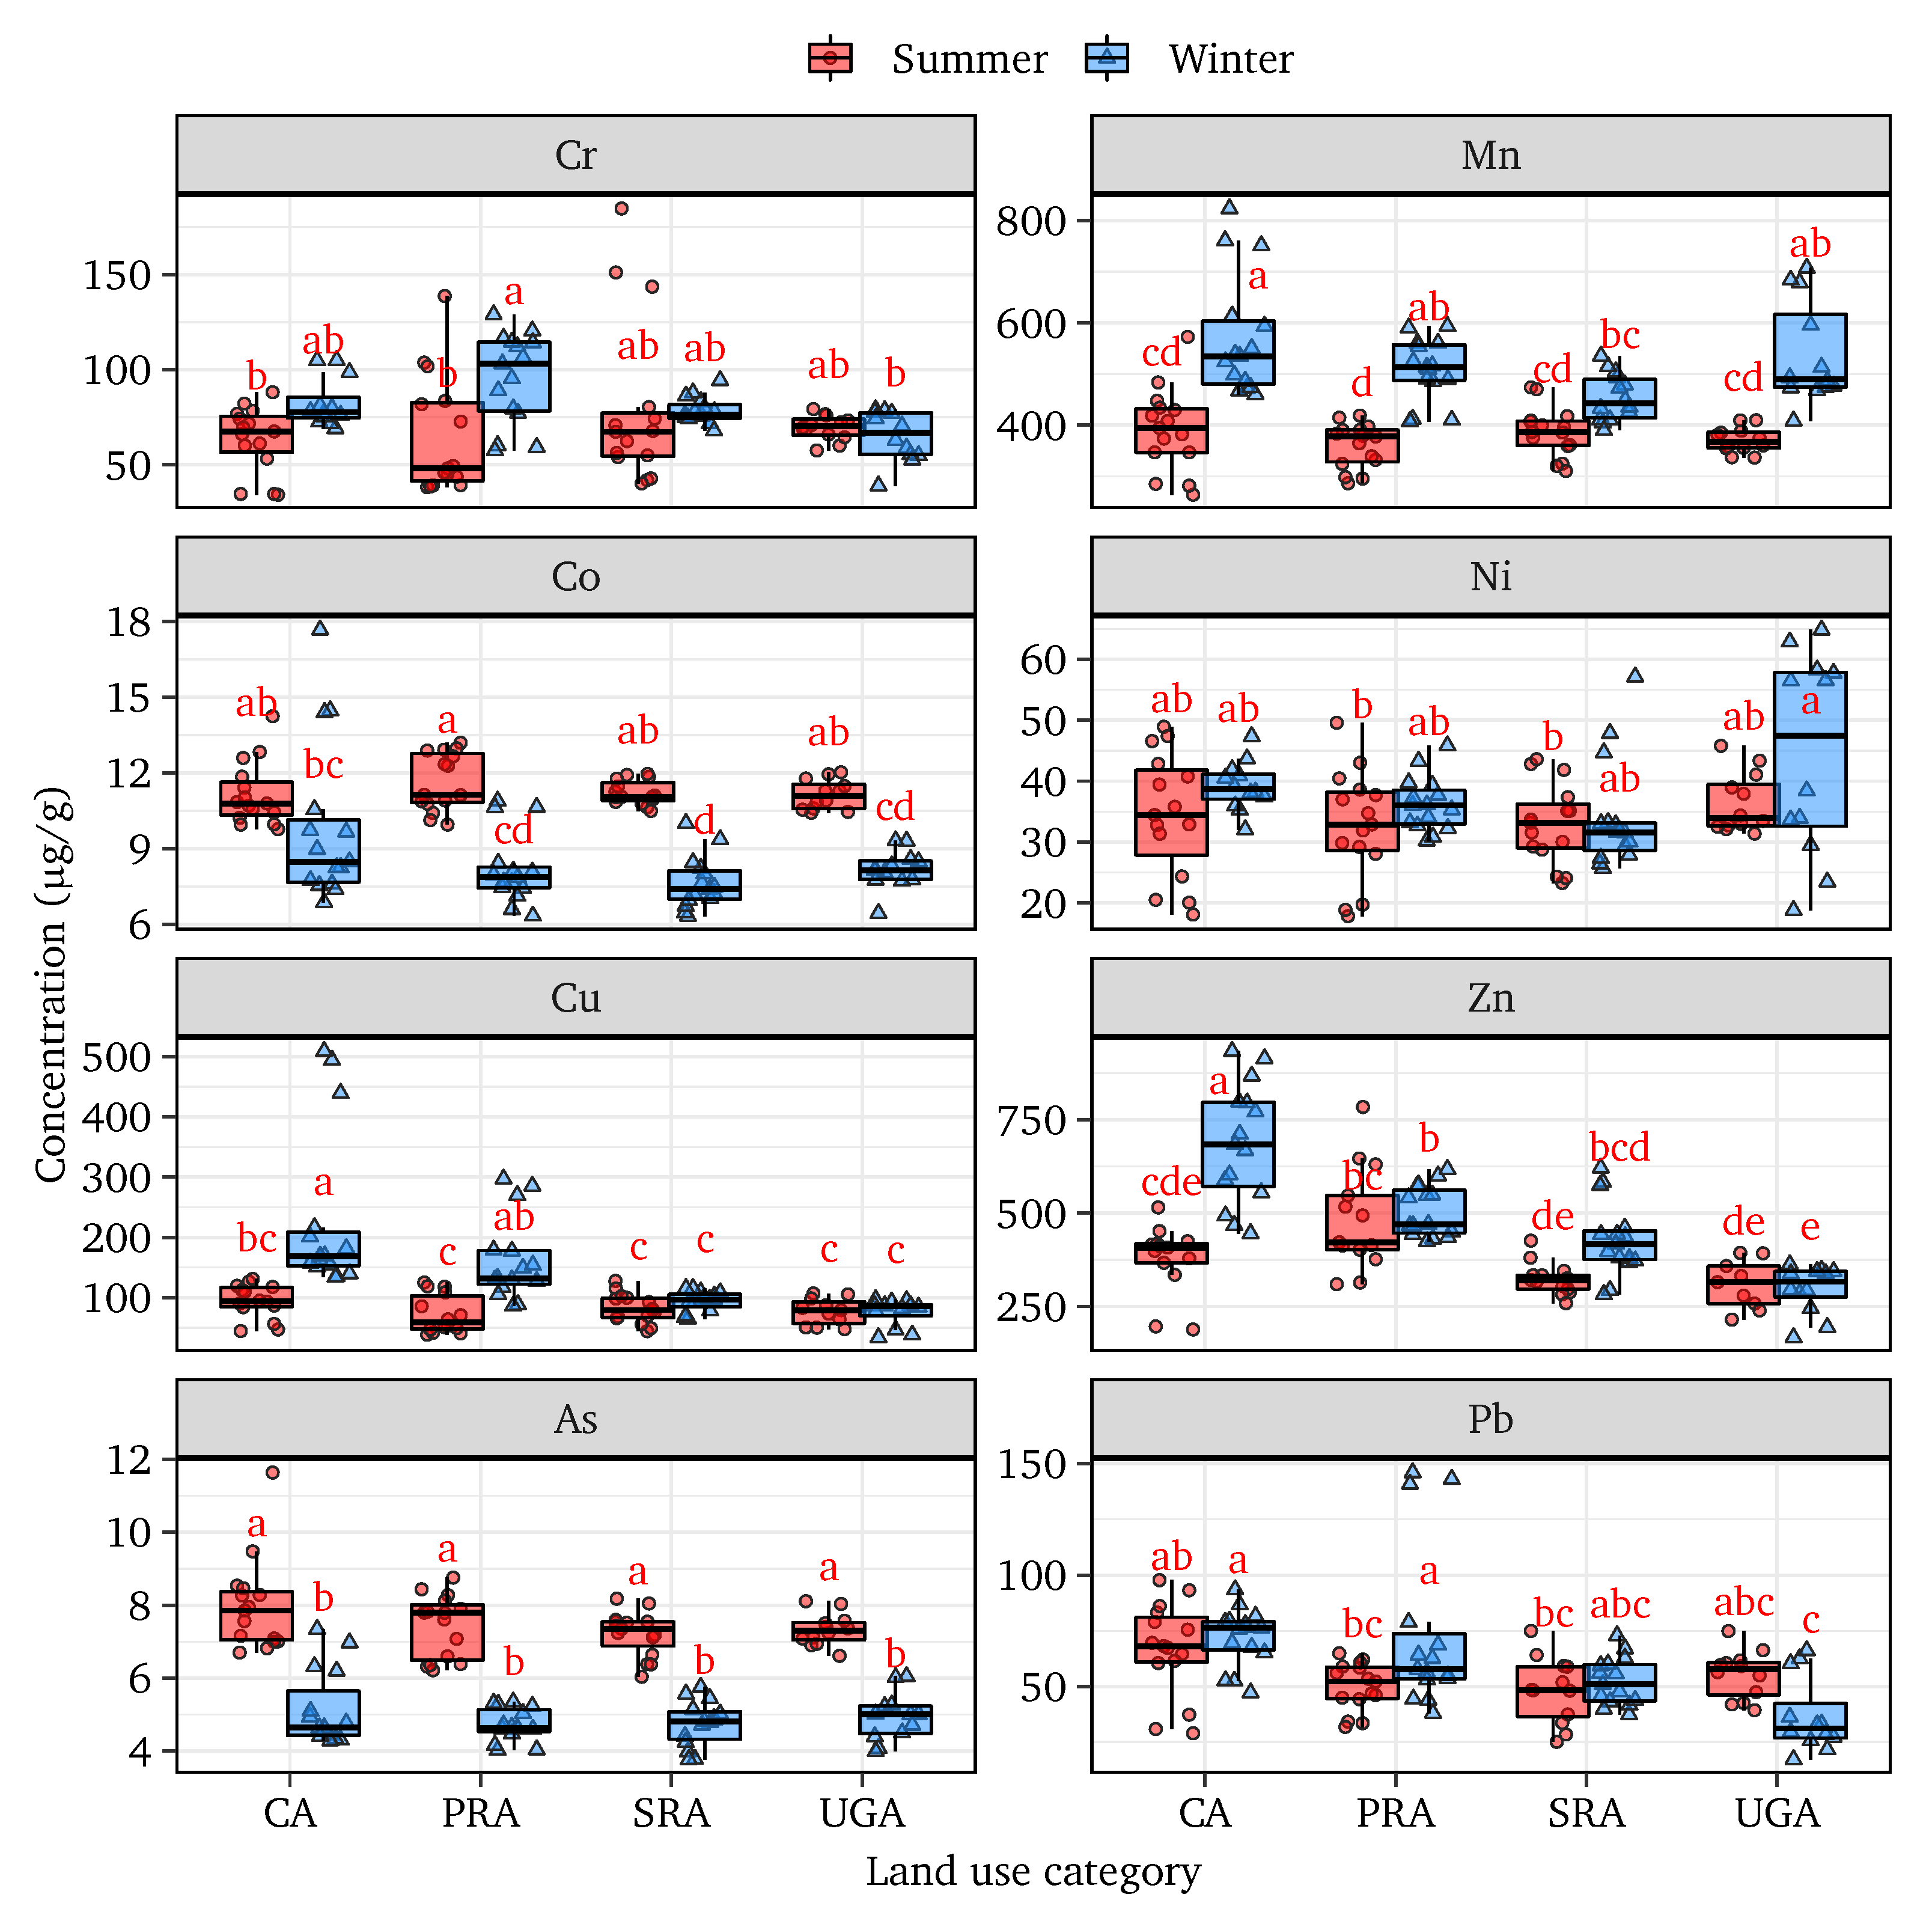
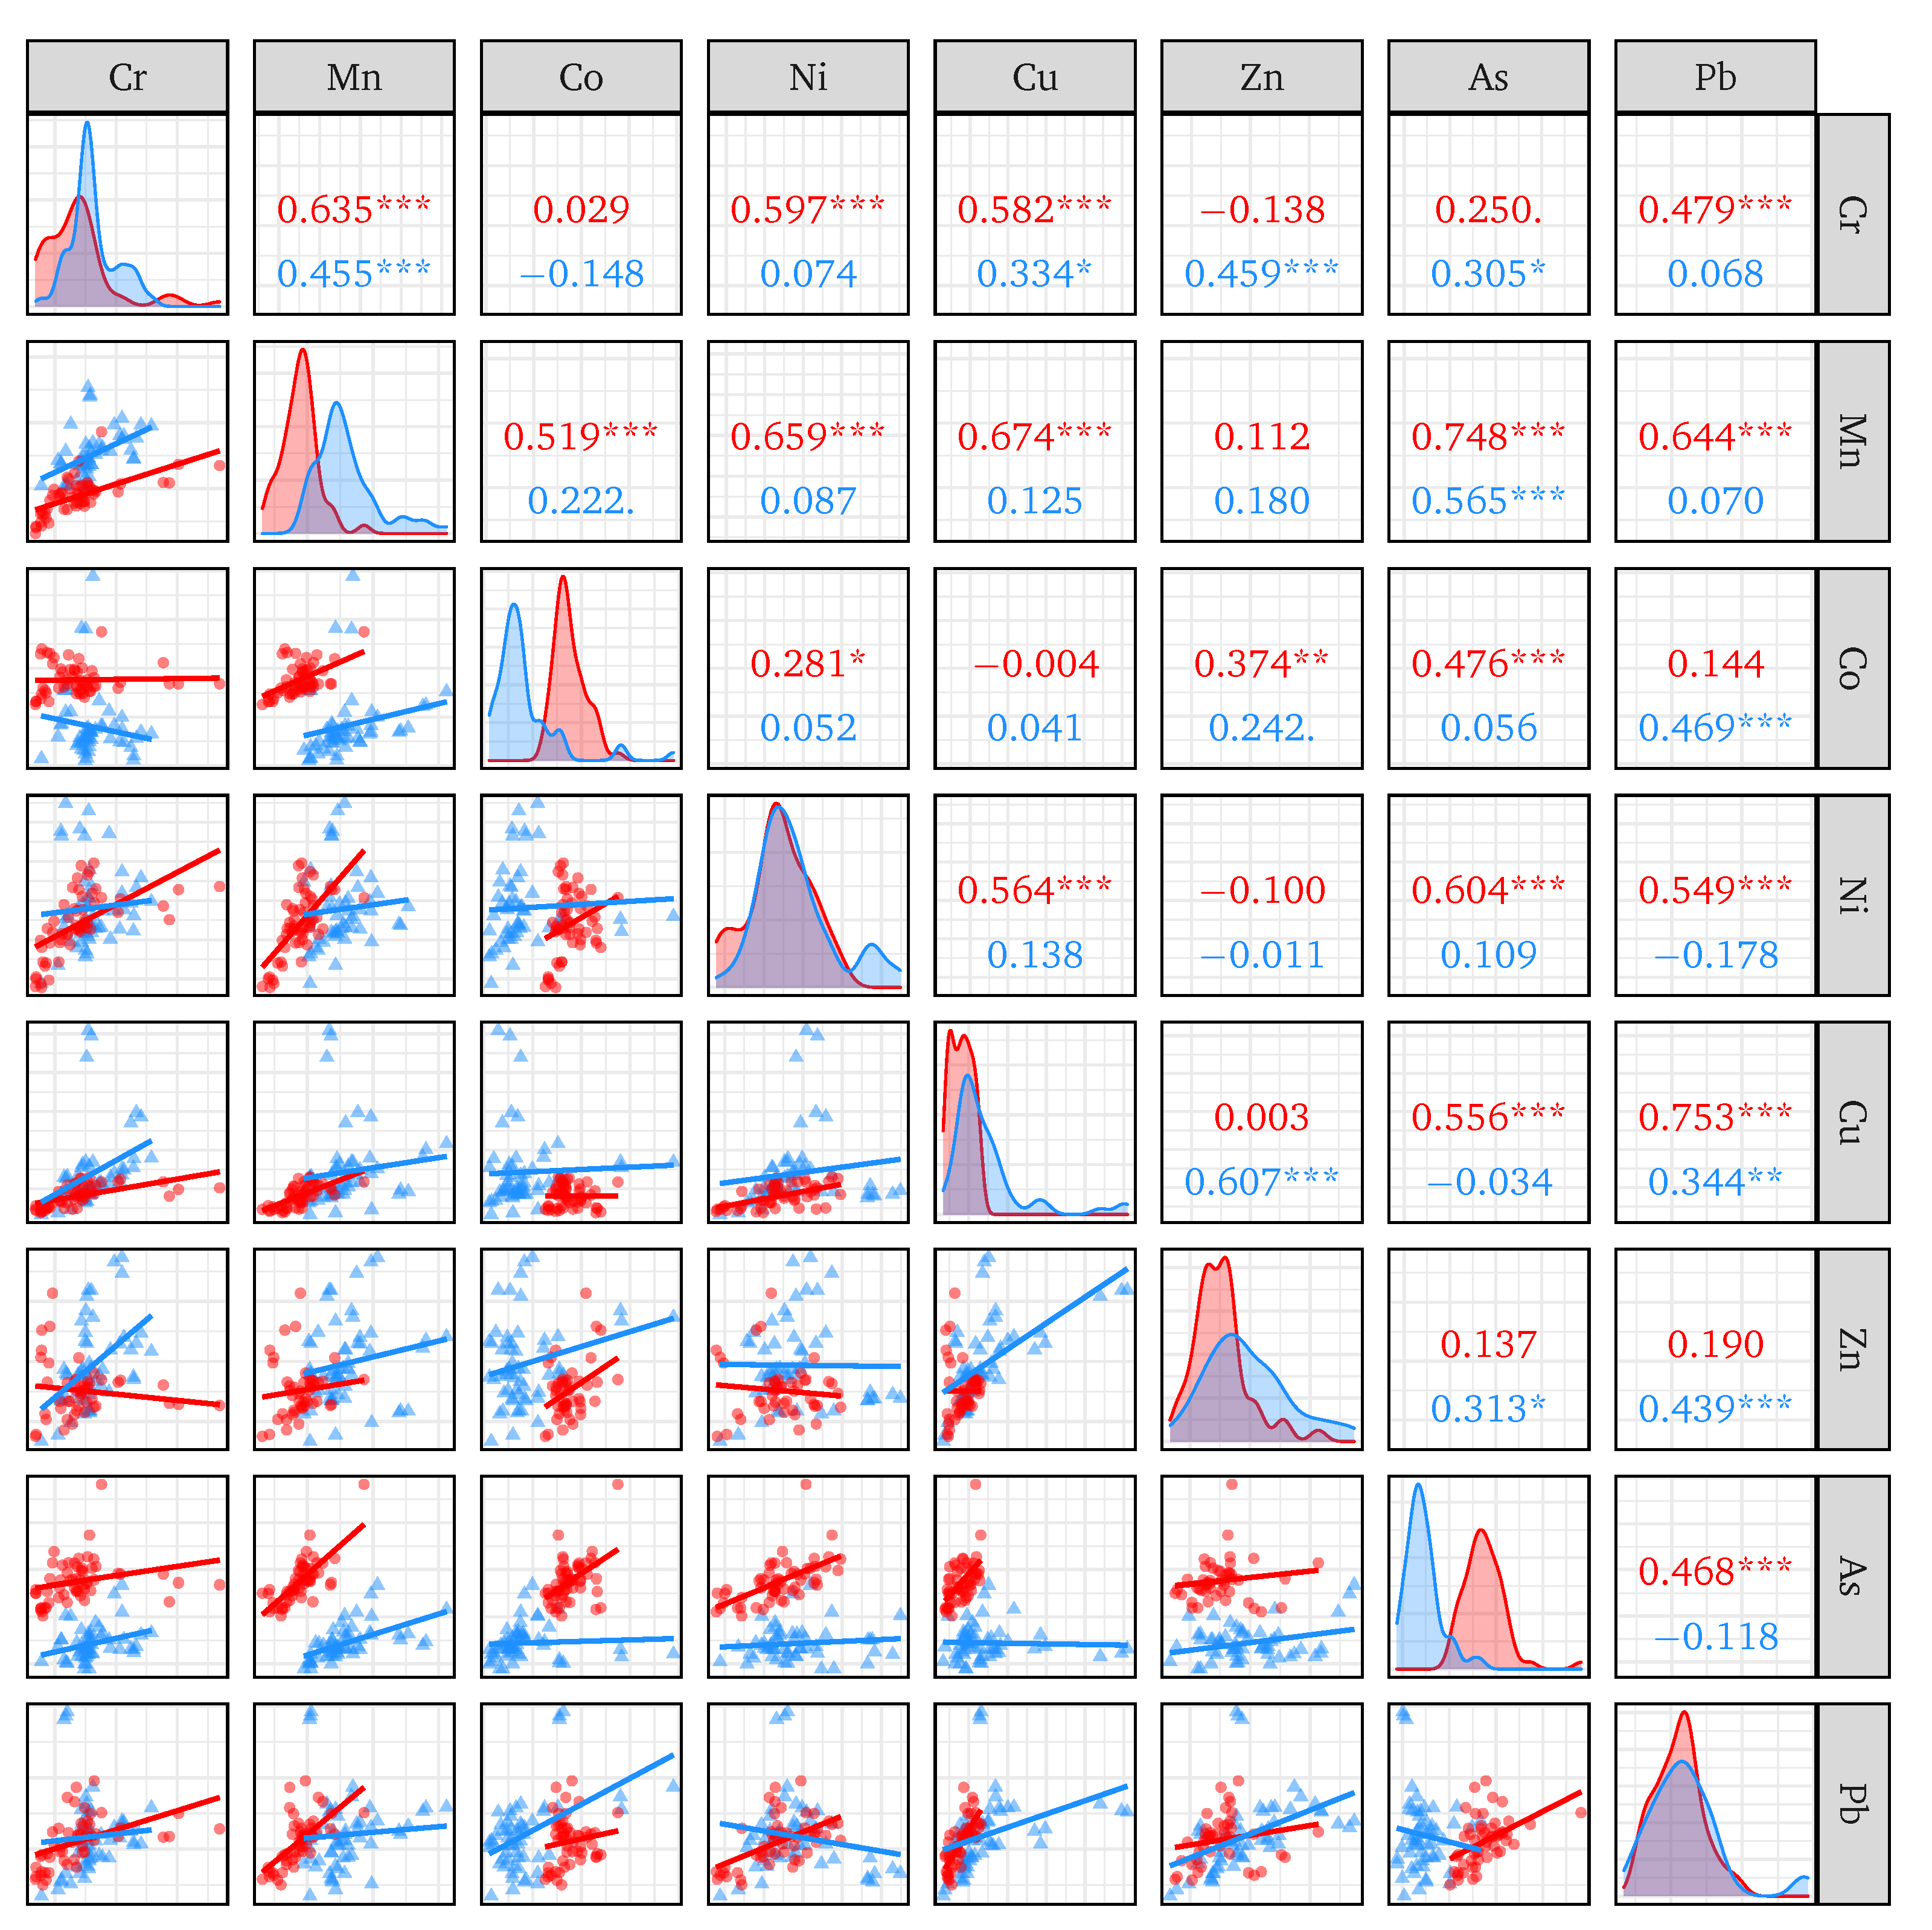
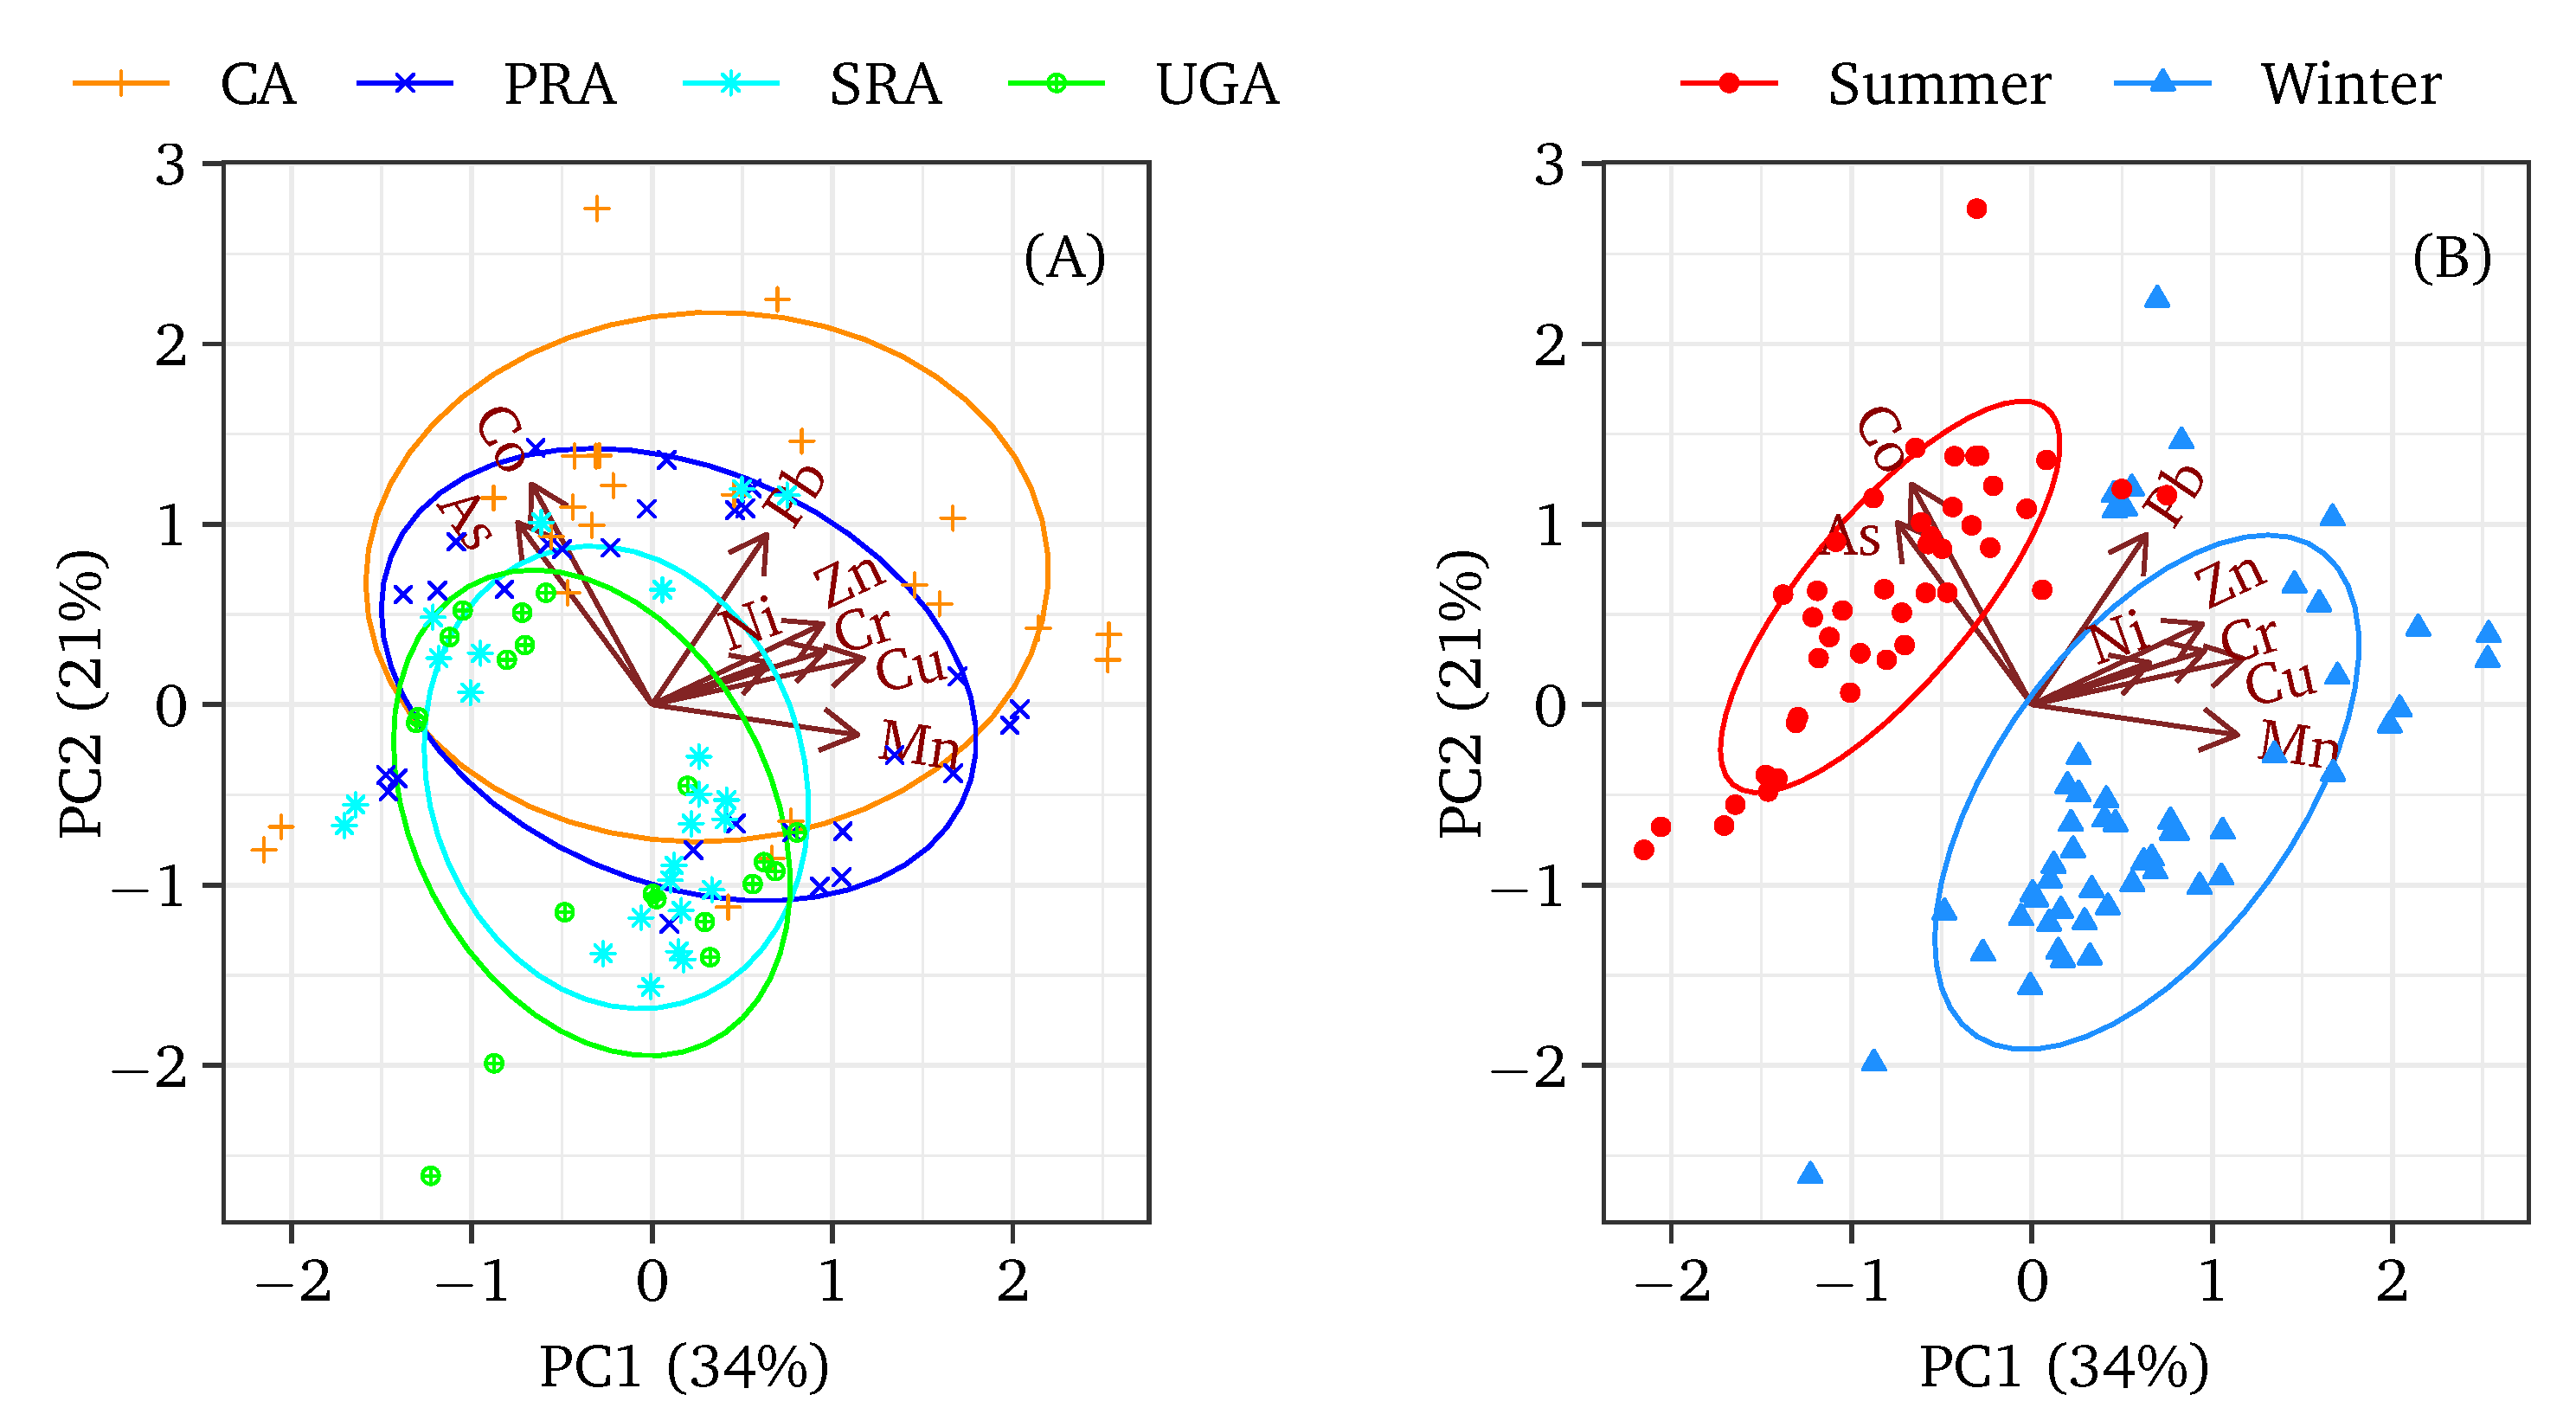
3.1. Spatial and Seasonal Distribution of Heavy Metals in Roadside Dust
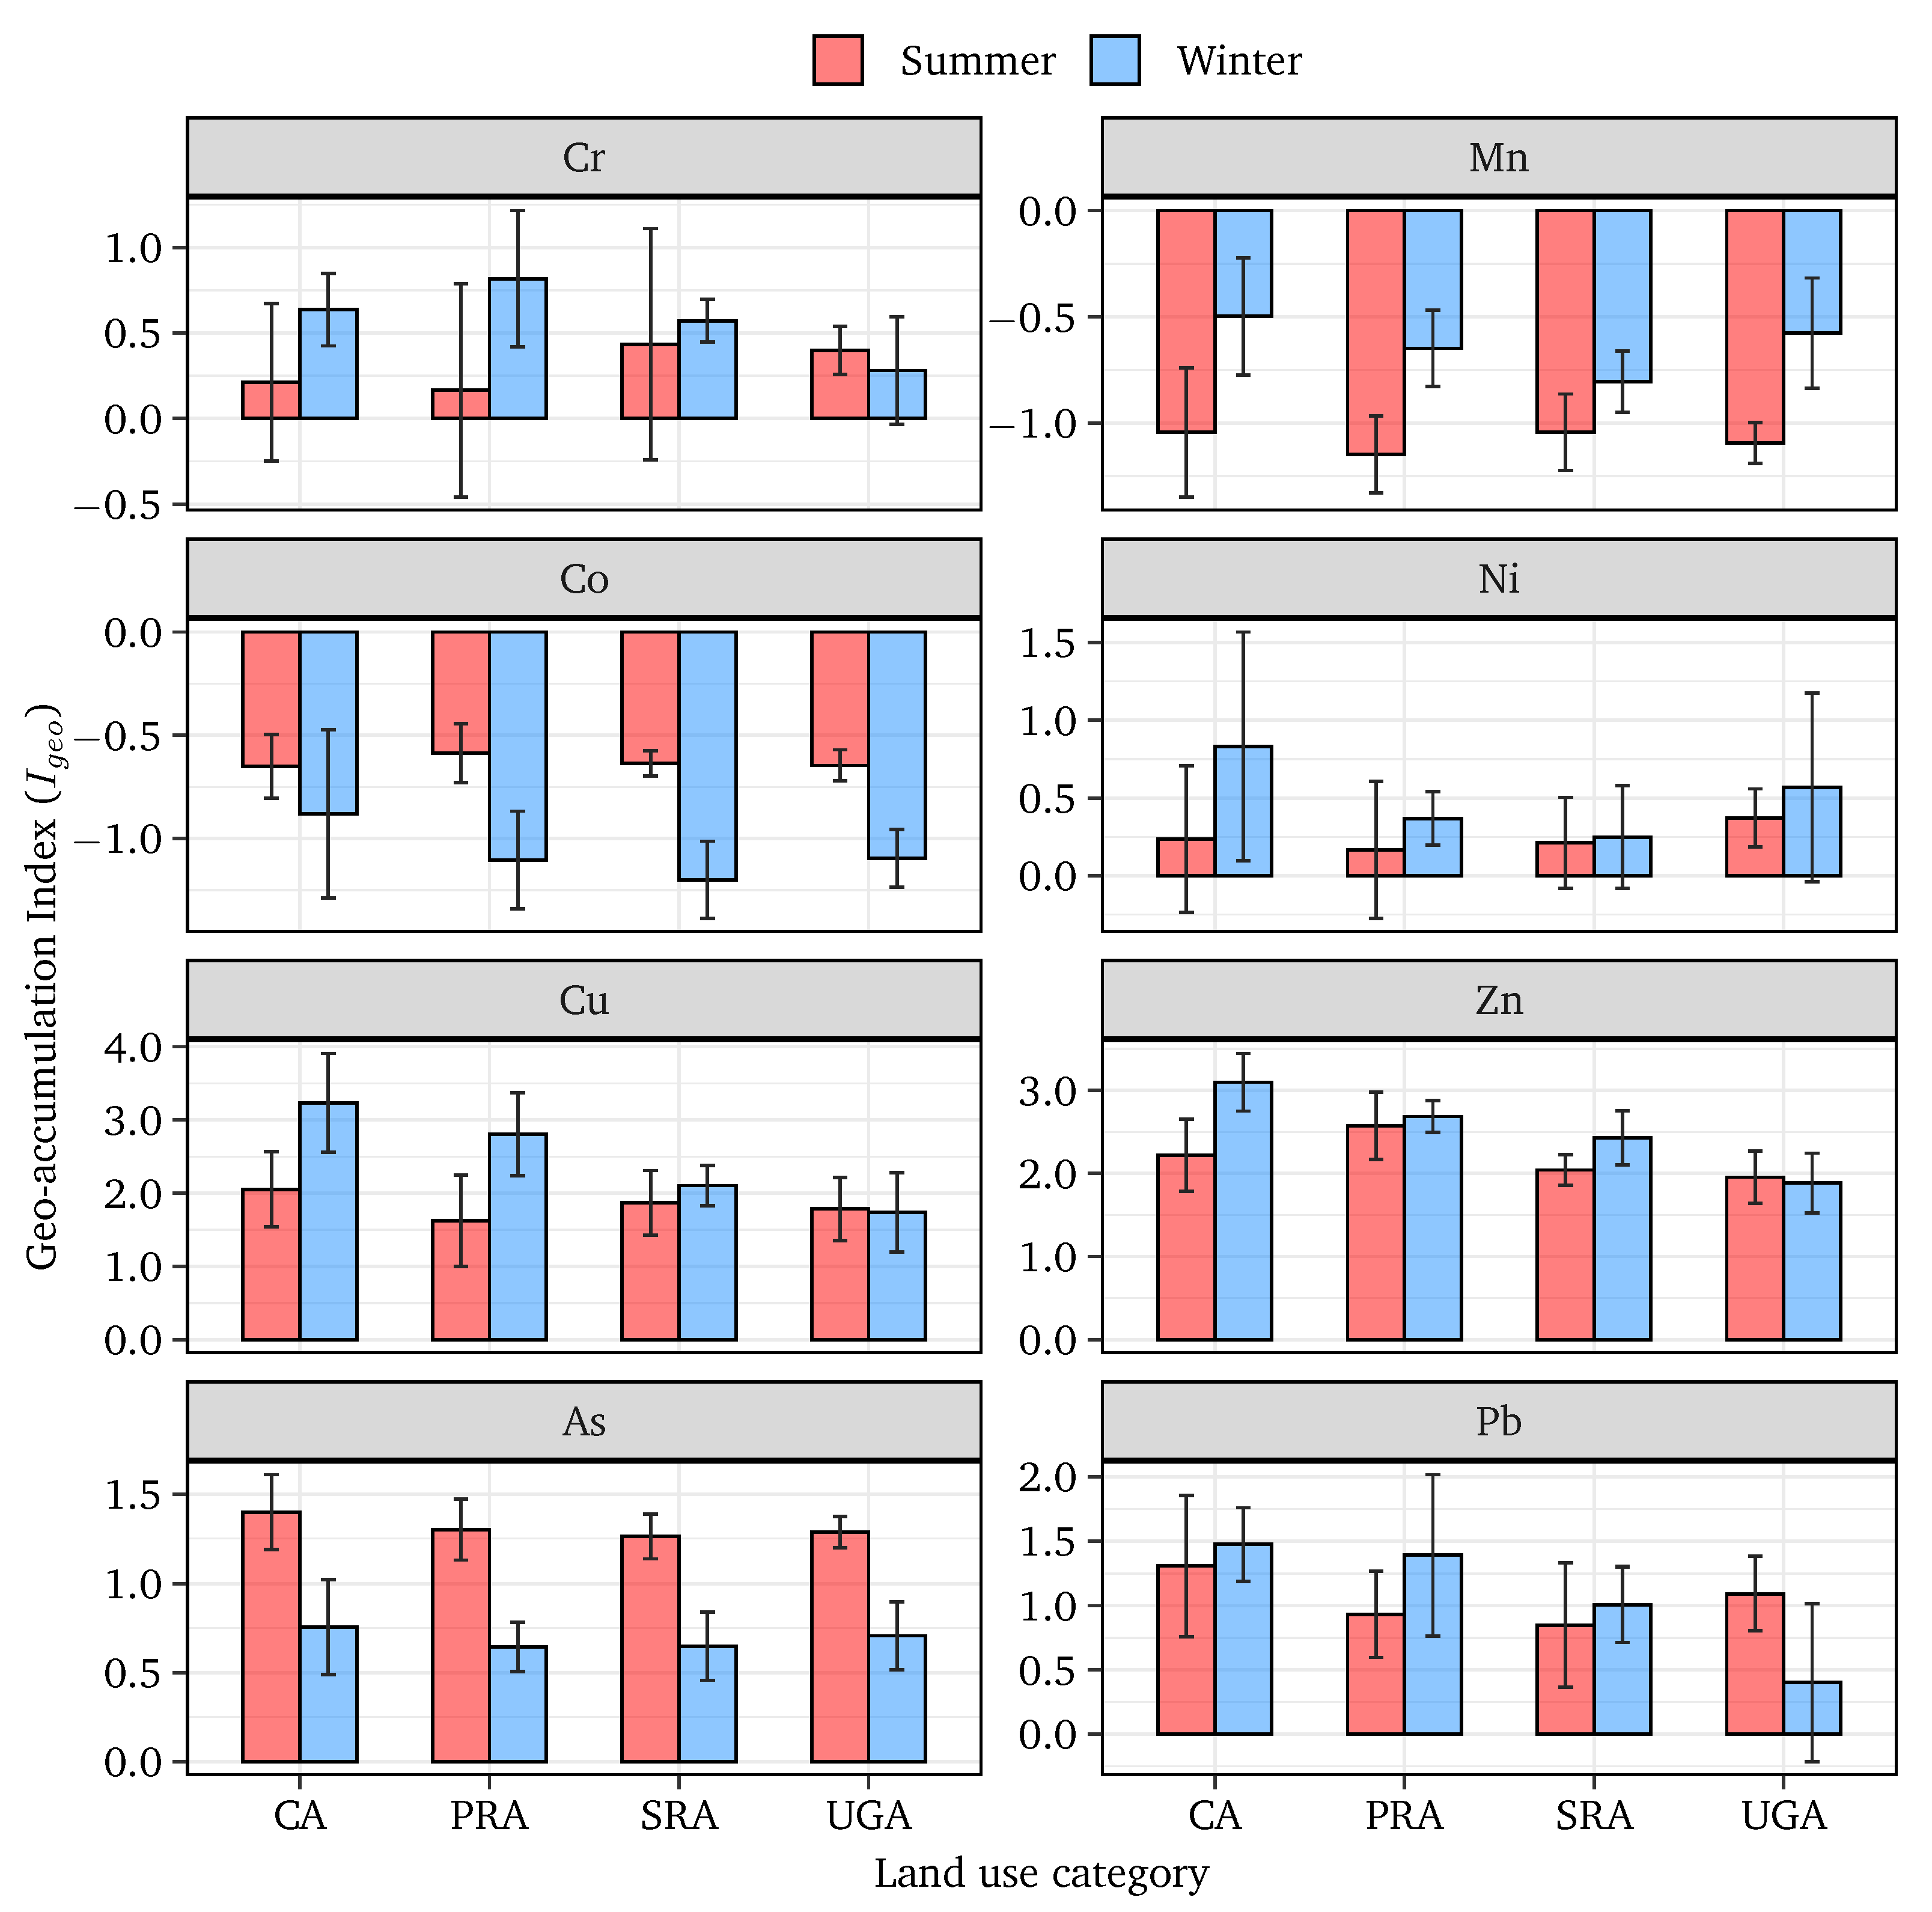
3.2. Geo-Accumulation Index ()
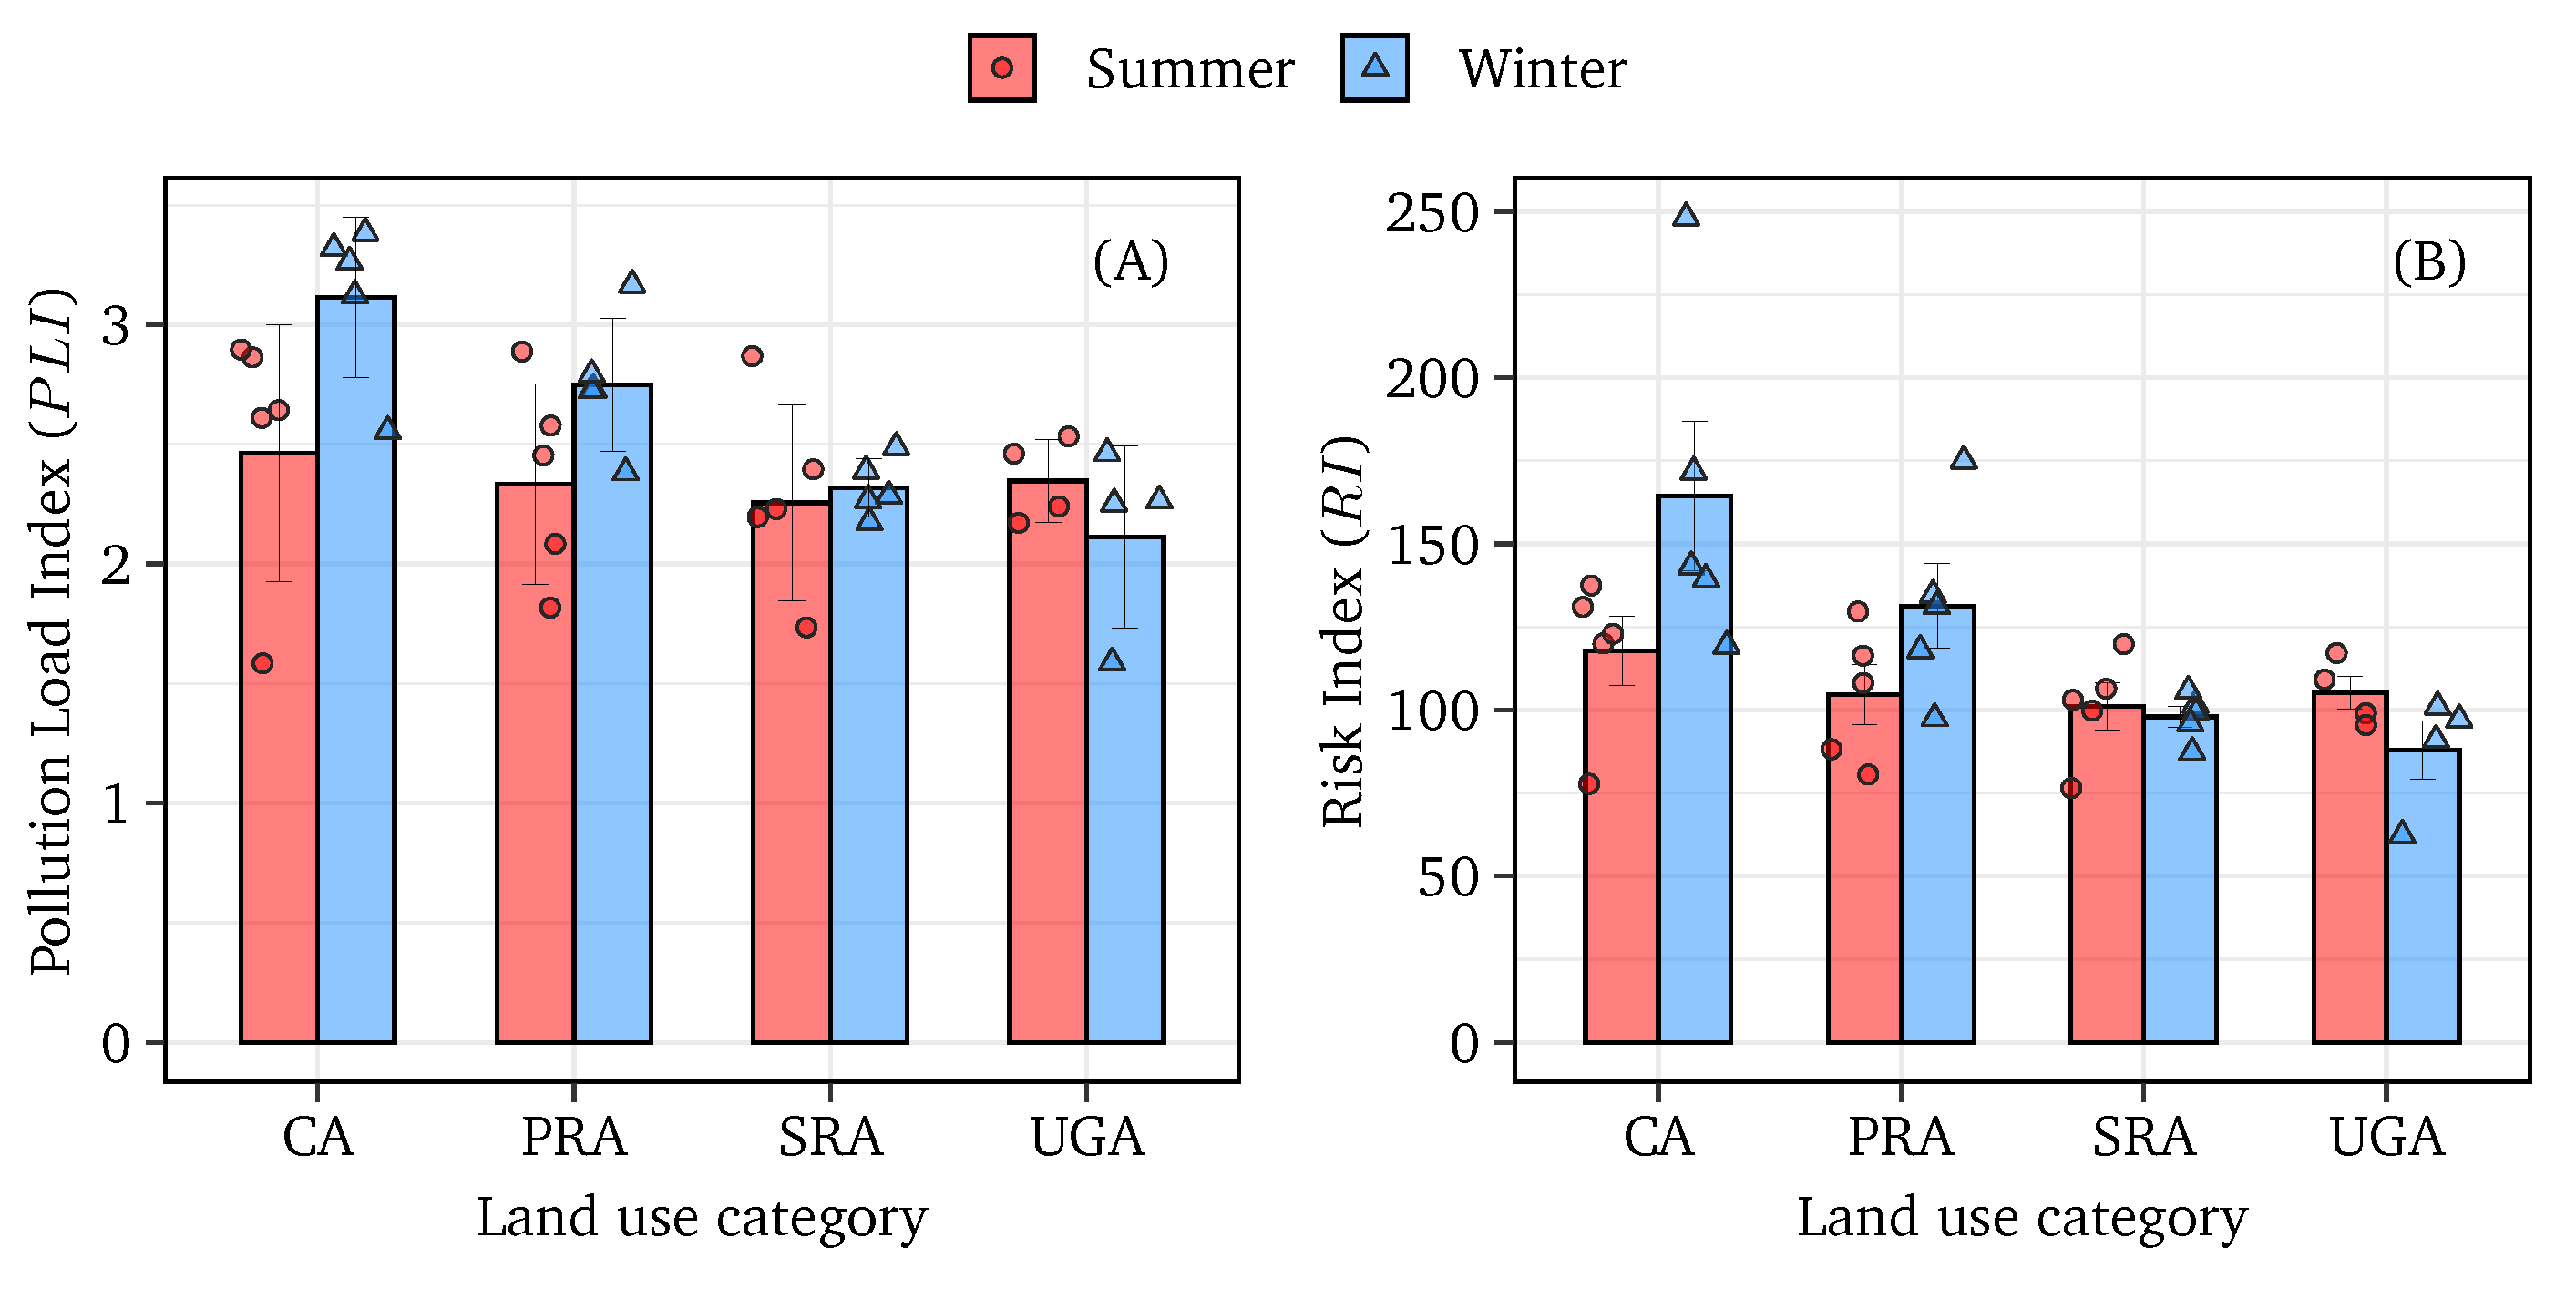
3.3. Contamination Factor () and Pollution Load Index ()
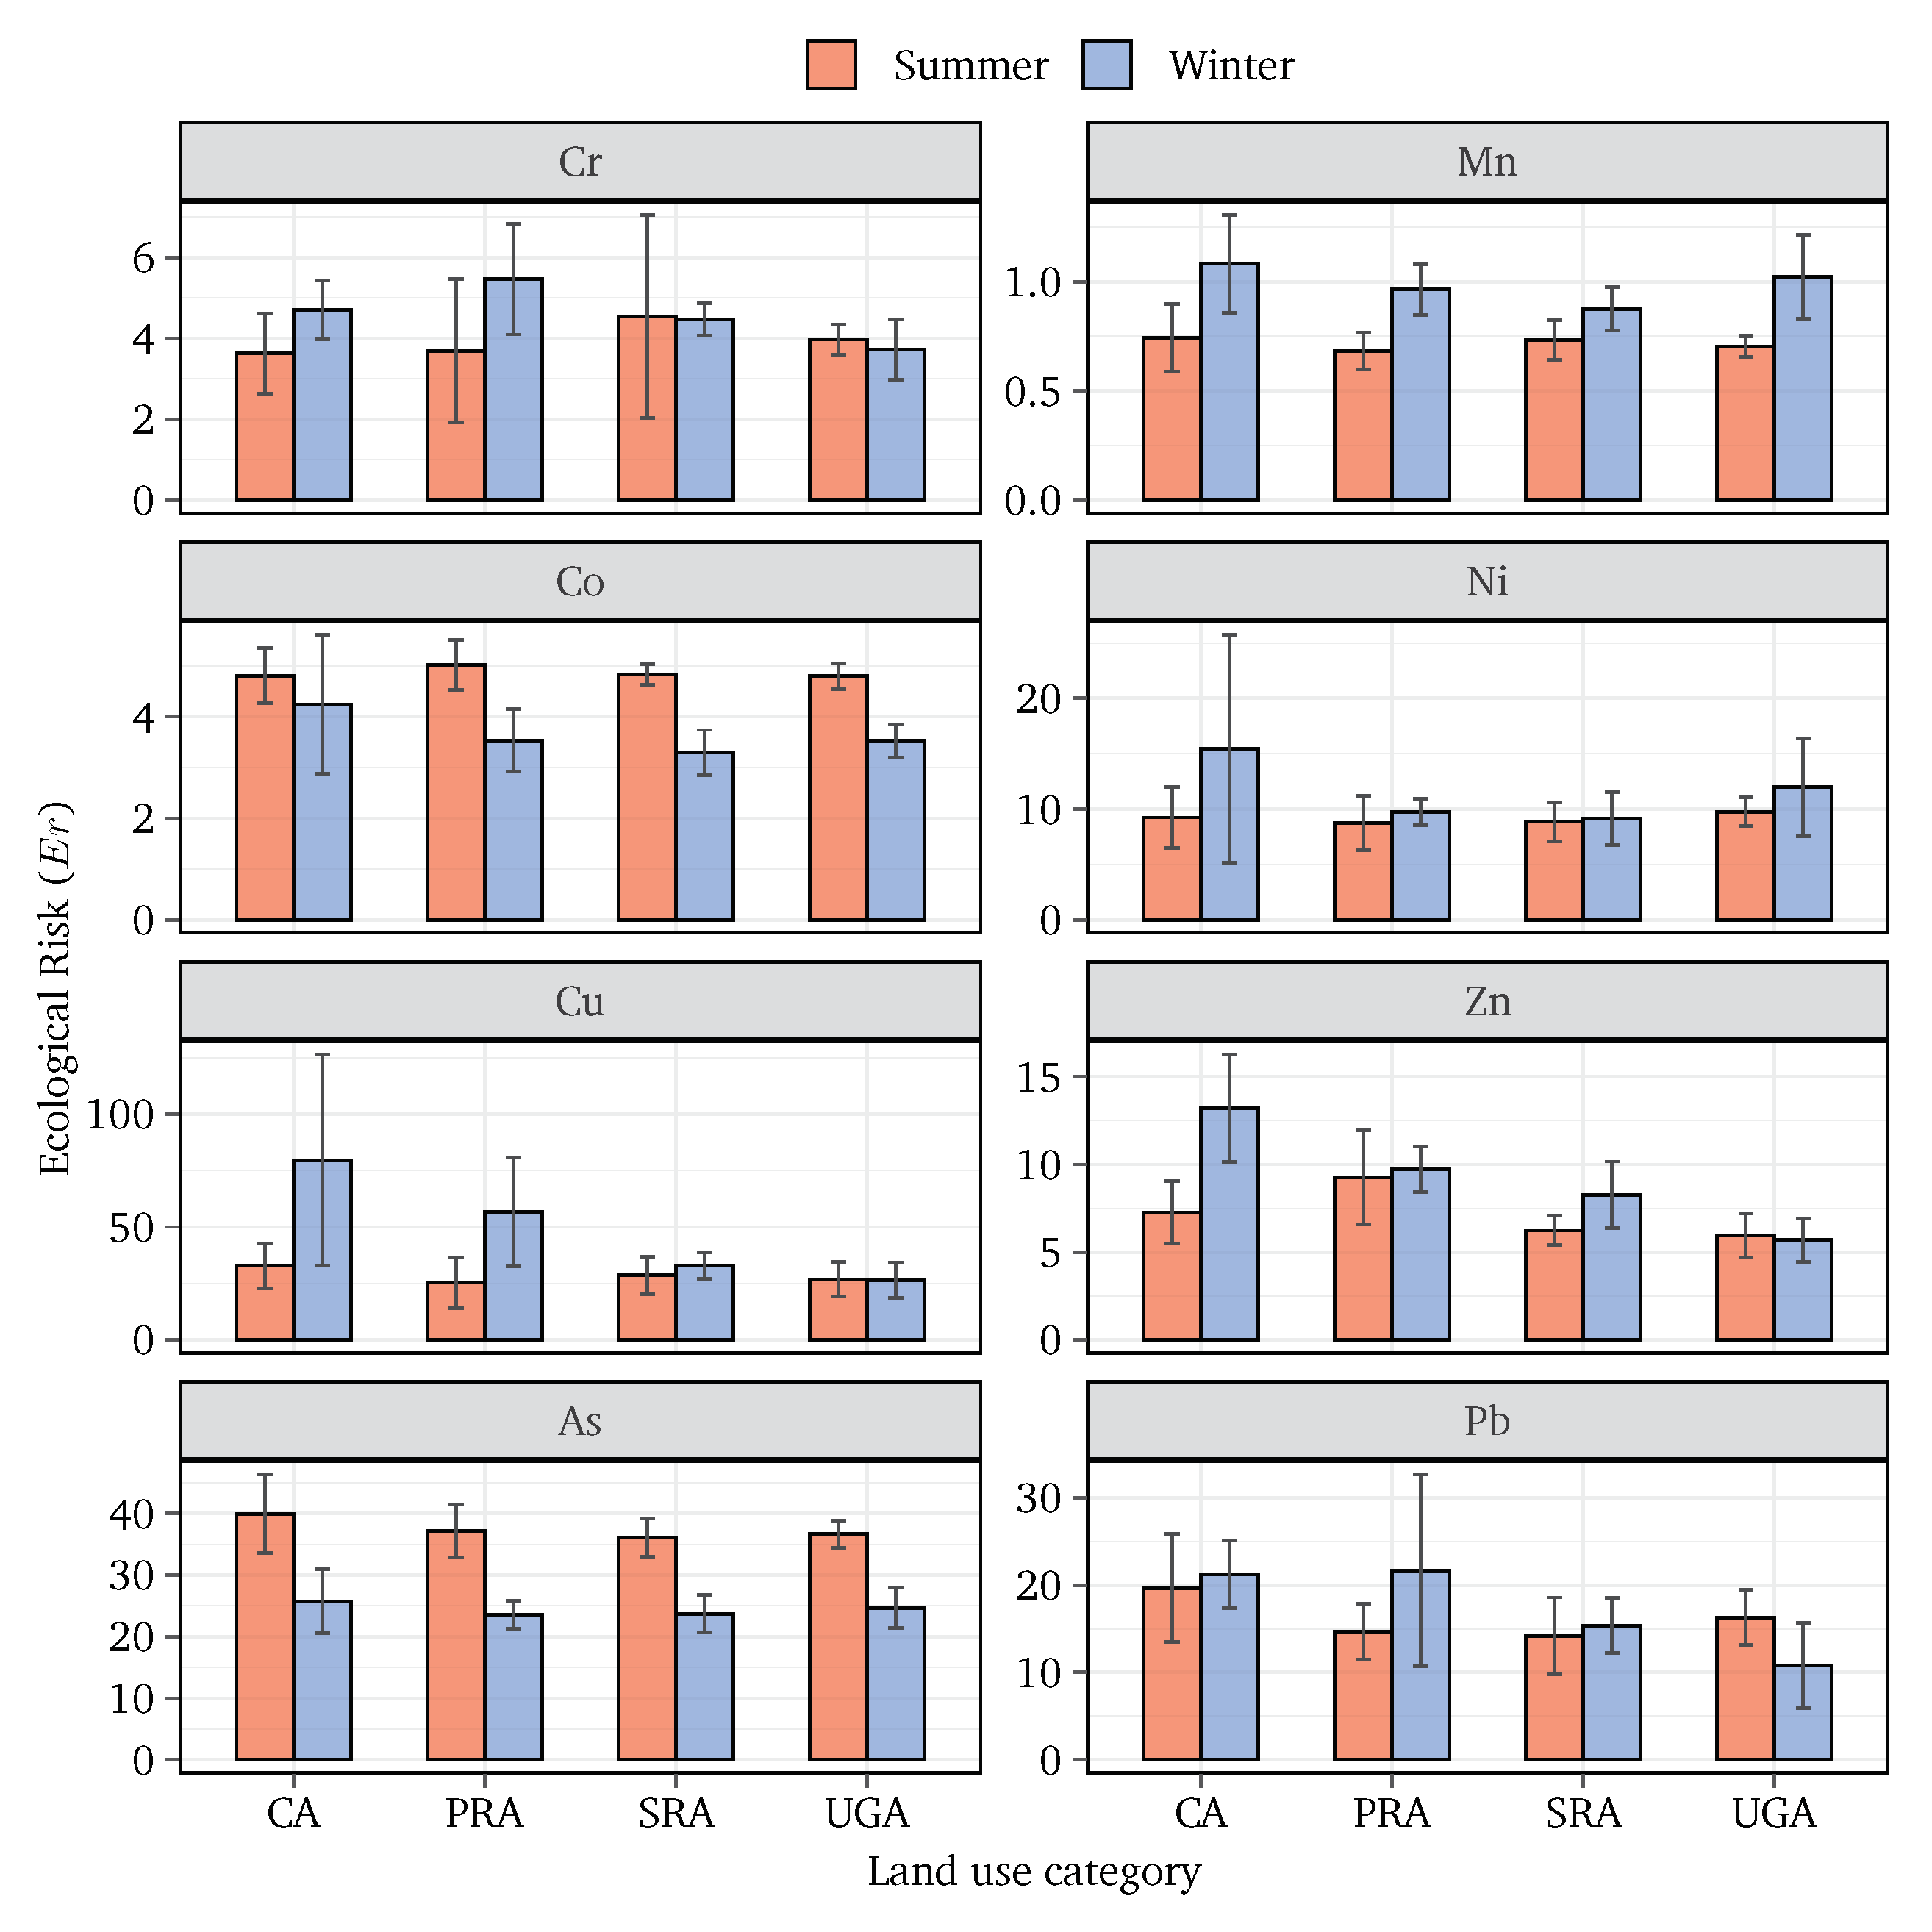
3.4. Ecological Risk () and Ecological Risk Index ()
3.5. Enrichment Factor ()
4. Conclusions
Author Contributions
Funding
Institutional Review Board Statement
Informed Consent Statement
Data Availability Statement
Acknowledgments
Conflicts of Interest
References
- Padoan, E.; Romè, C.; Ajmone-Marsan, F. Bioaccessibility and size distribution of metals in road dust and roadside soils along a peri-urban transect. Sci. Total Environ. 2017, 601–602, 89–98. [Google Scholar] [CrossRef]
- Ramírez, O.; de la Campa, A.M.S.; Amato, F.; Moreno, T.; Silva, L.F.; de la Rosa, J.D. Physicochemical characterization and sources of the thoracic fraction of road dust in a Latin American megacity. Sci. Total Environ. 2019, 652, 434–446. [Google Scholar] [CrossRef]
- Khademi, H.; Gabarrón, M.; Abbaspour, A.; Martínez-Martínez, S.; Faz, A.; Acosta, J.A. Distribution of metal(loid)s in particle size fraction in urban soil and street dust: Influence of population density. Environ. Geochem. Health 2020, 42, 4341–4354. [Google Scholar] [CrossRef]
- Zhao, N.; Lu, X.; Chao, S.; Xu, X. Multivariate statistical analysis of heavy metals in less than 100 μm particles of street dust from Xining, China. Environ. Earth Sci. 2014, 73, 2319–2327. [Google Scholar] [CrossRef]
- Wang, Q.; Lu, X.; Pan, H. Analysis of heavy metals in the re-suspended road dusts from different functional areas in Xi’an, China. Environ. Sci. Pollut. Res. 2016, 23, 19838–19846. [Google Scholar] [CrossRef] [PubMed]
- Adachi, K.; Tainosho, Y. Single particle characterization of size-fractionated road sediments. Appl. Geochem. 2005, 20, 849–859. [Google Scholar] [CrossRef]
- Lawrence, C.R.; Neff, J.C. The contemporary physical and chemical flux of aeolian dust: A synthesis of direct measurements of dust deposition. Chem. Geol. 2009, 267, 46–63. [Google Scholar] [CrossRef]
- Sioutas, C.; Delfino, R.J.; Singh, M. Exposure Assessment for Atmospheric Ultrafine Particles (UFPs) and Implications in Epidemiologic Research. Environ. Health Perspect. 2005, 113, 947–955. [Google Scholar] [CrossRef] [Green Version]
- Han, X.; Lu, X.; Zhang, Q.; Wuyuntana; Hai, Q.; Pan, H. Grain-size distribution and contamination characteristics of heavy metal in street dust of Baotou, China. Environ. Earth Sci. 2016, 75, 468. [Google Scholar] [CrossRef]
- Men, C.; Liu, R.; Wang, Q.; Guo, L.; Shen, Z. The impact of seasonal varied human activity on characteristics and sources of heavy metals in metropolitan road dusts. Sci. Total Environ. 2018, 637–638, 844–854. [Google Scholar] [CrossRef]
- Guo, G.; Zhang, D.; Wang, Y. Source apportionment and source-specific health risk assessment of heavy metals in size-fractionated road dust from a typical mining and smelting area, Gejiu, China. Environ. Sci. Pollut. Res. 2020, 28, 9313–9326. [Google Scholar] [CrossRef]
- Gope, M.; Masto, R.E.; George, J.; Balachandran, S. Tracing source, distribution and health risk of potentially harmful elements (PHEs) in street dust of Durgapur, India. Ecotoxicol. Environ. Saf. 2018, 154, 280–293. [Google Scholar] [CrossRef]
- Jose, J.; Srimuruganandam, B. Investigation of road dust characteristics and its associated health risks from an urban environment. Environ. Geochem. Health 2020, 42, 2819–2840. [Google Scholar] [CrossRef] [PubMed]
- Men, C.; Liu, R.; Xu, F.; Wang, Q.; Guo, L.; Shen, Z. Pollution characteristics, risk assessment, and source apportionment of heavy metals in road dust in Beijing, China. Sci. Total Environ. 2018, 612, 138–147. [Google Scholar] [CrossRef] [PubMed]
- Trujillo-González, J.M.; Torres-Mora, M.A.; Keesstra, S.; Brevik, E.C.; Jiménez-Ballesta, R. Heavy metal accumulation related to population density in road dust samples taken from urban sites under different land uses. Sci. Total Environ. 2016, 553, 636–642. [Google Scholar] [CrossRef]
- UN. Population Dynamics, World Urbanization Prospects 2018, Population of Urban Agglomerations with 300,000 Inhabitants or More in 2018, by Country, 1950–2035 (Thousands); Department of Economic and Social Affairs, United Nations: New York, NY, USA, 2018. [Google Scholar]
- Selonen, V.; Varjonen, R.; Korpimäki, E. Immediate or lagged responses of a red squirrel population to pulsed resources. Oecologia 2014, 177, 401–411. [Google Scholar] [CrossRef] [PubMed]
- Iqbal, A.; Afroze, S.; Rahman, M.M. Probabilistic Health Risk Assessment of Vehicular Emissions as an Urban Health Indicator in Dhaka City. Sustainability 2019, 11, 6427. [Google Scholar] [CrossRef] [Green Version]
- Ahmed, S.A.; Ali, S.M. People as partners: Facilitating people’s participation in public–private partnerships for solid waste management. Habitat Int. 2006, 30, 781–796. [Google Scholar] [CrossRef]
- Rahman, M.S.; Saha, N.; Molla, A.H. Potential ecological risk assessment of heavy metal contamination in sediment and water body around Dhaka export processing zone, Bangladesh. Environ. Earth Sci. 2014, 71, 2293–2308. [Google Scholar] [CrossRef]
- Rahman, M.S.; Khan, M.D.H.; Jolly, Y.N.; Kabir, J.; Akter, S.; Salam, A. Assessing risk to human health for heavy metal contamination through street dust in the Southeast Asian Megacity: Dhaka, Bangladesh. Sci. Total Environ. 2019, 660, 1610–1622. [Google Scholar] [CrossRef]
- Rahman, M.S.; Jolly, Y.N.; Akter, S.; Kamal, N.A.; Rahman, R.; Choudhury, T.R.; Begum, B.A. Sources of toxic elements in indoor dust sample at export processing zone (EPZ) area: Dhaka, Bangladesh and their impact on human health. Environ. Sci. Pollut. Res. 2021. [Google Scholar] [CrossRef]
- Rahman, M.S.; Kumar, S.; Nasiruddin, M.; Saha, N. Deciphering the origin of Cu, Pb and Zn contamination in school dust and soil of Dhaka, a megacity in Bangladesh. Environ. Sci. Pollut. Res. 2021. [Google Scholar] [CrossRef]
- Hoque, M.A.; Hoque, M.M.; Ahmed, K.M. Declining groundwater level and aquifer dewatering in Dhaka metropolitan area, Bangladesh: Causes and quantification. Hydrogeol. J. 2007, 15, 1523–1534. [Google Scholar] [CrossRef]
- Shahid, S. Recent trends in the climate of Bangladesh. Clim. Res. 2010, 42, 185–193. [Google Scholar] [CrossRef] [Green Version]
- Zhang, J.; Hua, P.; Krebs, P. Influences of land use and antecedent dry-weather period on pollution level and ecological risk of heavy metals in road-deposited sediment. Environ. Pollut. 2017, 228, 158–168. [Google Scholar] [CrossRef] [PubMed]
- Dytłow, S.; Górka-Kostrubiec, B. Concentration of heavy metals in street dust: An implication of using different geochemical background data in estimating the level of heavy metal pollution. Environ. Geochem. Health 2020, 43, 521–535. [Google Scholar] [CrossRef] [PubMed]
- Muller, G. Index of geoaccumulation in sediments of the Rhine River. Geojournal 1969, 2, 108–118. [Google Scholar]
- Khuzestani, R.B.; Souri, B. Evaluation of heavy metal contamination hazards in nuisance dust particles, in Kurdistan Province, western Iran. J. Environ. Sci. 2013, 25, 1346–1354. [Google Scholar] [CrossRef]
- Wedepohl, K.H. The composition of the continental crust. Geochim. Et Cosmochim. Acta 1995, 59, 1217–1232. [Google Scholar] [CrossRef]
- Ali, M.U.; Liu, G.; Yousaf, B.; Abbas, Q.; Ullah, H.; Munir, M.A.M.; Fu, B. Pollution characteristics and human health risks of potentially ecotoxic elements (PTEs) in road dust from metropolitan area of Hefei, China. Chemosphere 2017, 181, 111–121. [Google Scholar] [CrossRef]
- Gope, M.; Masto, R.E.; George, J.; Hoque, R.R.; Balachandran, S. Bioavailability and health risk of some potentially toxic elements (Cd, Cu, Pb and Zn) in street dust of Asansol, India. Ecotoxicol. Environ. Saf. 2017, 138, 231–241. [Google Scholar] [CrossRef]
- Kamani, H.; Mirzaei, N.; Ghaderpoori, M.; Bazrafshan, E.; Rezaei, S.; Mahvi, A.H. Concentration and ecological risk of heavy metal in street dusts of Eslamshahr, Iran. Hum. Ecol. Risk Assess. Int. J. 2017, 24, 961–970. [Google Scholar] [CrossRef]
- Hakanson, L. An ecological risk index for aquatic pollution control—A sedimentological approach. Water Res. 1980, 14, 975–1001. [Google Scholar] [CrossRef]
- Alsafran, M.; Usman, K.; Jabri, H.A.; Rizwan, M. Ecological and Health Risks Assessment of Potentially Toxic Metals and Metalloids Contaminants: A Case Study of Agricultural Soils in Qatar. Toxics 2021, 9, 35. [Google Scholar] [CrossRef] [PubMed]
- Al-Taani, A.A.; Nazzal, Y.; Howari, F.M.; Iqbal, J.; Orm, N.B.; Xavier, C.M.; Bărbulescu, A.; Sharma, M.; Dumitriu, C.S. Contamination Assessment of Heavy Metals in Agricultural Soil, in the Liwa Area (UAE). Toxics 2021, 9, 53. [Google Scholar] [CrossRef] [PubMed]
- Jaskuła, J.; Sojka, M.; Fiedler, M.; Wróżyński, R. Analysis of Spatial Variability of River Bottom Sediment Pollution with Heavy Metals and Assessment of Potential Ecological Hazard for the Warta River, Poland. Minerals 2021, 11, 327. [Google Scholar] [CrossRef]
- Mondal, P.; Lofrano, G.; Carotenuto, M.; Guida, M.; Trifuoggi, M.; Libralato, G.; Sarkar, S. Health Risk and Geochemical Assessment of Trace Elements in Surface Sediment along the Hooghly (Ganges) River Estuary (India). Water 2021, 13, 110. [Google Scholar] [CrossRef]
- Cai, K.; Li, C. Street Dust Heavy Metal Pollution Source Apportionment and Sustainable Management in A Typical City—Shijiazhuang, China. Int. J. Environ. Res. Public Health 2019, 16, 2625. [Google Scholar] [CrossRef] [Green Version]
- Sanleandro, P.M.; Navarro, A.S.; Díaz-Pereira, E.; Zuñiga, F.B.; Muñoz, M.R.; Iniesta, M.D. Assessment of Heavy Metals and Color as Indicators of Contamination in Street Dust of a City in SE Spain: Influence of Traffic Intensity and Sampling Location. Sustainability 2018, 10, 4105. [Google Scholar] [CrossRef] [Green Version]
- Kim, J.; Park, J.; Hwang, W. Heavy Metal Distribution in Street Dust from Traditional Markets and the Human Health Implications. Int. J. Environ. Res. Public Health 2016, 13, 820. [Google Scholar] [CrossRef] [Green Version]
- Li, N.; Han, W.; Tang, J.; Bian, J.; Sun, S.; Song, T. Pollution Characteristics and Human Health Risks of Elements in Road Dust in Changchun, China. Int. J. Environ. Res. Public Health 2018, 15, 1843. [Google Scholar] [CrossRef] [Green Version]
- Taiwo, A.M.; Michael, J.O.; Gbadebo, A.M.; Oladoyinbo, F.O. Pollution and health risk assessment of road dust from Osogbo metropolis, Osun state, Southwestern Nigeria. Hum. Ecol. Risk Assess. Int. J. 2019, 26, 1254–1269. [Google Scholar] [CrossRef]
- Dehghani, S.; Moore, F.; Keshavarzi, B.; Beverley, A.H. Health risk implications of potentially toxic metals in street dust and surface soil of Tehran, Iran. Ecotoxicol. Environ. Saf. 2017, 136, 92–103. [Google Scholar] [CrossRef] [PubMed]
- Fiala, M.; Hwang, H.M. Influence of Highway Pavement on Metals in Road Dust: A Case Study in Houston, Texas. Water Air Soil Pollut. 2021, 232, 185–196. [Google Scholar] [CrossRef]
- Sutherland, R.A. Bed sediment-associated trace metals in an urban stream, Oahu, Hawaii. Environ. Geol. 2000, 39, 611–627. [Google Scholar] [CrossRef]
- R Core Team. R: A Language and Environment for Statistical Computing; R Foundation for Statistical Computing: Vienna, Austria, 2017. [Google Scholar]
- Kahle, D.; Wickham, H. ggmap: Spatial Visualization with ggplot2. R J. 2013, 5, 144–161. [Google Scholar] [CrossRef] [Green Version]
- Han, H.; Hu, S.; Syed-Hassan, S.S.A.; Xiao, Y.; Wang, Y.; Xu, J.; Jiang, L.; Su, S.; Xiang, J. Effects of reaction conditions on the emission behaviors of arsenic, cadmium and lead during sewage sludge pyrolysis. Bioresour. Technol. 2017, 236, 138–145. [Google Scholar] [CrossRef] [PubMed]
- Doabi, S.A.; Afyuni, M.; Karami, M. Multivariate statistical analysis of heavy metals contamination in atmospheric dust of Kermanshah province, western Iran, during the spring and summer 2013. J. Geochem. Explor. 2017, 180, 61–70. [Google Scholar] [CrossRef]
- Pan, H.; Lu, X.; Lei, K. A comprehensive analysis of heavy metals in urban road dust of Xi’an, China: Contamination, source apportionment and spatial distribution. Sci. Total Environ. 2017, 609, 1361–1369. [Google Scholar] [CrossRef]
- Mondal, S.; Singh, G. Pollution evaluation, human health effect and tracing source of trace elements on road dust of Dhanbad, a highly polluted industrial coal belt of India. Environ. Geochem. Health 2021, 43, 2081–2103. [Google Scholar] [CrossRef]
- Li, X.; Poon, C.-s.; Liu, P.S. Heavy metal contamination of urban soils and street dusts in Hong Kong. Appl. Geochem. 2001, 16, 1361–1368. [Google Scholar] [CrossRef]
- Hossain, M. Bangladesh Environment Facing the 21th Century, 2nd ed.; Society for Environment and Human Development (SEHD): Dhaka, Bangladesh, 2002; pp. 207–216. [Google Scholar]
- Yang, Z.; Lu, W.; Long, Y.; Bao, X.; Yang, Q. Assessment of heavy metals contamination in urban topsoil from Changchun City, China. J. Geochem. Explor. 2011, 108, 27–38. [Google Scholar] [CrossRef]
- Ewen, C.; Anagnostopoulou, M.A.; Ward, N.I. Monitoring of heavy metal levels in roadside dusts of Thessaloniki, Greece in relation to motor vehicle traffic density and flow. Environ. Monit. Assess. 2008, 157, 483–498. [Google Scholar] [CrossRef] [PubMed] [Green Version]
- Mihankhah, T.; Saeedi, M.; Karbassi, A. A comparative study of elemental pollution and health risk assessment in urban dust of different land-uses in Tehran’s urban area. Chemosphere 2020, 241, 124984. [Google Scholar] [CrossRef] [PubMed]
- Rout, T.K.; Masto, R.E.; Padhy, P.K.; Ram, L.C.; George, J.; Joshi, G. Heavy metals in dusts from commercial and residential areas of Jharia coal mining town. Environ. Earth Sci. 2014, 73, 347–359. [Google Scholar] [CrossRef]
- Mohmand, J.; Eqani, S.A.M.A.S.; Fasola, M.; Alamdar, A.; Mustafa, I.; Ali, N.; Liu, L.; Peng, S.; Shen, H. Human exposure to toxic metals via contaminated dust: Bio-accumulation trends and their potential risk estimation. Chemosphere 2015, 132, 142–151. [Google Scholar] [CrossRef] [PubMed]
- Jadoon, W.A.; Khpalwak, W.; Chidya, R.C.G.; Abdel-Dayem, S.M.M.A.; Takeda, K.; Makhdoom, M.A.; Sakugawa, H. Evaluation of Levels, Sources and Health Hazards of Road-Dust Associated Toxic Metals in Jalalabad and Kabul Cities, Afghanistan. Arch. Environ. Contam. Toxicol. 2017, 74, 32–45. [Google Scholar] [CrossRef]
- Napit, A.; Shakya, S.; Shrestha, M.; Shakya, R.K.; Shrestha, P.K.; Pradhananga, A.R.; Ghimire, N.G.; Pant, D.R.; Shakya, P.R. Pollution Characteristics and Human Health Risks to Heavy Metals Exposure in Street Dust of Kathmandu, Nepal. Adv. J. Chem.-Sect. A 2020, 3, 645–662. [Google Scholar] [CrossRef]
- Alsanad, A.; Alolayan, M. Heavy metals in road-deposited sediments and pollution indices for different land activities. Environ. Nanotechnol. Monit. Manag. 2020, 14, 100374. [Google Scholar] [CrossRef]
- Shi, D.; Lu, X. Accumulation degree and source apportionment of trace metals in smaller than 63 μm road dust from the areas with different land uses: A case study of Xi’an, China. Sci. Total Environ. 2018, 636, 1211–1218. [Google Scholar] [CrossRef] [PubMed]
- Shabbaj, I.; Alghamdi, M.; Shamy, M.; Hassan, S.; Alsharif, M.; Khoder, M. Risk Assessment and Implication of Human Exposure to Road Dust Heavy Metals in Jeddah, Saudi Arabia. Int. J. Environ. Res. Public Health 2017, 15, 36. [Google Scholar] [CrossRef] [Green Version]
- Li, H.; Qian, X.; Hu, W.; Wang, Y.; Gao, H. Chemical speciation and human health risk of trace metals in urban street dusts from a metropolitan city, Nanjing, SE China. Sci. Total Environ. 2013, 456–457, 212–221. [Google Scholar] [CrossRef]
- Jorfi, S.; Maleki, R.; Jaafarzadeh, N.; Ahmadi, M. Pollution load index for heavy metals in Mian-Ab plain soil, Khuzestan, Iran. Data Brief 2017, 15, 584–590. [Google Scholar] [CrossRef] [PubMed]
- Men, C.; Liu, R.; Xu, L.; Wang, Q.; Guo, L.; Miao, Y.; Shen, Z. Source-specific ecological risk analysis and critical source identification of heavy metals in road dust in Beijing, China. J. Hazard. Mater. 2020, 388, 121763. [Google Scholar] [CrossRef] [PubMed]
- Aminiyan, M.M.; Baalousha, M.; Mousavi, R.; Aminiyan, F.M.; Hosseini, H.; Heydariyan, A. The ecological risk, source identification, and pollution assessment of heavy metals in road dust: A case study in Rafsanjan, SE Iran. Environ. Sci. Pollut. Res. 2017, 25, 13382–13395. [Google Scholar] [CrossRef]
- Martínez, L.L.G.; Poleto, C. Assessment of diffuse pollution associated with metals in urban sediments using the geoaccumulation index (Igeo). J. Soils Sediments 2014, 14, 1251–1257. [Google Scholar] [CrossRef]

| Site [Reference] | Time | LUT | Metal Concentration (g/g) | Size (m) | |||||||
|---|---|---|---|---|---|---|---|---|---|---|---|
| Cr | Mn | Co | Ni | Cu | Zn | As | Pb | ||||
| Tehran, Iran [57] | Aug-18 | CA | 198 | 765 | – | 70 | 603 | 895 | 10.2 | 274 | <63 |
| RA | 60 | 691 | – | 48 | 253 | 757 | 10.6 | 266 | |||
| GL | 42 | 692 | – | 27.8 | 94.2 | 267 | 9.4 | 110 | |||
| Hefei, China [31] | Jun-16 | IA | 226 | 322 | 9.6 | 55.4 | 33.9 | 89.8 | 1.9 | 0.4 | <200 |
| UA | 127 | 237 | 7.1 | 19.8 | 71 | 245 | 4.0 | 2.4 | |||
| PUA | 65.2 | 162 | 4.8 | 10.6 | 19.6 | 55.8 | 0.2 | 0.02 | |||
| Kuwait [62] | Aug-19 | RA | 49.5 | 225 | 9.9 | 111 | 43.1 | 72.8 | – | 33.4 | <2000 |
| CA | 38.2 | 158 | 7 | 94.3 | 44.9 | 70.6 | – | 26.6 | |||
| IA | 57.2 | 215 | 8.1 | 133 | 167 | 183 | – | 143 | |||
| Villavicencio, Colombia [15] | Mar, Apr-14 | H | 9.4 | – | – | 5.3 | 126 | 133 | – | 87 | <2000 |
| RA | 7.3 | – | – | 7.2 | 23.7 | 108 | – | 26 | |||
| CA | 60 | – | – | 54 | 490 | 387 | – | 1289 | |||
| Xi’an, China [63] | Apr-15 | TA | 178 | 333 | 9.8 | 29.2 | 47 | 168 | – | 92 | <63 |
| RA | 172 | 377 | 12.2 | 34.6 | 47.5 | 163 | – | 115 | |||
| PA | 179 | 344 | 10 | 30.3 | 42.8 | 161 | – | 111 | |||
| EA | 176 | 339 | 9.5 | 27.9 | 47.6 | 178 | – | 99 | |||
| Bogota, Colombia [2] | Feb-15, Nov, Dec-2016 | RA | 29.2 | 87 | 2.12 | 9.8 | 39 | 156 | 2.6 | 35.6 | <10 |
| IA | 25.1 | 73.8 | 1.71 | 10.9 | 35.3 | 239 | 1.6 | 43.6 | |||
| CA | 11.6 | 0.70 | 5.32 | 28.3 | 90 | 0.7 | 14.4 | ||||
| Jeddah, Saudi Arabia [64] | Sep-16 | RA | 48.2 | 496 | 8.67 | 38.2 | 101 | 346 | 15.7 | 100 | <63 |
| PUA | 59.9 | 513 | 10.9 | 47.9 | 128 | 449 | 20 | 130 | |||
| MCA | 63 | 525 | 11.4 | 50 | 134 | 535 | 21 | 136 | |||
| Jharia, India [58] | Jan, May, Jun, July-11 | CA | 42 | 700 | 14.9 | 25.9 | 56.1 | 344 | 3.73 | 70.5 | <63 |
| RA | 53.6 | 600 | 17.6 | 45.3 | 44.7 | 162 | 4.43 | 49.8 | |||
| Durgapur, India [12] | Winter, 2013-’14 | NH | 280 | 2992 | – | 41.2 | 137 | 297 | – | 82.4 | <53 |
| RA | 225 | 948 | – | 33.2 | 82.4 | 145 | – | 49.8 | |||
| IA | 524 | 5207 | – | 41.7 | 121 | 297 | – | 55.6 | |||
| Punjab, Pakistan [59] | – | UA | 20.3 | 93 | 3 | 8 | 13.2 | 196 | – | 170 | <50 |
| IA | 15 | 77 | 2 | 6.6 | 61 | 123 | – | 189 | |||
| Kabul, Afghanistan [60] | Sep-15 | UA | 38.4 | 253 | 8.52 | 66.4 | 43.6 | 123 | – | 28.7 | <250 |
| Kathmandu, Nepal [61] | Feb, Mar-2019 | CA | 79.3 | – | – | 53.8 | – | – | – | 67.3 | <2000 |
| TA | 94.8 | – | – | 122.2 | – | – | – | 74.4 | |||
| RA | 58.2 | – | – | 30.8 | – | – | – | 50.2 | |||
| Dhaka, Bangladesh | Jun-19, Feb-20 | CA | 73 | 480 | 10.5 | 36.8 | 161 | 532 | 6.57 | 69.5 | <32 |
| PRA | 80 | 434 | 9.9 | 34.4 | 117 | 494 | 6.1 | 61.8 | |||
| SRA | 80 | 420 | 9.42 | 33.5 | 87.7 | 377 | 5.97 | 50.2 | |||
| UGA | 67.3 | 455 | 9.7 | 40.5 | 76.3 | 302 | 6.13 | 46.1 | |||
| Metal | Season | Land Use Category | |||
|---|---|---|---|---|---|
| CA | PRA | SRA | UGA | ||
| Cr | Summer | 1.81 ± 0.5 | 1.85 ± 0.9 | 2.27 ± 1.3 | 1.99 ± 0.2 |
| Winter | 5.52 ± 6.6 | 2.73 ± 0.7 | 2.24 ± 0.2 | 1.86 ± 0.4 | |
| Mn | Summer | 0.74 ± 0.2 | 0.68 ± 0.1 | 0.73 ± 0.1 | 0.7 ± 0.1 |
| Winter | 1.08 ± 0.2 | 0.96 ± 0.1 | 0.86 ± 0.1 | 1.02 ± 0.2 | |
| Co | Summer | 0.96 ± 0.1 | 1.00 ± 0.1 | 0.97 ± 0.1 | 0.96 ± 0.1 |
| Winter | 0.85 ± 0.3 | 0.71 ± 0.1 | 0.66 ± 0.1 | 0.7 ± 0.1 | |
| Ni | Summer | 1.85 ± 0.6 | 1.75 ± 0.5 | 1.77 ± 0.4 | 1.96 ± 0.3 |
| Winter | 3.09 ± 2.1 | 1.95 ± 0.2 | 1.83 ± 0.5 | 2.39 ± 0.9 | |
| Cu | Summer | 6.56 ± 1.9 | 5.06 ± 2.3 | 5.71 ± 1.7 | 5.38 ± 1.5 |
| Winter | 15.92 ± 9.4 | 11.31 ± 4.8 | 6.56 ± 1.2 | 5.29 ± 1.9 | |
| Zn | Summer | 7.26 ± 1.8 | 9.27 ± 2.7 | 6.23 ± 0.8 | 5.94 ± 1.2 |
| Winter | 13.20 ± 3.1 | 9.73 ± 1.3 | 8.27 ± 1.9 | 5.69 ± 1.2 | |
| As | Summer | 3.99 ± 0.6 | 3.72 ± 0.4 | 3.61 ± 0.3 | 3.66 ± 0.2 |
| Winter | 2.58 ± 0.5 | 2.36 ± 0.2 | 2.37 ± 0.3 | 2.47 ± 0.3 | |
| Pb | Summer | 3.94 ± 1.2 | 2.93 ± 0.6 | 6.89 ± 8.4 | 3.26 ± 0.6 |
| Winter | 4.24 ± 0.7 | 4.34 ± 22 | 3.08 ± 0.6 | 2.16 ± 0.9 | |
| Metal | Season | Land-Use Category | |||
|---|---|---|---|---|---|
| CA | PRA | SRA | UGA | ||
| Cr | Summer | 2.21 ± 0.5 | 2.49 ± 0.9 | 3.05 ± 1.5 | 2.61 ± 0.1 |
| Winter | 2.26 ± 0.1 | 2.81 ± 0.5 | 2.35 ± 0.2 | 1.94 ± 0.3 | |
| Mn | Summer | 0.91 ± 0.04 | 0.94 ± 0.03 | 1.00 ± 0.06 | 0.92 ± 0.03 |
| Winter | 1.02 ± 0.15 | 1.00 ± 0.04 | 0.91 ± 0.03 | 1.06 ± 0.15 | |
| Co | Summer | 1.19 ± 0.1 | 1.4 ± 0.2 | 1.33 ± 0.1 | 1.26 ± 0.08 |
| Winter | 0.81 ± 0.2 | 0.76 ± 0.3 | 0.68 ± 0.04 | 0.73 ± 0.01 | |
| Ni | Summer | 2.26 ± 0.6 | 2.38 ± 0.4 | 2.41 ± 0.3 | 2.57 ± 0.4 |
| Winter | 2.89 ± 1.7 | 2.06 ± 0.3 | 1.93 ± 0.6 | 2.50 ± 0.9 | |
| Cu | Summer | 8.00 ± 2.0 | 6.86 ± 2.3 | 7.67 ± 1.6 | 7.08 ± 1.8 |
| Winter | 15.47 ± 9.5 | 11.84 ± 4.5 | 6.83 ± 0.9 | 5.51 ± 1.5 | |
| Zn | Summer | 8.71 ± 1.7 | 13.21 ± 4.3 | 8.39 ± 0.7 | 7.84 ± 1.2 |
| Winter | 12.51 ± 2.5 | 10.22 ± 1.2 | 8.76 ± 2.3 | 5.96 ± 1.2 | |
| As | Summer | 4.93 ± 0.4 | 5.14 ± 0.2 | 4.94 ± 0.3 | 4.81 ± 0.2 |
| Winter | 2.42 ± 0.3 | 2.48 ± 0.2 | 2.47 ± 0.1 | 2.57 ± 0.1 | |
| Pb | Summer | 4.84 ± 1.5 | 4.01 ± 0.5 | 3.90 ± 0.9 | 4.27 ± 0.8 |
| Winter | 4.05 ± 0.8 | 4.93 ± 3.4 | 3.24 ± 0.7 | 2.24 ± 0.9 | |
Publisher’s Note: MDPI stays neutral with regard to jurisdictional claims in published maps and institutional affiliations. |
© 2021 by the authors. Licensee MDPI, Basel, Switzerland. This article is an open access article distributed under the terms and conditions of the Creative Commons Attribution (CC BY) license (https://creativecommons.org/licenses/by/4.0/).
Share and Cite
Kabir, M.H.; Rashid, M.H.; Wang, Q.; Wang, W.; Lu, S.; Yonemochi, S. Determination of Heavy Metal Contamination and Pollution Indices of Roadside Dust in Dhaka City, Bangladesh. Processes 2021, 9, 1732. https://doi.org/10.3390/pr9101732
Kabir MH, Rashid MH, Wang Q, Wang W, Lu S, Yonemochi S. Determination of Heavy Metal Contamination and Pollution Indices of Roadside Dust in Dhaka City, Bangladesh. Processes. 2021; 9(10):1732. https://doi.org/10.3390/pr9101732
Chicago/Turabian StyleKabir, Md Humayun, Md Harun Rashid, Qingyue Wang, Weiqian Wang, Senlin Lu, and Shinichi Yonemochi. 2021. "Determination of Heavy Metal Contamination and Pollution Indices of Roadside Dust in Dhaka City, Bangladesh" Processes 9, no. 10: 1732. https://doi.org/10.3390/pr9101732