Abstract
The Peukert and Liebenow equations were obtained from experimental studies of lead–acid batteries. Currently, they are used to evaluate capacity released by batteries of other electrochemical systems (alkaline, lithium-ion, etc.), as well. In this paper, it is experimentally proved that for lithium-ion batteries, the Peukert equation can be used in two intervals of the discharge currents. The first interval includes currents from 0.2Cn up to the first inflection point of the experimental function of the battery capacity dependence on the discharge currents C(i). The second interval covers currents from the second inflection point of the experimental function C(i) up to the maximum currents that were used in the experiments. For some lithium-ion batteries, the range of low discharge currents, where the Peukert equation is applicable, is quite large and often completely covers the range of the discharge currents used in practice for these batteries. Therefore, many authors, when estimating the capacity of lithium-ion batteries, use the Peukert equation. However, the research in this paper shows that for lithium-ion batteries, the use of the Peukert equation is limited to the two discharge current ranges indicated above. Unlike the Peukert equation, the Liebenow equation can be used only in the range of small discharge currents from zero to the first inflection point of the experimental function C(i).
1. Introduction
Currently, the lithium-ion batteries are the most intensively developing electrochemical systems. They are widely used in the form of small-format batteries, for example, for notebooks, smartphones, quadcopters, etc. [1,2]. In this sector, lithium-ion batteries have replaced the batteries of other electrochemical systems such as alkaline batteries, lead–acid ones, etc. The main advantage of lithium-ion batteries is their highly specific parameters of capacity. Recently, more and more often, lithium-ion batteries are used in the sector of large-format batteries. This is due to the deterioration of the environmental situation globally, which results in the intensive development of environmentally friendly vehicles such as various types of electric vehicles (xEV) and hydrogen powered cars [2,3,4,5].
For optimal design and control of electric vehicles, it is necessary to have reliable batteries models. First of all, the battery model must provide a reliable estimation of the battery’s state of charge (SoC), as this is a factor on which the performance of the entire system depends on.
Now, many methods are used for battery SoC evaluation. For example, open circuit voltage [6] can be used to estimate the SoC, but in a dynamic mode, when the discharge currents can change rapidly, this method (due to relaxation processes) gives an error of up to 20% [7]. Besides, this method cannot be used for lithium iron phosphate batteries because for them, a flat discharge curve is characteristic [8].
Additionally, for battery SoC evaluation improvement, battery models based on the Kalman filter are used [9,10,11,12,13]. Notwithstanding that these models give better estimates of the battery SoC than the previous method [9], however, in our experiments (under dynamic load conditions), the relative error was up to 10%.
Now, most often, battery SoC is evaluated with aid of two methods. The first method: the ampere hours for the previous discharge cycle are counted (and stored in memory) and then, the ampere hours for the current discharge cycle are subtracted from this amount. The second method is based on the voltage profile use. However, under a dynamic load, this combined method of battery SoC evaluation also has a number of disadvantages noted in the paper [1].
Accurate battery SoC estimates can only be obtained by having a reliable battery model. It should be noted that the most precise models of batteries can be built only if to take into account all the known physical and electrochemical laws describing the inner processes in batteries [14,15,16,17]. However, such electrochemical models contain a number of disadvantages of a different nature. Firstly, they are very complex and therefore for their solution, they require powerful computers not available in electric vehicles. Secondly, these models require measurements of many internal parameters of the batteries. An example would be the parameters inside of a porous electrode: they are either impossible or very difficult to measure. Thirdly, when a battery change is needed, these models require new long-term calibration [18]. That is why, in practice, these models are used very rarely.
In practice, most often, for battery operation modeling, various analytical models are used based on various empirical equations such as for example the Peukert equation or its generalizations [18,19,20,21,22]. It should be noted that the analytical models are also used as a part of sophisticated electrochemical models. This is done when some poorly understood phenomena or processes need to be taken into consideration, for example, to account for the possibility of thermal runaway in batteries [23,24,25,26] or the accumulation of hydrogen in the electrodes [27,28].
The most promising analytical model for evaluating battery SoC, in our opinion, is the Hausmann model [18]. In this model, the Peukert equation is used to calculate the released capacity at various discharge currents. However, there are currently no comprehensive investigations on the applicability of the Peukert equation for lithium-ion batteries.
Peukert’s equation is conveniently written in the following form [29]
where C(i) is battery’s discharge capacity; i is discharge current; A, n are empiric constants.
Equation (1) always has a concave dependence C(i) for n > 0, while the experimental curve C(i) for lithium-ion batteries has both concave and convex sections (Figure 1).
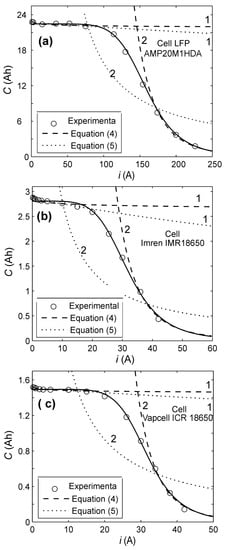
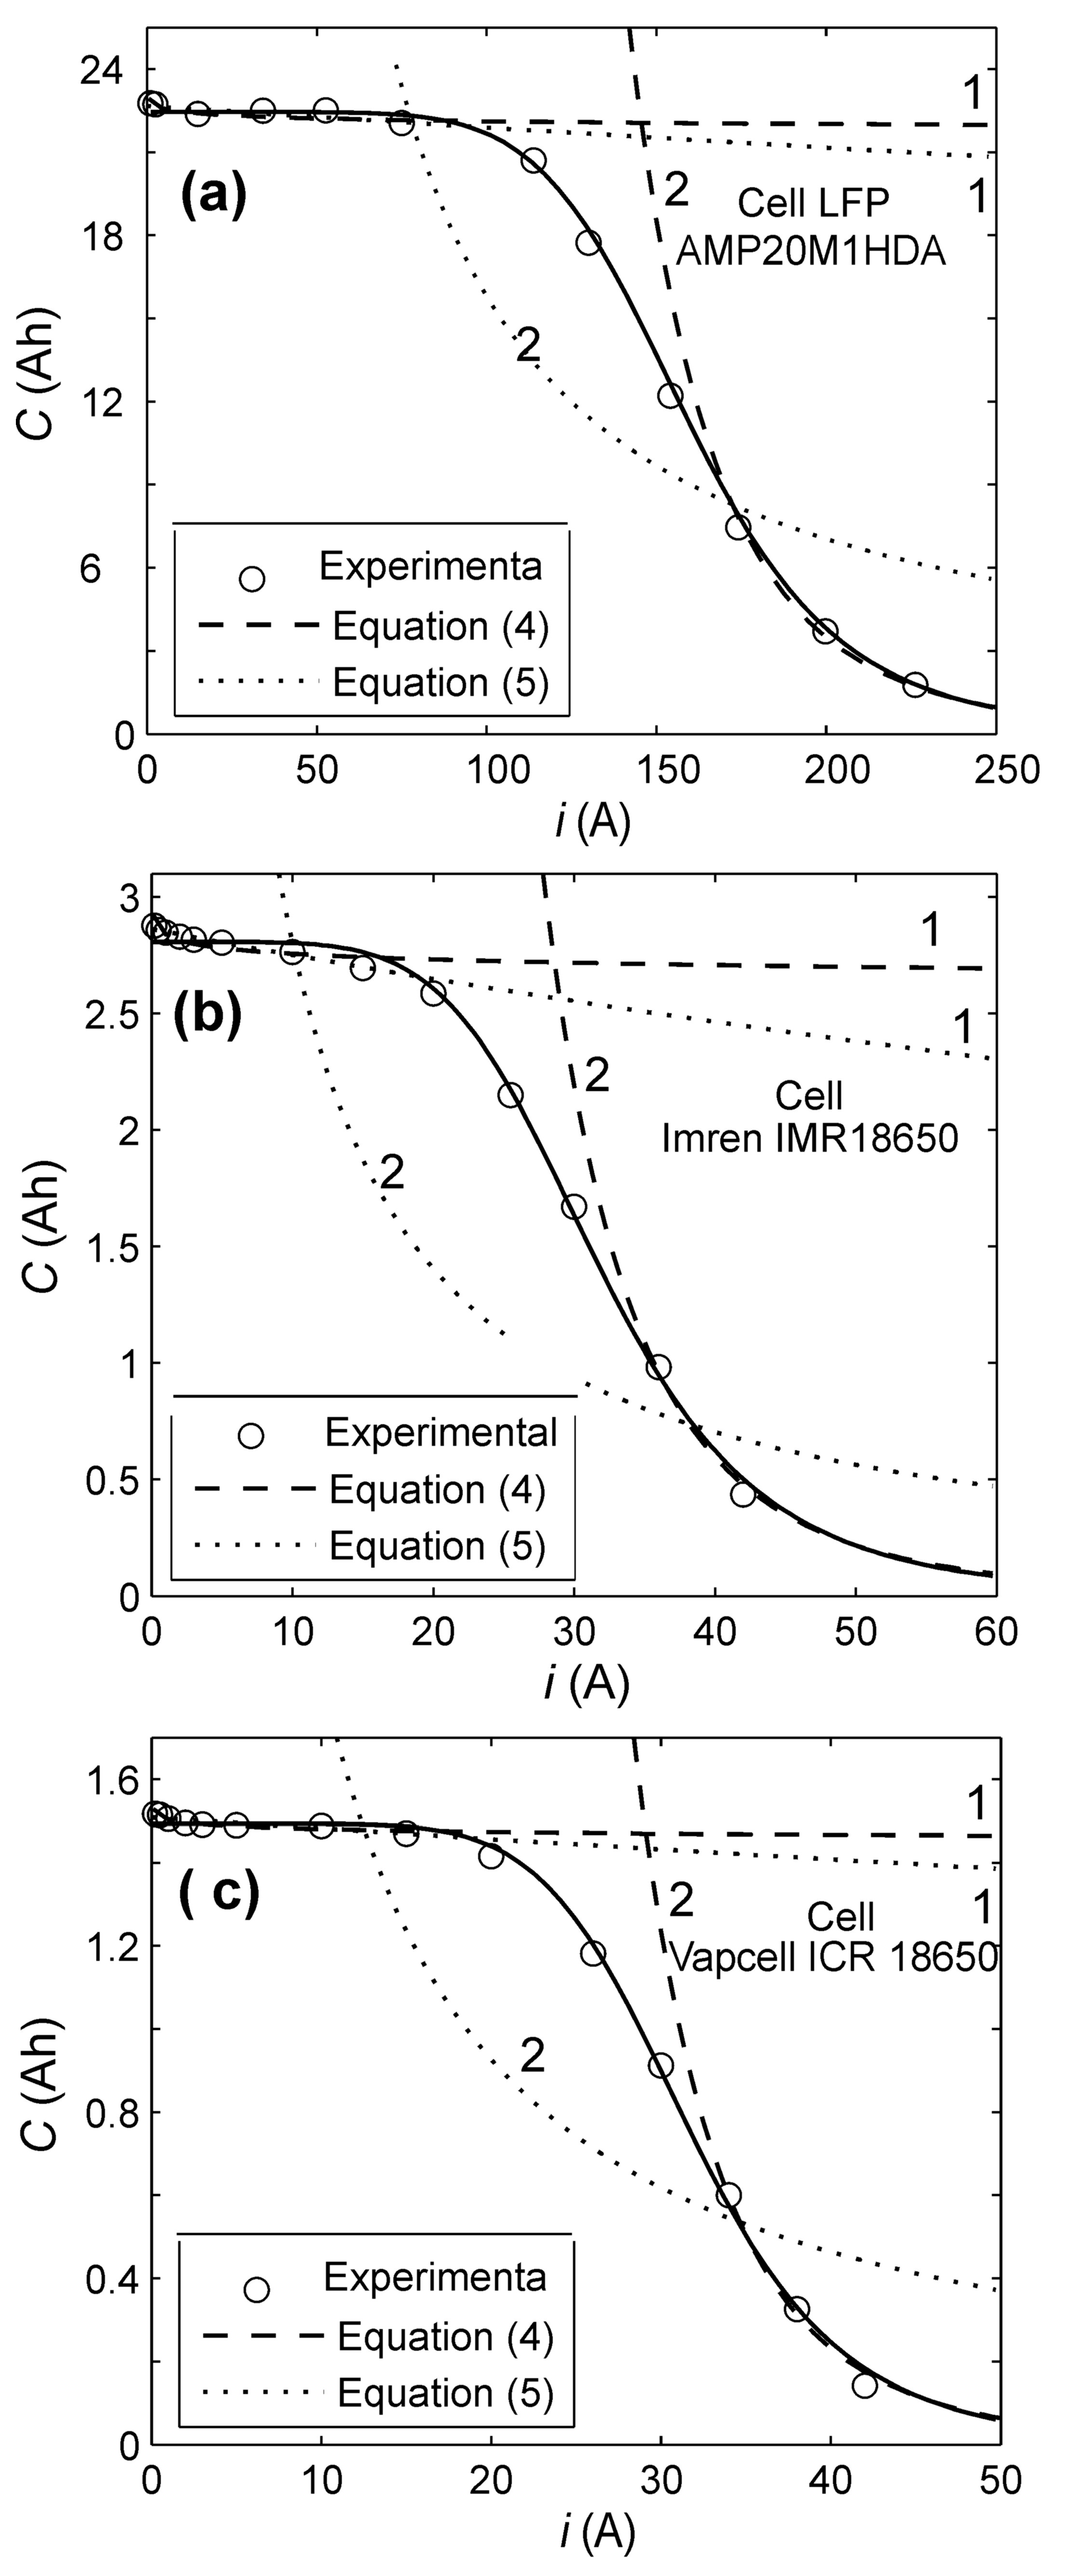
Figure 1.
Comparison between experimental data and Equations (1) and (5) for lithium-ion batteries. 1—Peukert and Liebenow equations at low discharge currents. 2—Peukert and Liebenow equations at large discharge currents. (a) Cell AMP20M1HDA. (b) Cell Imren IMR18650. (c) Cell Vapcell ICR18500.
In our previous papers [19,22], empirical equations were found that correctly describe the capacity released by lithium-ion batteries, at any discharge current.
Nevertheless, in practice, in analytical models [18,29,30], the Peukert Equation (1) is very often and successfully used. For example, using the Hausmann model [18] (which uses the Peukert equation), the residual capacity of lithium-ion batteries in electric vehicles is very accurately calculated. In the Hausmann model, the relative error in calculating the residual capacity is less than 4% for commercial automotive-grade lithium-ion batteries. There is very high accuracy in calculating the residual capacity.
On the other hand, from the form of the experimental curves (the dependence of the capacity released by the battery on the discharge current C(i) (Figure 1)), it is obvious that Peukert Equation (1) cannot describe these experimental curves at any discharge current.
What is the reason that Hausmann’s model using Peukert Equation (1) is so accurate in calculating the residual capacity of lithium-ion batteries?
This contradiction raises two problems.
Firstly, in what intervals of discharge currents doe Peukert Equation (1) accurately describe the capacity released by the battery? Practical researchers and designers need to know this in order to use Peukert Equation (1) in their models without fear of error.
Secondly, why, despite the fact that Peukert Equation (1) clearly cannot describe the function C(i) (Figure 1) at any discharge current, does the Hausmann model give such excellent results when assessing the residual capacity for commercial automotive-grade lithium-ion batteries?
This paper is devoted to the solution of these extremely important and urgent problems for practical researchers and designers of electric vehicles.
2. Theory
In the analytical models [18,19,29,30], in order to evaluate the remaining battery capacity, often the Peukert equation is used. In our opinion, among these models, the most promising one is the Hausmann model [18]. This model was developed in order to calculate the remaining capacity of batteries when they are operated in a dynamic mode, that is, when the discharge currents change rapidly. The Hausmann model [18] is as follows:
where it, Tt, Ct are the current, temperature, and remaining capacity of battery at time t; ∆t is time-step; Cm is battery top capacity; α, β, γ are empirical constants; Tref is reference temperature for the tested battery.
In the Hausmann model (2), in order to take the dynamic mode of battery discharge into account, the released capacity is calculated over a very small time interval (for example ∆t = 1 s). Then at time t, the total released capacity will be equal to the sum of the released capacities at each interval ∆t. On a small time interval ∆t, the temperature and current can be considered constant. Hence, in order to calculate the capacity dependence on the discharge current (on the interval ∆t), it is possible to use the Peukert equation or its generalizations [19] as well as any other equations found for the direct currents. Thus, the current it in the Hausmann model (2) is the same discharge current i (from the Peukert Equation (1)), but on a certain discrete interval ∆t at time t.
In the paper [19], it is shown that between the function Ieff (i,T) and the battery capacity C(i,T), there is the following dependence:
It follows from Equation (3) that in the Hausmann model [18], the capacity is determined by the equation:
Hence in the Hausmann model [18], the dependence C(i) is determined by the Peukert Equation (1) (the first multiplier of Equation (4)), while the dependence C(T) by the second multiplier of Equation (4).
Note that Peukert Equation (1) only applies when the batteries are being discharged with direct current. However, by breaking the entire dynamic discharge time of the battery into small sections (∆t = 1 s), Hausmann was able to effectively use the Peukert equation at dynamic discharge as well.
For lithium-ion batteries, the current range in which the Peukert equation can be used is not clear. That is what this paper aims to establish. In this paper, we’ll determine the ranges of discharge currents where the use of the Peukert equation is permissible.
Together with the Poikert equation, the Liebenow equation is very often used [30]:
where C(i) is battery’s discharge capacity; i is discharge current; A, n are empiric constants.
Therefore, in this article, we also investigate the areas of discharge currents where it is possible to use the Liebenow equation for lithium-ion batteries.
The Peukert and Liebenow Equations (1) and (5) were obtained when lead–acid batteries were studied [29,30]. The Peukert equation for lead–acid batteries corresponds well to the experimental data at all currents except for very small discharge currents. According to the Peukert equation, when the discharge current decreases, the released capacity of the battery tends to infinity; however, this is not possible for any battery.
On contrary, the Liebenow equation corresponds well to the experimental data at low discharge currents [30]. Thus, when describing the experimental dependence C(i) for lead–acid batteries, the Peikert and Liebenow equations complement each other quite well.
However, the experimental function C(i) for lithium-ion batteries differs significantly (Figure 1) from the relevant function obtained for lead–acid batteries. For lead–acid batteries, the experimental dependence C(i) is always concave. For lithium-ion batteries, the experimental dependence C(i) changes its convexity depending on the discharge current (Figure 1).
Nevertheless, the Peukert and Liebenow Equations (1) and (5) are now used to calculate the capacity of lithium-ion batteries as well. For example, in the Hausmann model [18]. In this paper, we will investigate in detail the possibility of using Equations (1) and (5) for lithium-ion batteries.
3. Experimental Methodology
It should be noted that lithium-ion batteries of different manufacturers, different capacities, and with different types of cathodes have qualitatively the same form of the experimental function C(i) (as shown in Figure 1). That is, for all lithium-ion batteries, the experimental function C(i) consists of three fundamentally different sections. In the first section (from zero to the first inflection point), the experimental function C(i) is concave. In the second section (from the first inflection point to the second inflection point), the experimental function C(i) is convex. In the third section (from the second inflection point to the highest values of the discharge current investigated in this article), the experimental function C(i) is concave. Therefore, to study the possibility of applying the Peukert and Liebenow Equations (1) and (5) in these three areas, one can use lithium-ion batteries of any capacity, of any manufacturer, and with any type of cathode.
In our experiments, cells were used with LiFePO4 (LFP), LiMn2O4 (IMR) and LiCoO2 (ICR) cathodes.
The lithium-ion cells were charged in the mode of constant current/constant voltage (CC/CV). The parameters of the charge mode are shown in Table 1. The discharging procedure was performed in the mode of constant current (CC). The parameters of the training charge/discharge cycles are shown in Table 1.

Table 1.
Characteristics and parameters for the training cycles of the investigated commercial lithium-ion cells.
In the investigation discharge cycles, the discharge currents were used in the range from 0.2Cn to the current at which the released capacity is approximately equal to C ≈ Cn/10.
For cell cycling, a ZENNIUM electrochemical workstation with a PP241 potentiostat (ZAHNER-elektrik GmbH & Co. KG, Kronach, Germany) was used (accuracy: voltage ΔU = ±(0.1% of reading), current ΔI = ±(0.25% of reading)). Additionally, when discharging AMP20M1HDA cells at high currents, an electronic load (custom made) with a maximum input current of 430 A was used (accuracy: current ΔI = ± (0.25% of reading)). The electronic load was connected to the ZENNIUM workstation using an analog-to-digital converter (based on MAX1272 from Maxim Integrated).
The temperature of the cells was measured using an LM35 temperature sensor fixed to the side of the cells (accuracy ΔT = ±0.2% of reading (°C)).
The experiments were conducted according to the following algorithm.
At first, at least 10 training cycles were performed in order to stabilize the layer SEI. The training cycles were stopped, when in three consecutive cycles, the difference in the released capacity was less than 5%. The training cycles were performed in concordance with the parameters presented in Table 1.
The cell capacity was calculated as the average value of three measurements at each discharge current. This method allowed us to reduce the statistical spread and get more accurate values of the capacity. However, for each measurement, the capacity should differ by less than 5%. Otherwise, additional training cycles were performed or another, more stable cell was used.
Before each measurement, 3 to 5 training cycles were performed in order to exclude the influence of previous charge/discharge cycles on this measurement.
For reducing random variation of the cell parameters associated with the cell manufacturing process and/or with the terms and conditions of its storage, we standardized all the measured capacity values by their maximum capacity Cm. Moreover, the maximum capacity Cm for each cell was found by experiments. This method allowed us to construct the empirical curves more reliably as the noted above random factors were largely excluded.
To reduce the influence of temperature on measured cell capacity, all measurements were carried out inside a thermal chamber Binder MK240 (BINDER GmbH, Germany) at a temperature of T = 25 °C. For increasing heat dissipation from the cells, with the aid of a thermal paste and specially made clamps, modified radiators were attached to the cells; usually, such radiators are used for processor cooling in computers. In addition, in our preliminary experiments, we found that in the temperature range of 25 °C to 50 °C, the temperature influence on measured cell capacity is negligible.
4. Results and Discussion
At low discharge currents, the function C(i) is concave. At medium discharge currents, the function C(i) is convex. At large currents, the experimental dependence C(i) is concave again (Figure 1).
The curves corresponding to Equations (1) and (5) are always concave. Therefore, only in those intervals of the discharge currents where the experimental dependence C(i) is concave (Figure 1), it is possible to use the Peukert (1) and Liebenow (5) equations. According to (Figure 1), the first interval of the currents, where the dependence C(i) is concave, is the interval from zero to the first inflection point of the experimental dependence C(i).
The second interval of the currents, where the function C(i) is concave, is the interval from the second inflection point of the experimental curve of the function C(i) to infinity (Figure 1).
Therefore, it is only in these ranges of discharge currents that we compare the Peukert (1) and Liebenow (5) equations with the experimental values (Figure 1). According to the Peukert equation, at very low discharge currents, the released capacity of the battery tends to infinity; however, this is not possible for any battery.
Therefore, for Peukert Equation (1), at low discharge currents, our experimental studies were carried out in the range from 0.2Cn up to the first inflection point of the experimental curve C(i) (Figure 1). The size of this range depends on the cell design, the type of electrodes used, their capacity, and so on.
The results of studying of the applicability of the Equations (1) and (5) in the low current range are presented in Table 2.
Table 2.
Optimal parameters of Equations (1) and (5) in the range from 0.2Cn to the first inflection point of the experimental curve C(i) (Figure 1).
The results of studying of the applicability of Equations (1) and (5) in the range of large discharge currents are presented in Table 3.
Table 3.
Optimal parameters of Equations (1) and (5) in the range of discharge currents from the second inflection point of the experimental curve C(i) (Figure 1) to maximum currents.
According to our studies (Table 2 and Table 3), in these ranges of the discharge currents, the Peukert Equation (1) corresponds well to the experimental data. In the first interval of the discharge currents, the relative error of the experimental data approximation by Equation (1) is less than 1% (Table 2); and in the second interval, it is less than 6.54% (Table 3). Thus, for practical purposes in these intervals of the discharge currents, as a part of analytical models, Peukert Equation (1) can be used effectively.
However, it should be noted that the lithium-ion batteries discharged at large currents (for example, commercial automotive-grade lithium batteries) have a very wide first range of discharge currents where the Peukert Equation is true (Table 2). In these batteries, usually all operating discharge currents fall into the first range of discharge currents. That is why for these lithium-ion batteries, many authors [18] use the Peukert Equation successfully in their analytical models so as to estimate the remaining battery capacity.
However, our studies show that the Peukert Equation can be applicable to lithium-ion batteries not at any discharge current. It is applicable only in the above mentioned two discharge current intervals.
In general, it should be noted that if the cells have protection, they work only in the range of discharge currents from zero to the first inflection point of the experimental curve C(i) (Figure 1). For example, the battery protection of Eizfan IMR21700 (Yi Fang Technology Co., Ltd., Shenzhen, China), Imren IMR18650 (IMR Technology Co., Ltd, Shenzhen, China), Vapcell ICR18500 (Vapcell Technology Co., Ltd., Shenzhen, China) is set to a current of 12 A. Let’s compare this current with the current imax ≈ 15 A (maximum current for the interval from 0.2Cn to the first inflection point of the experimental curve C(i) (Table 2)). It is immediately clear that the battery operates at currents from the first interval of the discharge current.
However, in the absence of protection of batteries and with a dynamic load, the discharge currents can go out of the first interval of discharge currents. This is especially important for commercial automotive-grade lithium-ion batteries.
Therefore, in order to reliably use the Hausmann model (2), it is necessary either to limit the discharge currents (so that they do not go beyond the limit of the first interval of the discharge currents) or use generalized Peukert Equations that are valid for any discharge current [19,22].
Mathematically, it is not difficult to find the first inflection point strictly, since at any inflection point the second derivative of the experimental function C(i) is zero, i.e.
Thus, using the correlation splines as a regression function and approximating the experimental points with this function, we will find a smooth experimental function C(i). Then, by requiring the fulfillment of Condition (6), one can find both the first and second inflection points. This can be done within the framework of any computer mathematical program.
However, in practice, the first interval of discharge currents (where Peukert’s Equation (1) is valid) is determined much easier. First, experimental points are approximated with the Peukert equation on a small initial section and the approximation error is calculated. Then, the experimental points are gradually added at high discharge currents and the approximation errors are calculated. The process of adding experimental points stops when the approximation error increases by about 5–7% relative to the minimum approximation error. The last added experimental point determines the maximum current of the first interval of discharge currents. This simple method makes it possible to find the first interval of discharge currents in which the relative error approximating the experimental data by Peukert Equation (1) is less than 2%. This is enough for any practical calculations using Peukert Equation (1). In particular, this is sufficient for calculating the residual battery capacities in the Hausmann model (2).
Liebenow Equation (5) corresponds well to the experimental data in the range of low discharge currents (Figure 1, Curves 1, and Table 2) for both lithium-ion batteries and lead–acid batteries. The relative error of the experimental data approximation by Equation (5) is less than 1% (Table 2). However, in the range of the large discharge currents, where the experimental function C(i) is concave, Liebenow Equation (5) does not correspond well to the experimental data (Figure 1, Curves 2, and Table 3). The relative error of the experimental data approximation by Equation (5) is more than 23% (Table 3).
In conclusion, it would be very helpful to link the empirical parameters of the Peukert and Liebenow Equations (1) and (5) to battery parameters. From Liebenow Equation (5), we obtain:
Thus, in Liebenow Equation (5), the empirical constant A is equal to the maximum battery capacity Cm, and the empirical constant n determines the rate of decrease in the battery capacity at current i = 0.
According to the studies, Peukert Equation (1) can be used in the range from the current i0 being equal to 0.2Cn (at which Equation (1) begins to correspond to the experimental data) to the first inflection point of the experimental function C(i). In this case, for empirical constants, we obtain the equations:
Thus, in Peukert Equation (1), the empirical constant A is also determined by the maximum capacity of the battery C(i0) within the range of discharge currents acceptable for Peukert Equation (1), and the empirical constant n determines the rate of decrease in the capacity dC(i0)/di0 at the minimum allowable current discharge i0.
5. Conclusions
The conducted studies demonstrated that (for lithium-ion cells of various manufacturers, capacities, and electrochemical systems) Peukert equation (1) can be used in two intervals of discharge currents, where the experimental curve of cell capacity dependence on the discharge current C(i) is concave. The first interval includes currents from 0.2Cn to the first inflection point of the curve C(i) (Figure 1). The second interval includes currents from the second inflection point of the experimental curve C(i) to infinity.
The Liebenow Equation (5) can be used only for small discharge currents in ranges from zero to the first inflection point of the experimental curve C(i) (Figure 1).
Author Contributions
Conceptualization, N.E.G.; methodology, N.N.Y.; software, D.V.R.; validation, N.N.Y.; formal analysis, D.V.R.; data curation, D.N.G.; visualization, N.N.Y.; supervision, D.N.G.; project administration, D.N.G. All authors have read and agreed to the published version of the manuscript.
Funding
This research received no external funding.
Institutional Review Board Statement
Not applicable.
Informed Consent Statement
Not applicable.
Data Availability Statement
Not applicable.
Conflicts of Interest
The authors declare no conflict of interest.
References
- Blomgren, G.E. The Development and Future of Lithium Ion Batteries. J. Electrochem. Soc. 2017, 164, A5019–A5025. [Google Scholar] [CrossRef] [Green Version]
- Zubi, G.; Dufo-López, R.; Carvalho, M.; Pasaoglu, G. The lithium-ion battery: State of the art and future perspectives. Renew. Sustain. Energy Rev. 2018, 89, 292–308. [Google Scholar] [CrossRef]
- Kim, S.U.; Albertus, P.; Cook, D.; Monroe, C.W.; Christensen, J. Thermoelectrochemical simulations of performance and abuse in 50-Ah automotive cells. J. Power Sources 2014, 268, 625–633. [Google Scholar] [CrossRef]
- Axsen, J.; Kurani, K.S.; Burke, A. Are batteries ready for plug-in hybrid buyers? J. Transp. Policy 2008, 7, 173–182. [Google Scholar] [CrossRef] [Green Version]
- Van den Bossche, P.; Vergels, F.; van Mierlo, J.; Matheys, J.; van Autenboer, W. SUBAT: An assessment of sustainable battery technology. J. Power Sources 2006, 162, 913–919. [Google Scholar] [CrossRef]
- Coleman, M.; Lee, C.K.; Zhu, C.; Hurley, W.G. State-of-charge determination from EMF voltage estimation: Using impedance, terminal voltage, and current for lead-acid and lithium-ion batteries. IEEE Trans. Ind. Electron. 2007, 54, 2550–2557. [Google Scholar] [CrossRef]
- Rakhmatov, D.; Vrudhula, S.; Wallach, D.A. A model for battery lifetime analysis for organizing applications on a pocket computer. IEEE Trans. Very Large Scale Integr. Syst. 2003, 11, 1019–1030. [Google Scholar] [CrossRef]
- Omar, N.; Daowd, M.; Van den Bossche, P.; Hegazy, O.; Smekens, J.; Coosemans, T.; van Mierlo, J. Rechargeable energy storage systems for plug-in hybrid electric vehicles—Assessment of electrical characteristics. Energies 2012, 5, 2952–2988. [Google Scholar] [CrossRef] [Green Version]
- He, W.; Williard, N.; Chen, C.; Pecht, M. State of charge estimation for electric vehicles batteries using unscented Kalman filtering. Microelectron. Reliab. 2013, 53, 840–847. [Google Scholar] [CrossRef]
- Han, J.; Kim, D.; Sunwoo, M. State-of-charge estimation of lead-acid batteries using an adaptive extended Kalman filter. J. Power Sources 2009, 188, 606–612. [Google Scholar] [CrossRef]
- He, H.; Zhang, X.; Xiong, R.; Xu, Y.; Guo, H. Online model-based estimation of state-of-charge and open-circuit voltage of lithium-ion batteries in electric vehicles. Energy 2012, 39, 310–318. [Google Scholar] [CrossRef]
- He, Y.; Liu, X.T.; Zhang, C.B.; Chen, Z.H. A new model for State-of-Charge (SOC) estimation for high-power Li-ion batteries. Appl. Energy 2013, 101, 808–814. [Google Scholar] [CrossRef]
- Buchmann, I. Batteries in a Portable World; Cadex Electronics Inc.: Richmond, BC, Canada, 2016. [Google Scholar]
- Fan, G.; Pan, K.; Canova, M.; Marcicki, J.; Yang, X.G. Modeling of Li-Ion cells for fast simulation of high C-rate and low temperature operations. J. Electrochem. Soc. 2016, 163, A666–A676. [Google Scholar] [CrossRef]
- Doyle, M.; Fuller, T.F.; Newman, J. Modeling of galvanostatic charge and discharge of the lithium/polymer/insertion cell. J. Electrochem. Soc. 1993, 140, 1526–1533. [Google Scholar] [CrossRef]
- Arunachalam, H.; Onori, S.; Battiato, I. On Veracity of Macroscopic Lithium-Ion Battery Models. J. Electrochem. Soc. 2015, 162, A1940–A1951. [Google Scholar] [CrossRef]
- Cugnet, M.; Laruelle, S.; Grugeon, S.; Sahut, B.; Sabatier, J.; Tarascon, J.-M.; Oustaloup, A. A mathematical model for the simulation of new and aged automotive lead-acid batteries. J. Electrochem. Soc. 2009, 156, A974–A985. [Google Scholar] [CrossRef]
- Hausmann, A.; Depcik, C. Expanding the Peukert equation for battery capacity modeling through inclusion of a temperature dependency. J. Power Sources 2013, 235, 148–158. [Google Scholar] [CrossRef]
- Galushkin, N.E.; Yazvinskaya, N.N.; Galushkin, D.N. Generalized analytical model for capacity evaluation of automotive-grade lithium batteries. J. Electrochem. Soc. 2015, 162, A308–A314. [Google Scholar] [CrossRef]
- Tremblay, O.; Dessaint, L.A. Experimental validation of a battery dynamic model for EV applications. World Electr. Veh. J. 2009, 3, 289–298. [Google Scholar] [CrossRef] [Green Version]
- Galushkin, N.E.; Yazvinskaya, N.N.; Galushkin, D.N. A Critical Review of Using the Peukert Equation and its Generalizations for Lithium-Ion Cells. J. Electrochem. Soc. 2020, 167, 120516. [Google Scholar] [CrossRef]
- Galushkin, N.E.; Yazvinskaya, N.N.; Galushkin, D.N. Analysis of generalized Peukert’s equations for capacity calculation of lithium-ion cells. J. Electrochem. Soc. 2020, 167, 013535. [Google Scholar] [CrossRef]
- Galushkin, N.E.; Yazvinskaya, N.N.; Galushkin, D.N. Thermal runaway as a new high-performance method of desorption of hydrogen from hydrides. Int. J. Hydrogen Energy 2016, 41, 14813–14819. [Google Scholar] [CrossRef]
- Galushkin, N.E.; Yazvinskaya, N.N.; Galushkin, D.N. Thermal Runaway in Sealed Alkaline Batteries. Int. J. Electrochem. Sci. 2014, 9, 3022–3028. [Google Scholar]
- Galushkin, N.E.; Yazvinskaya, N.N.; Galushkin, D.N. Mechanism of thermal runaway as a cause of Fleischmann-Pons effect. J. Electroanal. Chem. 2020, 870, 114237. [Google Scholar] [CrossRef]
- Galushkin, N.E.; Yazvinskaya, N.N.; Galushkin, D.N. Analytical model of thermal runaway in alkaline batteries. Int. J. Electrochem. Sci. 2018, 13, 1275–1282. [Google Scholar] [CrossRef]
- Galushkin, N.E.; Yazvinskaya, N.N.; Galushkin, D.N. Pocket electrodes as hydrogen storage units of high-capacity. J. Electrochem. Soc. 2017, 164, A2555–A2558. [Google Scholar] [CrossRef] [Green Version]
- Galushkin, N.E.; Yazvinskaya, N.N.; Galushkin, D.N.; Galushkina, I.A. Oxide-nickel electrodes as hydrogen storage units of high-capacity. Int. J. Hydrogen Energy 2014, 39, 18962–18965. [Google Scholar] [CrossRef]
- Wenzl, H. Capacity. In Encyclopedia of Electrochemical Power Sources; Garche, J., Ed.; Elsevier: Amsterdam, The Netherlands, 2009; Volume 1, pp. 395–400. [Google Scholar]
- Compagnone, N.F. A new equation for the limiting capacity of the lead/acid cell. J. Power Sources 1991, 35, 97–111. [Google Scholar] [CrossRef]
Publisher’s Note: MDPI stays neutral with regard to jurisdictional claims in published maps and institutional affiliations. |
© 2021 by the authors. Licensee MDPI, Basel, Switzerland. This article is an open access article distributed under the terms and conditions of the Creative Commons Attribution (CC BY) license (https://creativecommons.org/licenses/by/4.0/).