Article

Study on Photocatalytic Desulfurization and Denitrification Performance of Cu- and Cr-Modified MWCNT

1
College of Petroleum Engineering, Liaoning Petrochemical University, Fushun 113000, China
2
Yandtze Delta Region Institute, Tsinghua University-Zhejiang, Jiaxing 314000, China
*
Authors to whom correspondence should be addressed.
Processes 2021, 9(10), 1823; https://doi.org/10.3390/pr9101823
Submission received: 13 September 2021 / Revised: 11 October 2021 / Accepted: 11 October 2021 / Published: 14 October 2021

Abstract

:
Carbon nanotubes are a promising adsorbent for desulfurization and denitrification. In this paper, Cu- and Cr-doped TiO2 supported by multi-walled carbon nanotubes (MWCNTs/Cu-Cr-TiO2) were synthesized by the sol-gel method. Characterizations of the samples were performed by TEM, XPS, XRD, DRS, and BET. The experiments of simultaneous desulfurization and denitrification were conducted in a fixed-bed reactor. The results showed that the adsorbent with a Cu to Cr molar ratio of 3 displays excellent adsorption property. The SO2 and NO adsorption capacity of MWCNTs/Cu-Cr-TiO2 (Cu/Cr = 3) were 36.83 and 12.34 mg/g under the optimal experimental operating parameters (SO2 content: 1575 mg/m3, NO content 736 mg/m3, O2 content 8%, H2O content 5%, and space velocity 1003 h−1). The adsorption capacity of MWCNTs/Cu-Cr-TiO2 was significantly better than that of the adsorbent doped with Cu or Cr alone (MWCNTs/Cu-TiO2 and MWCNTs/Cr-TiO2). Compared with single metal doping, bimetallic multivalent states accelerate the electron migration and separation from holes, which increase the number of oxygen vacancies and enhance the adsorption of SO2 and NO. The kinetic models and the reaction mechanism of the desulfurization and denitrification were also analyzed in this work.

1. Introduction

The increase of SO2 and NO in the atmosphere leads to air pollution, which is dangerous to human health and the environment. It is necessary to reduce the emission of NO and SO2 from industrial flue gas [1]. Desulfurization and denitrification are independent in most industrial applications, in which NO is removed by selective catalytic reduction (SCR) or selective non-catalytic reduction (SNCR) located at the entrance of the electrostatic precipitator [2]. Wet flue gas desulfurization (WFGD) systems were used for removing SO2, which is downstream to the denitrification equipment [3]. There are some disadvantages of the separate desulfurization and denitrification, such as large occupied area, expensive investments, and operating costs [4]. Therefore, more attention should be paid to the simultaneous desulphurization and denitrification.
Adsorptive removal was regarded as a promising method for simultaneous desulfurization and denitrification [5]. Activated carbon (AC), molecular sieves [6], and carbon nanotube (CNT) were usually used as adsorbents due to their large specific surface area and low cost. Carbon nanotubes have attracted more attention in the last decade due to their excellent surface structure and higher adsorption capacity [7]. The adsorption of CO2 [8], NOx [9], SO2 [10], H2S [11], CH4 [12], VOCs [13], and dyes [14] on CNTs have been extensively researched in recent years.
The surface of the carbon nanotube could be modified to facilitate the loading of catalyst, which can promote the catalytic oxidation reaction and improve the adsorption capacity [15]. TiO2 is a non-toxic catalyst with high catalytic ability and chemical stability [16]. TiO2 was researched widely as a photocatalyst in recent years, but limited due to low efficiency and a narrow light response range [17]. Thus, more research combined TiO2 and carbon nanotubes to enhance catalytic activity while removing harmful gases or chemicals [18]. Carbon nanotubes are used as a carrier of TiO2 and a container to store electrons generated by ultraviolet irradiation of TiO2 [19]. Moreover, carbon nanotubes reduce the agglomeration tendency of TiO2 what improves efficiency of catalytic oxidation [20].
Carbon nanotubes loaded with TiO2 and doped with metal(s) improved the adsorption property of such materials. Some studies were carried out using metal doped CNT/TiO2 for wastewater treatment [21]. Wang et al. [22] introduced metal Au on CNT-TiO2, which showed higher activity and adsorption capacity than CNT-TiO2 to degrade methylene blue in water. In the study of Zhang et al. [23], Ag-doped CNT/TiO2 showed a good catalytic degradation efficiency (76%) for methylene blue illuminated with visible light. Shaari et al. [24] eliminated 94% of phenol from phenol solution using CNT/TiO2 doped with Ce. Chen et al. [25] prepared a CNT/TiO2 composite with Ni for photocatalytic degradation of methylene blue, methyl orange, and rhodamine, with the degradation efficiency of 94%, 87.5%, and 87.5%, respectively.
In recent years, metal doped carbon nanotubes loaded with TiO2 were also used for flue gas desulfurization and denitrification. Liu et al. [26] investigated the adsorption of SO2 and NO on Cu-doped Multi-Walled Carbon Nanotubes/TiO2 (MWCNTs/TiO2), with the removal efficiency of 62% and 43%, respectively. Bao et al. [27] prepared MWCNTs/TiO2 doped with Mn to remove SO2, which showed a good desulfurization efficiency (66%). Yang et al. [28] synthesized Cr-doped MWCNTs/TiO2 for SO2 removal; the results showed that Cr-doped MWCNTs/TiO2 displayed a better adsorption property than MWCNTs/TiO2.
In summary, investigations of the metal-doped CNT/TiO2 were primarily concerned on wastewater treatment, less for the removal of SO2 and NO. Previous research on desulfurization and denitrification with the metal-doped CNT/TiO2 was all focused on single metal doped, and not about doped with two metals. Therefore, in this paper MWCNTs/Cu-Cr-TiO2 were synthesized at four different molar ratios of Cu to Cr (1, 2, 3, 4). MWCNTs/Cu-TiO2 and MWCNTs/Cr-TiO2 were also prepared. Samples were characterzed by TEM, XPS, XRD, DRS, and BET analyses. The measurements were conducted in a fixed-bed reactor. The influences of doped metal, O2, H2O composition and space velocity on simultaneous desulfurization and denitrification were discussed. Finally, the kinetic models for the desulfurization and denitrification were studied, and the reaction mechanism of MWCNTs/Cu-Cr-TiO2 for SO2 removal and NO was also analyzed.

2. Experimental Section

2.1. Materials

Chemicals used in the experiments including C16H36O4Ti, anhydrous ethanol, Cu(NO3)2, Cr(NO3)3, HNO3 and H2SO4, which were supplied by Sinopharm Chemical Reagent Company. Raw MWCNTs with the purity of 95%, 10–15 nm in diameter, and 10–30 nm in length, were purchased from Chengdu Organic Chemicals Company.

2.2. Preparation of the Samples

MWCNTs/Cu-Cr-TiO2 with molar ratios of Cu to Cr of 1, 2, 3, and 4 were synthesized by the conventional sol-gel method, the total content of Cu and Cr was maintained at 10 mol%. For comparative experiments, 10% MWCNTs/Cu-TiO2 and 10% MWCNTs/Cr-TiO2 were also prepared.
It was necessary to acidify the raw MWCNTs before synthesis. Firstly, the raw MWCNTs were immersed in a mixture of H2SO4 and HNO3 of 3:1 (v/v) [29] and then sonicated well for 30 min. After that, the acid treated MWCNTs were rinsed with distilled water until the pH of the filtrate was 6–7. Finally, the products were dried at 80 °C in a drying oven, and then placed in a desiccator for the next study or use. The preparation procedures of MWCNTs/Cu-Cr-TiO2 were as follows: 0.86 g of acid treated MWCNTs were sonicated in a solution containing 75 mL anhydrous ethanol, 25 mL C16H36O4Ti, and 4 mL HNO3 (6 mol/L). To the mixture we added a solution containing 25 mL anhydrous ethanol, 5 mL distilled water, and a certain amount of Cu(NO3)2 and Cr(NO3)3 (the pH was adjusted to about 2 by adding HNO3) under stirring. The gel obtained was left for 2 h, and dried for 24 h at 80 °C. Finally, samples were calcined for 3 h at 500 °C. Before the adsorption experiment, the prepared samples were collected and kept in sealing bags.

2.3. Sample Analysis

The prepared samples were characterized by transmission electron microscope (TEM) performed by JEM-2100F (120 kV). X-ray photoelectron spectroscopy (XPS) analysis were conducted by PHI Quanterall to obtain the chemical composition of samples. X-ray diffraction (XRD) were used to characterize the crystal phase of samples. The XRD patterns were recorded in a D/max-2500/PC X-ray diffractometer with Cu Kα radiation from 5° to 85° (2θ) at a scanning speed of 0.02 s−1. The UV-Vis diffuse reflectance spectra (DRS) of MWCNTs/Cu-Cr-TiO2 materials were measured on the Agilent Cary 5000. The Brunauer–Emmett–Teller (BET) surface area of adsorbents were analyzed with Autosorb-IQ2-MP.

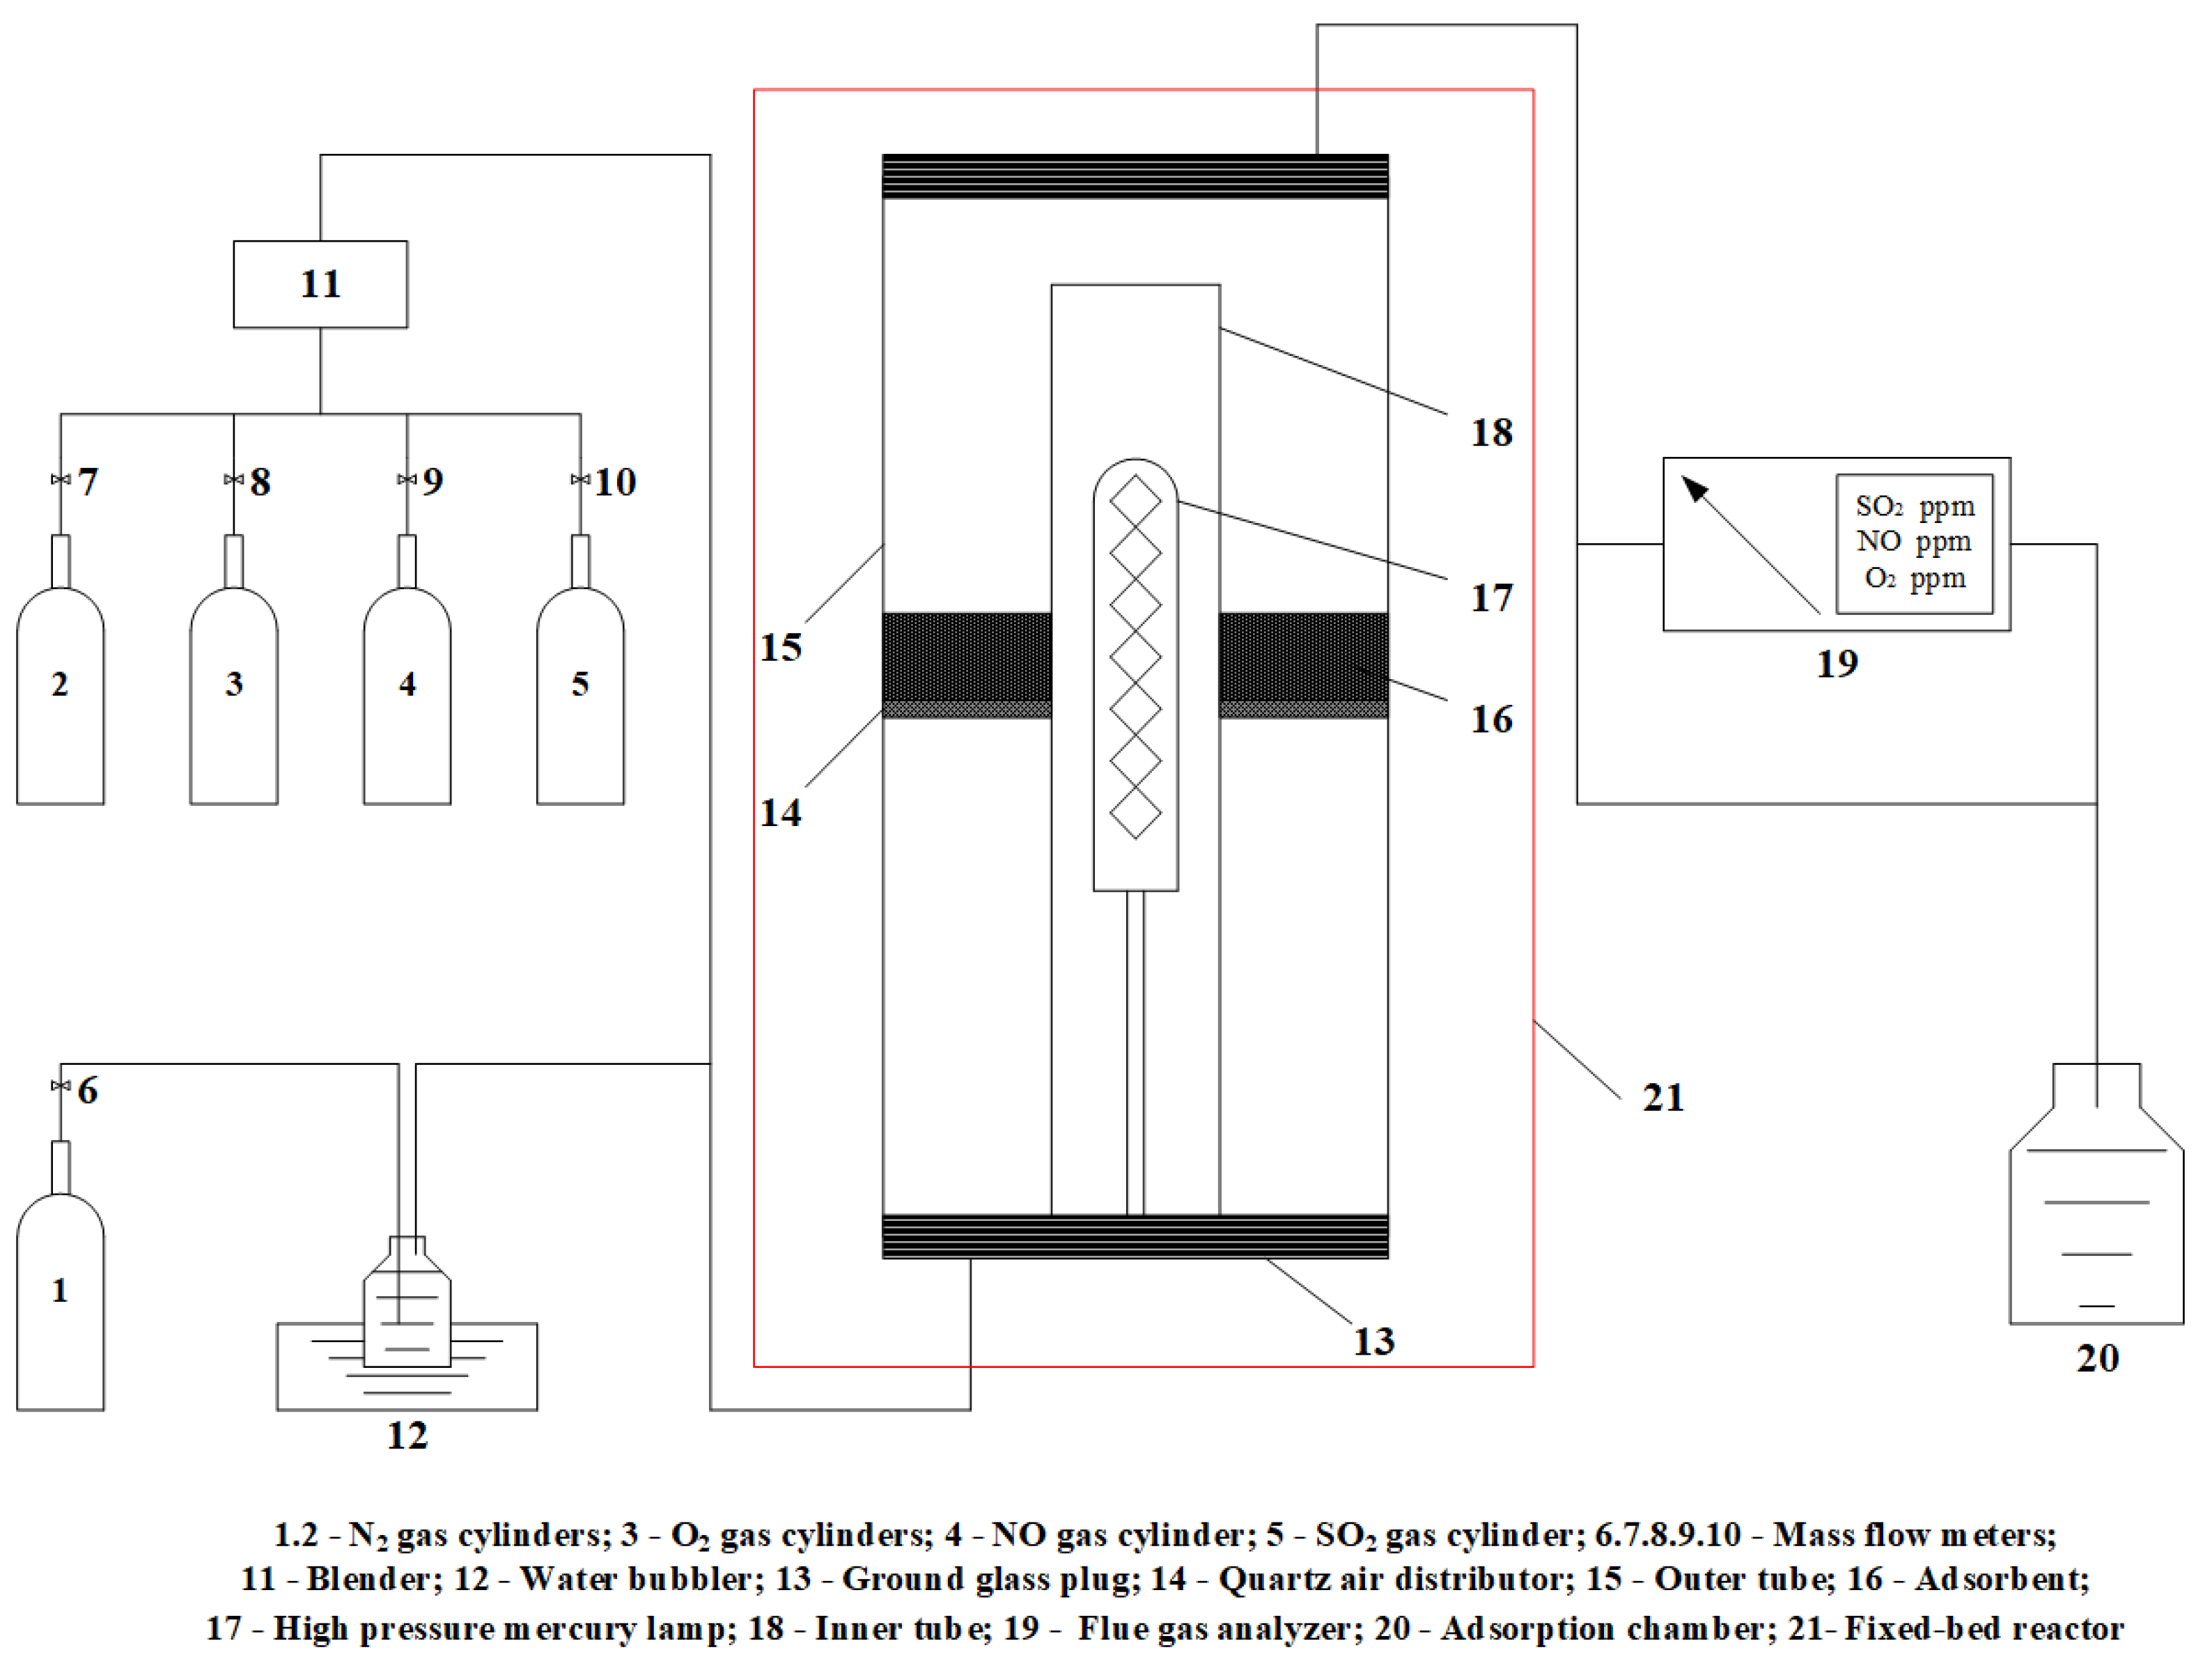
2.4. Experimental System

The experimental system includes the simulated flue gas system, the fixed-bed reactor and the flue gas analysis system. The schematic of the experimental system is shown in Figure 1.
The O2, NO, SO2, and N2 in the simulated flue gas were supplied by gas cylinders (Dalian Special Gas Company, China), and the flow rates were adjusted by mass flowmeters (CS200-A) supplied by the Sevenstar Flow Company. H2O was produced by a water bubbler and brought into the fixed-bed reactor by N2. The total flow rate of the simulated flue gas was maintained at 1 L/min during all the measurements.
The fixed-bed reactor was double concentric quartz tubes (60 cm length, 2.2 cm internal diameter, and 5.5 cm external diameter). A high-pressure mercury lamp of 125 W purchased from Shanghai Jiguang Lighting Company was placed inside vertically, with the wavelength of 365 nm. An annular quartz air distributor with circular ventilation holes was placed 30 cm below the bottom of the fixed-bed reactor. During all the measurements, the fixed-bed reactor was located in a black box to avoid the interference of sunlight.
A flue gas analyzer (Gasboard-300, Hubei Ruiyi Automatic Control System Company, China) was used to record concentrations of NO and SO2 in real-time, which was connected to the outlet of the fixed-bed reactor.
The experimental procedure was as follows: firstly, the adsorbent was evenly distributed on the annular quartz air distributor. Then, N2 was separately introduced to check the airtightness of whole experimental apparatus. The high-pressure mercury lamp was pre-lighted for 5 min. After completing the above preparations, the gas supply system was unfolded. After the composition of flue gas showed by gas analyzer was stabilized, the outlet and inlet valves of the fixed bed reactor were successively switched on to perform simultaneous flue gas desulfurization and denitrification experiments. The flue gas analyzer was used to analyze and record the gas composition in real-time until the end of the experiment. After completing a set of measurement, adjust to the next experimental parameters and repeat the above steps.
In this work, the concentration of SO2 and NO in the simulated flue gas were 1575 mg/m3 and 736 mg/m3, respectively. As shown in Table 1, six different experiments were performed denominated from Case 1 to Case 6. Case 1 was conducted to determine the optimal molar ratio of Cu to Cr on the removal of SO2 and NO. The effects of O2 concentration, H2O content, and space velocity were determined experimentally from Cases 2 to 4. Case 5 and Case 6 were carried out as comparative experiments. All experiments were performed at room temperature. Finally, the circularity tests of MWCNTs/Cu-Cr-TiO2 (Cu/Cr = 3) were also performed in this work. At the end of the adsorption experiment, the saturated MWCNTs/Cu-Cr-TiO2 (Cu/Cr = 3) was placed in the microwave heater for desorption treatment. After heating for 30 min, the adsorbent was weighed every 5 min until the mass remained unchanged three consecutive times. The adsorbent after desorption was put in the fix-bed reactor to repeat the adsorption experiment.

3. Results and Discussion

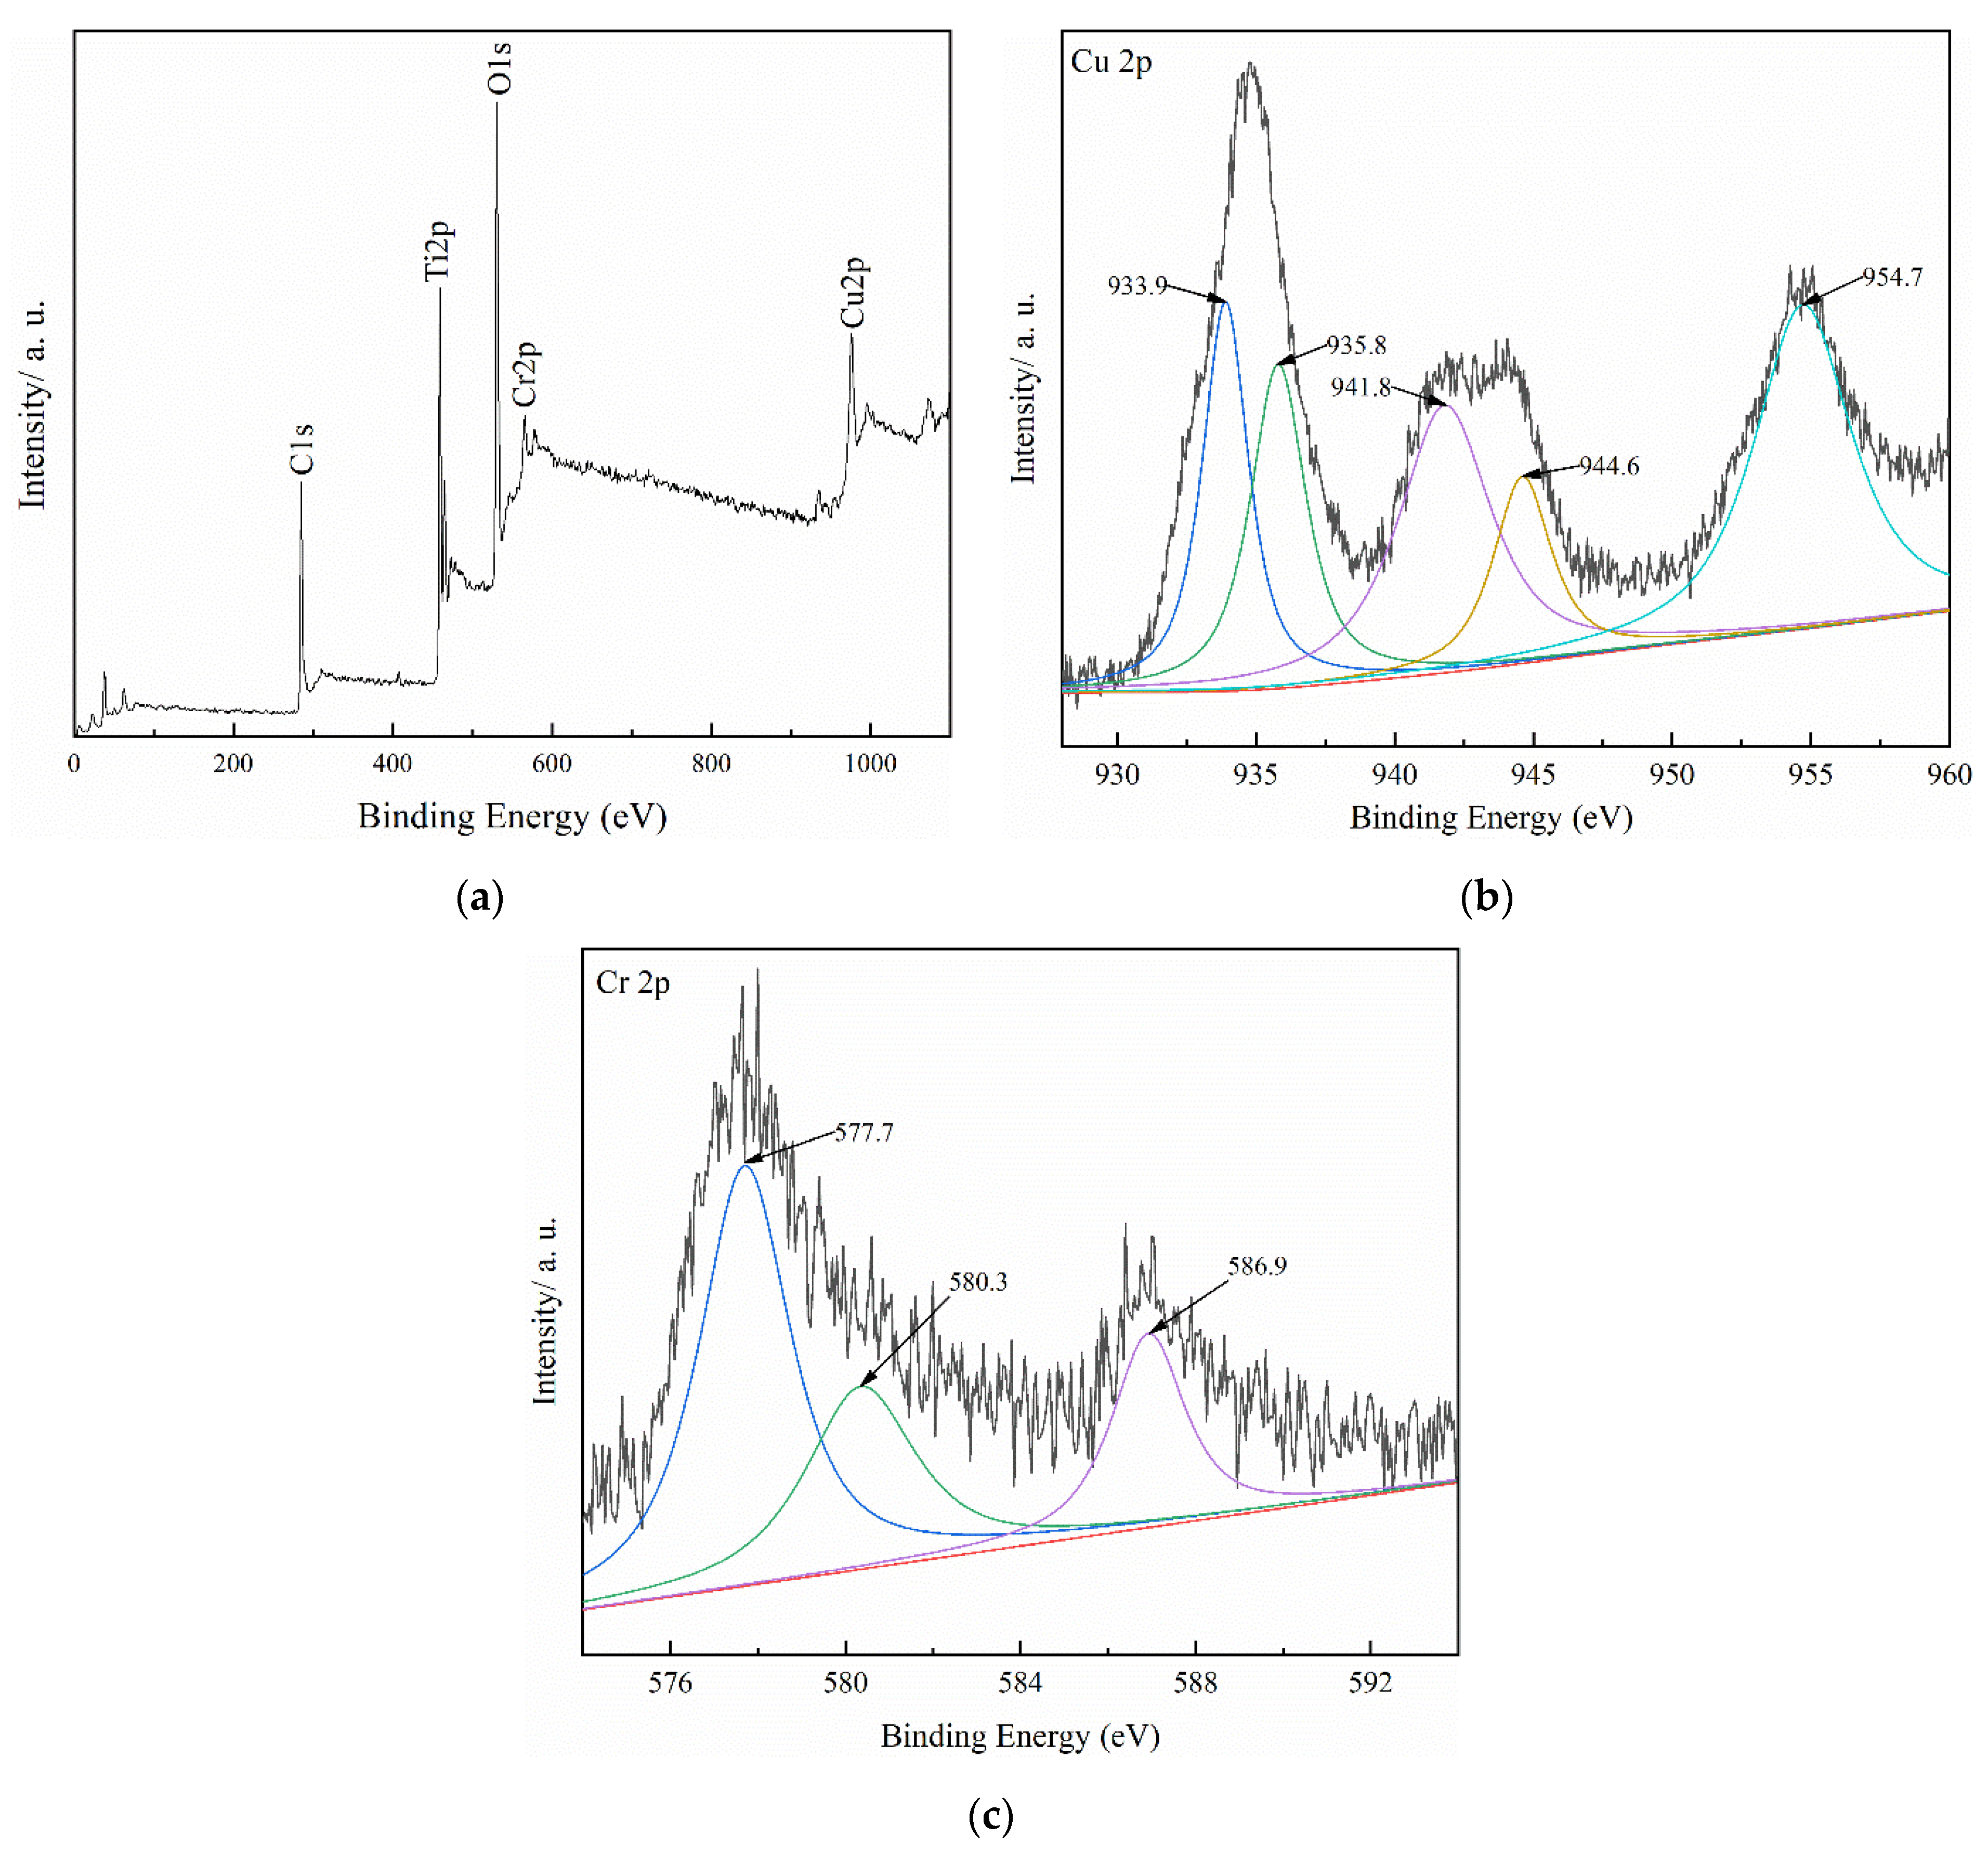
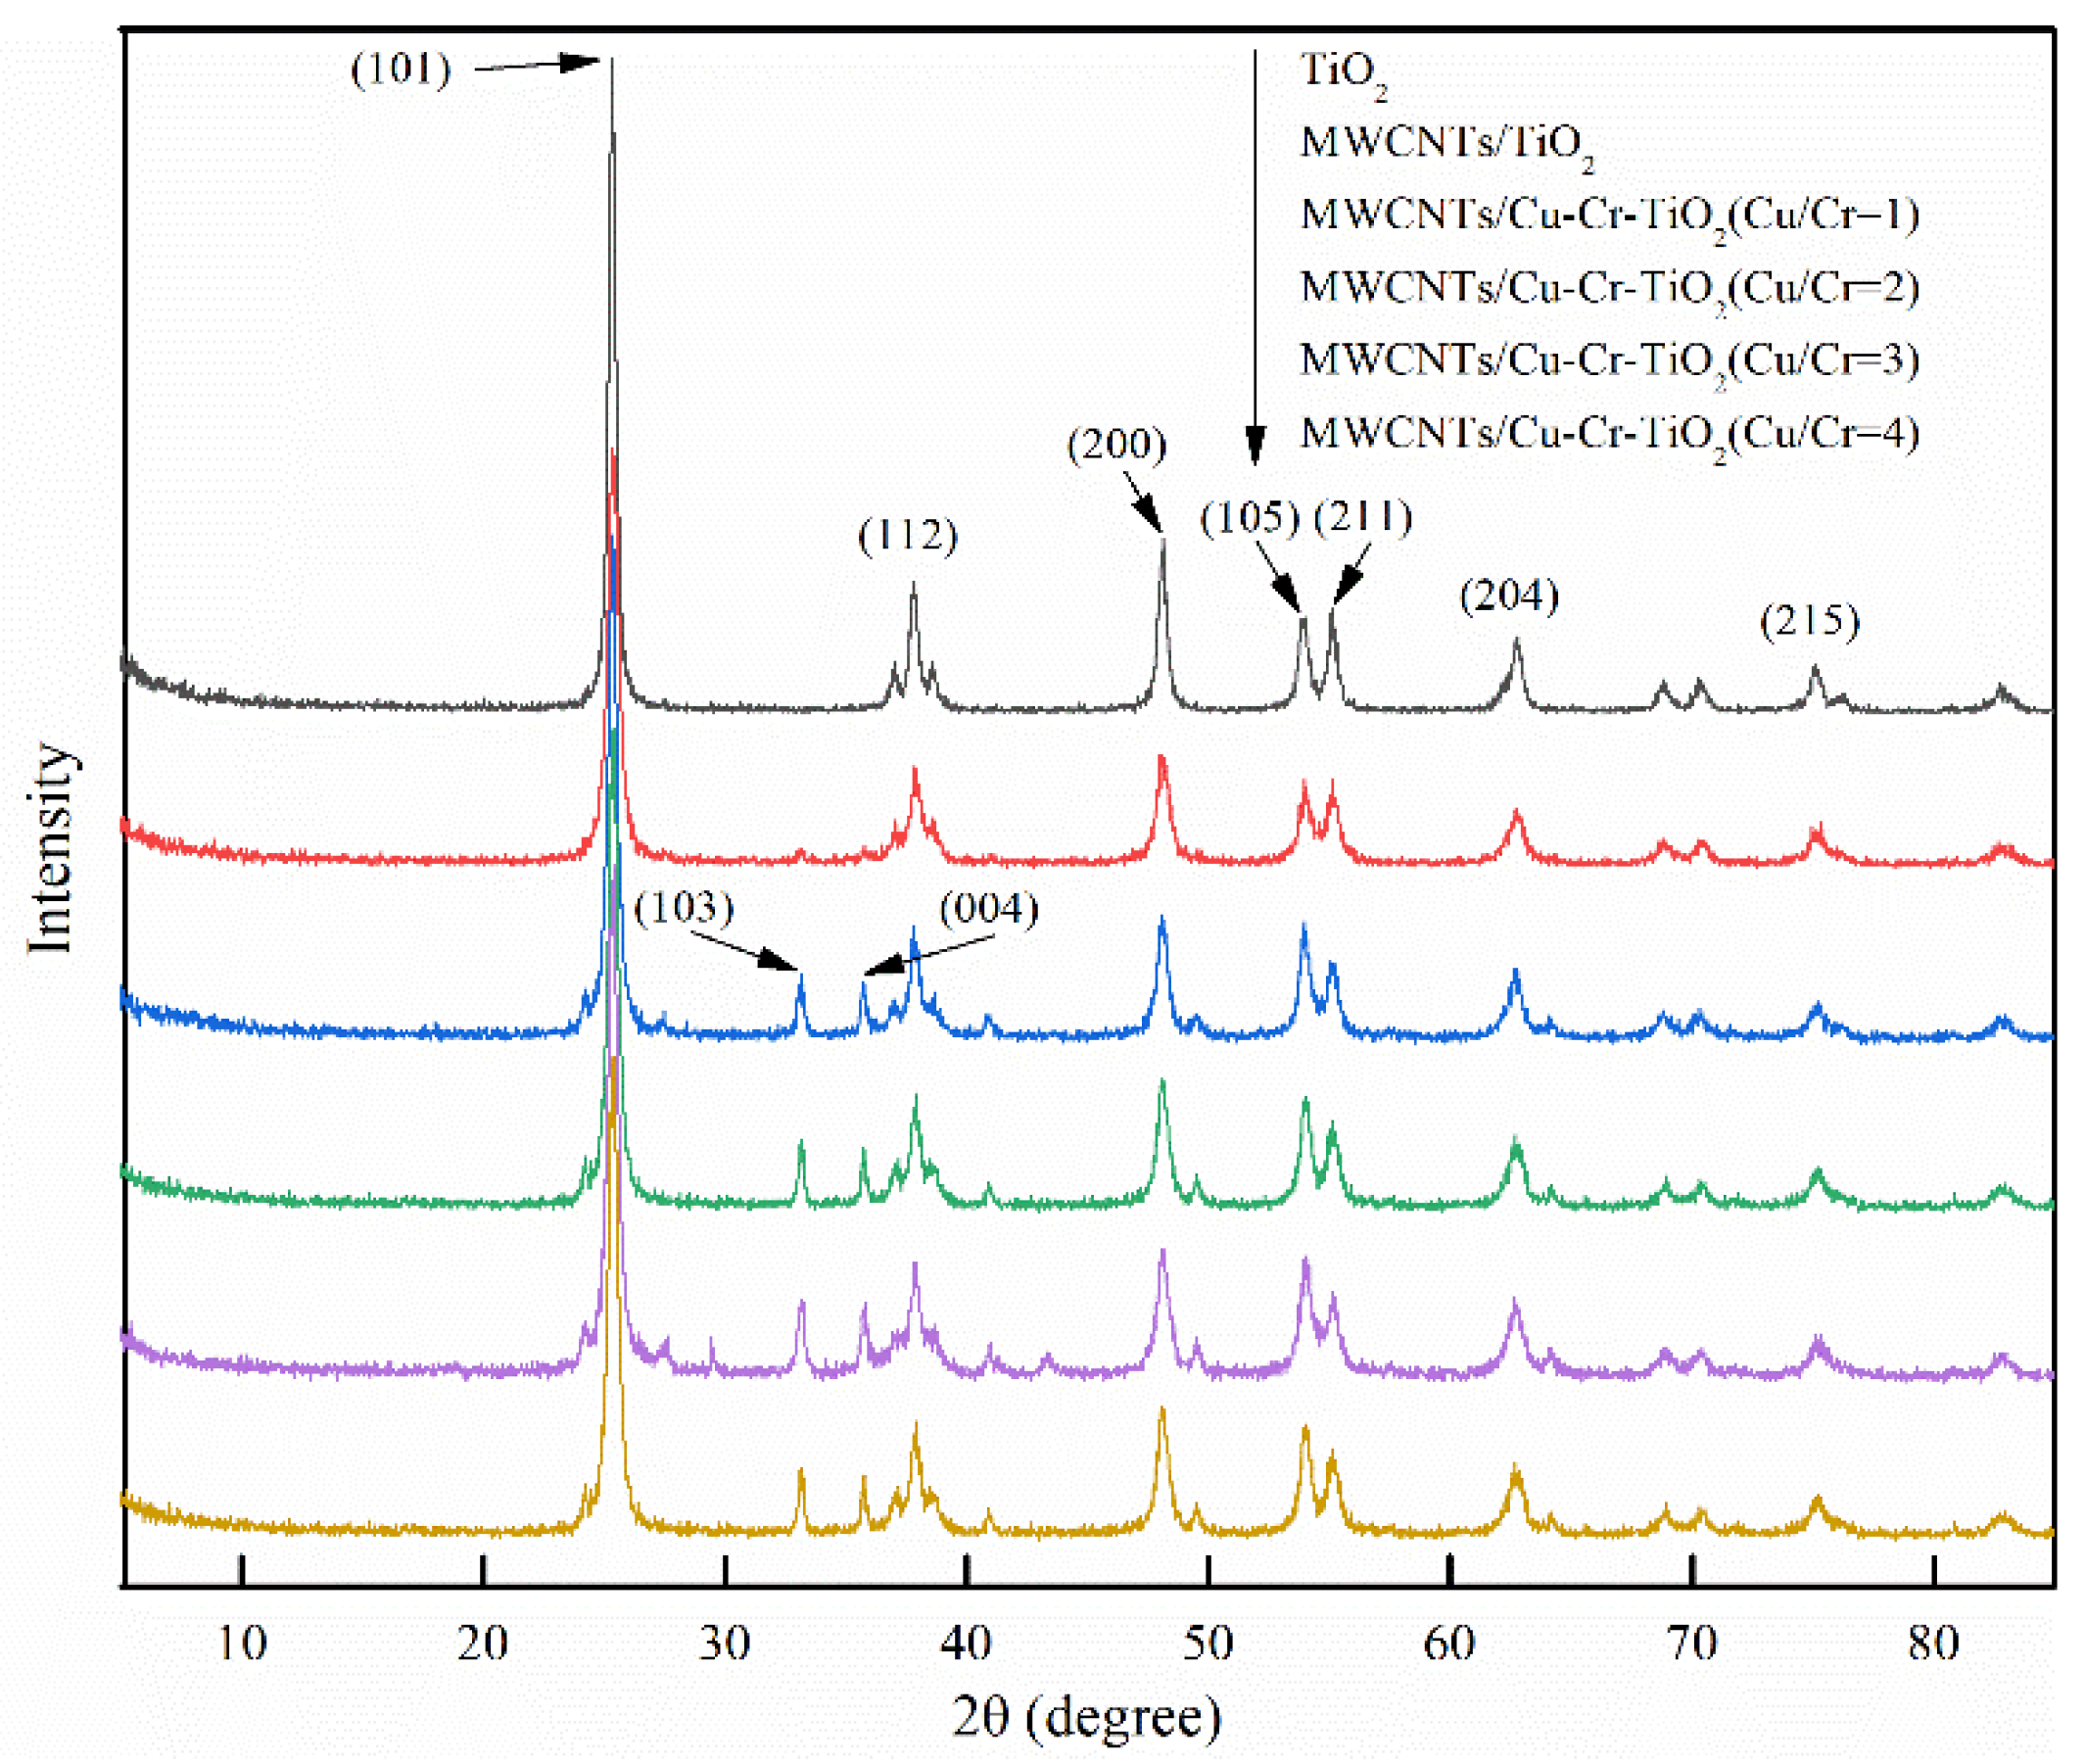
3.1. Adsorbent Characterization

TEM images of MWCNTs, acid-treated MWCNTs, and MWCNTs/Cu-Cr-TiO2 (Cu/Cr = 3) were shown in Figure 2. In Figure 2a, the raw MWCNTs are disorganized and entangled. Figure 2b shows that the length of acid-treated MWCNTs (about 490 nm) were shorter than the unacidified ones (beyond 1500 nm), the hydroxyl and carboxyl groups formed by oxidation cut off the MWCNT. The rupture signs were observed at the end of MWCNTs because of acid treatment [30]. Figure 2c confirms that MWCNTs are tightly wrapped by TiO2 and loaded with Cu and Cr.
Surface analysis of MWCNTs/Cu-Cr-TiO2 (Cu/Cr = 3) was detected by X-ray photoelectron spectroscopy. Figure 3a reveals peaks corresponding to C 1s, Ti 2p, O 1s, Cr 2p, and Cu 2p. Nature and oxidation states of Cu and Cr species are determined by Cu 2p and Cr 2p spectra, respectively. Figure 3b demonstrates the spectrum of Cu 2p. The binding energies of Cu 2p3/2 and Cu 2p1/2 peak at 933.9 and 954.7 eV, while satellite peaks appear at 941.8 and 944.6 eV, indicating the presence of Cu2+. The peak at 935.8 eV is related to Cu+ [31]. Figure 3c shows the spectrum of Cr 2p. Cr 2p3/2 and Cr 2p1/2 peaks at 577.7 and 586.9 eV, confirmed the existence of Cr6+, the peak at 580.3 eV is corresponding to Cr3+ [32]. The results show that Cu and Cr exist on the surface of MWCNTs/Cu-Cr-TiO2 in multivalent forms, mainly Cu2O (Cu+), CuO (Cu2+), Cr2O3 (Cr3+), and Cr6+. The addition of Cu and Cr to MWCNTs/TiO2 could improve photocatalytic efficiency, enhance regeneration of electron-hole pairs, and the separation efficiency on TiO2 [33]. In addition, Cu2O, CuO, and Cr2O3 existed on the surface of MWCNTs/TiO2 are also acted as semiconductor materials. The electron-hole pairs were produced during the oxidation process of semiconductor materials and then reacted with water to generate ·OH. Finally, ·OH participates in the oxidation of SO2 and NO.
The XRD patterns of TiO2, MWCNTs/TiO2, MWCNTs/Cu-Cr-TiO2 are presented in Figure 4. The strong diffraction peaks observed in the spectrum at 25.3°, 36.9°, 37.6°, 38.5°, 48.0°, 53.9°, 55.1°, 62.6°, and 75.1°, correspond to the reflections from the (101), (103), (004), (112), (200), (105), (211), (204), (215) crystal planes of the anatase crystallite’s structure. The anatase phase was observed in the spectra, which indicated that C16H36O4Ti converted to TiO2 during the calcination process [34]. It was also noticed that the peak width of MWCNTs/TiO2 is slightly broader than that of pure TiO2. The broadened peak width implied a reduction of the TiO2 crystallite size and the lattice strain [35]. These Cu- and Cr-doped samples mainly exhibited anatase phase, indicating that TiO2 was maintained in anatase phase after doping Cu and Cr. Compared with the (101) plane diffraction peaks of different samples showed that the diffraction peaks of MWCNTs/Cu-Cr-TiO2 samples are broader than those of TiO2 and MWCNTs/TiO2, and widen with increasing ratio of Cu to Cr. Doping Cu and Cr into the lattice of TiO2 causes lattice distortion, resulting in the decrease of the crystal size and lattice of TiO2. The grain size of the samples could be measured according to the full width at half maxima (FWHM) and Scheler equation [36]. The results show that the grain size of MWCNTs/Cu-Cr-TiO2 distributed in the range of 8–10 nm, while the grain sizes of TiO2 and MWCNTs/TiO2 were 19 and 11 nm, respectively. In summary, the introduction of MWCNTs and the doping of Cu and Cr inhibited the growth of TiO2 grains.
The diffuse reflectance spectra of different adsorbents were exhibited in Figure 5. The light absorption edge of TiO2 is around 400 nm. When the wavelength exceeds 400 nm, the light absorption intensity in the visible region becomes weak. The absorption edges of MWCNTs/TiO2 and MWCNTs/Cu-Cr-TiO2 extend to the long wavelength visible region, also known as the red shift phenomenon. Electrons transition from the valence band to the conduction band, due to the presence of MWCNTs, which causes the extension of the absorption edge [37]. Excellent absorption bands in the range of 320–800 nm were displayed for MWCNTs/Cu-Cr-TiO2 (Cu/Cr = 3) and MWCNTs/Cu-Cr-TiO2 (Cu/Cr = 4) [38]. The improved light absorption bands are related to the introduction of Cu and Cr species (Cu1+ clusters absorption in 400–500 nm, Cu2+ clusters absorption in 600–800 nm, Cr6+ clusters absorption in 350–450 nm, and Cr3+ clusters absorption in 550–650 nm) [39]. The results above confirm the existence of different valence states of Cu and Cr, which is consistent with the results of XPS.
The specific surface areas and pore volumes of different samples are presented in Table 2. The result shows that the specific surface area and pore volume of TiO2 are the smallest. The specific surface area and pore volume of MWCNTs/Cu-Cr-TiO2 are larger than those of TiO2 and MWCNTs/TiO2. It is obvious that the specific surface area increases after doping Cu and Cr on MWCNTs/TiO2 increases. Increasing the ratios of Cu to Cr, decreases the MWCNTs/Cu-Cr-TiO2 specific surface area. Metal doping may block some macropores (pore size more than 50 nm) and mesopores (pore size 2–50 nm) of MWCNTs, but form micropores with a pore size within 2 nm. Therefore, the specific surface area and pore volume increase after metal doping [40]. The maximum pore volume was observed for MWCNTs/Cu-Cr-TiO2 (Cu/Cr = 3).

3.2. Simultaneous Desulfurization and Denitrification Experiment

Adsorption capacity Q (mg/g) of samples was calculated by the following formula:
Q = ( C 0 C ) L m d τ
where C0 is the initial concentration of SO2 or NO at the inlet of the fixed bed reactor (mg/m3); C is the concentration of SO2 or NO at the outlet of the fixed bed reactor (mg/m3); L is the flow rate of the mixed gas (L/min); m is the mass of the adsorbent filled in the fixed bed reactor (g); and τ is the adsorption equilibrium time (min). All data obtained were the average of three repetitive measurements.

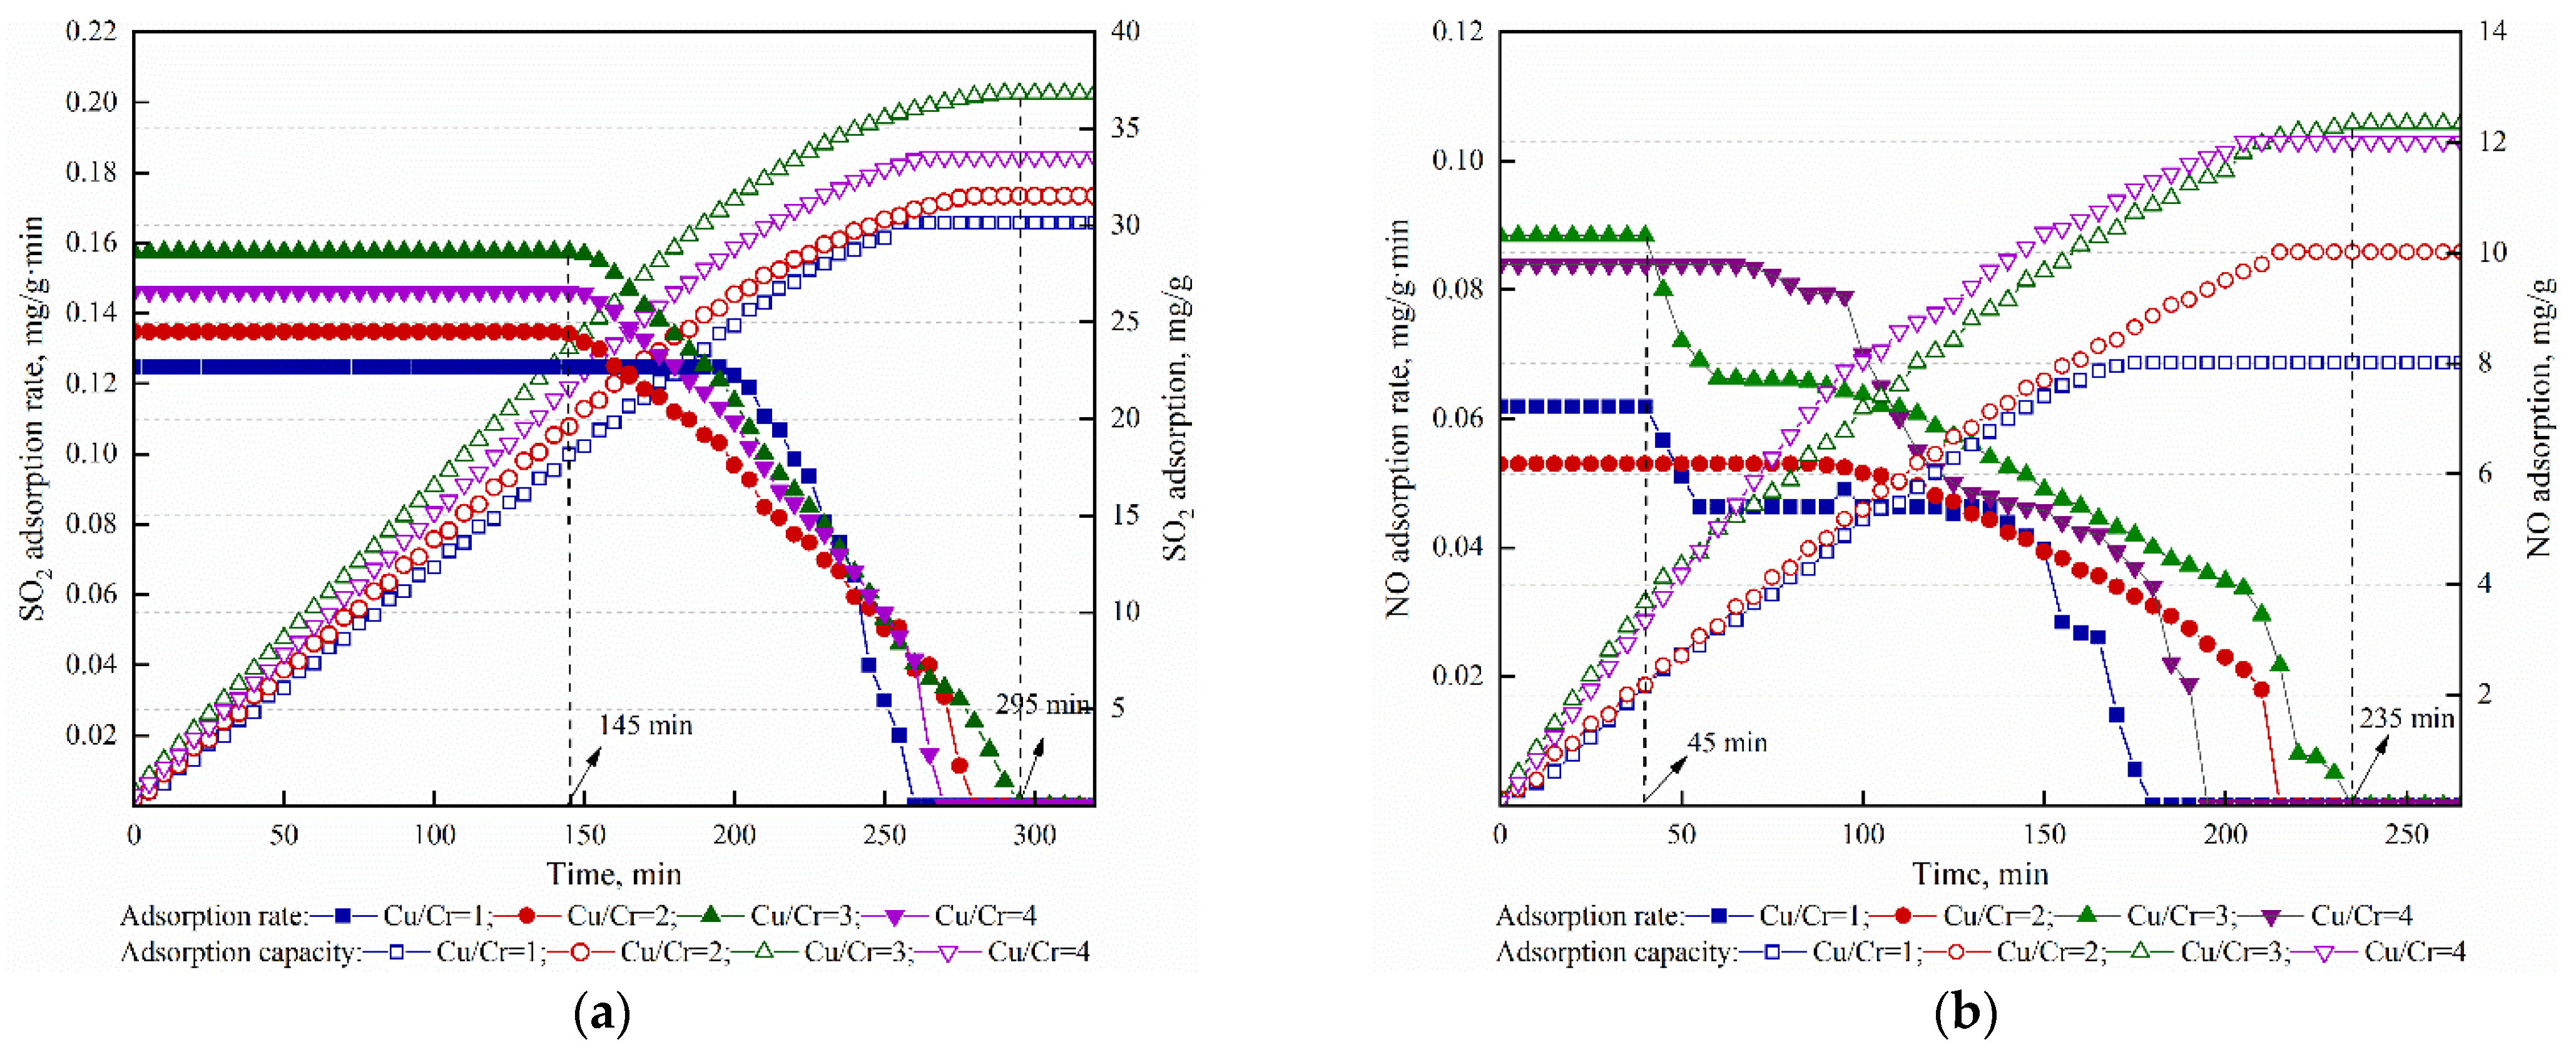
3.2.1. The Effect of the Ratio of Cu to Cr on Simultaneous Adsorption of SO2 and NO

In order to evaluate the adsorption performance of different adsorbents, experiments were performed on MWCNTs/Cu-Cr-TiO2 (Cu/Cr = 1, 2, 3, 4), MWCNTs/Cu-TiO2, and MWCNTs/Cr-TiO2. The influence of the doping ratio of Cu to Cr on adsorption capacity and adsorption rate of MWCNTs/Cu-Cr-TiO2 are revealed in Figure 6. The adsorption capacity of SO2 and NO increased gradually with the ratio of Cu to Cr increase from 1 to 3. However, with the doping ratio increasing to 4, the adsorption capacity decreased. The maximum saturated adsorption capacity of SO2 and NO were observed while the doping ratio is 3, which are 36.83 (at 295 min) and 12.34 (at 235 min) mg/g respectively. Followed by 33.55 and 12.02 mg/g for SO2 and NO at Cu/Cr = 4.
In the initial stage, the adsorption capacity of SO2 and NO increase rapidly, and the adsorption rate remained at the maximum for a long time before the adsorbent layer was penetrated. The maximum adsorption rates of SO2 and NO were 0.158 and 0.088 mg/g·min maintained for 145 min and 45 min while the doping ratio was 3. As shown in Figure 6a, the time for maximum adsorption rate of MWCNTs/Cu-Cr-TiO2 (Cu/Cr = 3) is not the longest, but the saturated adsorption capacity is greatest due to the higher adsorption rate than the others. The same phenomenon can be seen for NO in Figure 6b. That means the saturated adsorption capacity depends not only on the adsorption time but also on the adsorption rate. The longer the maximum adsorption rate time is maintained at the higher adsorption rate, the greater the adsorption capacity.
Under the same experimental conditions (1575 mg/m3 SO2, 736 mg/m3 NO, 8% O2, 5% H2O, 1003 h−1), the simultaneous desulfurization and denitrification performance of MWCNTs, 10% MWCNTs/Cu-TiO2, and 10% MWCNTs/Cr-TiO2 were conducted and compared with the results of MWCNTs/Cu-Cr-TiO2 (Cu/Cr = 3). As shown in Figure 7, The adsorption capacity of SO2 and NO on MWCNTs were 19.75 and 6.83 mg/g, respectively, which were lower than that of metal-doping samples. The SO2 adsorption capacity for MWCNTs/Cr-TiO2 and MWCNTs/Cu-TiO2 were 27.13 and 28.66 mg/g, respectively, more than MWCNTs but less than MWCNTs/Cu-Cr-TiO2 (Cu/Cr = 3). In addition, MWCNTs/Cu-TiO2 showed a better SO2 adsorption capacity than MWCNTs/Cr-TiO2. The same phenomena could be seen for the adsorption of NO.
The improvement of simultaneous desulfurization and denitrification performance of MWCNTs/Cu-Cr-TiO2 (Cu/Cr = 3) is related to the electron migration in the surface structure. New CuO, Cu2O, CrO3, and Cr2O3 impurity levels are formed between the valence band and conduction band of TiO2 on MWCNTs surface due to the doping of transition metal Cu and Cr. These new impurity levels not only reduce the energy required for the valence band electron migration of TiO2, but also transfer the conduction band electrons of TiO2 to the new impurity levels, and block the recombination of electrons and holes [41]. Then, the introduction of Cu and Cr could accelerate the separation of electrons and holes on the TiO2 surface, and leave oxygen vacancies after electron migration [42]. As an important adsorption and reaction site, oxygen vacancy plays a significant role in the adsorption process [43]. In conclusion, compared with single metal doping, simultaneous Cu and Cr doping produces more impurity energy levels, which is conducive to electron migration, and then leads to the increase of the number of oxygen vacancies on the adsorbent surface.
Due to Cu doping, Cu+ and Cu2+ were introduced onto the adsorbent surface. The ionic radius of Cu+ (0.077 nm) and Cu2+ (0.075 nm) were larger than that of Ti4+ (0.074 nm), so CuO and Cu2O remained on the surface of TiO2. Cr3+ and Cr6+ existed on the surface of the adsorbent by doping Cr. However, the Cr ion could replace Ti4+ to become the new center of the lattice due to the ion radius of Cr3+ (0.0615 nm) and Cr6+ (0.044 nm) being smaller than that of Ti4+ (0.074 nm). The increase of Cr content is accompanied by the decrease of TiO2 grain size, which shortens the distance between electrons and holes, leads to the rapid migration of electrons and promotes the recombination of electrons and holes. Nevertheless, the increase of Cu content leads to the accumulation of CuO and Cu2O on the surface of the adsorbent, which reduces the number of oxygen vacancies on the surface and further weakens the removal of SO2 and NO. It is concluded that the introduction of Cu and Cr are beneficial to the removal of SO2 and NO, and MWCNTs/Cu-Cr-TiO2 (Cu/Cr = 3) proved to be the best.

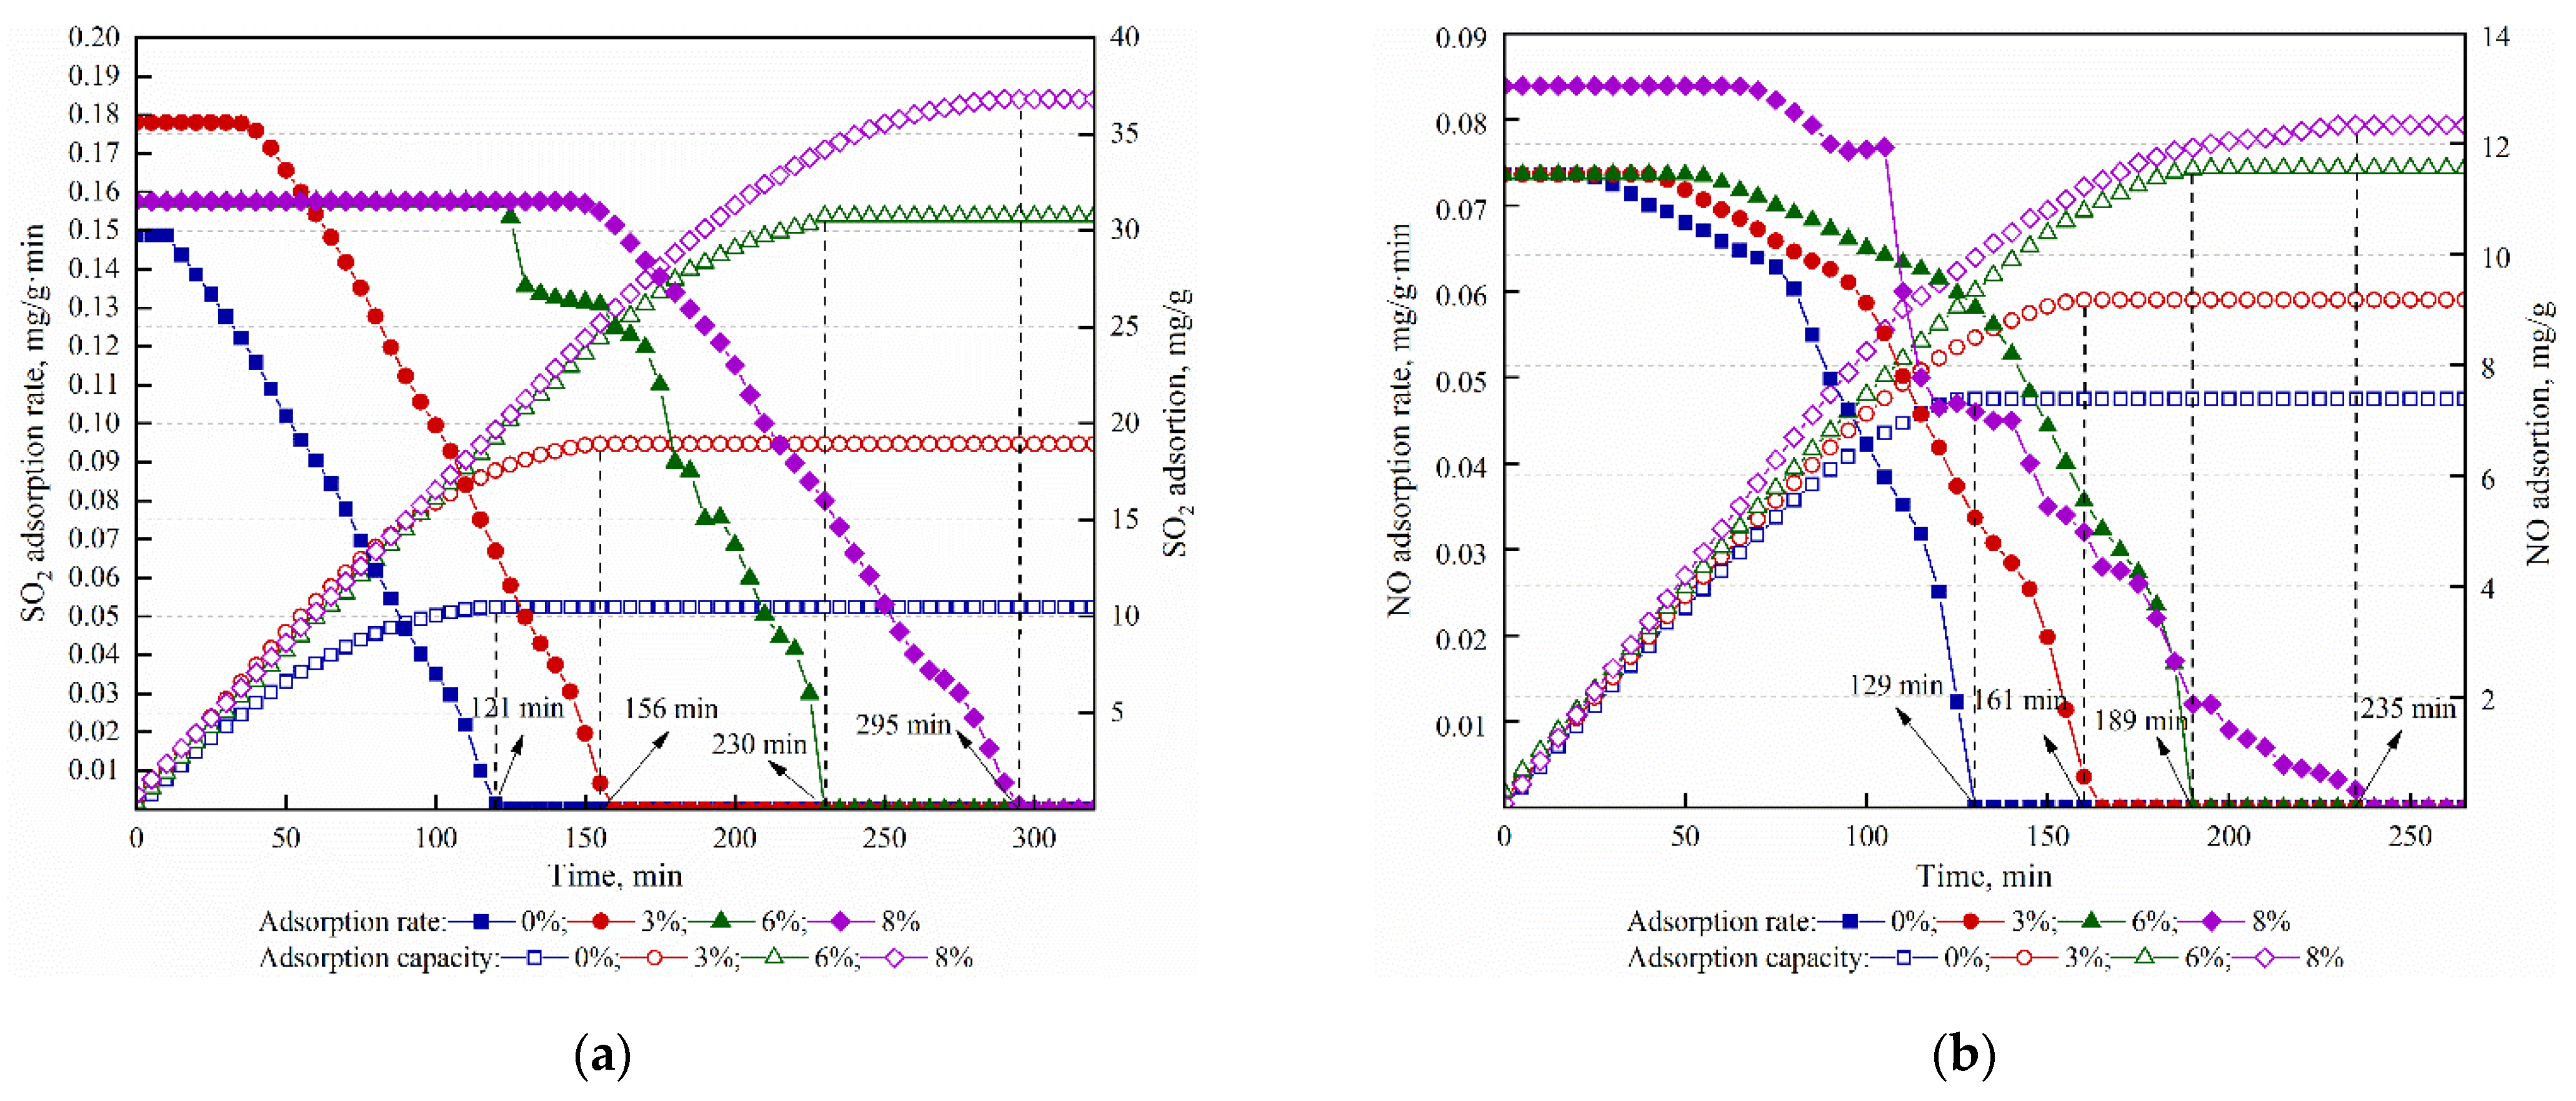
3.2.2. The Effect of O2 on Simultaneous Adsorption of SO2 and NO

The effect of O2 on the removal of SO2 and NO were shown in Figure 8a,b at different O2 concentrations (0%, 3%, 6%, 8%). It could be observed that the adsorption capacity of SO2 and NO rises with the increasing O2 concentration. In the absence of O2, the adsorption capacities of SO2 and NO were 10.46 and 7.4 mg/g, respectively, and the initial adsorption rates were the smallest, which were 0.146 and 0.072 mg/g·min. After 120 min, the adsorption of SO2 and NO achieved saturation, and the adsorption rate decreased to 0. With the increase of O2 concentration to 8%, the adsorption capacity of SO2 and NO increase to 36.828 and 12.341 mg/g, respectively, which increased by 260% and 69% compared with that without O2. At the beginning of adsorption, the maximum adsorption rate was about 0.158 and 0.084 mg/g·min. As the adsorption goes on, the adsorption capacity continued to increase and the adsorption rate decreased sharply. Moreover, the adsorption of SO2 and NO lasted 295 and 235 min. The longer the saturation time, the higher the adsorption capacity.
The experimental results reveal that the increase of O2 concentration is a benefit for simultaneous desulfurization and denitrification. Numerous photo-generated electrons and oxygen vacancies are produced due to the bond broken between Ti and O on the surface of TiO2 under UV irradiation [44]. Meanwhile, O2 in the flue gas was activated after obtaining photo-generated electrons and formed O2. O2 is a strong oxidizing radical, which inhibits the recombination of electron-hole pairs on the surface of MWCNTs/Cu-Cr-TiO2 and participates in the oxidation-reduction reaction [45]. With the increase of O2 concentration, more O2 molecules are activated to produce O2 [46]. Therefore, increasing O2 concentration can enhance the performance of simultaneous desulfurization and denitrification.

3.2.3. The Effect of H2O on Simultaneous Adsorption of SO2 and NO

The effects of H2O on the removal of SO2 and NO were shown in Figure 9a,b at different H2O concentrations (0%, 1%, 3%, 5%). The adsorption capacity of SO2 and NO is obviously increased with the increasing H2O content. The initial adsorption rates of SO2 and NO were maintained at 0.156 and 0.074 mg/g·min, respectively, for 20 min without H2O. The adsorption of SO2 and NO were completed within 166 min and 119 min, with the adsorption capacity of SO2 and NO were only 17.34 and 7.55 mg/g. Along with the H2O content increase to 5%, the adsorption capacity of SO2 and NO were 36.83 and 12.34 mg/g, respectively, which increase by 112% and 64% compared with that without H2O.
The experimental results show that the existence of H2O is critical for the adsorption of SO2 and NO. The hydroxyl group formed while H2O was adsorbed on the surface of MWCNTs/Cu-Cr-TiO2, which act as the physical adsorption site of SO2 and NO. Firstly, the hydroxyl group will capture more H2O molecules under the action of hydrogen bonds, then it will form more hydroxyl groups [47]. Secondly, the hydroxyl group generates a strong oxidizing radical ·OH after taking over the hole, which is used to oxidize SO2 and NO [48]. Thirdly, H2O can clean the surface of the absorbent such as reaction products sulfate and nitrate, then the adsorption sites on the surface will be vacated for the oxidization of SO2 and NO [49]. Therefore, the increase of H2O content enhances the adsorption of MWCNTs/Cu-Cr-TiO2 for both SO2 and NO.

3.2.4. The Effect of Space Velocity on Simultaneous Adsorption of SO2 and NO

Space velocity was defined as the ratio of the volume of the gas passing through the adsorbent layer to the volume of adsorbent in unit time. In this paper, we examine the effects of space velocity (1003 h−1, 1670 h−1, 2462 h−1, 3342 h−1) on the removal of SO2 and NO. Figure 10a,b show that the saturated adsorption capacity of MWCNTs/Cu-Cr-TiO2 decreases with the increasing space velocity. The saturated absorption time are 105, 156, 192 and 295 min while the space velocity increases from 1003 to 3342 h−1 for SO2 adsorption, with the adsorption capacity are 10.06, 17.04, 28.33, and 36.83 mg/g, respectively. The longer the saturated absorption time, the higher the adsorption capacity. The same trend can be seen from Figure 10b for the NO adsorption. The adsorption capacity of NO is 12.34 mg/g at 1003 h−1, which is increased by 102% compared to that of 3342 h−1.
The simultaneous adsorption of SO2 and NO by MWCNTs/Cu-Cr-TiO2 in the presence of O2 and H2O follows three steps below. Firstly, SO2 and NO diffused into the pores on the MWCNTs/Cu-Cr-TiO2 surface. Secondly, SO2 and NO are mixed with O2 and H2O in the channel and oxidized to H2SO4 and HNO3. Finally, H2SO4 and HNO3 were removed from the surface of MWCNTs/Cu-Cr-TiO2 [50]. The lower space velocity means that SO2 and NO could stay longer in the pores of MWCNTs/Cu-Cr-TiO2 surface and fully contact with O2, H2O. Therefore, there is enough time to react and oxidize SO2 and NO.

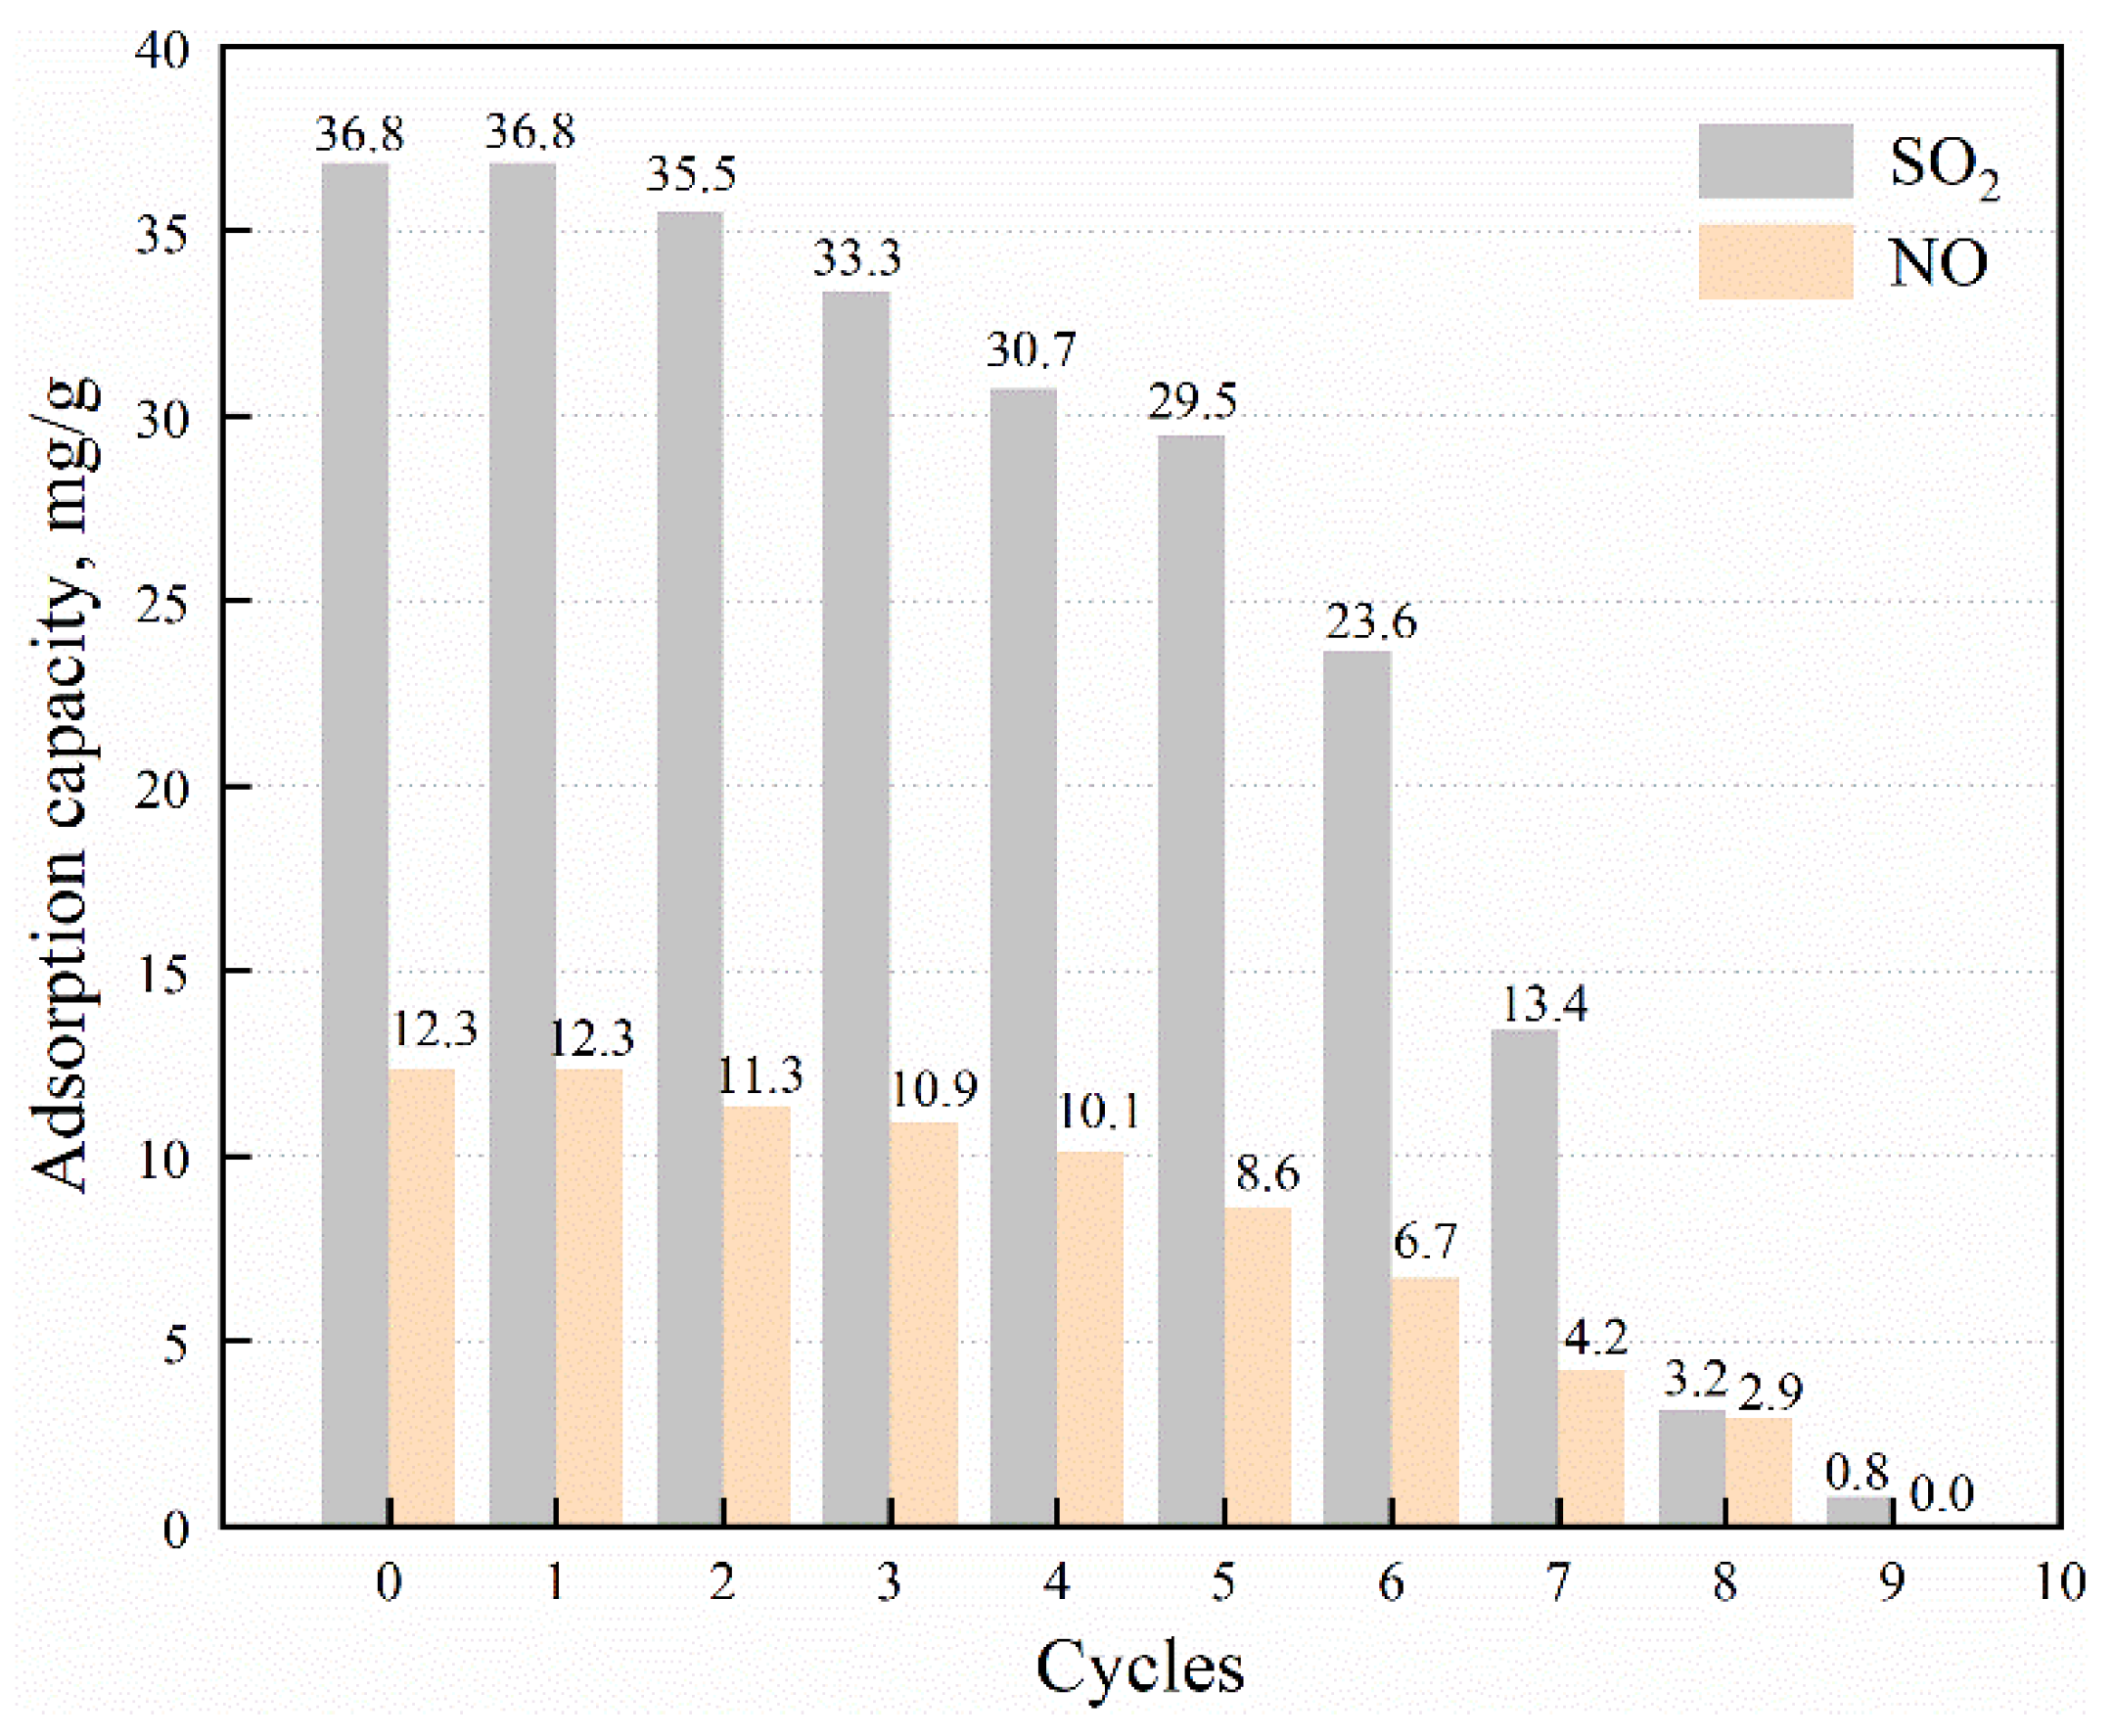
3.2.5. Adsorption Cycles of MWCNTs/Cu-Cr-TiO2

In this paper, the sample of MWCNTs/Cu-Cr-TiO2 (Cu/Cr = 3) was used to perform the adsorption cycles test. The saturated adsorbent was removed from the fixed bed reactor and heated in a microwave heater filled with protective gas N2 for desorption regeneration. Figure 11 reveals the results of the adsorption-desorption cycle of MWCNTs /Cu-Cr-TiO2 (Cu/Cr = 3). The adsorption performance of the absorbent unchanged at the first cycle for both SO2 and NO, and then the adsorption capacity decreases gradually with the increase of cycle times. For SO2 adsorption, the adsorbent could maintain 90% of the saturated adsorption capacity within four cycles. The adsorption decreases to 23.6 mg/g after the sixth cycle, which is about 64.1% of the saturated adsorption. The adsorbent completely failed after the ninth cycle. The results of NO adsorption show that the adsorbent could maintain 82% of the initial capacity within four cycles, but only 26% after eighth cycle. The absorbent cannot adsorb NO after the tenth cycle.

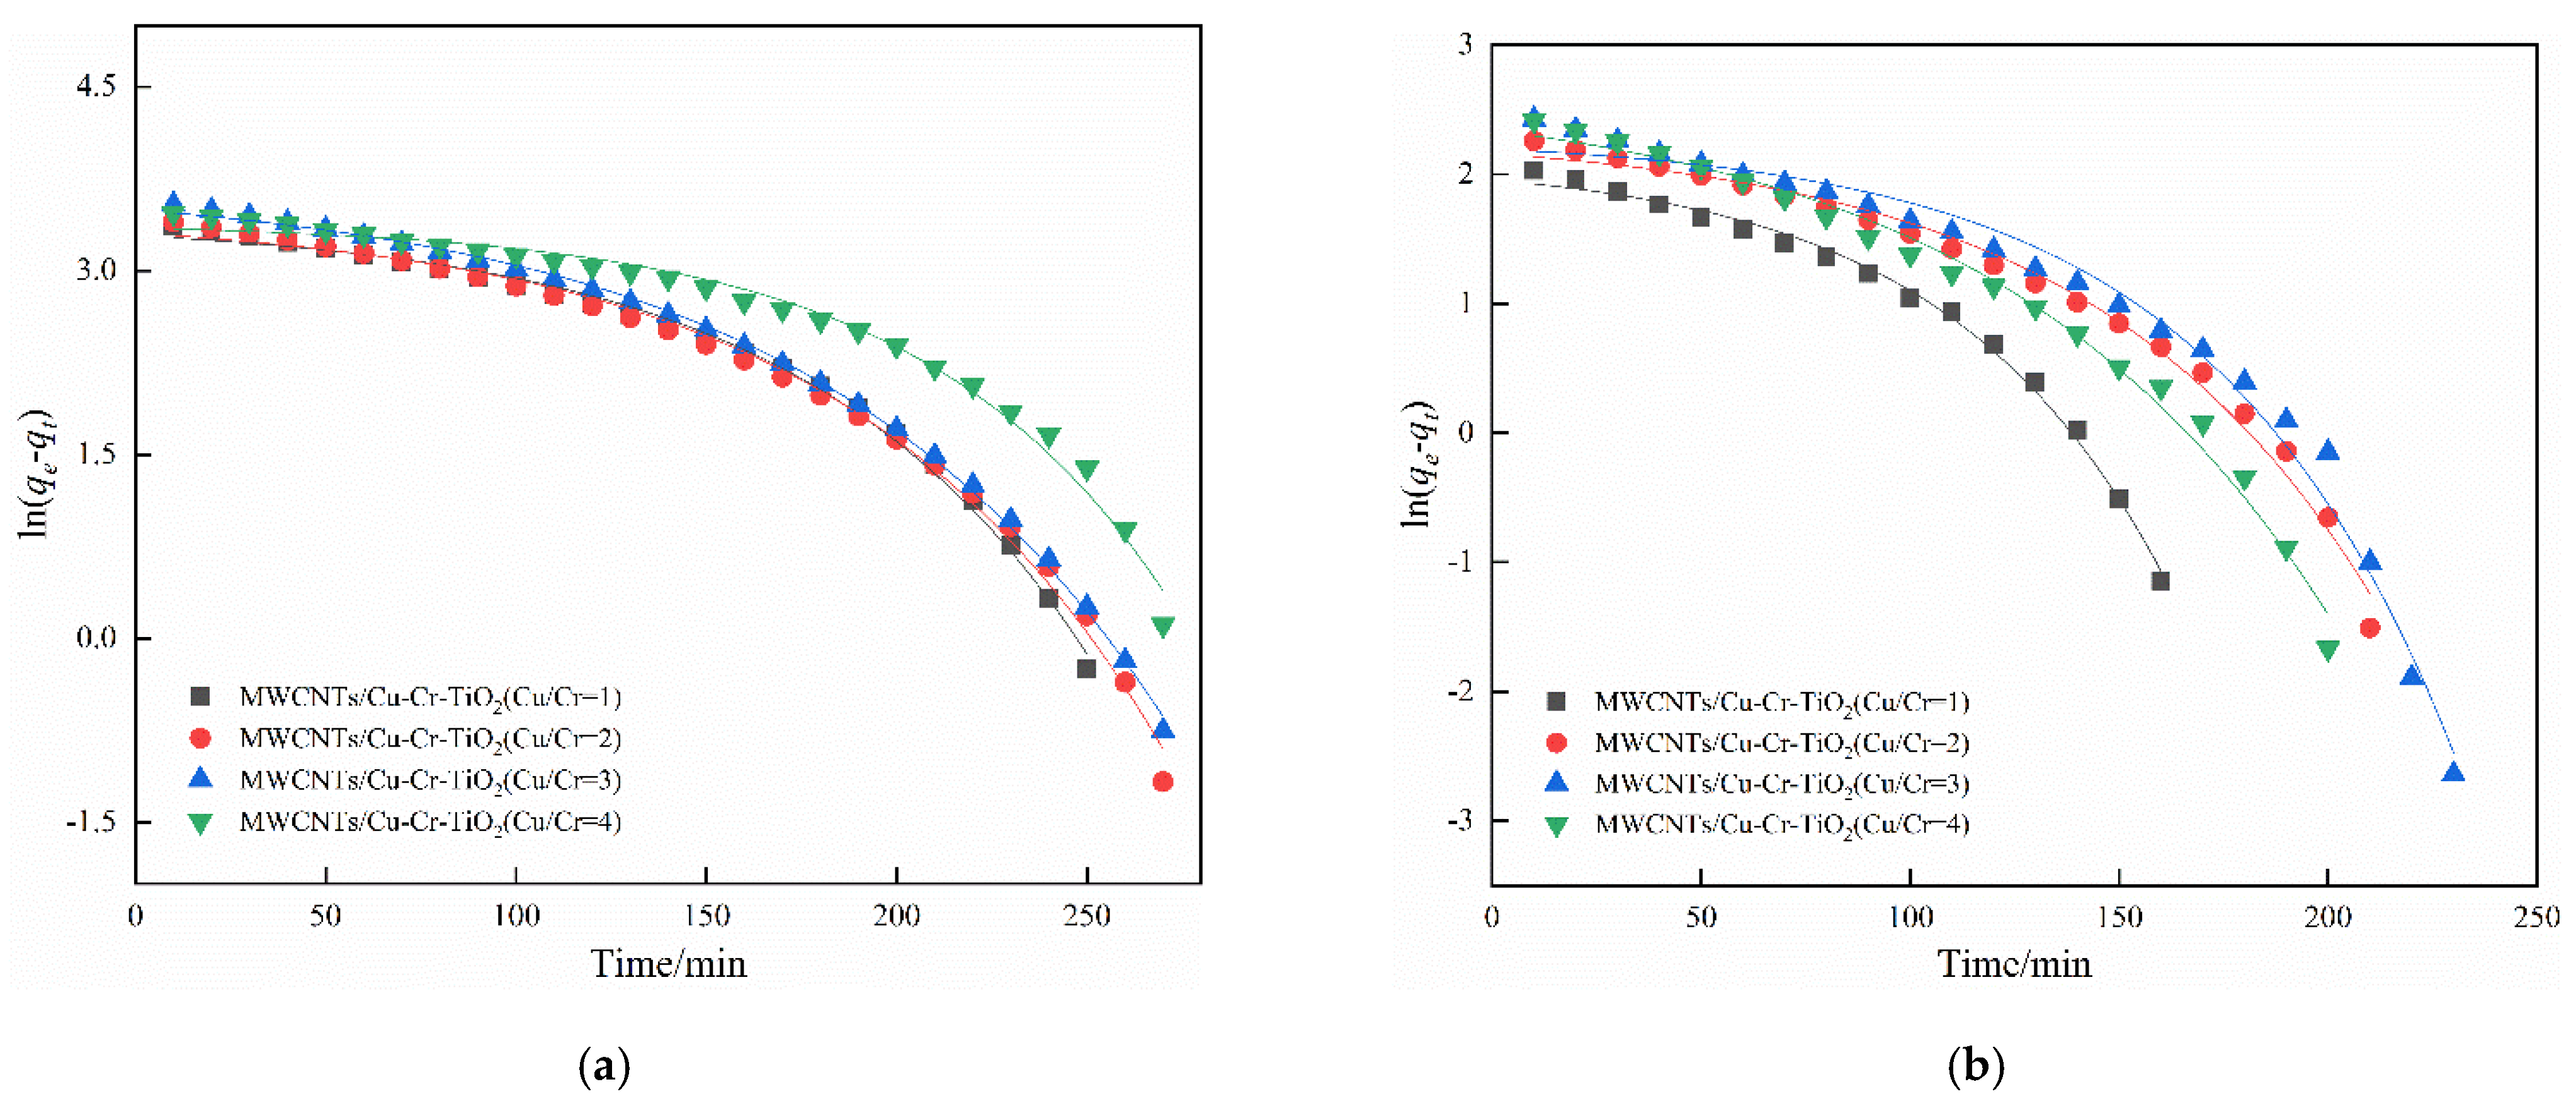
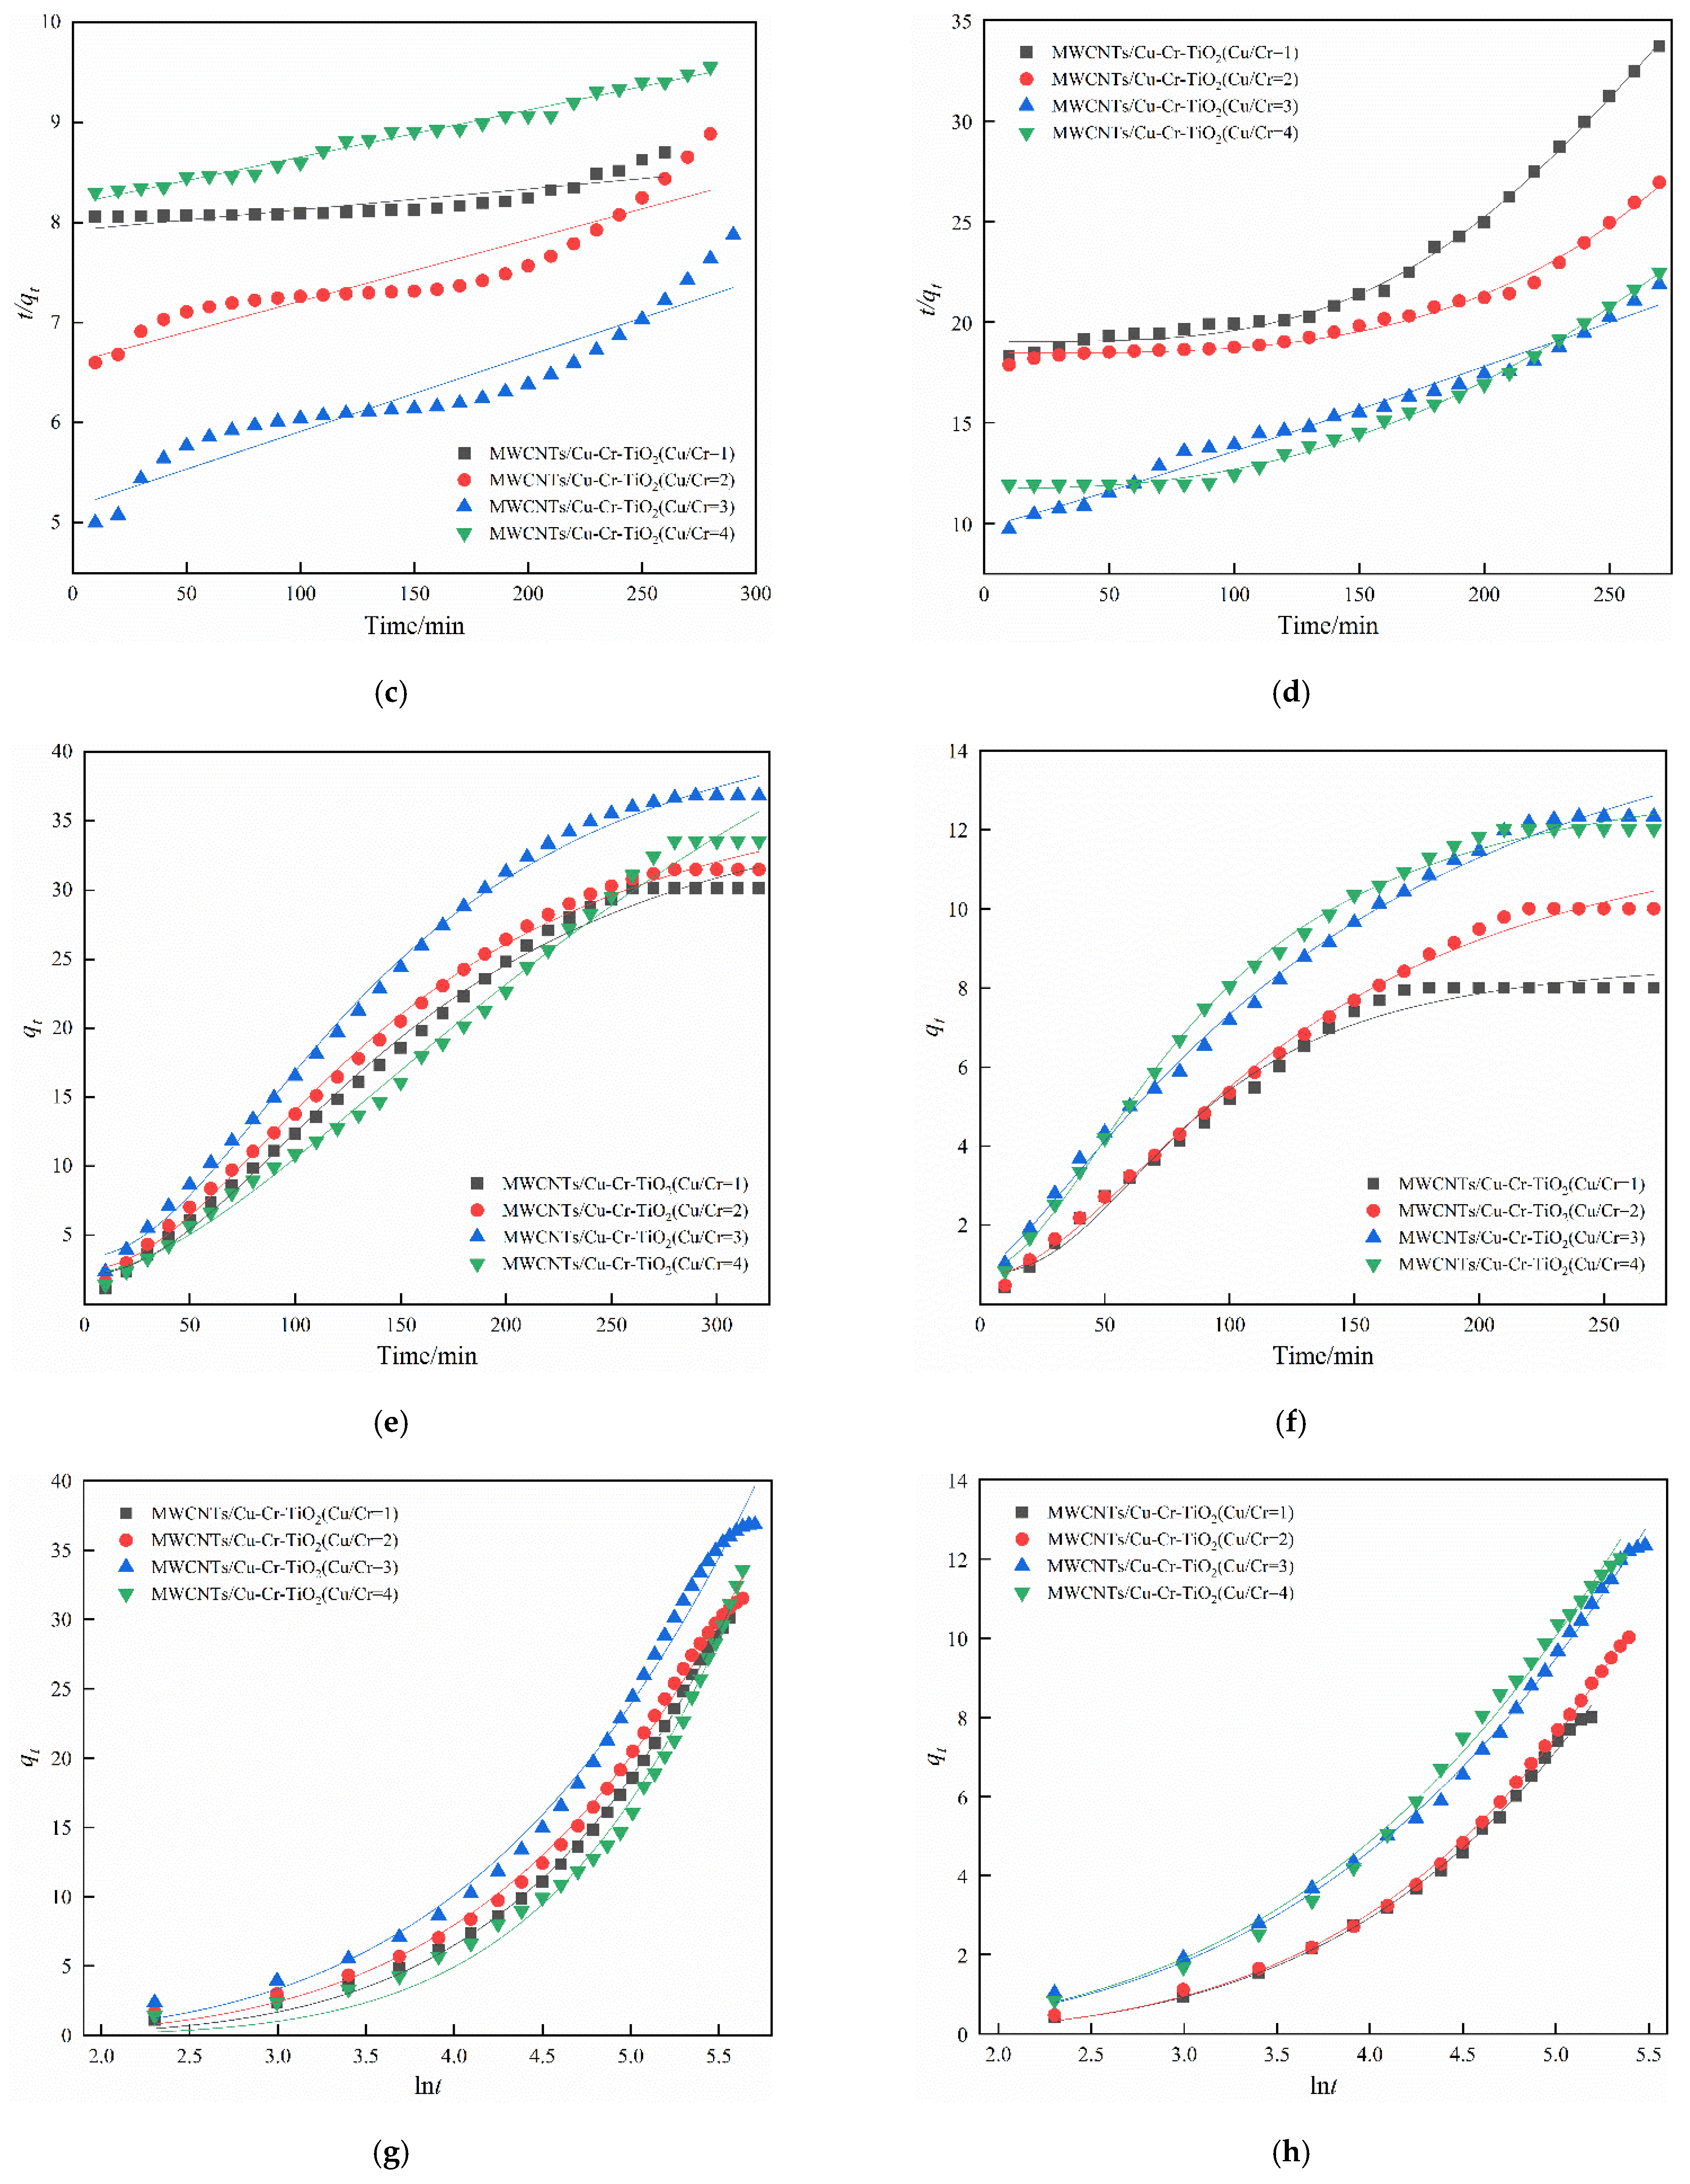
4. Adsorption Kinetics Analysis

In this paper, the adsorption curves of SO2 and NO on MWCNTs/Cu-Cr-TiO2 were fitted by a pseudo-first-order kinetic model, pseudo-second-order kinetic model, Bangham kinetic model, and Elovich kinetic model.
The Pseudo-first-order kinetic model considers the rate of the adsorption reaction to being proportional to the difference between the equilibrium adsorption amount and the instantaneous adsorption amount in the system [51]. The equation is shown as follows:
ln ( q e q t ) = ln q e k 1 t
  • qe: the adsorption amount at the adsorption equilibrium, i.e., the maximum adsorption capacity, mg/g;
  • qt: the adsorption amount at time t, mg/g;
  • k1: the pseudo-first-order kinetic model adsorption rate constant, min−1;
  • t: the time, min.
The pseudo-second-order kinetic model could be expressed as [52]:
t q t = 1 k 2 q e 2 + 1 q e t
k2: the pseudo-second-order kinetic model adsorption rate constant, min−1.
The Bangham kinetic model equation is normally used to describe the process of adsorption and diffusion of adsorbate in pores [53]. The equation is given below:
q t = q e ( 1 e k 3 t n )
  • k3: the Bangham kinetic model adsorption rate constant, min−1;
  • n: constant.
The Elovich kinetic model is frequently used to describe the reaction process with high activation energy and the chemisorption process [54]. The equation could be represented by:
q t = 1 b ln ( a b ) + 1 b ln t
a, b: constant.
The above adsorption kinetics were fitted and analyzed to understand the adsorption process of SO2 and NO on MWCNTs/Cu-Cr-TiO2. The fitting results and the parameters are shown in Figure 12, Table 3 and Table 4.
Due to each kinetic model making different assumptions, the correlation coefficient (R2) represents the correlation between the kinetic model and the dynamic adsorption curves [55]. It is widely believed that the dynamic adsorption curves conform to the kinetic model and the dynamic adsorption process accord with the hypothesis of the kinetic model when the correlation coefficient of the kinetic model reaches 0.99 or more (R2 > 0.99). Fitting the dynamic adsorption curve is also conducive to the prediction of adsorption equilibrium and adsorption capacity.
As shown in Table 3 and Table 4, the correlation coefficients of the pseudo-first-order model and Elovich model are almost more than 0.99 (R2 > 0.99) for both adsorption of SO2 and NO. The results of the pseudo-second-order model are shown in Figure 12c,d, which showed a good agreement with the adsorption of NO, but not so good for the adsorption of SO2. As shown in Figure 12e,f, although the Bangham model fitted most data well, but the large deviations were observed for data close to the adsorption equilibrium. The above results indicated that the Pseudo-first-order model and Elovich model are good choices to predict both the adsorption process of SO2 and NO on MWCNTs/Cu-Cr-TiO2.

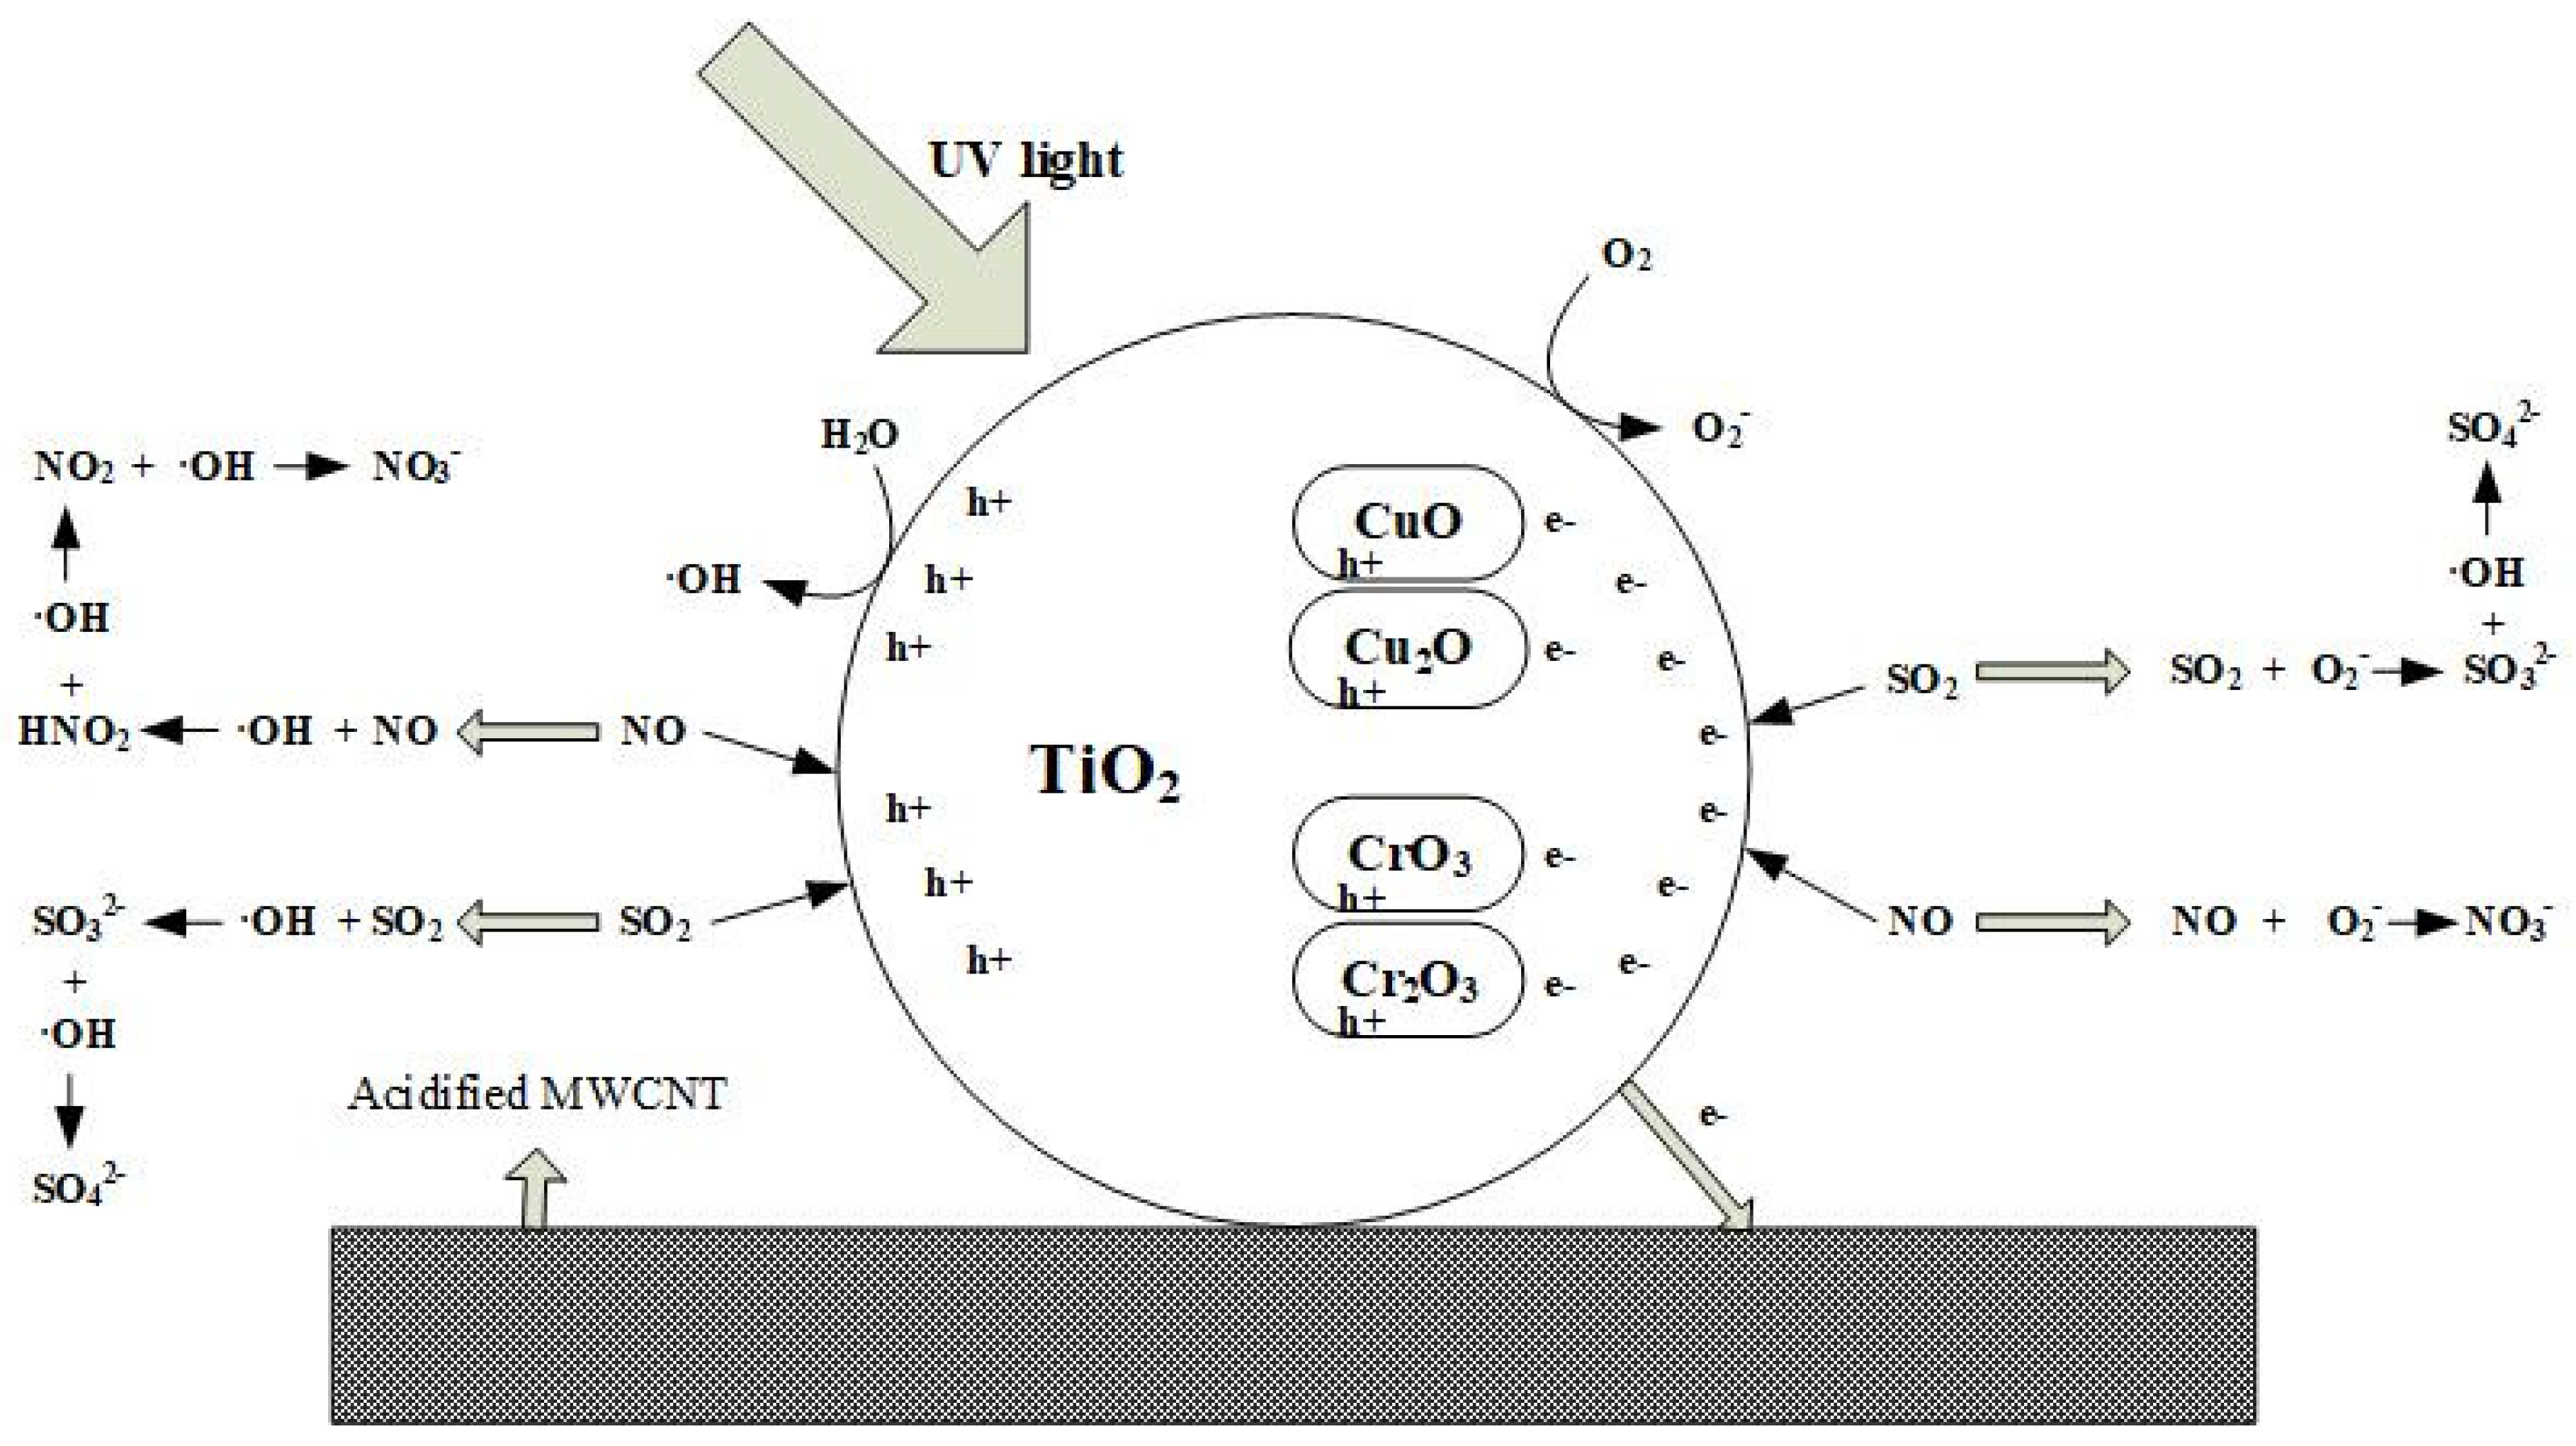
5. Reaction Mechanism

Figure 13 reveals the reaction mechanism of simultaneous desulfurization and denitrification on MWCNTs/Cu-Cr-TiO2. In this paper, TiO2 was loaded on the surface of MWCNTs and then doped with Cu and Cr. The XPS results confirmed that Cu and Cr mainly exist in the form of Cu2O, CuO, Cr2O3, and CrO3 [56]. The oxides exist in the gap of the TiO2 lattice or deposited on the surface of the adsorbent, which is conducive to electron migration and accelerates the separation of electron and hole [57]. With the introduction of single metal Cu or Cr, the type of oxide formed on the surface of the adsorbent is single, which leads to the electron migration effect being weaker than that of bimetallic.
When irradiated by ultraviolet light, the bond between O and Ti in TiO2 on the surface of the adsorbent was destroyed, and the excited electrons migrate from the valence band (VB) to the conduction band (CB), leaving holes (oxygen vacancies) in the valence band [58]. MWCNTs act as electronic storage materials to store the electrons excited by TiO2 and prevent them from recombination with holes [36]. Due to the electron migration, there are abundant oxygen vacancies on the adsorbent surface, which adsorb SO2 and NO, as well as O2 and H2O.
After receiving the electrons excited by TiO2, O2 forms the strong oxidation free radical O2, which inhibits the recombination of electrons and holes and participates in the oxidation-reduction reaction of SO2 and NO [59]. Oxygen vacancy adsorbs H2O and converts it to the hydroxyl group, which is an important adsorption site for SO2 and NO. The strong oxidation free radicals ·OH are formed when the hydroxyl group captures holes [60]. ·OH can not only oxidize SO2 and NO but also combine with H2O to form more ·OH by hydrogen bonding. The oxygen vacancies and hydroxyl groups on the surface of the adsorbent not only adsorb SO2 and NO but also act as reaction sites and participate in the formation of strong oxidation free radicals ·OH and O2. SO2 reacts with O2 on the surface of the adsorbent to form sulfite SO32−, which is further oxidized to sulfate SO42− by strong oxidation radical ·OH, and finally forms sulphate [45]. NO undergoes NO-HNO2-NO2-HNO3 by reacting with ·OH [61].

6. Conclusions

In this paper, the adsorbents MWCNTs/Cu-Cr-TiO2 (Cu/Cr = 1, 2, 3, 4) were prepared by the sol-gel method and characterized by TEM, XRD, XPS, DRS, and BET. The results showed that MWCNTs were wrapped by TiO2 and loaded with Cu and Cr. The adsorbent retained the anatase phase of TiO2 while doping Cu and Cr. Cu and Cr existed in the form of multivalent compounds. Doping Cu and Cr into the lattice of TiO2 resulted in the decrease of the crystal size and lattice of TiO2. The grain size of MWCNTs/Cu-Cr-TiO2 was in the range of 8–10 nm, while TiO2 and MWCNTs/TiO2 were 19 and 11 nm, respectively. The specific surface area and pore volume of MWCNTs/Cu-Cr-TiO2 were larger than those of TiO2 and MWCNTs/TiO2. MWCNTs/Cu-Cr-TiO2 showed a better property than MWCNTs/TiO2 and single metal doping. The sample with the Cu/Cr = 3 displayed the optimal adsorption property for both SO2 and NO. With the optimal conditions (O2 content 8%, H2O content 5%, space velocity 1003 h−1), the adsorption capacities of SO2 and NO of MWCNTs/Cu-Cr-TiO2 (Cu/Cr = 3) were 36.83 and 12.34 mg/g, respectively.
The dynamic adsorption process of SO2 and NO on adsorbents can be accurately described by the pseudo-first-order and Elovich models. The mechanism of simultaneous desulfurization and denitrification was analyzed here. Compared with single metal doping, doping Cu and Cr produce more impurity energy levels, which is conducive to electron migration and hole separation. H2O and O2 were found to be favorable for the adsorption due to generation of O2 and ·OH during the adsorption process.

Author Contributions

Conceptualization, W.J.; Data curation, S.T. and B.Z.; Investigation, Y.S.; Writing—original draft, W.J.; Writing—review and editing, D.M. and F.J. All authors have read and agreed to the published version of the manuscript.

Funding

This work was implemented under financial support from the National Natural Science Foundation of China (No. 51706091), The Scientific Research Funds Project of Liaoning Education Department (No. L2019047, L2019026), LiaoNing Revitalization Talents Program (No. XLYC2007143).

Institutional Review Board Statement

Not applicable for our work.

Informed Consent Statement

Not applicable for our work.

Data Availability Statement

Not applicable for our work.

Conflicts of Interest

The authors declare no conflict of interest.

References

  1. Wang, H.; Yuan, B.; Hao, R.; Zhao, Y.; Wang, X.J. A critical review on the method of simultaneous removal of multi-air-pollutant in flue gas. Chem. Eng. J. 2019, 378, 122–155. [Google Scholar] [CrossRef]
  2. Wang, Y.; Li, X.; Zhan, L.; Li, C.; Qiao, W.; Ling, L.J.I.; Research, E.C. Effect of SO2 on Activated Carbon Honeycomb Supported CeO2–MnOx Catalyst for NO Removal at Low Temperature. Ind. Eng. Chem. Res. 2015, 54, 2274–2278. [Google Scholar] [CrossRef]
  3. Tseng, C.-C.; Li, C.-J. Eulerian-Eulerian numerical simulation for a flue gas desulfurization tower with perforated sieve trays. Int. J. Heat Mass Transf. 2018, 116, 329–345. [Google Scholar] [CrossRef]
  4. Cordoba, P.; Staicu, L.C. Flue gas desulfurization effluents: An unexploited selenium resource. Fuel 2018, 223, 268–276. [Google Scholar] [CrossRef]
  5. Guo, Y.; Li, Y.; Zhu, T.; Ye, M. Investigation of SO2 and NO adsorption species on activated carbon and the mechanism of NO promotion effect on SO2. Fuel 2015, 143, 536–542. [Google Scholar] [CrossRef]
  6. Wu, X.; Yu, X.; He, X.; Jing, G. Insight into low-temperature catalytic NO reduction with NH3 on Ce-doped manganese oxide octahedral molecular sieves. J. Phys. Chem. Chem. 2019, 123, 10981–10990. [Google Scholar] [CrossRef]
  7. Sabna, V.; Thampi, S.G.; Chandrakaran, S.J.E.; Safety, E. Adsorption of crystal violet onto functionalised multi-walled carbon nanotubes: Equilibrium and kinetic studies. Ecotoxicol. Environ. Saf. 2016, 134, 390–397. [Google Scholar] [CrossRef]
  8. Rahimi, M.; Singh, J.K.; Muller-Plathe, F. CO2 adsorption on charged carbon nanotube arrays: A possible functional material for electric swing adsorption. J. Phys. Chem. Chem. 2015, 119, 15232–15239. [Google Scholar] [CrossRef]
  9. Li, Q.; Yang, H.; Qiu, F.; Zhang, X. Promotional effects of carbon nanotubes on V2O5/TiO2 for NOx removal. J. Hazard. Mater. 2011, 192, 915–921. [Google Scholar] [CrossRef]
  10. Yoosefian, M.; Zahedi, M.; Mola, A.; Naserian, S. A DFT comparative study of single and double SO2 adsorption on Pt-doped and Au-doped single-walled carbon nanotube. Appl. Surf. Sci. 2015, 349, 864–869. [Google Scholar] [CrossRef]
  11. Li, S.; Liu, Y.; Gong, H.; Wu, K.-H.; Ba, H.; Duong-Viet, C.; Jiang, C.; Pham-Huu, C.; Su, D.J. N-doped 3D mesoporous carbon/carbon nanotubes monolithic catalyst for H2S selective oxidation. ACS Appl. Nano Mater. 2019, 2, 3780–3792. [Google Scholar] [CrossRef]
  12. Yutong, F.; Yu, S. CO2-adsorption promoted CH4-desorption onto low-rank coal vitrinite by density functional theory including dispersion correction (DFT-D3). Fuel 2018, 219, 259–269. [Google Scholar] [CrossRef]
  13. Zhang, X.; Gao, B.; Creamer, A.E.; Cao, C.; Li, Y. Adsorption of VOCs onto engineered carbon materials: A review. J. Hazard. Mater. 2017, 338, 102–123. [Google Scholar] [CrossRef]
  14. Gupta, V.K.; Kumar, R.; Nayak, A.; Saleh, T.A. Adsorptive removal of dyes from aqueous solution onto carbon nanotubes: A review. Adv. Colloid Interface Sci. 2013, 193, 24–34. [Google Scholar] [CrossRef] [PubMed]
  15. Yan, Y.; Miao, J.; Yang, Z.; Xiao, F.-X.; Yang, H.B.; Liu, B.; Yang, Y. Carbon nanotube catalysts: Recent advances in synthesis, characterization and applications. Chem. Soc. Rev. 2015, 44, 3295–3346. [Google Scholar] [CrossRef] [PubMed]
  16. Wang, H.; Wu, Z.; Zhao, W.; Guan, B. Photocatalytic oxidation of nitrogen oxides using TiO2 loading on woven glass fabric. Chemosphere 2007, 66, 185–190. [Google Scholar] [CrossRef] [PubMed]
  17. Leary, R.; Westwood, A. Carbonaceous nanomaterials for the enhancement of TiO2 photocatalysis. Carbon 2011, 49, 741–772. [Google Scholar] [CrossRef]
  18. Seekaew, Y.; Wisitsoraat, A.; Phokharatkul, D.; Wongchoosuk, C.J. Room temperature toluene gas sensor based on TiO2 nanoparticles decorated 3D graphene-carbon nanotube nanostructures. Sens. Actuators B Chem. 2019, 279, 69–78. [Google Scholar] [CrossRef]
  19. Yi, Q.; Wang, H.; Cong, S.; Cao, Y.; Wang, Y.; Sun, Y.; Lou, Y.; Zhao, J.; Wu, J.; Zou, G.J. Self-cleaning glass of photocatalytic anatase TiO 2@ carbon nanotubes thin film by polymer-assisted approach. Nanoscale Res. Lett. 2016, 11, 1–8. [Google Scholar] [CrossRef] [Green Version]
  20. Saleh, T.A.; Gupta, V.K. Photo-catalyzed degradation of hazardous dye methyl orange by use of a composite catalyst consisting of multi-walled carbon nanotubes and titanium dioxide. J. Colloid Interface Sci. 2012, 371, 101–106. [Google Scholar] [CrossRef]
  21. Awfa, D.; Ateia, M.; Fujii, M.; Johnson, M.S.; Yoshimura, C.J. Photodegradation of pharmaceuticals and personal care products in water treatment using carbonaceous-TiO2 composites: A critical review of recent literature. Water Res. 2018, 142, 26–45. [Google Scholar] [CrossRef] [PubMed]
  22. Wang, H.; Dong, S.; Chang, Y.; Faria, J.L. Enhancing the photocatalytic properties of TiO2 by coupling with carbon nanotubes and supporting gold. J. Hazard. Mater. 2012, 235, 230–236. [Google Scholar] [CrossRef]
  23. Zhang, F.-J.; Oh, W.-C.; Choi, J.-G.; Zhang, K.; Meng, Z.-D.; Chen, M.-L. Photoelectrocatalytic degradation of methylene blue over M-CNT/TiO2 (M= Y, Ag, and Pt) composite electrodes. Fuller. Nanotub. Carbon NanoStruct. 2011, 19, 564–574. [Google Scholar] [CrossRef]
  24. Shaari, N.; Tan, S.; Mohamed, A.J. Synthesis and characterization of CNT/Ce-TiO2 nanocomposite for phenol degradation. J. Rare Earths 2012, 30, 651–658. [Google Scholar] [CrossRef]
  25. Chen, M.-L.; Oh, W.-C. Photodegradation of organic dyes over nickel distributed CNT/TiO2 composite synthesized by a simple sol-gel method. Mater. Sci. Pol. 2011, 29, 112–120. [Google Scholar] [CrossRef]
  26. Liu, H.; Yu, X.; Yang, H. The integrated photocatalytic removal of SO2 and NO using Cu doped titanium dioxide supported by multi-walled carbon nanotubes. Chem. Eng. J. 2014, 243, 465–472. [Google Scholar] [CrossRef]
  27. Bao, J.; Dai, Y.; Liu, H.; Yang, L. Photocatalytic removal of SO2 over Mn doped titanium dioxide supported by multi-walled carbon nanotubes. Int. J. Hydrog. Energy 2016, 41, 15688–15695. [Google Scholar] [CrossRef]
  28. Yanchun, Y.; Fengrui, J.; Weiwei, J.; Shaopeng, Z.; Danzhu, M.; Guangxin, L. Influence of Cr3+ Concentration on SO2 Removal over TiO2 Based Multi-walled Carbon Nanotubes. China Pet. Process. Petrochem. Technol. 2019, 21, 23. [Google Scholar]
  29. Ren, X.; Chen, C.; Nagatsu, M.; Wang, X. Carbon nanotubes as adsorbents in environmental pollution management: A review. Chem. Eng. J. 2011, 170, 395–410. [Google Scholar] [CrossRef]
  30. Gao, B.; Chen, G.Z.; Puma, G.L. Carbon nanotubes/titanium dioxide (CNTs/TiO2) nanocomposites prepared by conventional and novel surfactant wrapping sol–gel methods exhibiting enhanced photocatalytic activity. Appl. Catal. B Environ. 2009, 89, 503–509. [Google Scholar] [CrossRef]
  31. Li, Z.; Liu, J.; Wang, D.; Gao, Y.; Shen, J.J. Cu2O/Cu/TiO2 nanotube Ohmic heterojunction arrays with enhanced photocatalytic hydrogen production activity. Int. J. Hydrog. Energy 2012, 37, 6431–6437. [Google Scholar] [CrossRef]
  32. Sun, M.; Chen, W.-C.; Zhao, L.; Wang, X.-L.; Su, Z.-M. A PTA@ MIL-101 (Cr)-diatomite composite as catalyst for efficient oxidative desulfurization. Inorg. Chem. Commun. 2018, 87, 30–35. [Google Scholar] [CrossRef]
  33. Zhong, J.; Wang, Q.; Zhou, J.; Chen, D.; Ji, Z. Highly efficient photoelectrocatalytic removal of RhB and Cr (VI) by Cu nanoparticles sensitized TiO2 nanotube arrays. Appl. Surf. Sci. 2016, 367, 342–346. [Google Scholar] [CrossRef]
  34. Chauhan, R.; Kumar, A.; Chaudhary, R.P. Structural and photocatalytic studies of Mn doped TiO2 nanoparticles. Spectrochim. Acta Part A Mol. Biomol. Spectrosc. 2012, 98, 256–264. [Google Scholar] [CrossRef] [PubMed]
  35. Czech, B.; Buda, W.; Pasieczna-Patkowska, S.; Oleszczuk, P. MWCNT–TiO2–SiO2 nanocomposites possessing the photocatalytic activity in UVA and UVC. Appl. Catal. B Environ. 2015, 162, 564–572. [Google Scholar] [CrossRef]
  36. Wu, H.; Sun, J.; Qi, D.; Zhou, C.; Yang, H. Photocatalytic removal of elemental mercury from flue gas using multi-walled carbon nanotubes impregnated with titanium dioxide. Fuel 2018, 230, 218–225. [Google Scholar] [CrossRef]
  37. Everhart, B.M.; Baker-Fales, M.; McAuley, B.; Banning, E.; Almkhelfe, H.; Back, T.C.; Amama, P.B. Hydrothermal synthesis of carbon nanotube–titania composites for enhanced photocatalytic performance. J. Mater. Res. 2020, 35, 1451–1460. [Google Scholar] [CrossRef]
  38. Gui, M.M.; Chai, S.-P.; Mohamed, A.R. Modification of MWCNT@ TiO2 core–shell nanocomposites with transition metal oxide dopants for photoreduction of carbon dioxide into methane. Appl. Surf. Sci. 2014, 319, 37–43. [Google Scholar] [CrossRef]
  39. Doong, R.-A.; Liao, C.-Y.J.S.; Technology, P. Enhanced photocatalytic activity of Cu-deposited N-TiO2/titanate nanotubes under UV and visible light irradiations. Sep. Purif. Technol. 2017, 179, 403–411. [Google Scholar] [CrossRef]
  40. Kang, S.-T.; Seo, J.-Y.; Park, S.-H. The characteristics of CNT/cement composites with acid-treated MWCNTs. Adv. Mater. Sci. Eng. 2015, 2015, 308725. [Google Scholar] [CrossRef]
  41. Alotaibi, A.M.; Williamson, B.A.; Sathasivam, S.; Kafizas, A.; Alqahtani, M.; Sotelo-Vazquez, C.; Buckeridge, J.; Wu, J.; Nair, S.P.; Scanlon, D.O.; et al. Enhanced photocatalytic and antibacterial ability of Cu-doped anatase TiO2 thin films: Theory and experiment. ACS Appl. Mater. Interfaces 2020, 12, 15348–15361. [Google Scholar] [CrossRef] [Green Version]
  42. Li, X.; Mao, Y.; Leng, K.; Ye, G.; Sun, Y.; Xu, W.J.M.; Materials, M. Enhancement of oxidative desulfurization performance over amorphous titania by doping MIL-101 (Cr). Microporous Mesoporous Mater. 2017, 254, 114–120. [Google Scholar] [CrossRef]
  43. Bensouici, F.; Bououdina, M.; Dakhel, A.; Tala-Ighil, R.; Tounane, M.; Iratni, A.; Souier, T.; Liu, S.; Cai, W. Optical, structural and photocatalysis properties of Cu-doped TiO2 thin films. Appl. Surf. Sci. 2017, 395, 110–116. [Google Scholar] [CrossRef]
  44. Li, C.; Wang, T.; Zhao, Z.J.; Yang, W.; Li, J.F.; Li, A.; Yang, Z.; Ozin, G.A.; Gong, J. Promoted fixation of molecular nitrogen with surface oxygen vacancies on plasmon-enhanced TiO2 photoelectrodes. Angew. Chem. Int. Ed. 2018, 57, 5278–5282. [Google Scholar] [CrossRef] [PubMed]
  45. Liang, H.-C.; Li, X.-Z.; Yang, Y.-H.; Sze, K.-h. Effects of dissolved oxygen, pH, and anions on the 2, 3-dichlorophenol degradation by photocatalytic reaction with anodic TiO2 nanotube films. Chemosphere 2008, 73, 805–812. [Google Scholar] [CrossRef] [PubMed] [Green Version]
  46. Kansal, S.K.; Sood, S.; Umar, A.; Mehta, S.K. Photocatalytic degradation of Eriochrome Black T dye using well-crystalline anatase TiO2 nanoparticles. J. Alloys Compd. 2013, 581, 392–397. [Google Scholar] [CrossRef]
  47. Katal, R.; Masudy-Panah, S.; Tanhaei, M.; Farahani, M.H.D.A.; Jiangyong, H. A review on the synthesis of the various types of anatase TiO2 facets and their applications for photocatalysis. Chem. Eng. J. 2020, 384, 123384. [Google Scholar] [CrossRef]
  48. Wendt, S.; Matthiesen, J.; Schaub, R.; Vestergaard, E.K.; Lægsgaard, E.; Besenbacher, F.; Hammer, B. Formation and splitting of paired hydroxyl groups on reduced TiO 2 (110). Phys. Rev. Lett. 2006, 96, 066107. [Google Scholar] [CrossRef] [PubMed]
  49. Wang, H.; Liu, H.; Chen, Z.; Veksha, A.; Lisak, G.; You, C. Interaction between SO2 and NO in their adsorption and photocatalytic conversion on TiO2. Chemosphere 2020, 249, 126136. [Google Scholar] [CrossRef] [PubMed]
  50. Zhou, B.; Wang, T.; Xu, T.; Li, C.; Li, J.; Fu, J.; Zhang, Z.; Song, Z.; Ma, C. Comparative study on the preparation of powdered activated coke for SO2 adsorption: One-step and two-step rapid activation methods. Fuel 2021, 288, 119570. [Google Scholar] [CrossRef]
  51. Ammendola, P.; Raganati, F.; Chirone, R. CO2 adsorption on a fine activated carbon in a sound assisted fluidized bed: Thermodynamics and kinetics. Chem. Eng. J. 2017, 322, 302–313. [Google Scholar] [CrossRef]
  52. Huong, P.-T.; Lee, B.-K.J.M.; Materials, M. Improvement of selective separation of CO2 over N2 by transition metal–exchanged nano-zeolite. Microporous Mesoporous Mater. 2017, 241, 155–164. [Google Scholar] [CrossRef]
  53. Song, T.; Liao, J.-M.; Xiao, J.; Shen, L.-H. Effect of micropore and mesopore structure on CO2 adsorption by activated carbons from biomass. New Carbon Mater. 2015, 30, 156–166. [Google Scholar] [CrossRef]
  54. Coenen, K.; Gallucci, F.; Hensen, E.; van Sint Annaland, M. Kinetic model for adsorption and desorption of H2O and CO2 on hydrotalcite-based adsorbents. Chem. Eng. J. 2019, 355, 520–531. [Google Scholar] [CrossRef]
  55. Li, L.; Han, W.; Dong, F.; Zong, L.; Tang, Z.; Zhang, J. Controlled pore size of ordered mesoporous Al2O3-supported Mn/Cu catalysts for CO oxidation. Microporous Mesoporous Mater. 2017, 249, 1–9. [Google Scholar] [CrossRef]
  56. Feng, H.; Zhang, M.-H.; Liya, E.Y. Hydrothermal synthesis and photocatalytic performance of metal-ions doped TiO2. Appl. Catal. A Gen. 2012, 413, 238–244. [Google Scholar] [CrossRef]
  57. Xu, Y.-J.; Zhuang, Y.; Fu, X. New insight for enhanced photocatalytic activity of TiO2 by doping carbon nanotubes: A case study on degradation of benzene and methyl orange. J. Phys. Chem. C 2010, 114, 2669–2676. [Google Scholar] [CrossRef]
  58. Sun, W.; Meng, S.; Zhang, S.; Zheng, X.; Ye, X.; Fu, X.; Chen, S. Insight into the transfer mechanisms of photogenerated carriers for heterojunction photocatalysts with the analogous positions of valence band and conduction band: A case study of ZnO/TiO2. J. Phys. Chem. C 2018, 122, 15409–15420. [Google Scholar] [CrossRef]
  59. Li, W.; Li, D.; Lin, Y.; Wang, P.; Chen, W.; Fu, X.; Shao, Y. Evidence for the active species involved in the photodegradation process of methyl orange on TiO2. J. Phys. Chem. C 2012, 116, 3552–3560. [Google Scholar] [CrossRef]
  60. Baltrusaitis, J.; Jayaweera, P.M.; Grassian, V.H. Sulfur dioxide adsorption on TiO2 nanoparticles: Influence of particle size, coadsorbates, sample pretreatment, and light on surface speciation and surface coverage. J. Phys. Chem. C 2011, 115, 492–500. [Google Scholar] [CrossRef]
  61. Devahasdin, S.; Fan, C., Jr.; Li, K.; Chen, D.H. TiO2 photocatalytic oxidation of nitric oxide: Transient behavior and reaction kinetics. J. Photochem. Photobiol. A Chem. 2003, 156, 161–170. [Google Scholar] [CrossRef]
Figure 1. The schematic of the experimental system.
Processes 09 01823 g001
Figure 2. Transmission electron microscopy (TEM) images of different samples; (a) MWCNTs (100 nm); (b) acid-treated MWCNTs (20 nm); (c) MWCNTs/Cu-Cr-TiO2 (Cu/Cr = 3, 20 nm).
Processes 09 01823 g002
Figure 3. X-ray photoelectron spectroscopy (XPS) results of samples; (a) XPS spectra of MWCNTs/Cu-Cr-TiO2 (Cu/Cr = 3); (b) XPS spectra of Cu 2p; (c) XPS spectra of Cr 2p.
Processes 09 01823 g003
Figure 4. X-ray diffraction (XRD) patterns of samples.
Processes 09 01823 g004
Figure 5. Diffuse reflectance spectra (DRS) of TiO2, MWCNTs/TiO2 and MWCNTs/Cu-Cr-TiO2 (Cu/Cr = 1, 2, 3, 4).
Processes 09 01823 g005
Figure 6. The effect of the doping ratio of Cu to Cr. (a) The adsorption of SO2; (b) the adsorption of NO.
Processes 09 01823 g006
Figure 7. Performance comparison of desulfurization and denitrification on different adsorbents.
Processes 09 01823 g007
Figure 8. (a) The effect of O2 concentration on SO2 adsorption performance; (b) the effect of O2 concentration on NO adsorption performance.
Processes 09 01823 g008
Figure 9. (a) The effect of H2O concentration on SO2 adsorption performance; (b) the effect of H2O concentration on NO adsorption performance.
Processes 09 01823 g009
Figure 10. (a) The effect of space velocity on SO2 adsorption performance; (b) the effect of space velocity on NO adsorption performance.
Processes 09 01823 g010
Figure 11. Adsorption-desorption cycles of adsorbent.
Processes 09 01823 g011
Figure 12. The results of different models. (a) Pseudo-first-order model for the adsorption of SO2; (b) pseudo-first-order model for the adsorption of NO; (c) pseudo-second-order model for the adsorption of SO2; (d) pseudo-second-order model for the adsorption of NO; (e) Bangham model for the adsorption of SO2; (f) Bangham model for the adsorption of NO; (g) Elovich model for the adsorption of SO2; (h) Elovich model for the adsorption of NO.
Processes 09 01823 g012aProcesses 09 01823 g012b
Figure 13. The reaction mechanism for the integrated removal of SO2 and NO.
Processes 09 01823 g013
Table 1. Different experiments in this work.
CaseO2 (%)H2O (%)Space Velocity
(h−1)
NO (mg·m−3)SO2 (mg·m−3)Samples
18510037361575MWCNTs/Cu-Cr-TiO2 (Cu/Cr = 1, 2, 3, 4)
20, 3, 6, 8510037361575MWCNTs/Cu-Cr-TiO2 (Cu/Cr = 3)
380, 1, 3, 510037361575MWCNTs/Cu-Cr-TiO2 (Cu/Cr = 3)
4851003, 1671, 2462, 33427361575MWCNTs/Cu-Cr-TiO2 (Cu/Cr = 3)
5851003736157510%MWCNTs/Cu-TiO2
6851003736157510%MWCNTs/Cr-TiO2
Table 2. The surface structures of different adsorbents.
Adsorbentsabcdefgh
Specific surface area (m2/g)22.980.2284.9243.8205.8188.9106.2403.7
Pore volume (cm3/g)0.05410.23430.28260.28240.29880.2811--
a–h: TiO2, MWCNTs/TiO2, MWCNTs/Cu-Cr-TiO2 (Cu/Cr = 1), MWCNTs/Cu-Cr-TiO2 (Cu/Cr = 2), MWCNTs/Cu-Cr-TiO2 (Cu/Cr = 3), MWCNTs/Cu-Cr-TiO2 (Cu/Cr = 4), MWCNTs/Cu-TiO2, MWCNTs/Cr-TiO2.
Table 3. Adsorption kinetics fitting parameters of SO2 adsorption on MWCNTs/Cu-Cr-TiO2.
Kinetic ModelCu/Cr = 1Cu/Cr = 2Cu/Cr = 3Cu/Cr = 4
Pseudo-first-order
lnqe3.40583.45043.60623.5131
k10.01460.01710.02860.0126
R20.99620.99460.99870.9858
Pseudo-second-order
qe30.139431.513636.827733.5530
k27.26 × 10−41.23 × 10−31.46 × 10−24.05 × 10⁻⁴
R20.72590.84530.89100.9856
Bangham
qe30.139431.513636.827733.5530
k35.49 × 10−34.88 × 10−35.13 × 10−32.74 × 10⁻³
n0.83411.04161.11151.1975
R20.99380.99650.99640.9936
Elovich
a1.00921.07711.27951.1172
b0.11220.11160.09870.1037
R20.99840.99580.99070.9928
Table 4. Adsorption kinetics fitting parameters of NO adsorption on MWCNTs/Cu-Cr-TiO2.
Kinetic ModelCu/Cr = 1Cu/Cr = 2Cu/Cr = 3Cu/Cr = 4
Pseudo-first-order
lnqe2.08052.30442.51302.4865
k11.16 × 10−28.93 × 10−31.09 × 10−21.16 × 10⁻²
R20.99450.98880.98550.9886
Pseudo-second-order
qe8.008810.018712.341312.0186
k29.65 × 10−32.96 × 10−35.98 × 10−33.87 × 10⁻³
R20.99580.98880.98020.9964
Bangham
qe8.008810.018712.341312.0186
k37.20 × 10−33.76 × 10−33.97 × 10−33.48 × 10⁻³
n0.86601.10741.34171.3185
R20.98740.99560.99540.9972
Elovich
a0.30750.35970.47540.4615
b0.38050.32380.28100.2723
R20.99760.99890.99760.9942
Publisher’s Note: MDPI stays neutral with regard to jurisdictional claims in published maps and institutional affiliations.

