Article

Measurement of Heat Transfer and Flow Resistance for a Packed Bed of Horticultural Products with the Implementation of a Single Blow Technique

1
Department of Heat Technology, Białystok University of Technology, Wiejska 45C, 15-351 Białystok, Poland
2
Key Laboratory of Thermal Science and Technology, Technical Institute of Physics and Chemistry, Chinese Academy of Sciences, Beijing 100190, China
*
Author to whom correspondence should be addressed.
Processes 2021, 9(12), 2151; https://doi.org/10.3390/pr9122151
Submission received: 25 October 2021 / Revised: 24 November 2021 / Accepted: 26 November 2021 / Published: 28 November 2021

Abstract

:
This paper provides the practical implementation of the single blow technique as an effective approach of average convective heat transfer coefficient measurement for a packed bed of horticultural products. The measurement approach was positively validated for the case of a packed bed of balls. The presented results cover heat transfer coefficient results for carrots stored in packed beds for two various arrangements (regular and irregular) and bed of apples under conditions of various turbulent intensity at the inlet to the bed. The turbulent intensity (defined as the ratio of the root mean square of the turbulent fluctuation of the air velocity to the mean air velocity) varied from 0.02 to 0.14. The applied velocity ranges for the tests refers to the conventional storage conditions. The heat transfer correlations were proposed based on the obtained results for each arrangement. It was demonstrated that due to flow laminarization inside the bed, the turbulence intensity has no significant effect on heat transfer inside the bed. Heat transfer enhancement of up to 25% was demonstrated for the case of the irregular carrot arrangement in the tested bed. The flow resistance correlations were additionally proposed for the tested beds. It was demonstrated that the product arrangement does not produce an important effect on the pressure drop.

1. Introduction

Knowledge of the mean surface heat transfer coefficient during cold storage of vegetables and fruits is important for the appropriate design of refrigerated storage chambers. Measurement of the surface heat transfer coefficient in a packed bed of horticultural products may be thought of as a complicated task. The main reason for complication is the irregular geometry of the tested objects. An additional complexity is caused by difficulties of the temperature distribution measurement at the products’ surface. This is related to the selection of possible fast and non-invasive approaches that should be applied in order to obtain accurate and reliable results. For this reason, it is difficult to directly apply the simplest methods based on direct measurement of the average surface temperature of horticulture products, temperature distribution of the air flowing between the products, and/or heat flux density.
The available relationships describing the heat transfer coefficient in packed beds, which can be found in the literature, were mainly developed for packed beds consisting of regular elements of simple geometries, such as flat plates, cylinders, balls, or cones [1,2,3].
In most CFD studies, the products’ shapes and sizes were simplified [4,5,6,7,8]. Even though it is possible to use a realistic shape of the product in CFD modelling, the spherical geometries are less problematic to be applied. Numerical simulation of full crates of the products, which were extended to porous continuum used for modelling of large quantities of products in a stack, may be thought as a very effective approach as shown in [9]. Porous medium models are effectively applied in CFD modelling of packed beds [10,11]; therefore, the most appropriate measurement approach would also be based on the utilisation of the porous medium model. However, to the knowledge of the authors, such an approach is not available in the literature, which is the motivation for the research presented in this paper.
Several methods and measurement techniques are available and described in the literature, and they may be classified in several groups [12,13]. The commonly applied technique is the measurement of heat transfer for a single spherical element made of metal of high thermal conductivity that is located in the tested bed. For example, authors of [1] carried out the measurements with the use of heated aluminium balls inside which a temperature sensor (thermocouple) was placed. The packed bed is heated and then is placed in properly prepared boxes, then it is cooled down in the air stream. The heat transfer coefficient may be obtained on the basis of the energy balance (Equation (1)):
α A w ( T T f ) = ρ c p V d T d t
The obtained results were generalised by means of the following dimensionless relationship (Equation (2)):
N u = 2 + 3.78 Re 0.44 T u 0.33 Pr 0.33
where Tu is the intensity of turbulence. It is assumed that the heat transfer coefficient for all of the objects is the same as for the tested sphere. The next measurement approach uses naphthalene spheres that sublimate during air flow, and an analogy between mass and heat transfer was applied in this case [12]. Another method uses soaked porous balls placed in an air stream. During air flow, the temperature of the balls and their weight loss are measured, which enables the application of the simultaneous heat and mass transfer approach [13]. Another method applies heating and cooling of the tested bed; during air flow, an unsteady temperature profile is measured, which allows indirect information on the heat transfer coefficient based on the proposed heat transfer model to be obtained [12]. The semi-empirical method was also applied for the measurement of the mean heat transfer coefficient for the stack composed of regular objects. This method consists of measurement of the average heat transfer for an individual element of a regular shape and recalculation of heat transfer using the appropriate heat transfer correlations developed for a tested element [13]. Then, the heat transfer correlations obtained in the experiment should be transferred to the entire bed consisted of the elements of a regular shape. Investigations of heat transfer in packed beds were also carried out by [14]. These authors presented results for a bed consisting of spherical elements, but heat transfer between the packed bed and the container wall was also taken into account. The bed consisted of the same spherical elements and thermal sensors that were placed between them. In the paper [15] the effects of natural convection in a packed bed of spherical elements was additionally taken into account. It should be noted that the detailed summary of heat transfer coefficient prediction approaches for food products along with the existing heat transfer correlations includes ASHRAE Handbook - Refrigeration [16]. However, the discussed relationships were obtained by means of various approaches and under various heat transfer conditions, which is the reason for possible differences between the actual heat transfer rate and predicted values.
Łapiński et al. [17] proposed the development of the single blow method for the measurement of the convective heat transfer coefficient for vegetables stored in a packed bed. The first application of the proposed method was demonstrated for the case carrot packed bed. The results in the above work assessed the potential applicability of the method and opened the possibility of developing further research. Due to unique features of the single blow method as a very fast and non-invasive approach, the further aspects of the heat transfer process may be investigated, namely the effects of the turbulence intensity of air flowing into the bed of the stored foodstuff as well as various arrangements of the products inside the bed (regular or irregular). The above is the motivation of the research investigations presented in this paper (see the Graphical Abstract). Products’ arrangement and the turbulent intensity of air at the inlet to the bed were studied. The effects of various air humidity conditions for the heat transfer rate were also included by means of the Prandtl number Pr of air. The results of the pressure drop for the packed bed of tested products are also presented.

2. Methodology

2.1. Single Blow Technique and Modelling Approach

The single blow method may be thought of as an effective approach for the measurement of the average surface heat transfer coefficient for the case of the packed bed consisting of both regular and irregular shapes. It should also be noted that for most gases, the Prandtl number Pr is of the order of unity, so the temperature level during tests dedicated for various applications (both high and low temperatures) does not play an important role in the investigated forced convection heat transfer process. Therefore, tests were carried out for moderate temperature changes from the ambient thermal conditions, usually up to 10 °C.
In the applied single blow method, air at a constant temperature is blown at the tested packed bed as shown in Figure 1. The experimental tunnel walls are well insulated, and flow developed inside the tunnel is fairly uniform due to the application of the flow rectifier. Therefore, heat transfer in the radial direction is minimized and both flow as well as heat transfer may be treated as a one-dimensional process. The air velocity, temperature, humidity, and turbulence intensity of air at the inlet to the tested bed are measured. The change in temperature of the flowing air at the inlet is caused by switching on the electric heater. Due to a product temperature difference between air and the tested packed bed, the unsteady heat transfer occurs with resulting temperature changes at the bed outlet. The convective heat transfer coefficient is determined by means of comparison of the actual air temperature profile measured at the outlet of the tested bed with the predicted temperature profile determined based on the theoretical model. The single blow method requires recording of the air temperature profile directly at the tested bed inlet and outlet. The air flow rate should be fixed during the measurement as well as a constant and uniform air temperature is required at the inlet to the tested bed.
The measured temperature leap or profile at the inlet to the tested bed is taken as the boundary condition for the heat transfer model. The temperature profiles that are measured at the section behind of the test bed should be predicted based on a model in which the heat transfer coefficient is assumed as a free parameter. To compare the temperature profiles obtained from the measurement and the theoretical prediction, several equivalent methods may be applied. General discussion concerning the possible approaches of the comparison techniques dedicated for the single blow technique is provided in the paper [18].
Concerning the theoretical model that describes heat transfer in the packed bed, it should be as simple as possible to allow a reduction of the computational cost required for the treatment of a large amount of experimental data. However, it should be also enough to accurately match the experimental data to the theoretical prediction. The main assumption of the proposed approach is that the tested packed bed is assumed to be a porous body.
The one-dimensional model of transient heat transfer between a porous body and a fluid flowing through it was firstly proposed by [19]. This model may be thought of as a basis for further developed numerous theoretical models that reduce part of the assumed simplifications. One of the reasons for the possible inaccuracy in the determination of the heat transfer coefficient by the single blow method with the use of this model is the difficulty in the generation of the temperature jump at the inlet of the tested packed bed due to imperfect operation of the electric heater and additional thermal effects in the test tunnel at the inlet section. As a consequence, the predicted temperature profiles at the outlet of the tested bed do not accurately correspond with the measurement data. This requires the application of a more accurate model that takes into account the inlet temperature profile, which may be identified experimentally. A model of convective heat transfer in a porous body that considers the above effect was proposed by authors of [20]. These authors proposed an equation for a dimensionless temperature profile at the bed inlet as an exponential function as follows (Equation (3)):
θ ( τ , 0 ) = 1 exp τ / τ h .
Taking into account the above initial and appropriate boundary conditions, authors of [20] obtained the following analytical solution for the unsteady temperature at the outlet of the porous body that may be formulated in the dimensionless form:
(a)
For τ < τi (i.e., for t < L/wf), the temperature jump did not reach the tested bed outlet, therefore (Equation (4)):
θ τ , N T U = 0 ,
(b)
For τ ≥ τi (i.e., tL/wf), the fluid temperature variations are described by the following analytic solution (Equation (5)):
θ τ , N T U = 1 τ h τ i τ e ( τ η ) / τ h β τ i e ( η τ i ) I 0 2 β τ i ( η τ i ) + + 0 η τ i e ξ I 0 2 β τ i ξ d ξ d η .
The above model was preliminary verified for the case of a packed bed of vegetables. It was demonstrated [17] that under the tested conditions, the following heat transfer correlation proposed by [3] for the case of the packed bed consisting of the elements of the conical shape may be thought of as a reasonable approach (Equation (6)):
N u = 0.31 Re 0.62 1 + 0.90 T u Re 0.04 .
Since the conical shape may be thought of as the best geometry for the case of tested carrots, the obtained results may be thought of as a positive evaluation of the proposed measurement methodology of the mean heat transfer coefficient for the packed bed of vegetables.
However, no systematic investigations for the packed bed of horticultural products under various conditions of bed arrangement and turbulence intensity were investigated to date with this method, which is the motivation for the present paper. Systematic measurements for the case of a carrot and apple packed bed were carried out and reported in the present paper under conditions of various turbulence intensity of air at the inlet to the tested bed and two bed arrangements for the case of carrot.

2.2. Test Apparatus and Procedure

The experimental part of the single blow method in the application to the measurement of the average convective heat transfer coefficient in a packed bed of horticultural products is carried out in a specially prepared test tunnel at the Bialystok University of Technology. The test stand was equipped with a measurement system that enables the measurement of the following parameters: temperature, pressure, air humidity, and air velocity. The schematic of the test tunnel is shown in Figure 2, and the view of the equipment applied at the inlet and outlet test sections is shown in Figure 3.
The experimental stand was divided into four sections as shown in Figure 2, namely:
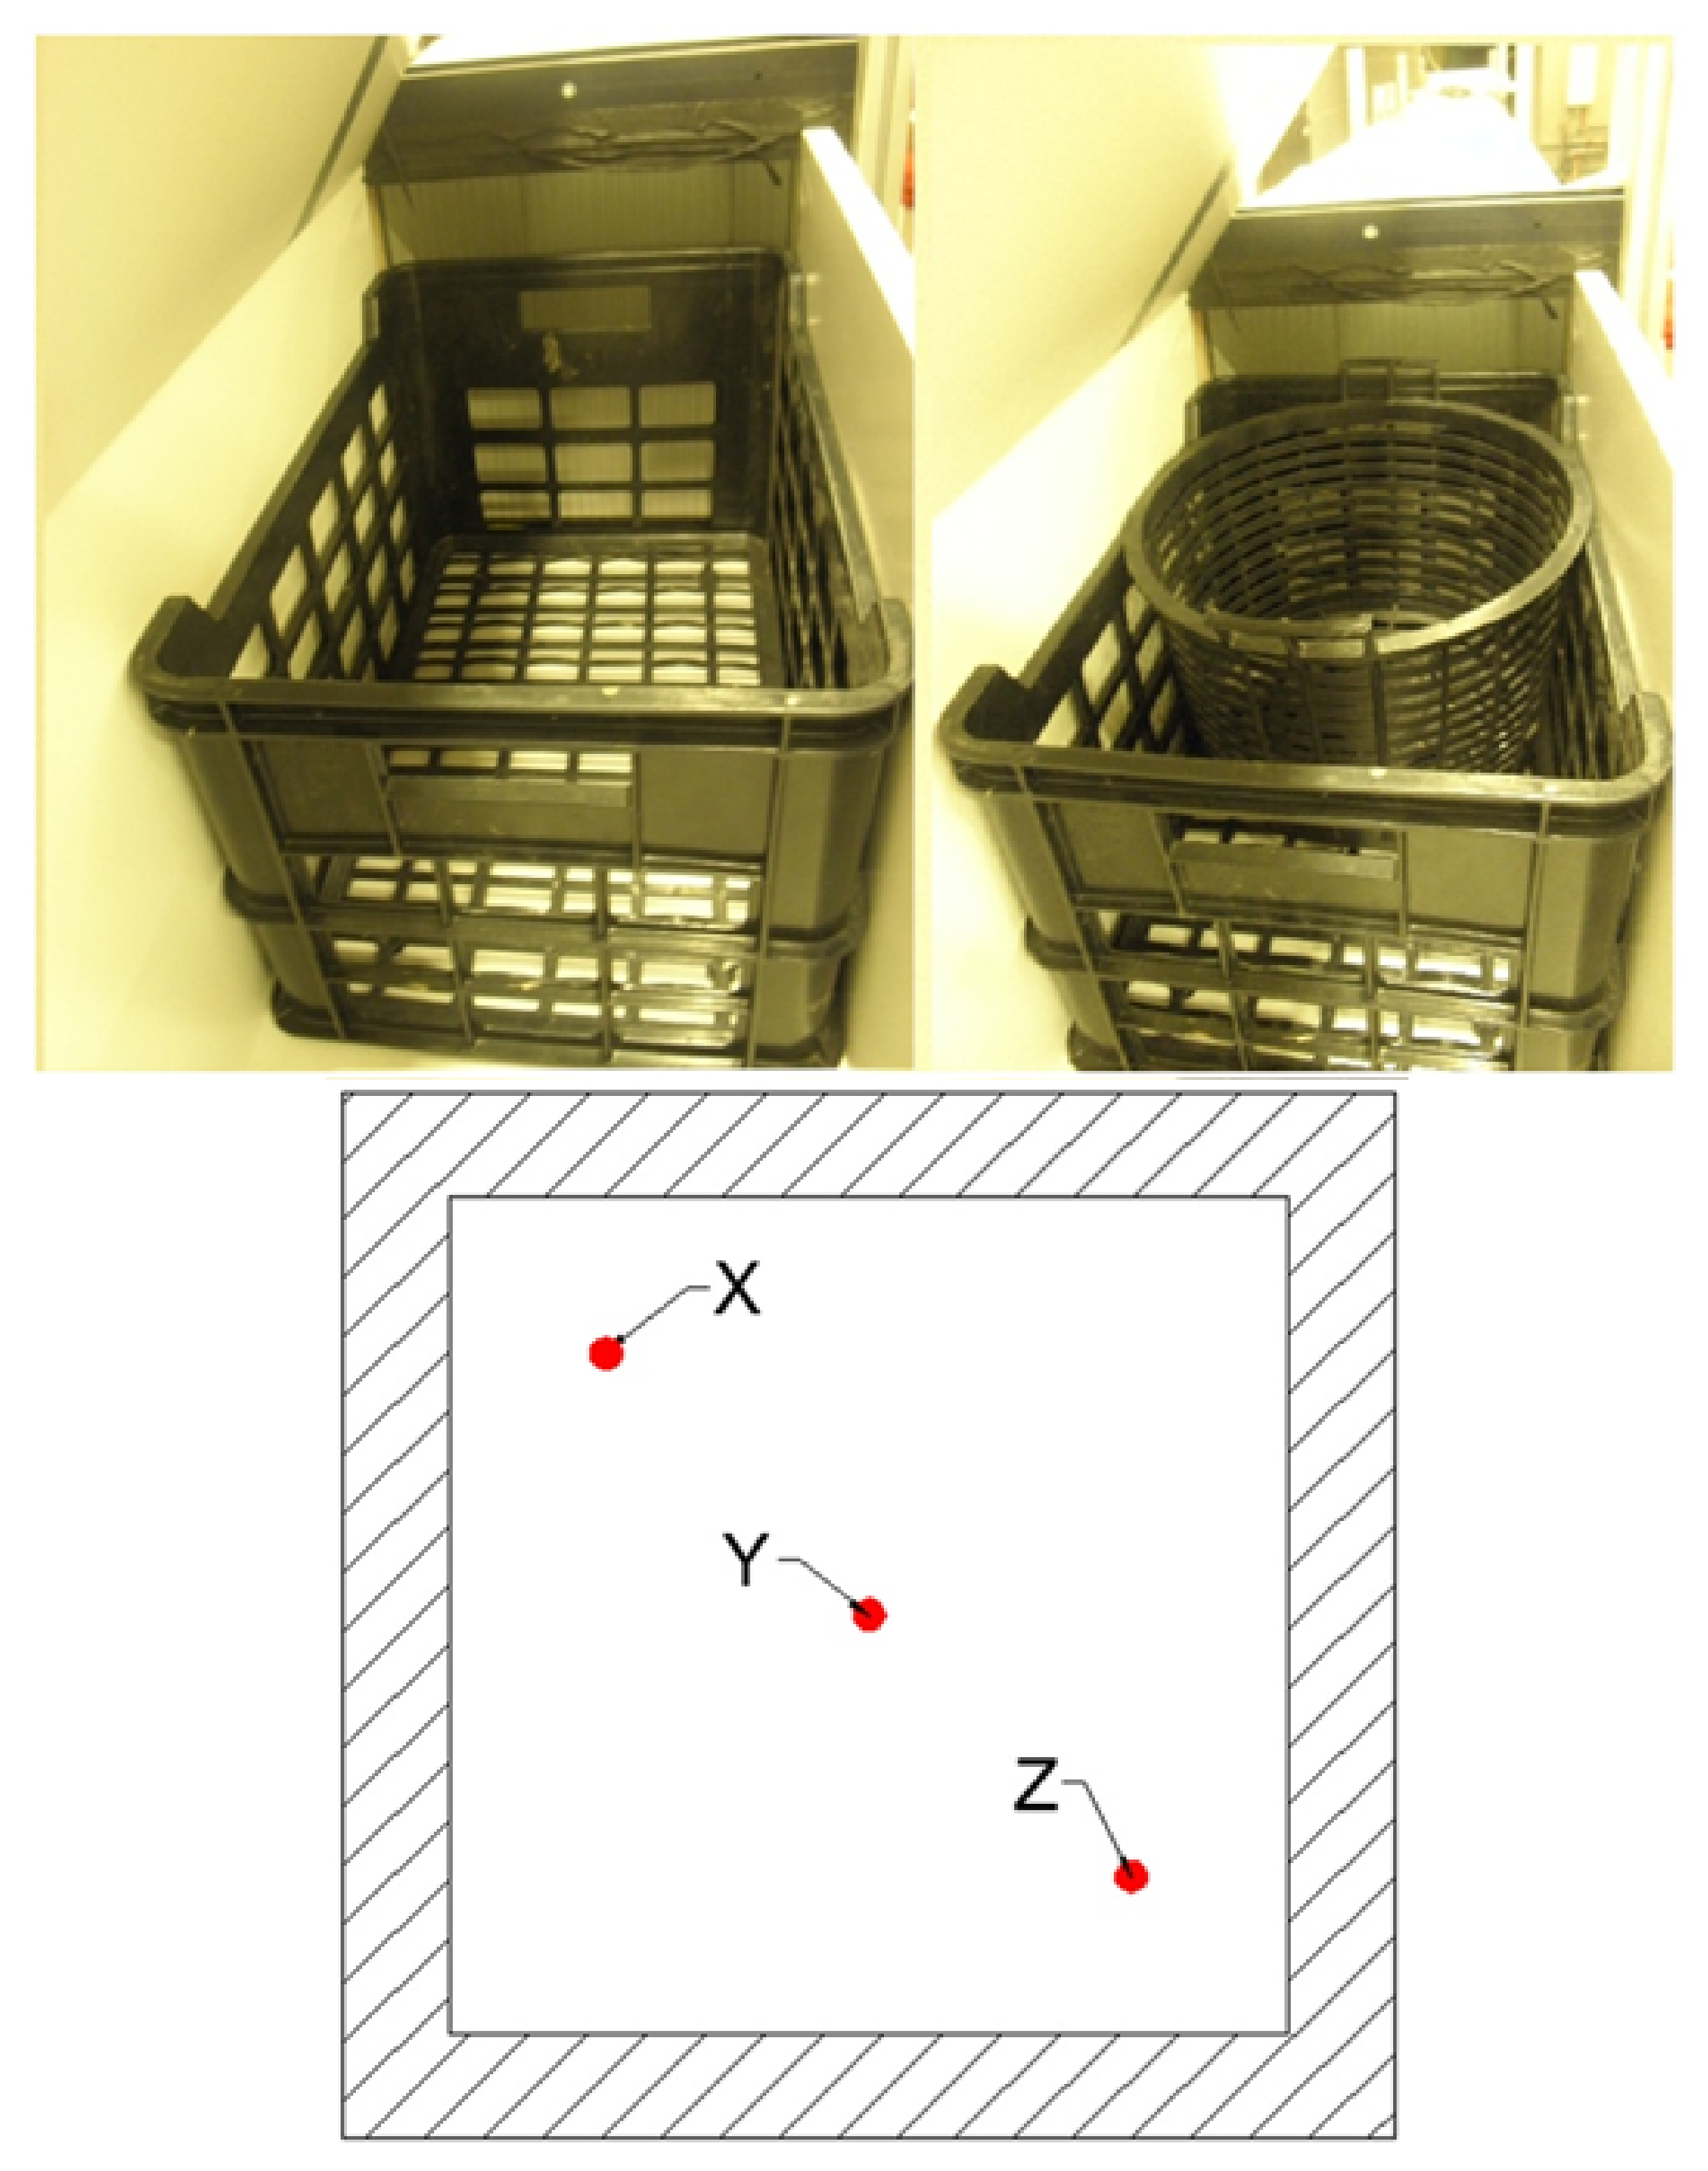
  • First section: flow intake, flow rectifier (Figure 3), and inlet measurement section;
  • Second section: the inlet to the test section fitted with the confusor;
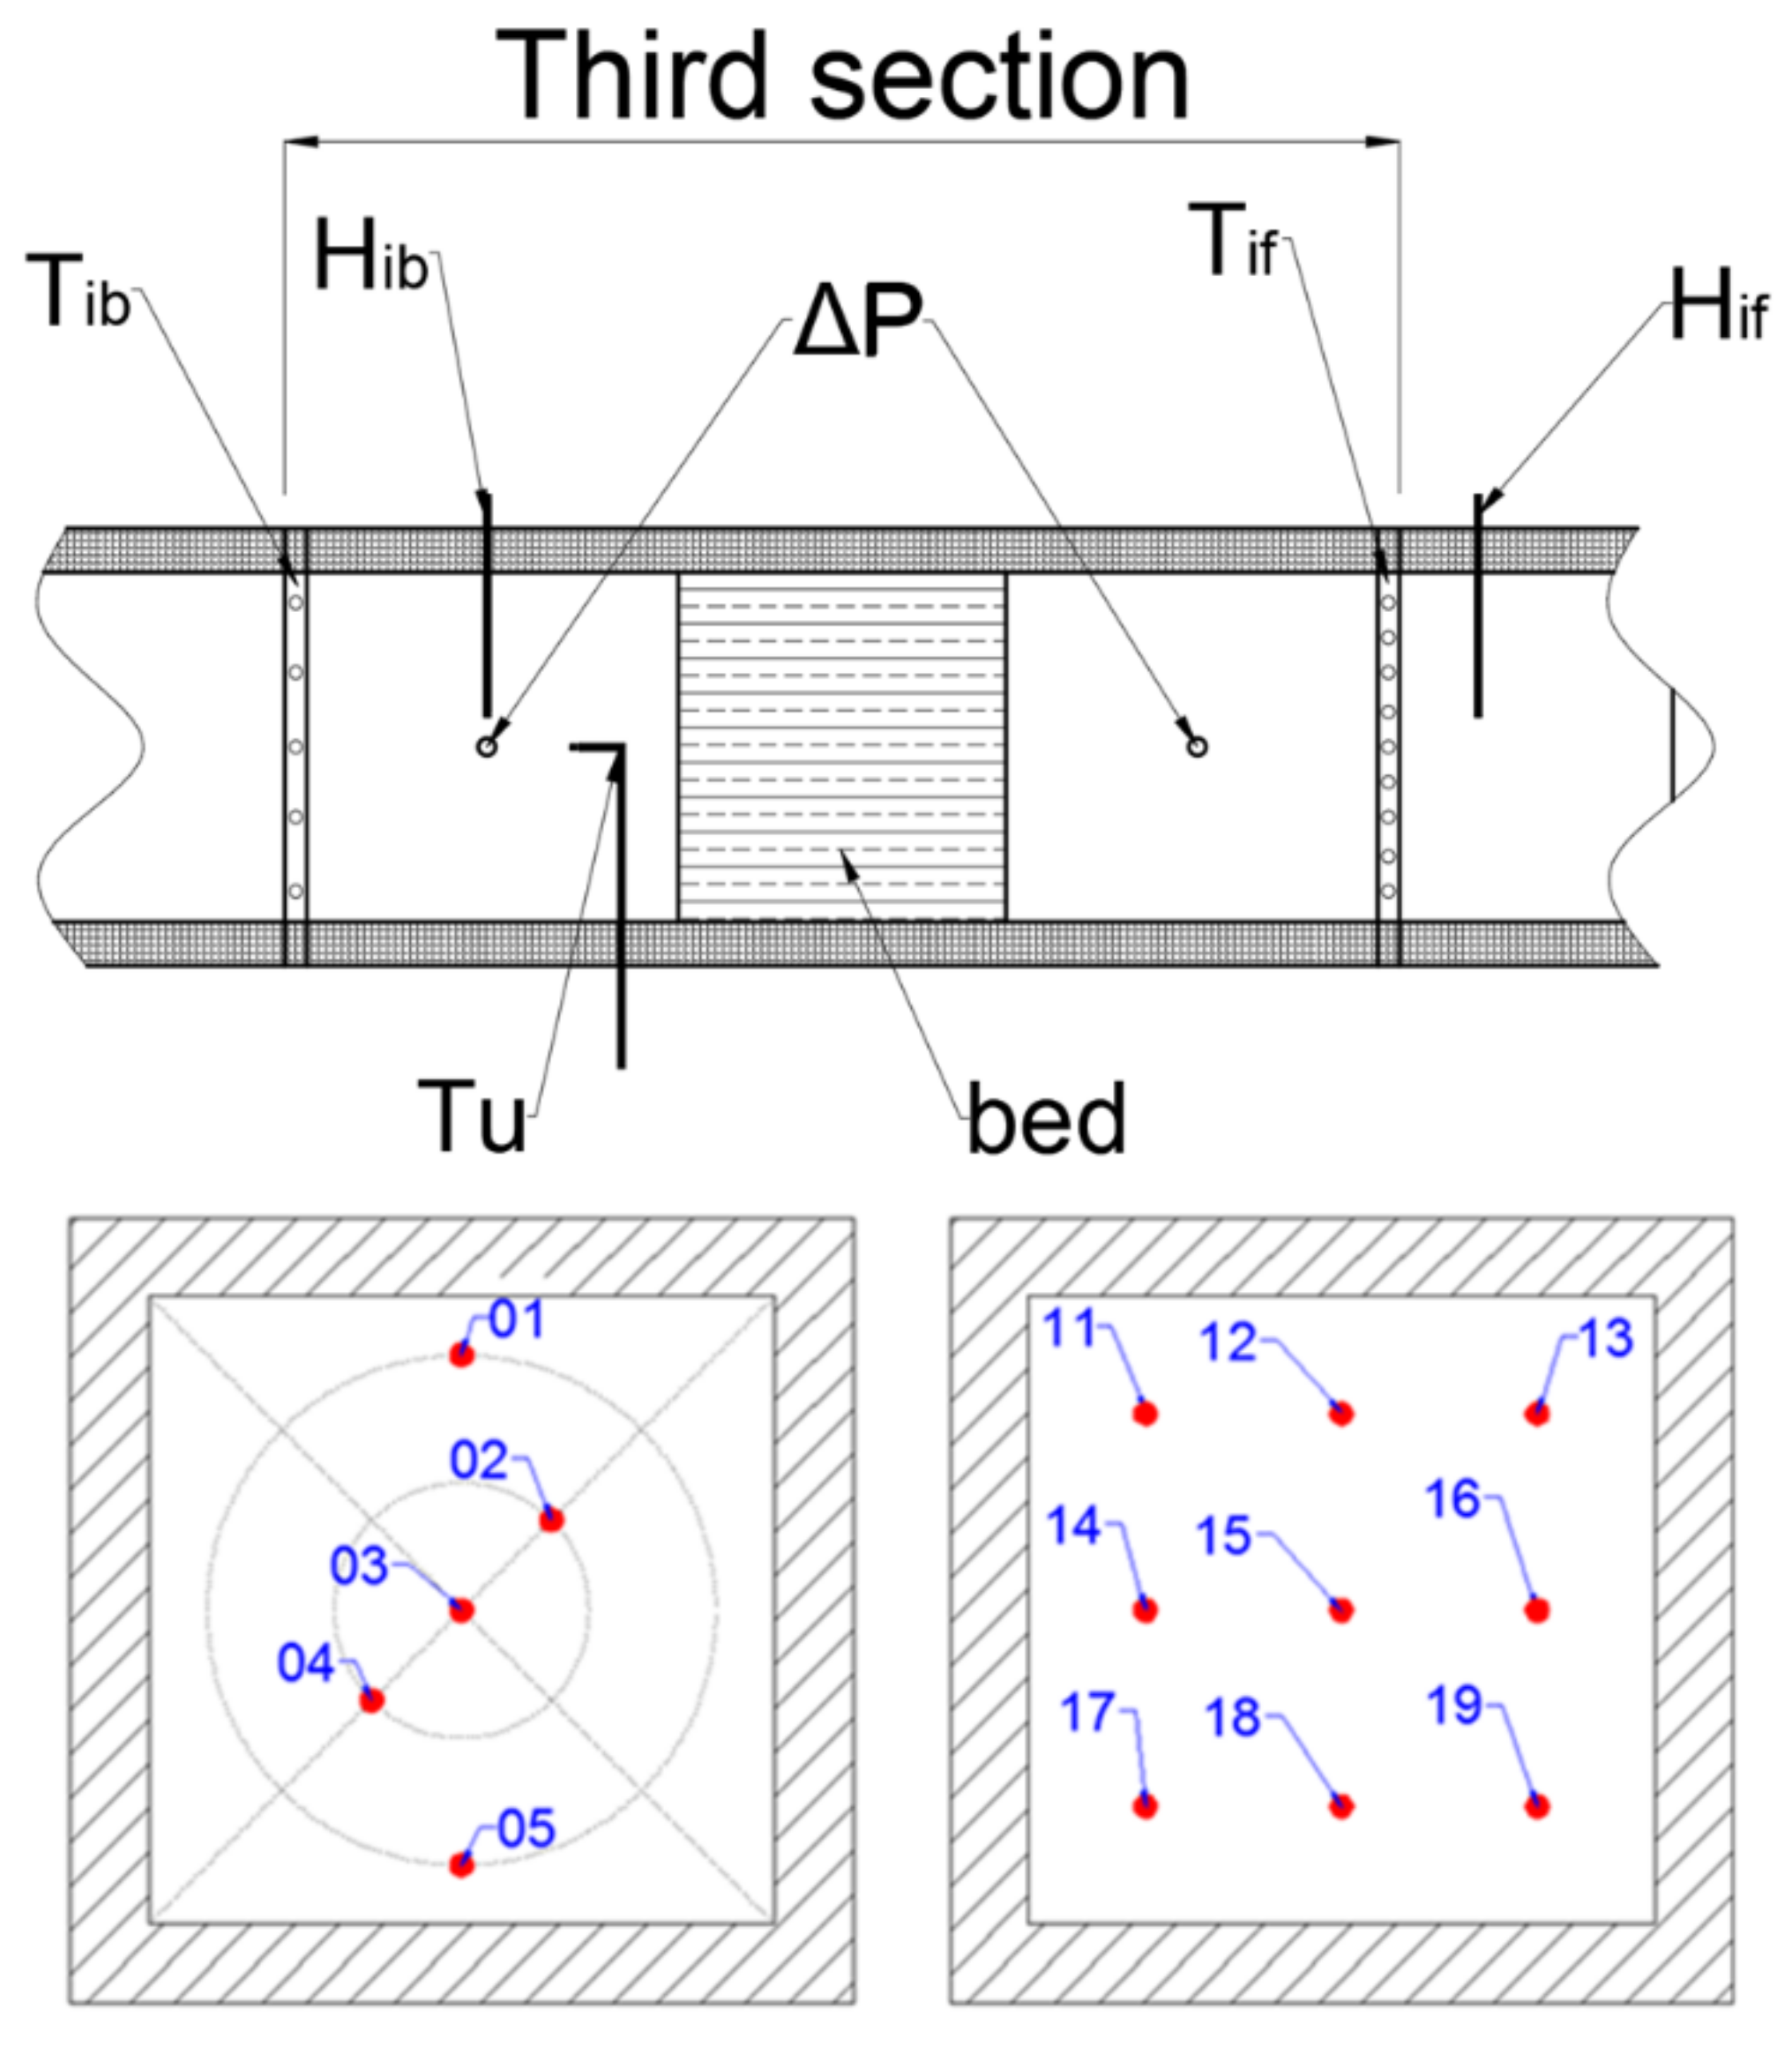
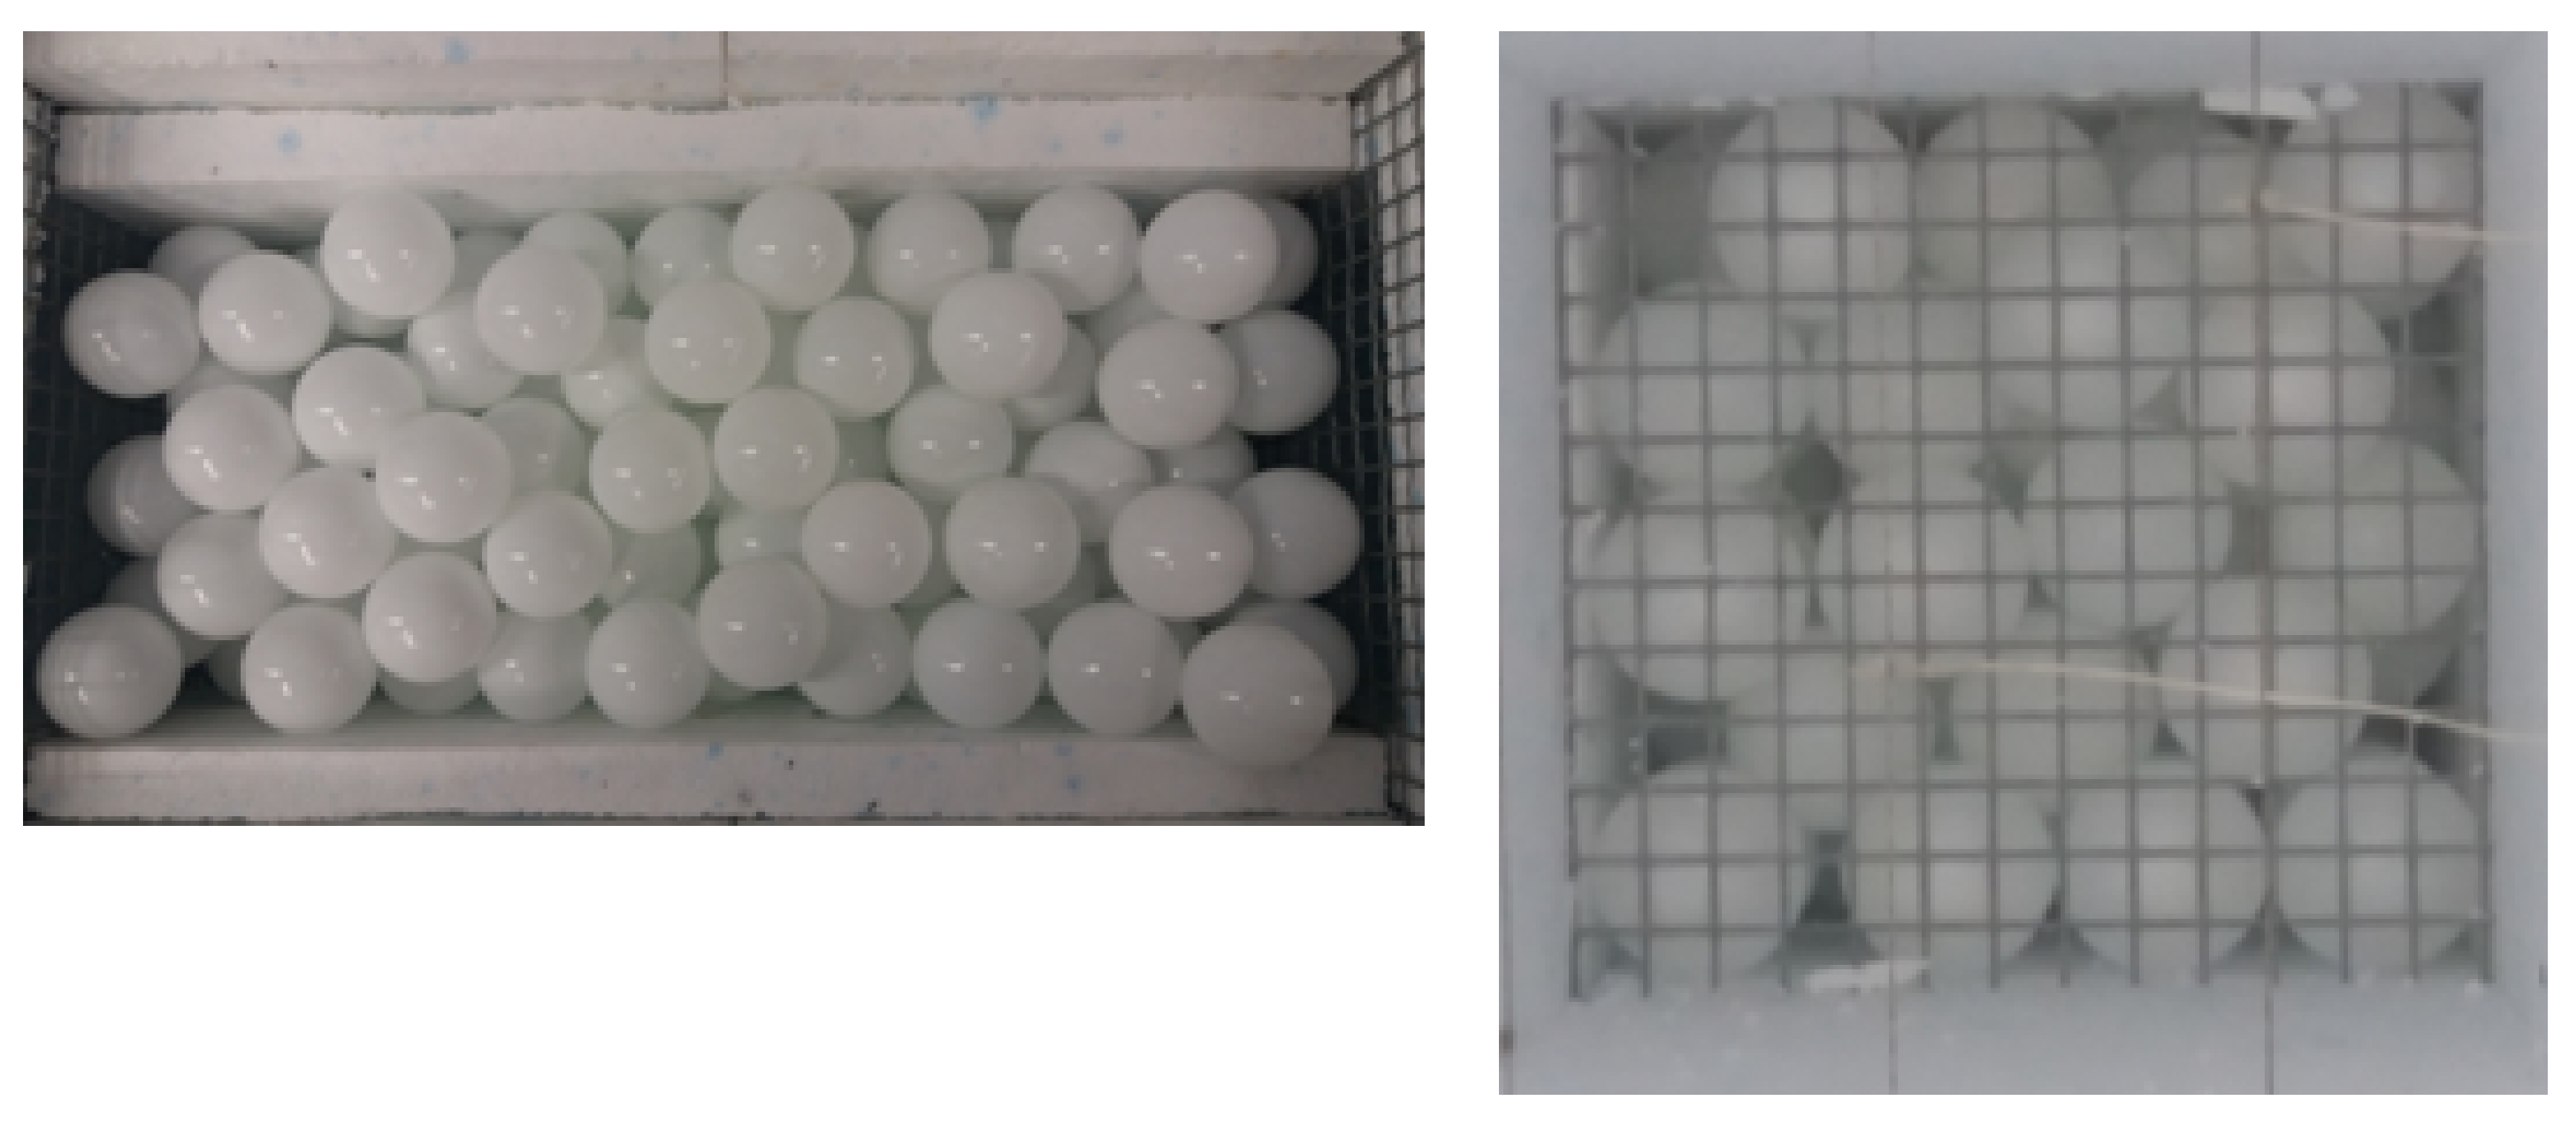
  • Third section: the measurement section with the tested packed bed and inlet and outlet thermocouples mesh structures, see Figure 3;
  • Fourth section: outlet fitted with the diffuser and the outflow fan.
The applied electric heater was individually designed to create conditions for a sharp increase of the air temperature at the inlet of the tunnel by 5–10 °C above the ambient temperature. The electric heater was designed so that the time constant of the temperature rise was as short as possible (below 10 s for the lowest air velocity). The requirement of the single blow method is the steady state air flow at the inlet to the tested bed section. Therefore, in the test tunnel at the inlet part, the air rectifier with honeycomb openings was applied. The air stream steering wheel was equipped with wires, which are used to measure the dynamic pressure. By means of this apparatus, it is possible to determine the air flow rate and by this air velocity, as shown in Figure 3. In addition, the tunnel was equipped with the sensors DeltaOhm HD 103T.0 for air velocity measurement (Figure 3) by means of the hot wire method. The accuracy of the instruments used to measure the air velocity was ±0.1 m s−1 for the range 0–1 m s−1 and ±0.4 m s−1 for the range 1–5 m s−1.
The thermocouples of the type of TP201 J of the diameter 0.5 mm were applied. The thermocouples of the open junction type were applied, which enabled the lowest possible thermal inertia. The thermocouples were calibrated for three temperature levels with use of the calibrated Pt100 sensor. The maximum difference between calibration sensor readings and thermocouples readings did not exceed ±0.15 K. The location of the thermocouples used to measure the temperature distribution at the inlet and the outlet to the tested bed section is shown in Figure 4. During the experiment, the relative humidity (RH) of the air at the inlet to the bed was also measured. To measure the relative humidity, sensors E+E 33 (Figure 3) were used with an accuracy ± 1.3% RH in the range of 0–90% RH. The section of the tested bed had the following internal dimensions: width 0.320 m, height 0.320 m, and length 0.600 m.
The packed bed geometry was determined for each of the bed arrangements individually, as shown in Table 1. The tested carrots and apples were divided into particular weight groups in order to determine the accurate geometry of the tested bed. The tested carrots were classified by weight every 5 g, while the tested apples were classified by weight every 10 g. Then, in each weight group, the piece of the average weight of the group was selected and the geometrical parameters were determined. For each selected element, the height and diameters along the element height were measured every 5 mm. Based on the measured lengths and diameters, 3D models of the tested products were made, which allowed the determination of the actual surface of the tested vegetables and fruits. The results of these measurements are presented in Table 1. The averaged geometry of the tested carrots and apples is presented in Table 2.
The experimental measurements of the surface heat transfer coefficient were performed for a packed carrot bed and apple beds. Carrot bed measurements were made at two different vegetables arrangements: irregular and longitudinal (Figure 5).
However, due to the shape of apples for this bed, measurements were made for only one arrangement (Figure 5). Within the geometry that is necessary to determine the average heat transfer coefficient in a packed bed, the mean hydraulic diameter of the channel through which the air flows inside the bed has to be calculated. On the basis of the identified dimensions of the products (Table 1) and resulting porosity, the averaged geometry was found (Table 2). On this basis, the packed bed of products was treated as a homogeneous bed with a hydraulic diameter calculated according to the following formula (Equation (7)):
D h = 4 A p U p = 4 V p A p = 4 ε a .
The effect of the inlet air turbulence intensity was investigated. The turbulence intensity Tu is defined as the ratio of the root mean square of the turbulent fluctuation of air velocity to the mean air velocity (Equation (8)):
T u = w r m s w a v .
where (Equation (9)):
w a v = 1 N 1 N w i ; w r m s = 1 N 1 1 N w i w a v 2 0.5 .
The measurements covered three levels of the turbulence intensity Tu at the inlet to the tested bed section. The turbulence measurement was made using the specialized DANTEC Dynamics probe (StreamLine Pro anemometer). The turbulence level was measured using a the 2-directional 2D wire (Miniature Wire 2D Probe).
In order to generate various turbulence intensity of the air stream, the dedicated elements disturbing the air flow were applied in the first section of the tunnel. The disturbing elements were made of the storage boxes (see Figure 6), which were arranged in such a way that after the measurement, the generated level of the turbulence intensity was reproduced at the inlet under the same flow rate conditions.
The lowest level of the turbulence intensity was generated for the case of no disturbing elements inside the inlet section of the test tunnel. The measurements of turbulence were made at three different locations in the channel cross-section. The measurement points were arranged along the diagonal of the test tunnel (point X—1/5 of the diagonal length, point Y—center, point Z—4/5 of the diagonal length, as shown in Figure 6). The turbulence intensity measurement results for three various measurement locations are presented in Figure 7. In the case of the undisturbed flow, the turbulence intensity Tu = 0.02 was obtained; for the moderate disturbance conditions, Tu = 0.07 was obtained; and for the most intensive intensity of turbulence, Tu = 0.14 was obtained.
For validation of the single blow method used in these studies, the additional measurements were made with the bed consisting of the elements of simple geometry, i.e., spherical elements. The view of the tested bed is presented in Figure 8.
The results were compared with the heat transfer correlations developed by [1] for the spherical elements, as shown by Equation (2). The results for the spheres bed are presented in Figure 9. The comparison between the results of the experiment and [1] correlation is shown for two ranges of Reynolds numbers. In both investigated cases, the results of the experiments with the application of the proposed approach agrees fairly well with Equation (2), which may be thought of as the positive validation result. The maximum percentage error is 9.4%. Therefore, the proposed measurement approach was positively validated.

3. Measurements Results and Discussion

The reported experimental investigations were carried out for the packed beds consisting of carrots and apples. After processing the results obtained from the measurements using the geometry presented above, the results are presented in figures and tables.
It should be emphasised that the Reynolds number Rebed presented in most of the figures corresponds to the velocity calculated for the inside spaces of the packed carrot and apples bed while the velocity wf provided in Table 3 refers to the velocity at the bed inlet, i.e., at the test tunnel cross-section. For the section of the tunnel before the investigated bed, the Reynolds number range was Reib = 1300–11,000. Therefore, the tunnel operated under conditions from the transition range up to the turbulent flow range of air flow. The accurate values of Reynolds numbers for individual measurements are presented in Table 3. The comparison of the results of each bed, carrot, and apple experiment at three different levels of the turbulence intensity Tu is presented in Figure 10.
The effect of the carrot bed arrangement on the Nusselt number Nu is presented in Figure 11. The comparison of the heat transfer results for various tested bed arrangements and at various intensities of turbulence allowed analysis of the influence of these parameters.
As seen in Figure 11, in all tested cases of the packed bed, the turbulence intensity does not produce a significant effect on the Nusselt number. This may be attributed to laminarization of the air flow inside the bed: the range of Reynolds number at the inlet to the bed was Reib = 1300–11,000, which indicates a transitional and turbulent flow while the range of Reynolds number inside the bed was Rebed = 200–1700, which indicates laminar flow. The above range of the Reynolds number may be thought of as typical for practical applications of cold storage. It is seen that the effect of the bed arrangement is important for the heat transfer process. This effect was possible for investigation due to the application of the proposed non-invasive measurement approach, i.e., the single blow technique. In the case of the irregular arrangement of carrots in the bed, the heat transfer described by the Nusselt number Nu is more intensive when compared to the longitudinal bed arrangement, as shown in Figure 11. The heat transfer enhancement at the level of 10–25% was demonstrated for the tested packed bed of carrots.
On the basis of the obtained results, the generalized heat transfer dimensionless correlations were proposed using the Reynolds number Rebed and Prandtl number Pr, which is determined relative to the measured temperature and humidity, and the intensity of turbulence Tu. The proposed relationships were developed separately for each of the tested arrangements of the tested carrot and apple beds. For the case of the longitudinal carrot arrangement, the following correlation may be proposed (Equation (10)):
Nu = 0.0725 Re b e d 0.795 Pr 0.22 T u 0.018 .
For the above equation, the determination coefficient is R2 = 0.971. For the case of the irregular carrot arrangement, the following correlation is proposed (Equation (11)):
Nu = 0.377 Re b e d 0.591 Pr 0.25 T u 0.012 .
For the above equation, the determination coefficient is R2 = 0.943. For the case of the apples bed arrangement, the following correlation is proposed (Equation (12)):
Nu = 0.278 Re b e d 0.675 Pr 0.08 T u 0.006 .
For the above equation, the determination coefficient is R2 = 0.984. The above relationships were made on the basis of experimental data obtained for the following range of the dimensionless numbers: 200 < Rebed < 1700; 0.02 < Tu < 0.14; 0.7802 < Pr < 0.7826. The above range of the Prandtl number corresponds to humid air as heat transfer fluid, which is the most common case for practical implementation of proposed heat transfer correlations.
During the experiment, the pressure drop measurement was made, which allowed determination of the flow resistance through the tested beds. The Darcy friction factor was calculated from the Equation (13):
f D = D h L ρ f Δ p A p 2 m ˙ 2 ( K i + K o ) .
The loss coefficients Ki and Ko for the inlet and outlet to the bed section were calculated with use of the correlations proposed by [21].
The results of the tested flow resistances are presented in Figure 12.
For the case of the carrot packed bed, it is seen that the vegetable arrangement inside the bed affects the flow resistance factor only at the range of a very low Reynolds number. Although there were not many differences between these arrangements, the dimensionless correlations were proposed for the Darcy friction factor as a function of the Reynolds number and Prandtl number for both carrot bed arrangements separately. The proposed relationship for the longitudinal arrangement of carrots in the bed is (Equation (14)):
f D = 64453 Re b e d 1.626 Pr 0.20 .
For the above equation, the determination coefficient is R2 = 0.995. For the case of the irregular arrangement of carrot inside the tested bed (Equation (15)):
f D = 116934 Re b e d 1.671 Pr 0.60 ,
with the determination coefficient R2 = 0.997. For the case of the apple bed, the following correlation is proposed (Equation (16)):
f D = 2033 Re b e d 1.027 Pr 0.20 ,
with the determination coefficient R2 = 0.959. All of the above pressure drop correlations are valid for the Reynolds number range: 200 < Rebed < 1700, and Prandtl number 0.7802 < Pr < 0.7826. On the basis of this comparison, the proposed pressure drop correlations may be thought of as accurate for the tested packed beds and humid air as a heat transfer fluid.

4. Summary

This paper presents the methodology for the measurement of the average effective heat transfer coefficient for the case of the packed bed of vegetables and fruits. The results of the measurements for the case of the carrot bed for two different bed arrangements and apples bed as well as three different air turbulence intensity levels were presented.
The presented results allowed the following general conclusions to be drawn:
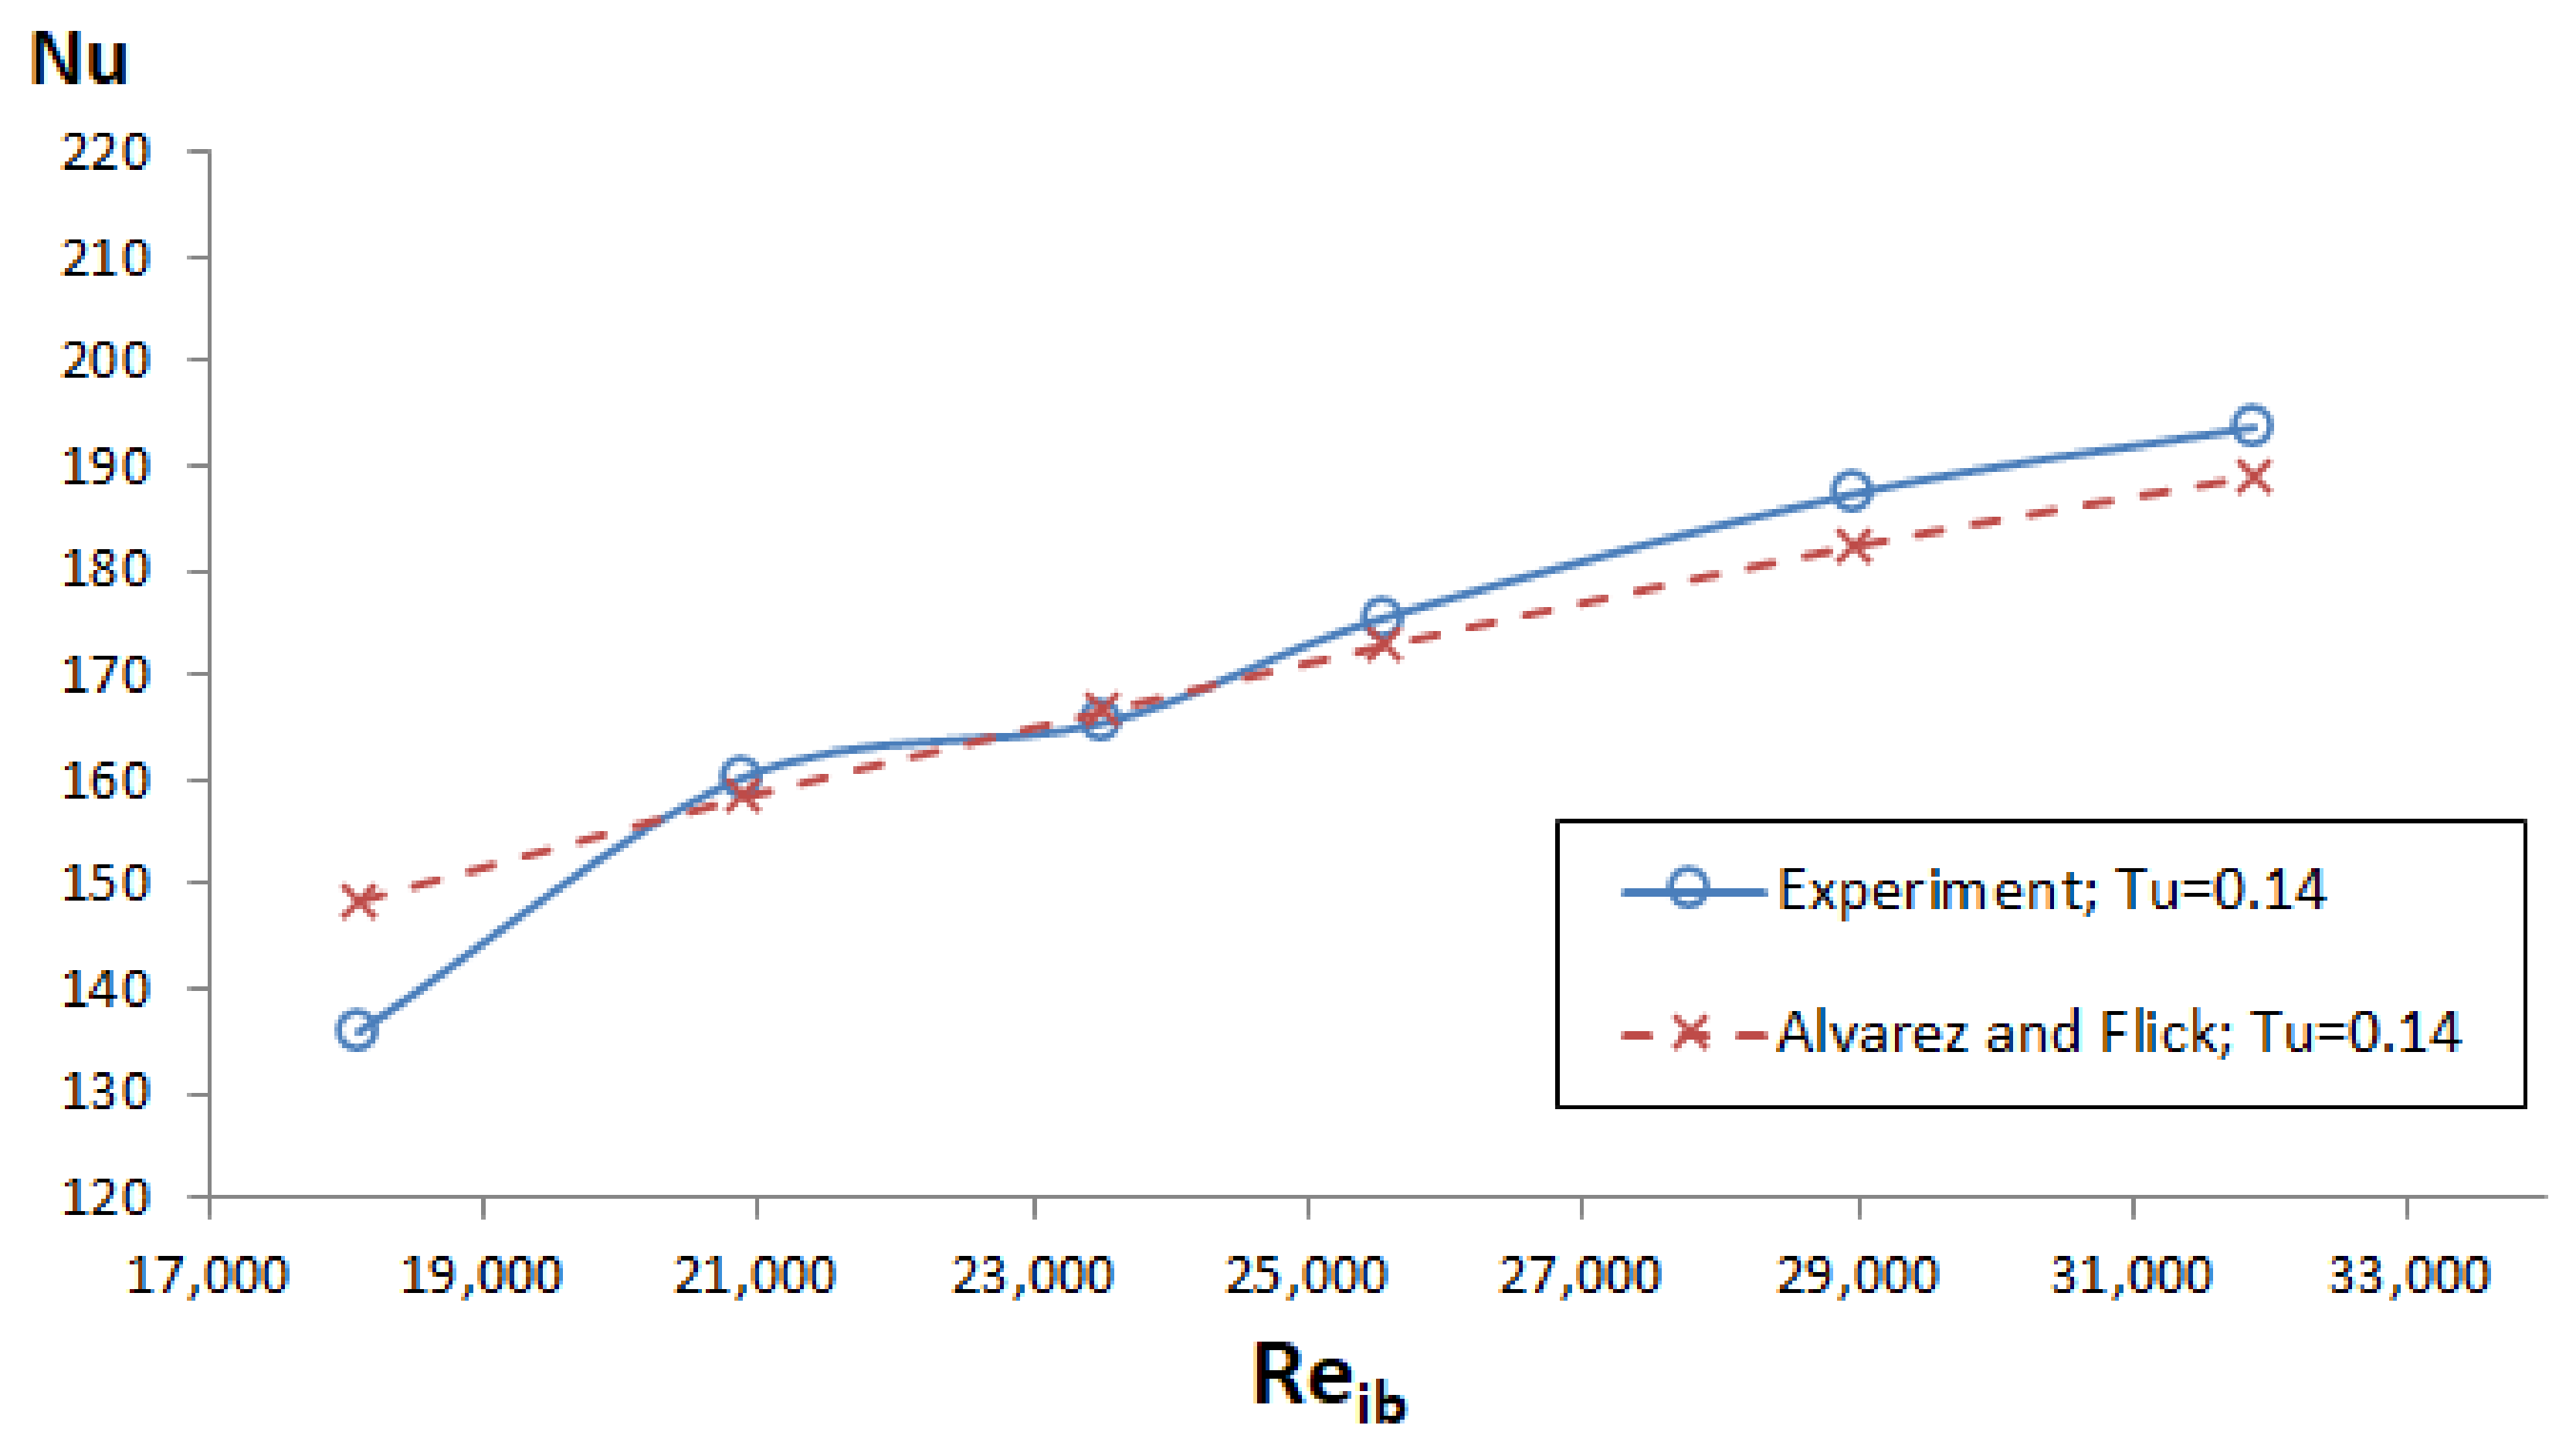
  • The effective application of the single blow method for the average heat transfer coefficient measurement for the packed bed of vegetables and fruits was demonstrated.
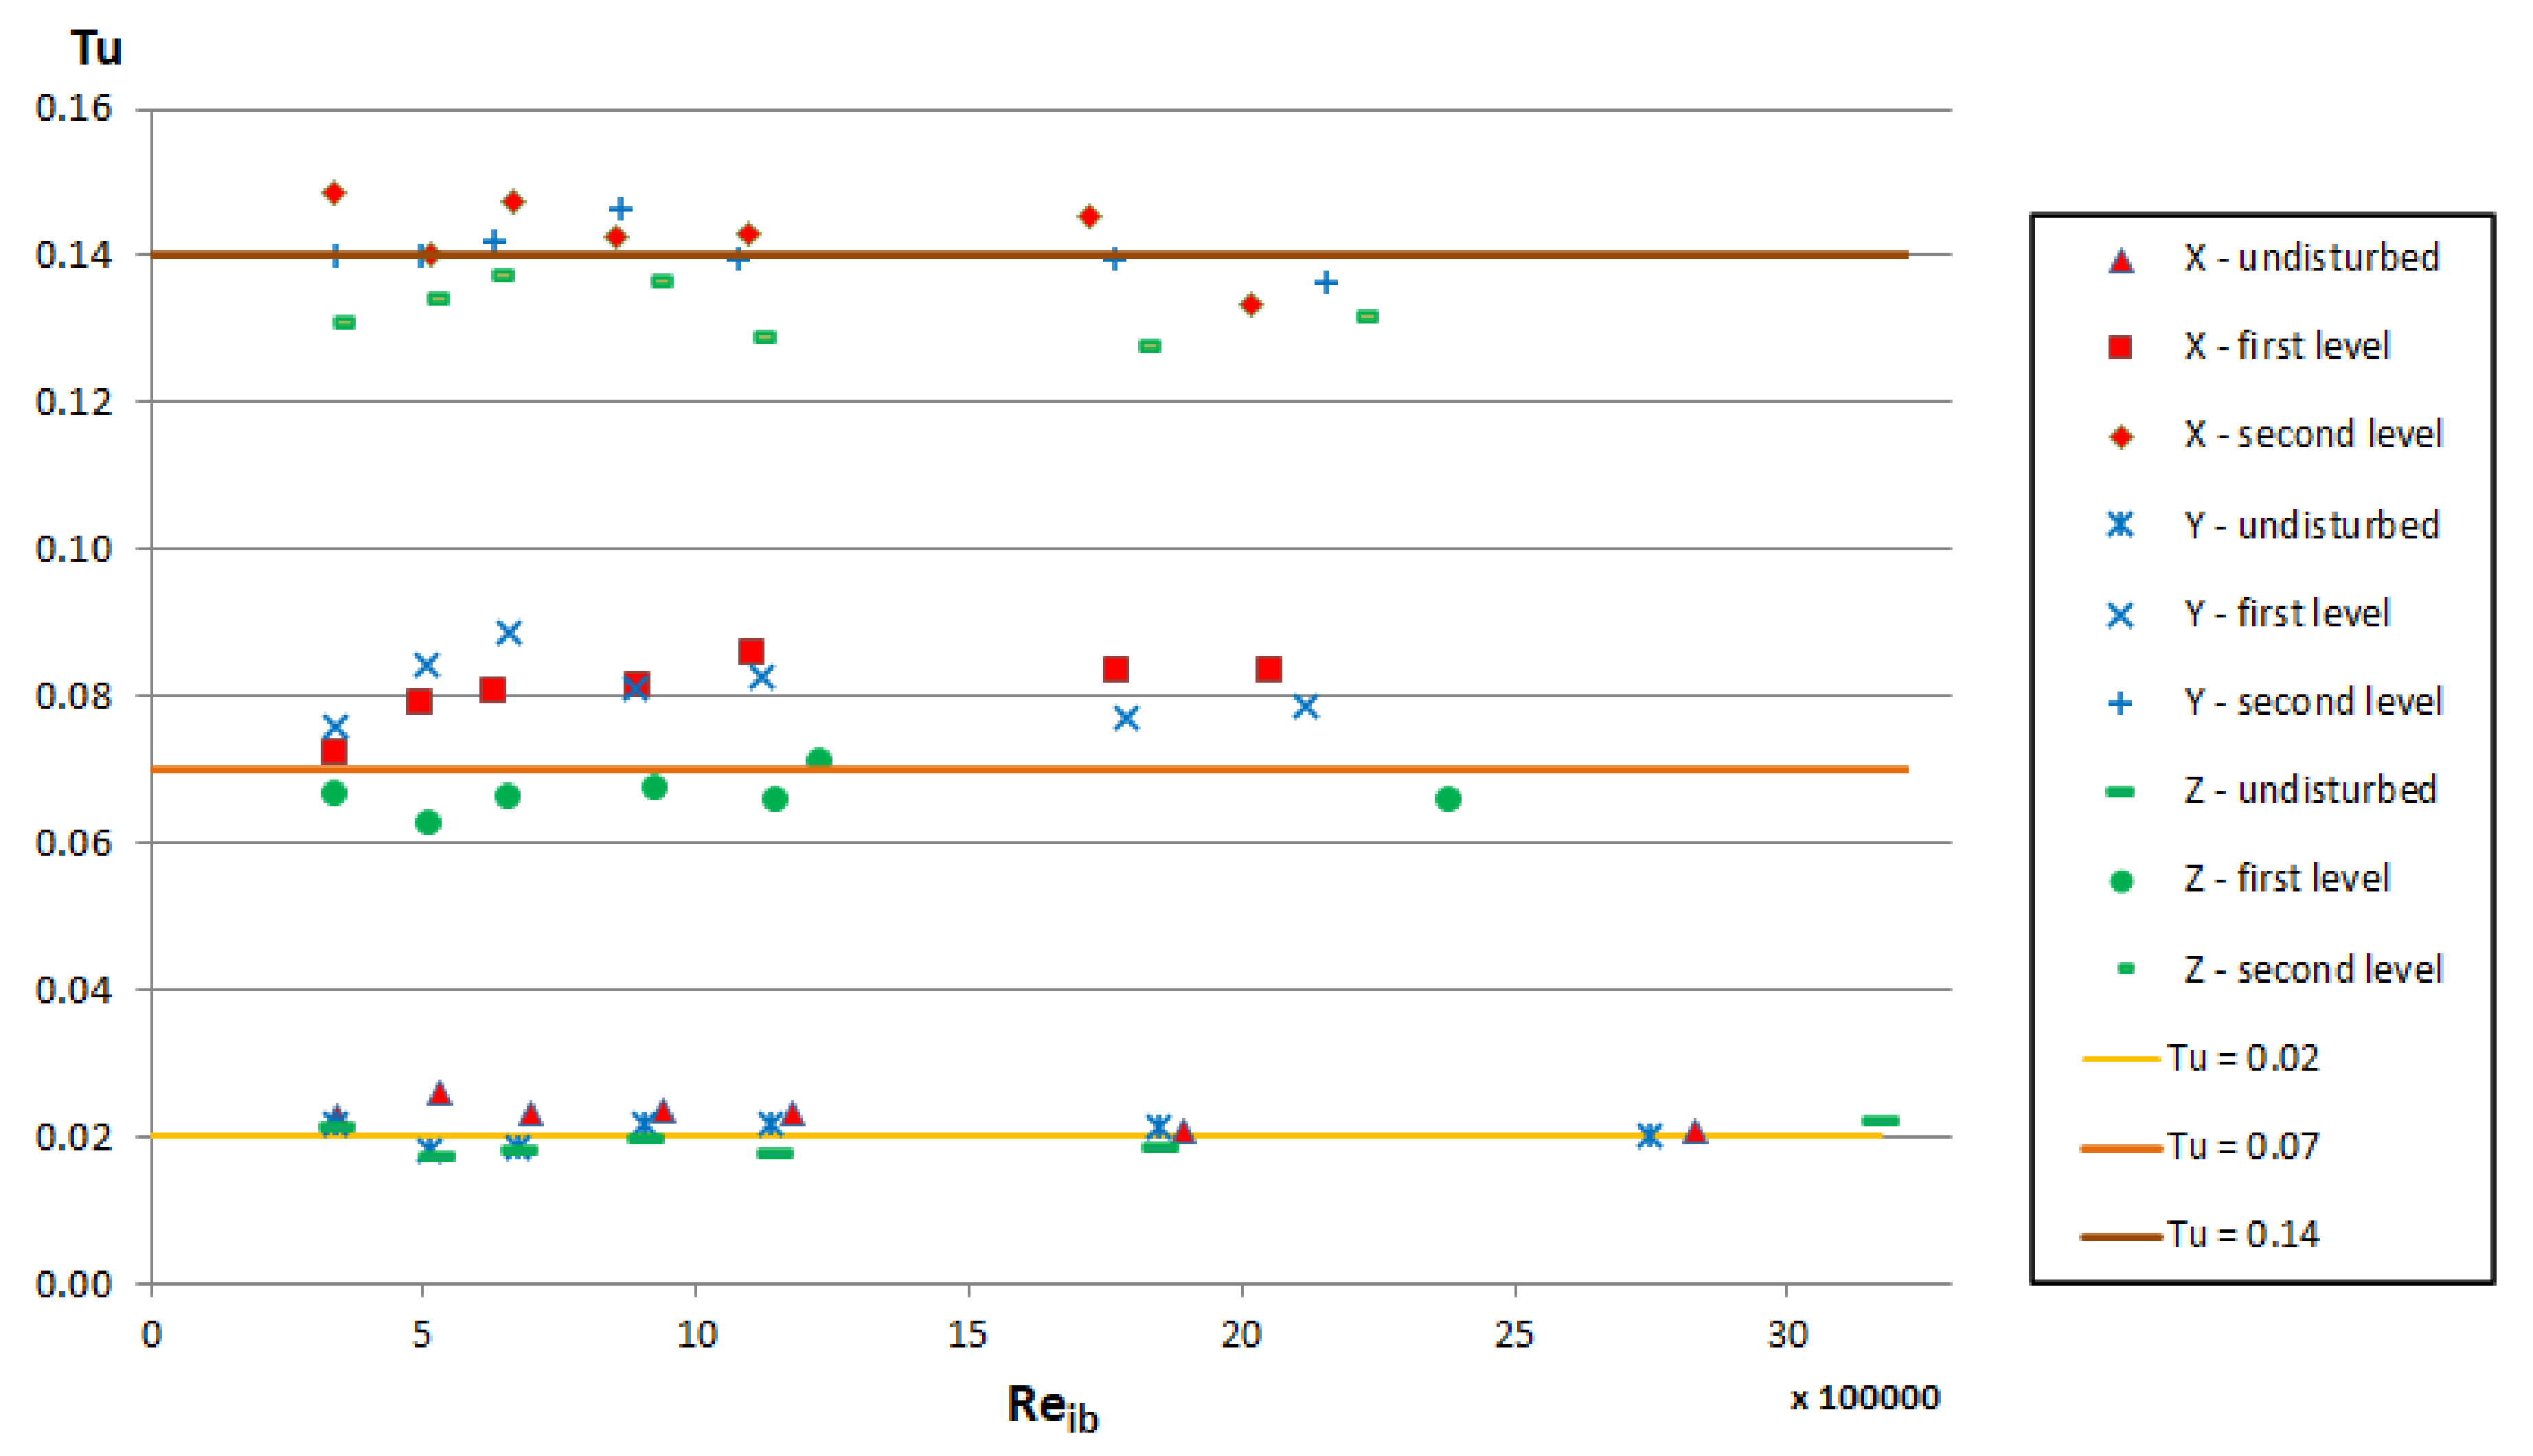
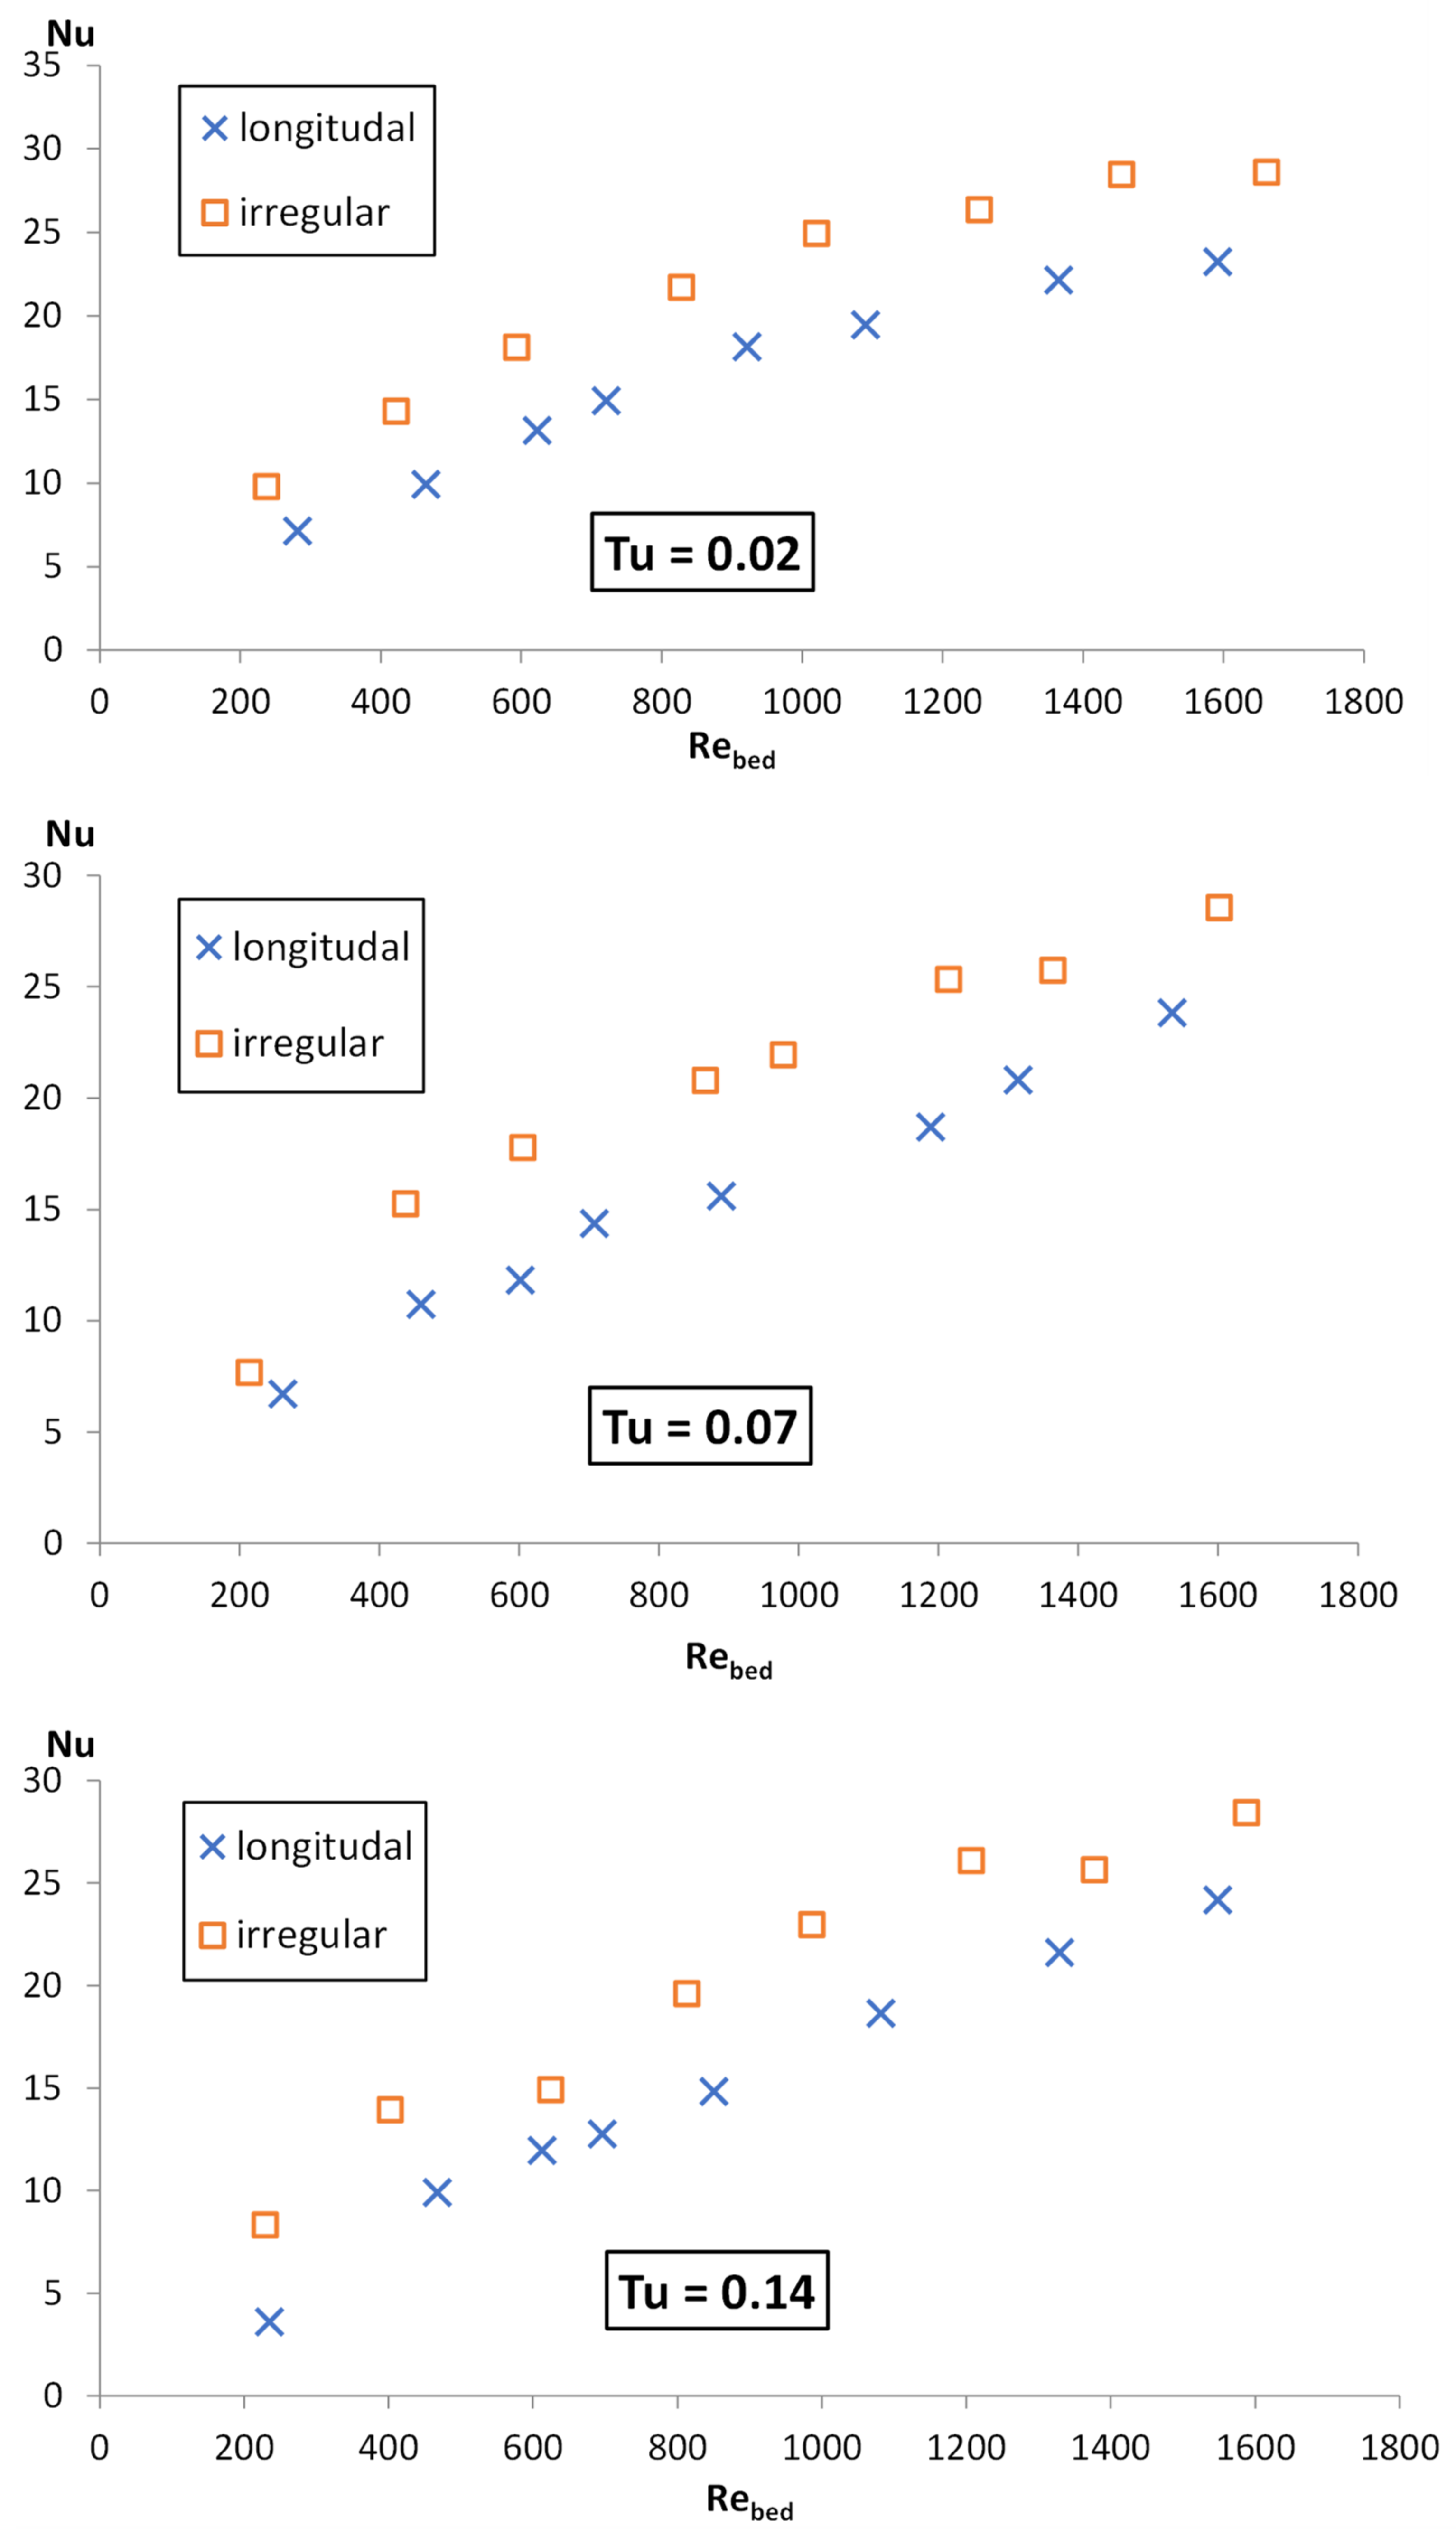
  • The intensity of turbulence in the tested range produces slight effects on heat transfer irrespective of the packed bed arrangement.
  • The influence of the bed arrangement on heat transfer is significant; the results show enhanced heat transfer for the case of the irregular arrangement carrot bed. This is the reason for the separate heat transfer correlations that were proposed for these two cases of the carrot packed bed. The proposed heat transfer and pressure drop correlations are valid for the range of 200 < Rebed < 1700; 0.02 < Tu < 0.14; 0.7802 < Pr < 0.7826. The above range of the Prandtl number corresponds to humid air as heat transfer fluid, which is the most common case for practical implementation of the proposed heat transfer correlations.
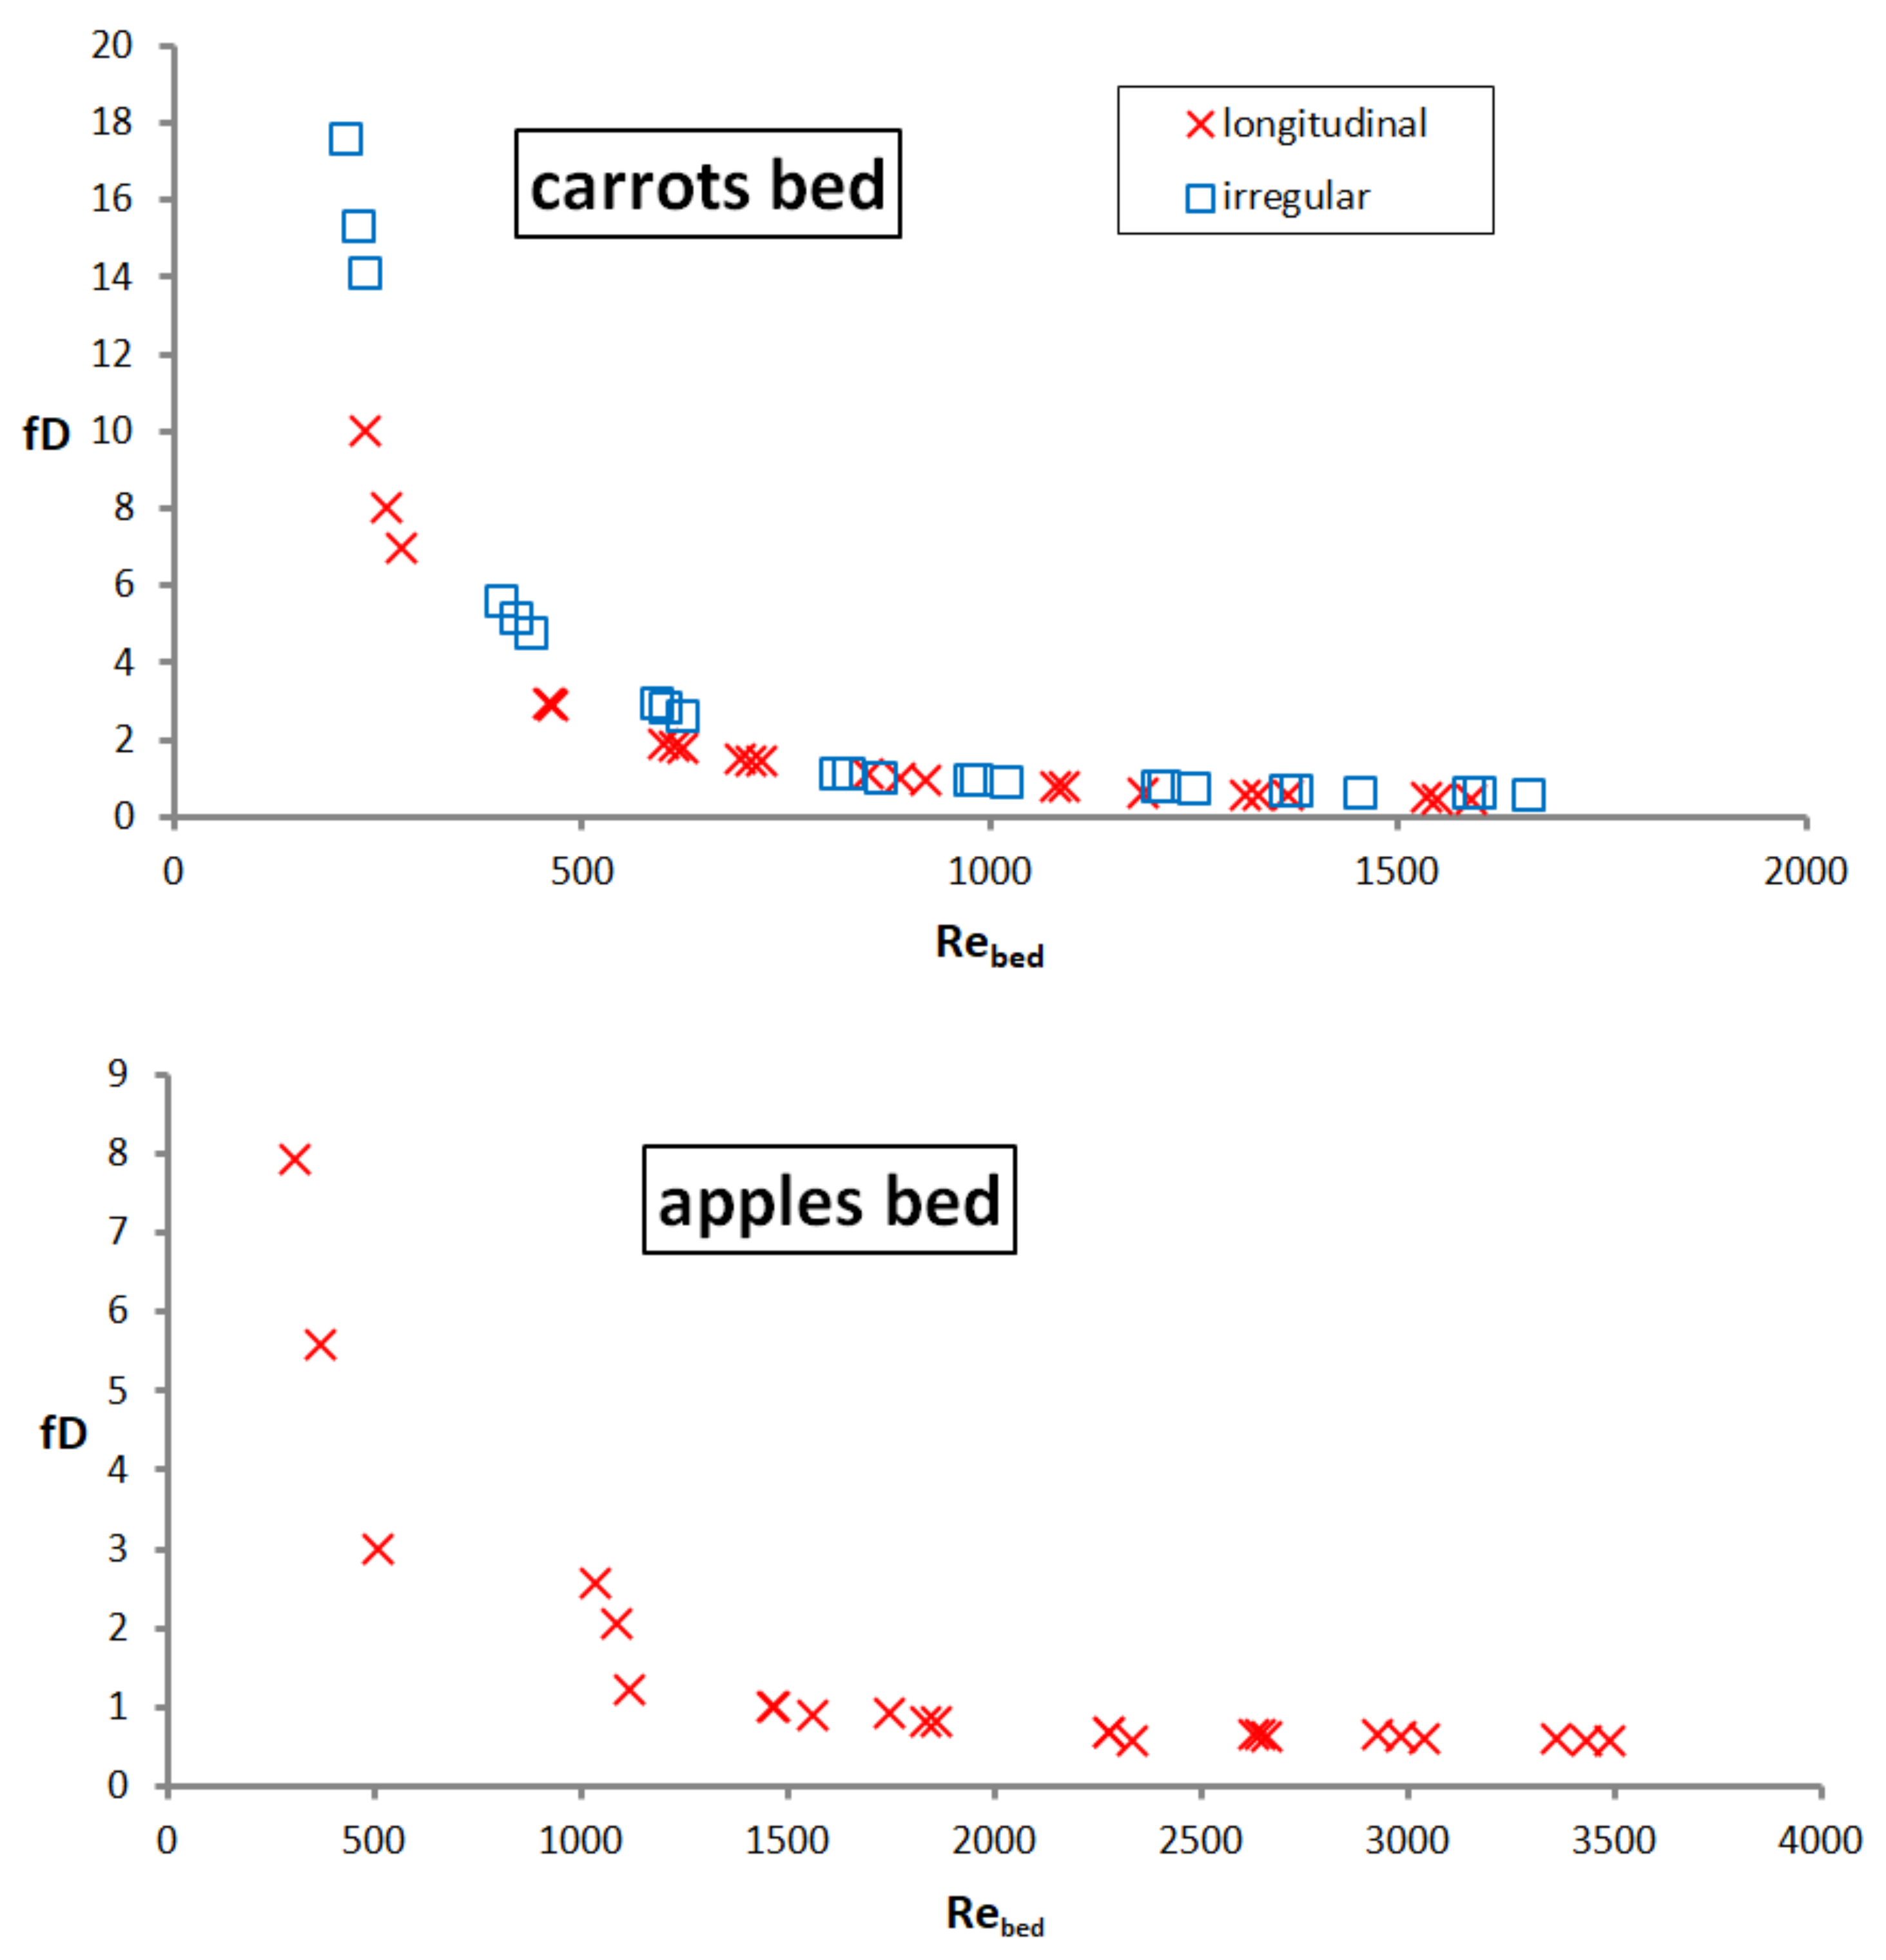
  • The influence of the turbulence intensity or bed arrangement (longitudinal and irregular carrot bed) has no significant effect on the resistance of air flowing through the bed. The significant decrease of the Darcy factor is observed in the range of a low Reynolds numbers only, Rebed < 1200, and above this range a kind of stabilization of the Darcy factor is observed for the tested beds.

Author Contributions

Conceptualization, D.B. and A.Ł.; methodology, D.B. and A.Ł.; software, K.Ś.; validation, A.Ł., K.Ś. and H.Z.; formal analysis, D.B.; investigation, A.Ł and H.Z.; resources, D.B.; data curation, D.B.; writing—original draft preparation, A.Ł.; writing—review and editing, A.Ł., K.Ś. and D.B.; visualization, H.Z.; supervision, D.B.; project administration, D.B.; funding acquisition, D.B. All authors have read and agreed to the published version of the manuscript.

Funding

Research financed by the Project No. 2017/25/N/ST8/02444 supported by the National Science Centre, Poland, as well as Project No. WZ/WM-IIM/1/2020 supported by the Ministry of Science and Higher Education, Poland.

Institutional Review Board Statement

Not applicable.

Informed Consent Statement

Not applicable.

Data Availability Statement

Not applicable.

Conflicts of Interest

The authors of the proposed paper declare no conflict of interest.

Abbreviations

Symbols
aspecific surface area, Ap/Vt, m−1
Asurface area, m2
cspecific heat, J kg−1 K−1
Dhhydraulic diameter, m
fDDarcy friction factor
Llength of the tested packed bed section, m
Ki, Koinlet and outlet pressure loss coefficients, respectively
mmass, kg
m ˙ mass flow rate, kg s−1
NuNusselt number
NTUnumber of transfer units
pstatic pressure, Pa
PrPrandtl number
ReReynolds number
ttime, s
thtime constant of electric heater, s
tsys time constant of solid-fluid system, t s y s = m s c s α A w , s
Ttemperature, °C
Tuturbulence intensity
Uperimeter, m
Vvolume, m3
wvelocity, m s−1
Greek symbols
αheat transfer coefficient, W m−2 K−1
βconstant in eq. (5), β = ms cs/(mf cf), dimensionless
εporosity, ε = Vp/Vt
η, ξdummy variables in eq. (5), dimensionless
θdimensionless fluid temperature, θ = T T i f T i b T i f
λthermal conductivity, W m−1 K−1
ρdensity, kg m−3
τdimensionless time, τ = t t s y s
τhdimensionless time constant of electric heater, τ h = t h t s y s
τidimensionless characteristic time of solid-fluid system, τ i = N T U β
subscripts
avaverage
bedinside the bed
ffluid (air)
helectric heater
ibfluid at the bed inlet
ifinitial fluid conditions at the bed outlet
ssolid (product)
rmsstandard deviation
pfree space
ttotal volume of solid-fluid system
wheat transfer surface area

References

  1. Alvarez, G.; Flick, D. Analysis of heterogeneous cooling of agricultural products inside bins: Part II: Thermal study. J. Food Eng. 1999, 39, 239–245. [Google Scholar] [CrossRef]
  2. Alvarez, G.; Bournet, P.-E.; Flick, D. Two-dimensional simulation of turbulent flow and transfer through stacked spheres. Int. J. Heat Mass Transf. 2003, 46, 2459–2469. [Google Scholar] [CrossRef]
  3. Kondjoyan, A. A review on surface heat and mass transfer coefficients during air chilling and storage of food products. Int. J. Refrig. 2006, 29, 863–875. [Google Scholar] [CrossRef]
  4. Defraeye, T.; Lambrecht, R.; Tsige, A.A.; Delele, M.A.; Opara, U.L.; Cronje, P.; Verboven, P.; Nicolai, B. Forced-convective cooling of citrus fruit: Package design. J. Food Eng. 2013, 118, 8–18. [Google Scholar] [CrossRef] [Green Version]
  5. Gruyters, W.; Verboven, P.; Diels, E.; Rogge, S.; Smeets, B.; Ramon, H.; Defraeye, T.; Nicolaï, B.M. Modelling Cooling of Packaged Fruit Using 3D Shape Models. Food Bioprocess Technol. 2018, 11, 2008–2020. [Google Scholar] [CrossRef]
  6. Dehghannya, J.; Ngadi, M.; Vigneault, C. Transport phenomena modelling during produce cooling for optimal package design: Thermal sensitivity analysis. Biosyst. Eng. 2012, 111, 315–324. [Google Scholar] [CrossRef]
  7. Delele, M.A.; Ngcobo, M.; Getahun, S.; Chen, L.; Mellmann, J.; Opara, U.L. Studying airflow and heat transfer characteristics of a horticultural produce packaging system using a 3-D CFD model. Part II: Effect of package design. Postharvest Biol. Technol. 2013, 86, 546–555. [Google Scholar] [CrossRef]
  8. Olatunji, J.; Love, R.; Shim, Y.; East, A. An automated random stacking tool for packaged horticultural produce. J. Food Eng. 2020, 284, 110037. [Google Scholar] [CrossRef]
  9. Hoang, D.K.; Lovatt, S.J.; Olatunji, J.R.; Carson, J.K. Experimental measurement and numerical modelling of cooling rates of bulk-packed chicken drumsticks during forced-air freezing. Int. J. Refrig. 2020, 114, 165–174. [Google Scholar] [CrossRef]
  10. Alvarez, G.; Flick, D. Modelling turbulent flow and heat transfer using macro-porous media approach used to predict cooling kinetics of stack of food products. J. Food Eng. 2007, 80, 391–401. [Google Scholar] [CrossRef]
  11. Getahun, S.; Ambaw, A.; Delele, M.A.; Meyer, C.J.; Opara, U.L. Analysis of airflow and heat transfer inside fruit packed refrigerated shipping container: Part I—Model development and validation. J. Food Eng. 2017, 203, 58–68. [Google Scholar] [CrossRef]
  12. Achenbach, E. Heat and flow characteristics of packed beds. Exp. Therm. Fluid Sci. 1995, 10, 17–27. [Google Scholar] [CrossRef]
  13. Becker, B.R.; Fricke, B.A. Experimental study of convective heat transfer during cooling with low air velocity in a stack of objects. Int. J. Therm. Sci. 2004, 43, 1213–1221. [Google Scholar] [CrossRef]
  14. Laguerre, O.; Ben Amara, S.; Flick, D. Heat transfer between wall and packed bed crossed by low velocity airflow. Appl. Therm. Eng. 2006, 26, 1951–1960. [Google Scholar] [CrossRef]
  15. Laguerre, O.; Amara, S.B.; Alvarez, G.; Flick, D. Transient heat transfer by free convection in a packed bed of spheres: Comparison between two modelling approaches and experimental results. Appl. Therm. Eng. 2008, 28, 14–24. [Google Scholar] [CrossRef]
  16. ASHRAE Handbook—Refrigeration; Amer Society of Heating: Peachtree Corners, GA, USA, 2006; Chapter 9; pp. 9.1–9.31.
  17. Łapiński, A.; Butrymowicz, D.; Kołodziejczyk, M. Measurement Approach of Mean Heat Transfer Coefficient for Packed Bed of Vegetables. Acta Mech. Autom. 2017, 11, 73–80. [Google Scholar] [CrossRef] [Green Version]
  18. Butrymowicz, D.; Karwacki, J.; Kwidziński, R.; Śmierciew, K.; Gagan, J.; Przybyliński, T.; Skiepko, T.; Łapin, M. Methodology of heat transfer and flow resistance measurement for matrices of rotating regenerative heat exchangers. Chem. Process Eng. 2016, 37, 341–358. [Google Scholar] [CrossRef] [Green Version]
  19. Anzelius, A. Über Erwärmung vermittels durchströmender Medien. ZAMM 1926, 6, 291–294. [Google Scholar] [CrossRef]
  20. Liang, C.Y.; Yang, W.-J. Modified Single-Blow Technique for Performance Evaluation on Heat Transfer Surfaces. J. Heat Transf. 1975, 97, 16–21. [Google Scholar] [CrossRef]
  21. Kays, W.M.; London, A.L. Compact Heat Exchangers; Krieger Publishing Company: Malabar, FL, USA, 1984; ISBN 978-93-87938-03-8. [Google Scholar]
Figure 1. The schematic of the measurement approach by means of the single blow technique.
Processes 09 02151 g001
Figure 2. Schematic diagram of the test tunnel: 1—flow rectifier; V—air flow rate meter; T—temperature sensors; 2—electric air heater; 3,4—confusor/diffuser; Tib—thermocouples mesh at the tested bed inlet; Hib,Hif—humidity sensors; ΔP—pressure gauges; bed—tested packed bed; Tu—turbulence intensity probe; Tif—thermocouples mesh at the tested bed outlet.
Processes 09 02151 g002
Figure 3. View of the test tunel equipment.
Processes 09 02151 g003
Figure 4. Schematic of the test section and thermocouple distribution before and after bed: bed—tested packed bed; Tib—thermocouples mesh at the bed inlet; Tif—thermocouples mesh at the bed outlet; ΔP—pressure gauges; Hib, Hif—air humidity sensors; Tu—turbulence intensity probe.
Processes 09 02151 g004
Figure 5. The tested packed beds: irregular arrangement of carrot; longitudinal arrangement of carrot; apples.
Processes 09 02151 g005
Figure 6. Elements generating air turbulence at the inlet section and locations of the turbulence intensity measurement.
Processes 09 02151 g006
Figure 7. Turbulence intensity measurement results; X, Y, Z- turbulence measurement locations indicated in Figure 5.
Processes 09 02151 g007
Figure 8. The packed bed of balls used for validation tests.
Processes 09 02151 g008
Figure 9. Comparison of the experimental results for packed bed of balls with correlation of [1] for the turbulence intensity Tu = 0.14.
Processes 09 02151 g009
Figure 10. Comparison of Nusselt number versus Reynolds number for three turbulence intensity levels.
Processes 09 02151 g010
Figure 11. Comparison of Nusselt number versus Reynolds number for the case of longitudinal and irregular carrots arrangement.
Processes 09 02151 g011
Figure 12. Comparison of Darcy friction factor versus Reynolds number for tested packed beds.
Processes 09 02151 g012
Table 1. Parameters of the tested carrots and apples.
Weight Range
[g]
Average Mass [g]Average Volume [m3 × 10−3]Average
Surface Area
[m2 × 10−2]
Amount per Bed
CarrotAppleCarrotAppleCarrotAppleCarrotApplelongitudinal Arrangement CarrotsIrregular Arrangement CarrotsApple
60–65120–12962.3126.50.0600.151.0950.014217174
65–70130–13967.71370.0660.171.1250.015516167
70–75140–14973.3146.50.0700.191.2950.015612128
75–80150–15977.71540.0780.201.2620.0173191910
80–85160–16983.0165.50.0790.201.3320.0185232221
85–90170–17987.6174.50.0860.231.4080.0193131315
90–95180–18992.2183.50.0900.241.4850.0199252410
95–100190–19997.21940.0930.251.5080.0202202013
100–105200–209103.0203.50.1000.271.6000.021711107
105–110210–219106.4211.50.1040.281.6160.021916162
110–115 113.2 0.108 1.553 1918
115–120 116.8 0.112 1.614 1212
120–125 121.6 0.120 1.762 1515
125–130 126.8 0.130 1.819 88
130–135 132.6 0.128 1.889 76
135–140 136.4 0.131 1.883 1514
140–145 141.8 0.138 1.984 98
145–150 148.0 0.145 1.848 76
150–155 152.2 0.163 1.983 1313
155–160 156.4 0.156 1.981 87
160–165 162.2 0.158 2.079 44
165–170 167.2 0.169 2.033 10
170–175 171.8 0.165 2.114 76
175–180 177.6 0.168 2.325 00
180–190 184.4 0.178 2.432 1413
190–200 194.4 0.189 2.397 87
Table 2. The averaged geometry of the tested carrots and apples.
BedCarrots (Irregular)Carrots (Longitudinal) Apples
Parameter
Average mass [kg]33.8735.6916.496
Average heat transfer surface area [m2]4.9345.1791.806
Average volume [m3]0.03310.03490.0211
Average density [kg m−3]1023784
Table 3. Results for beds of carrot and apples at various turbulence intensity.
Carrots—Longitudinal Arrangement
Tu = 0.02Tu = 0.07Tu = 0.14
wibRebedReibα wibRebedReibα wibRebedReibα
[m s−1][Wm−2K−1][m s−1][Wm−2K−1][m s−1][Wm−2K−1]
0.1128118977.30.126317766.80.0923615925.8
0.18463312810.50.18459310010.30.18466314810.4
0.24624421113.80.23602406412.60.24613414012.5
0.28720486114.50.27708478012.90.27695469113.3
0.36922622017.40.34890600515.20.33851574114.4
0.421091736018.00.461188801218.70.421082730017.8
0.531365902021.00.511313885220.00.511329896120.6
0.61159110,73022.50.59153510,35023.00.59154910,45022.9
Carrots—Irregular Arrangement
Tu = 0.02Tu = 0.07Tu = 0.14
wibRebedReibαwibRebedReibαwibRebedReibα
[m s−1][Wm−2K−1][m s−1][Wm−2K−1][m s−1][Wm−2K−1]
0.0923615217.50.0821313735.90.0822914736.0
0.16422271411.50.16438281412.10.15403259010.8
0.22594382114.40.22604388414.50.23625402012.9
0.30828532318.20.32867557217.80.29812521917.0
0.371021655621.20.36978628719.50.36986633720.2
0.461251803723.80.451214779822.50.441207775323.0
0.531454934326.50.51364876424.30.511377884824.0
0.61166110,67027.00.59160110,28027.00.58158810,20026.8
Apples
Tu = 0.02Tu = 0.07Tu = 0.14
wibRebedReibαwibRebedReibαwibRebedReibα
[m s−1][Wm−2K−1][m s−1][Wm−2K−1][m s−1][Wm−2K−1]
0.13508134512.00.093699789.00.083088166.5
0.291117295818.00.261034273918.00.391089294512.0
0.411562413824.10.381469389122.00.381462387320.5
0.481858492327.00.481837486725.80.451746462524.5
0.612334618332.00.592280604031.00.592278603430.5
0.692646701035.10.682626695734.50.692660704833.5
0.793042805939.50.762928775635.50.782985790935.7
0.913487923742.40.893432909240.50.873361890440.4
Publisher’s Note: MDPI stays neutral with regard to jurisdictional claims in published maps and institutional affiliations.

