Article

Electrochemical Performance of Iron-Doped Cobalt Oxide Hierarchical Nanostructure

1
Department of Physics and Materials Science, The University of Memphis, Memphis, TN 38152, USA
2
Department of Natural Science, Union College, Barbourville, KY 40906, USA
3
Department of Chemistry, Pittsburg State University, Pittsburg, KS 66762, USA
*
Authors to whom correspondence should be addressed.
Processes 2021, 9(12), 2176; https://doi.org/10.3390/pr9122176
Submission received: 29 October 2021 / Revised: 15 November 2021 / Accepted: 29 November 2021 / Published: 2 December 2021

Abstract

:
In this study, hydrothermally produced Fe-doped Co3O4 nanostructured particles are investigated as electrocatalysts for the water-splitting process and electrode materials for supercapacitor devices. The results of the experiments demonstrated that the surface area, specific capacitance, and electrochemical performance of Co3O4 are all influenced by Fe3+ content. The FexCo3-xO4 with x = 1 sample exhibits a higher BET surface (87.45 m2/g) than that of the pristine Co3O4 (59.4 m2/g). Electrochemical measurements of the electrode carried out in 3 M KOH reveal a high specific capacitance of 153 F/g at a current density of 1 A/g for x = 0.6 and 684 F/g at a 2 mV/s scan rate for x = 1.0 samples. In terms of electrocatalytic performance, the electrode (x = 1.0) displayed a low overpotential of 266 mV (at a current density of 10 mA/cm2) along with 52 mV/dec Tafel slopes in the oxygen evolution reaction. Additionally, the overpotential of 132 mV (at a current density of 10 mA/cm2) and 109 mV with 52 mV/dec Tafel slope were obtained for x = 0.6 sample towards hydrogen evolution reaction (HER). According to electrochemical impedance spectroscopy (EIS) measurements and the density functional theory (DFT) study, the addition of Fe3+ increased the conductivity at the electrode–electrolyte interface, which substantially impacted the high activity of the iron-doped cobalt oxide. The electrochemical results revealed that the mesoporous Fe-doped Co3O4 nanostructure could be used as potential electrode material in the high-performance electrochemical capacitor and water-splitting catalysts.

1. Introduction

The rapidly growing population and unstructured industrialization pose a serious threat to future energy demand and environmental health. Conventional energy resources are on the verge of their demise. Hence, significant progress is being made in discovering reliable renewable energy resources and their storage technology. The conversion of hydrogen fuel into electrical energy and storing of this electrical energy in supercapacitors could be the best solution to the energy crisis and environmental remediation. Recent advancements have shown that splitting water into hydrogen and oxygen requires an amount of energy that is not economical, and hence, the search to find efficient catalysts to split water at low energy intake and store hydrogen in them is ongoing [1,2]. Photo- and electro-water splitting has gained attention due to the possibility of utilizing solar radiation to harvest clean energy in the form of hydrogen, which can be sorted and used as a clean alternative fuel [3,4,5]. Water oxidation is challenging, as it requires a four-electron transfer and oxygen–oxygen bond formation. Rh- and Ir-based catalysts show good water-oxidation capability, but it is essential to search for alternative cheap electrocatalysts. On the other hand, supercapacitor (SC) devices can store large energy densities through the accumulated charge at the interface between an electrode and electrolyte [6]. SC is an electrochemical capacitor with high power density, quick charging ability, and charge-discharge cycles.
Transition metal oxides are promising electrode materials due to their higher theoretical capacitance and superior capacitive behavior [7]. Tricobalt tetraoxide (Co3O4) belongs to the spinel structure AB2O4 with Co2+ ions in the tetrahedral site and Co3+ ions in the octahedral site of the cubic closed pack lattice [8]. It is a p-type semiconductor that has been widely used as a supercapacitor, heterogeneous catalyst [9,10], anode material in lithium-ion batteries [11], gas sensor [12], and solar energy absorber [13], where their properties are dependent on their morphology and size. The electrochemical performance of oxide materials depends mainly on the surface area, active surface sites, defects, and electrical conductivity. Nanostructured Co3O4 possesses a large surface area, has good stability, and favorable kinetics for oxidation reactions, but it delivers very low electrical conductivity due to high internal resistance and small active surface area. Recently, several strategies have been employed to improve the behavior of metal oxides using various dopants [14] or forming nanocomposites with p-n junction [15] or by tuning the morphology. The morphology of nanomaterials influences the capacitance because the storage of charges leads to the stocking of energy in electrochemical devices [16]. Both the transfer rate of ions during the storage process of charges and interface properties of the material with electrolyte vary due to the morphology of nanomaterial [17]. In addition to this, metal doping into Co3O4 can also increase the conductivity of a nanomaterial, which is highly beneficial for enhanced performance of a supercapacitor [18,19]. Dopants such as Cu, Mn, Fe, and Ni have been explored [20,21,22,23,24] to test the electrochemical performance of Co3O4. Further, engineering strategies have been studied at the atomic level to improve the catalytic performance of Co3O4 by providing new physiochemical features and developing synergetic effects to enhance the OER kinetics [25,26].
The present study investigates the impact of Fe3+ in Co3O4 and its influence on morphology, surface area, and electrochemical performance. Fe-doped Co3O4 could show significant improvement in intrinsic conductivity, as it offers multiple valence states, specific capacitance, rate capability, and stable cycle life compared to Co3O4, because Fe (0.64 Å) and Co (0.61 Å) have similar ion radius and oxidation states [20]. As a result, the electrode material offers rich redox sites to enhance electrochemical performance. Furthermore, while several supercapacitors and water splitting studies used various nickel-doped cobalt oxide morphologies [27,28,29,30,31], a few studies reported using Fe-doped cobalt oxide materials to perform the hydrogen oxidation reaction (HER) [20,22,32].
In this study, we have used a simple hydrothermal synthesis to engineer Fe-doped FexCo3-xO4 nanostructured particles. The electrochemical performance, OER, and HER of these materials were examined. Density functional theory (DFT) was used to calculate the energy band gap of these materials. The reduced energy-band gap and increased surface area induced by Fe3+ doping in cobaltite account for the observed improved electrochemical activity and catalysis of these materials.

2. Materials and Methods
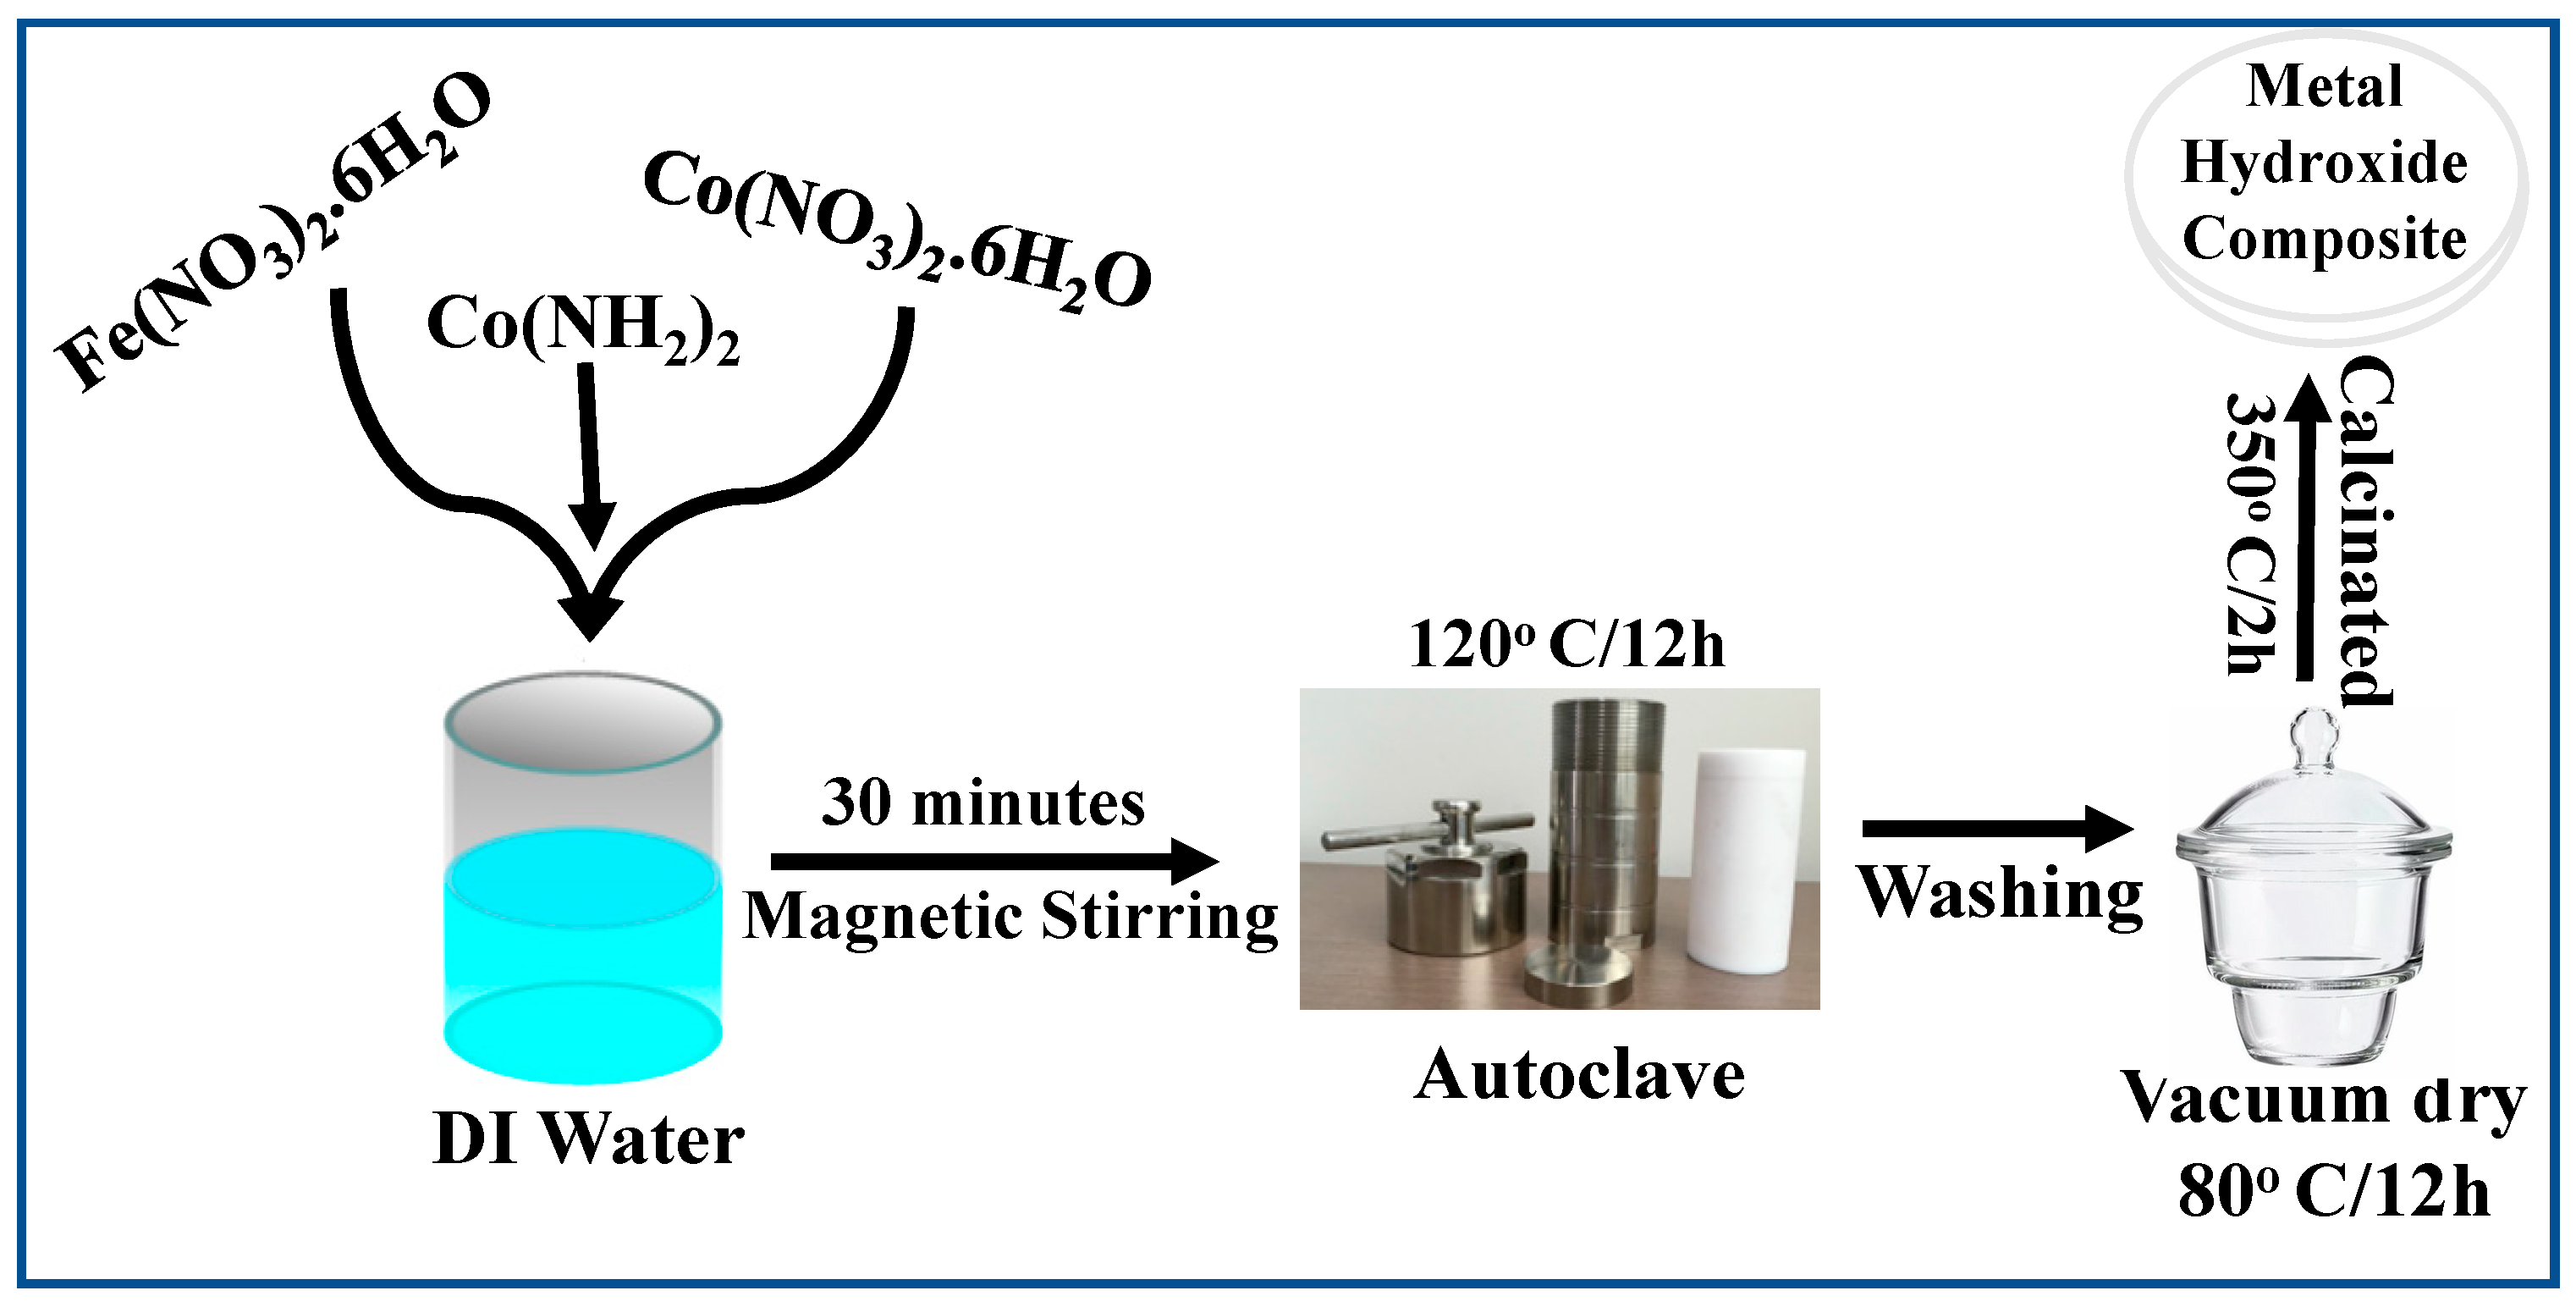
2.1. Synthesis

The high purity nitrate salts Fe(NO3)2.6H2O and Co(NO3)2.6H2O were purchased from Sigma Aldrich (St. Louis, MO, USA). The nitrate salts were dissolved in 35 mL of water with 4 gm of urea (CO(NH2)2) and stirred for 30 min. The solution was then transferred to a 45 mL Teflon-lined autoclave and maintained at 120 °C for 17 h, followed by a natural cooling to room temperature [33]. The precipitates were washed with distilled water and acetone several times by centrifugation and then dried for 12 h at 80 °C under vacuum. After this, the derived metal hydroxide composite particles were calcined at 350 °C in the air for 2 h. The schematic of the experimental process is shown in Figure 1 and Table 1 contains the stoichiometry of the salts needed to make FexCo3-xO4.

2.2. Characterization

X-ray diffraction (XRD) was used to examine the crystalline structure of calcined powder using a Bruker D8 Advance X-ray diffractometer (Bruker, Madison, WI, USA). The surface morphology of prepared samples was studied by a scanning electron microscope (SEM) (Phenom 10 KeV, Pleasanton, CA, USA). Autosorb (Quantachrome, model No. AS1MP, Boynton Beach, FL) was used to quantify specific surface area and pore volume at 77K using nitrogen as the adsorbing gas. The specific surface area of as-prepared samples was measured using the Brunauer–Emmett–Teller (BET) method. The Barret–Joyner–Halenda (BJH) model was also used to calculate surface area, average pore volume, and pore radius. FTIR spectra were collected via the Thermo-Fisher Scientific FTIR spectrometer (Nicolet iS10, Thermo Fisher Scientific, Waltham, MA, USA) between 400 and 1000 cm−1.
The working electrode was prepared with nickel foam. Nickel foam was first cleaned with acetone and 3M HCl solution for 10 min. This process helps to remove the oxide layer from the surface of the nickel foam. After washing and drying nickel foam, the working electrode was made by mixing 80 weight percent of the synthesized powder, 10 weight percent of the acetylene black, and 10 weight percent of the polyvinylidene difluoride (PVDF) in the presence of N-methyl pyrrolidinone (NMP). The slurry paste was obtained after thoroughly mixing the components and was pasted onto the nickel foam. The prepared electrode on nickel foam was placed in a vacuum oven at 60 °C for 10 h. Using an analytical balance (MS105DU, max. 120 g, 0.01 mg of resolution Mettler Toledo, Columbus, OH, USA), the loading on nickel foam was acquired by measuring the nickel foam before and after loading [34]. An electrochemical cell with a platinum wire as a counter electrode, saturated calomel electrode (SCE) as a reference electrode, and pasted samples onto nickel foam as a working electrode were used. The electrode’s electrochemical performance was tested in 3M KOH as an electrolyte with a potential range of 0 to 0.6 V. Cyclic voltammetry (CV), galvanostatic–charge–discharge (GCD) techniques, and electrochemical impedance spectroscopy (EIS) were measured using a Versastat4-500 electrochemical workstation (Princeton Applied Research, Oak Ridge, TN, USA). Electrochemical impedance spectroscopy (EIS) and chronoamperometry (CA) were performed at 0.6 and 0.55 V (V, SCE), respectively. The reference electrode was calibrated against a reversible hydrogen electrode (RHE) in the 1M KOH electrolyte at room temperature for water splitting. For every measurement, all potentials were converted and referred to the RHE and iR correction. Linear sweep voltammetry (LSV) measurements were performed at 10 mV s–1 for the OER and HER.

2.3. Theoretical Study

First-principles density functional theory (DFT) calculations are performed under the Perdew-Burke-Ernzerhof (PBE) [35] type of exchange-correlation functional for self-consistent calculations and geometry optimizations. Analyses were performed using VASP [36] (Vienna ab initio simulation package) under the projected augmented wave (PAW) [37] type pseudopotential and the plane-wave basis set with the energy cutoff of 400 eV, which is enough for the self-consistent calculation. The electronic density of states was obtained via the advanced hybrid DFT method (HSE06), where the exchange and correlation terms are described by hybrid functional [38] containing 25% Hartree–Fock exchange. A set of Gamma-centered K-points sampled at 5 × 5 × 3 are used for the integration of the Brillouin zone. The convergence criteria for the electronic and ionic self-consistent calculations were set to be 10−4 eV and 10−3 eV, respectively. The FexCo3-xO4 structure with the variable x ranging from 0 to 2.0 with a step of 0.5 is considered in the calculation, and the associated results are analyzed.

3. Results and Discussion

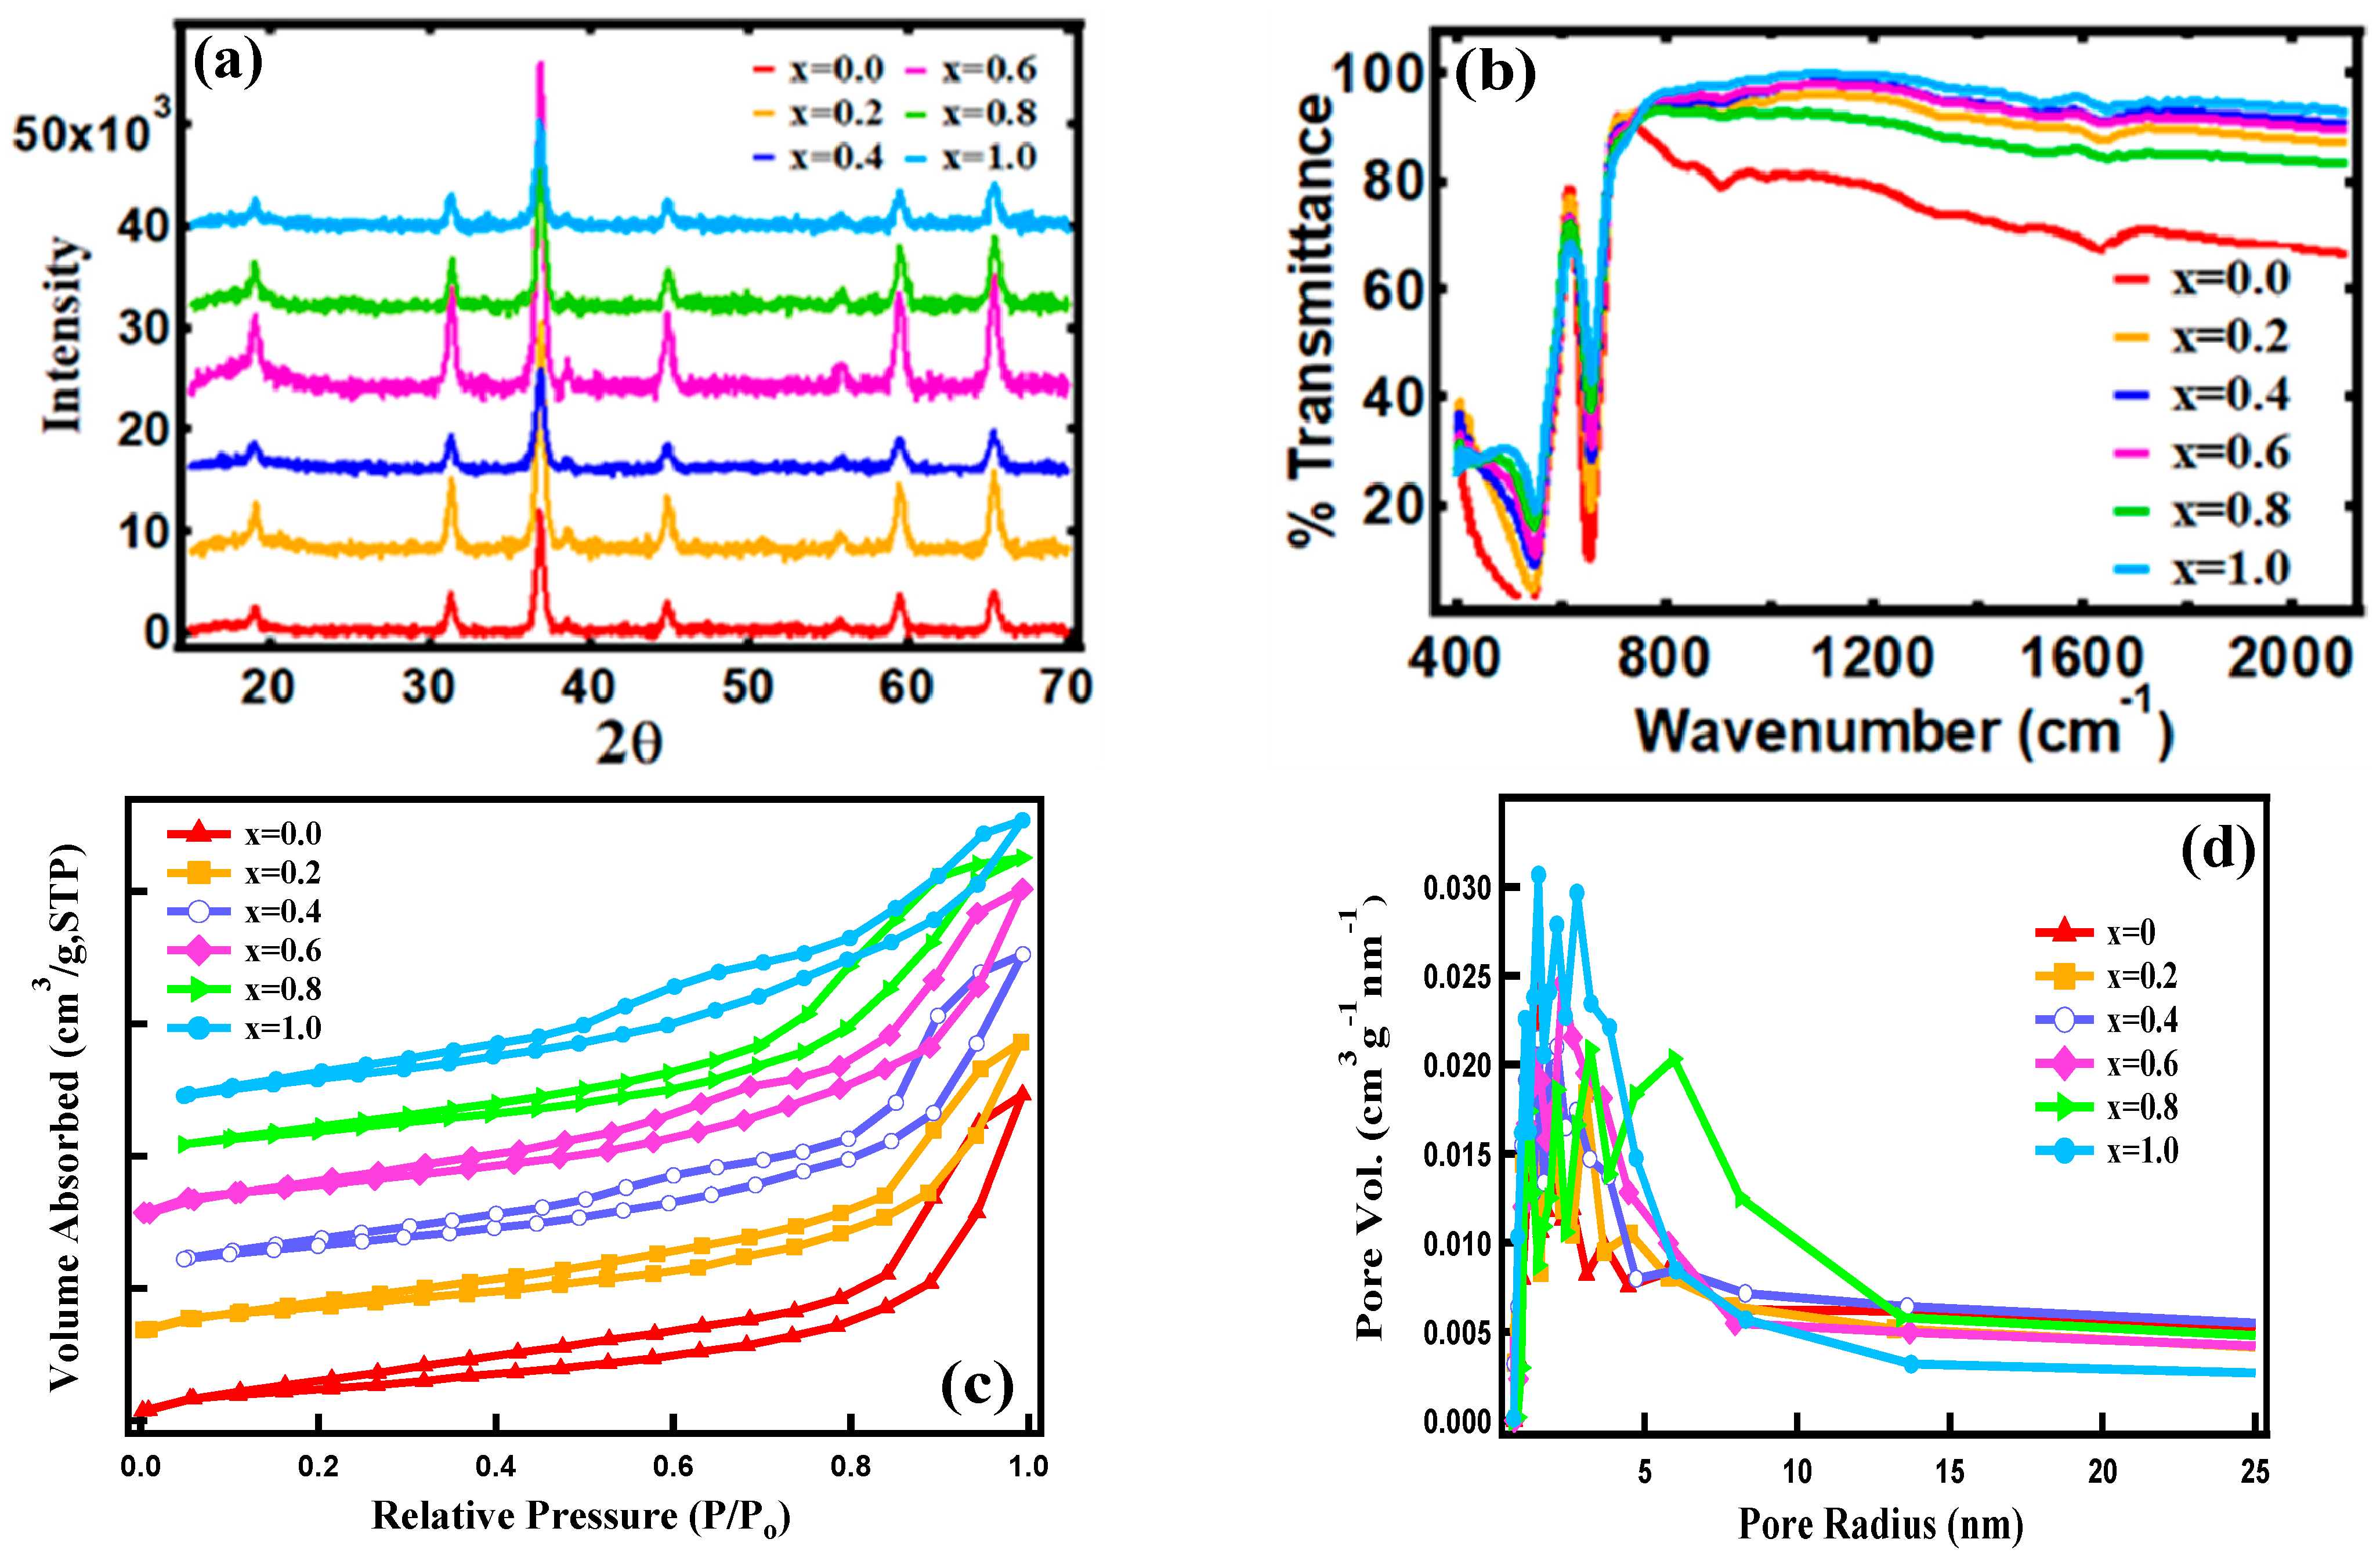
3.1. Structure and Morphology

Figure 2a shows the powder XRD patterns of FexCo3-xO4 samples at room temperature. The XRD patterns of the as-synthesized doped FexCo3-xO4 are almost identical and can be assigned to Co3O4 (ICDD card no.02-0770). The diffraction peaks located at 18.9°, 31.3°, 36.8°, 38.4°, 44.5°, 55.4°, 59.4°, and 65.2° are assigned to (111), (220), (311), (222), (400), (422), (511), and (440) and agree with a standard crystallographic pattern of the spinel Co3O4 phase [39]. Due to impurities, there are no diffraction peaks indicating that Fe3+ has completely dissolved into the FexCo3-xO4 structure. The lattice parameter of FexCo3-xO4 derived using TOPAS software (Bruker) is listed in Table 2. The average crystallite size of Co3O4 calculated using Scherrer’s formula [40] is listed in Table 2. The average crystallite size of FexCo3-xO4 falls within the range of 16.91 nm for x = 0.2 to 20.07 nm for x = 1.0. The noticeable increase in the crystallite size is due to bigger Fe3+ (rionic~0.64 Å) replacing Co3+ (rionic~0.61 Å). Moreover, sharp diffraction peaks indicated the crystalline nature of the calcined FexCo3-xO4 nanostructures.
The FTIR spectrum Figure 2b displays two distinct bands at 538.060 (ν1) and 653.295 (ν2) cm−1, which arise from the stretching vibrations of the metal-oxygen bonds [41]. The presence of these vibration bands confirms the development of pure phase spinel FexCo3-xO4 nanostructures. Fe doping shows a shift of stretching peak towards the right with an increase in Fe3+ content. As the vibrational frequency is inversely proportional to the mass, the increase in vibrational frequency with Fe3+ is expected due to the lower atomic weight of Fe (55.8 u) replacing the Co (58.9 u) ion.
The N2 adsorption/desorption was measured at 77 K with a relative pressure P/Po ranging from 0.029 to 0.99. From these adsorption/desorption curves, BET specific surface areas and corresponding BJH pore sizes were calculated for all FexCo3-xO4 (0 ≤ x ≤ 1.0), as shown in Figure 2c,d. These curves show the most significant number of pores distribution around 2–4 nm for all FexCo3-xO4. This pore size distribution range could help boost the diffusion kinetics inside the electrode material [42]. Table 2 lists measured BJH pore radius, volume, and BET surface area of FexCo3-xO4 samples. The reported higher surface area, in the range of 59.47 to 87.45 m2/g, of samples indicates that the hydrated electrolyte ions could have high contact area at the electrolyte/electrode surface for the Faradaic redox reaction [27]. The observed increase in the surface area of FexCo3-xO4 samples could be due to particle morphology and crystal packing.
Figure 3 shows the SEM images of FexCo3-xO4 as a function of Fe3+ content. FexCo3-xO4 morphology evolves from thin nanosheet-like architecture for x = 0.0 to nanoflower for x = 0.4 to thicker nanoplates for x = 1.0. It is evident that the morphology of FexCo3-xO4 has a dependence on the Fe3+ content in the sample. The initial nanosheet-like structure slowly merges and morphs into a thick plate-like structure with increasing Fe3+ content. Usually, impurity addition influences the size and morphology of a given crystal by participating in the nucleation and growth process, in which several factors integrate to dominate the process. The crystal growth may vary between fractal aggregation in the initial period and subsequent diffusion processes [43,44]. In addition, the morphology would be affected by the nucleation and the growth process, which, in turn, depends on the charge status of the surface states and dangling bonds. Further, the hydrolysis of urea is accompanied by gas formation, which increases the pressure in the system and could perturb nanocrystalline growth and bring morphological changes.

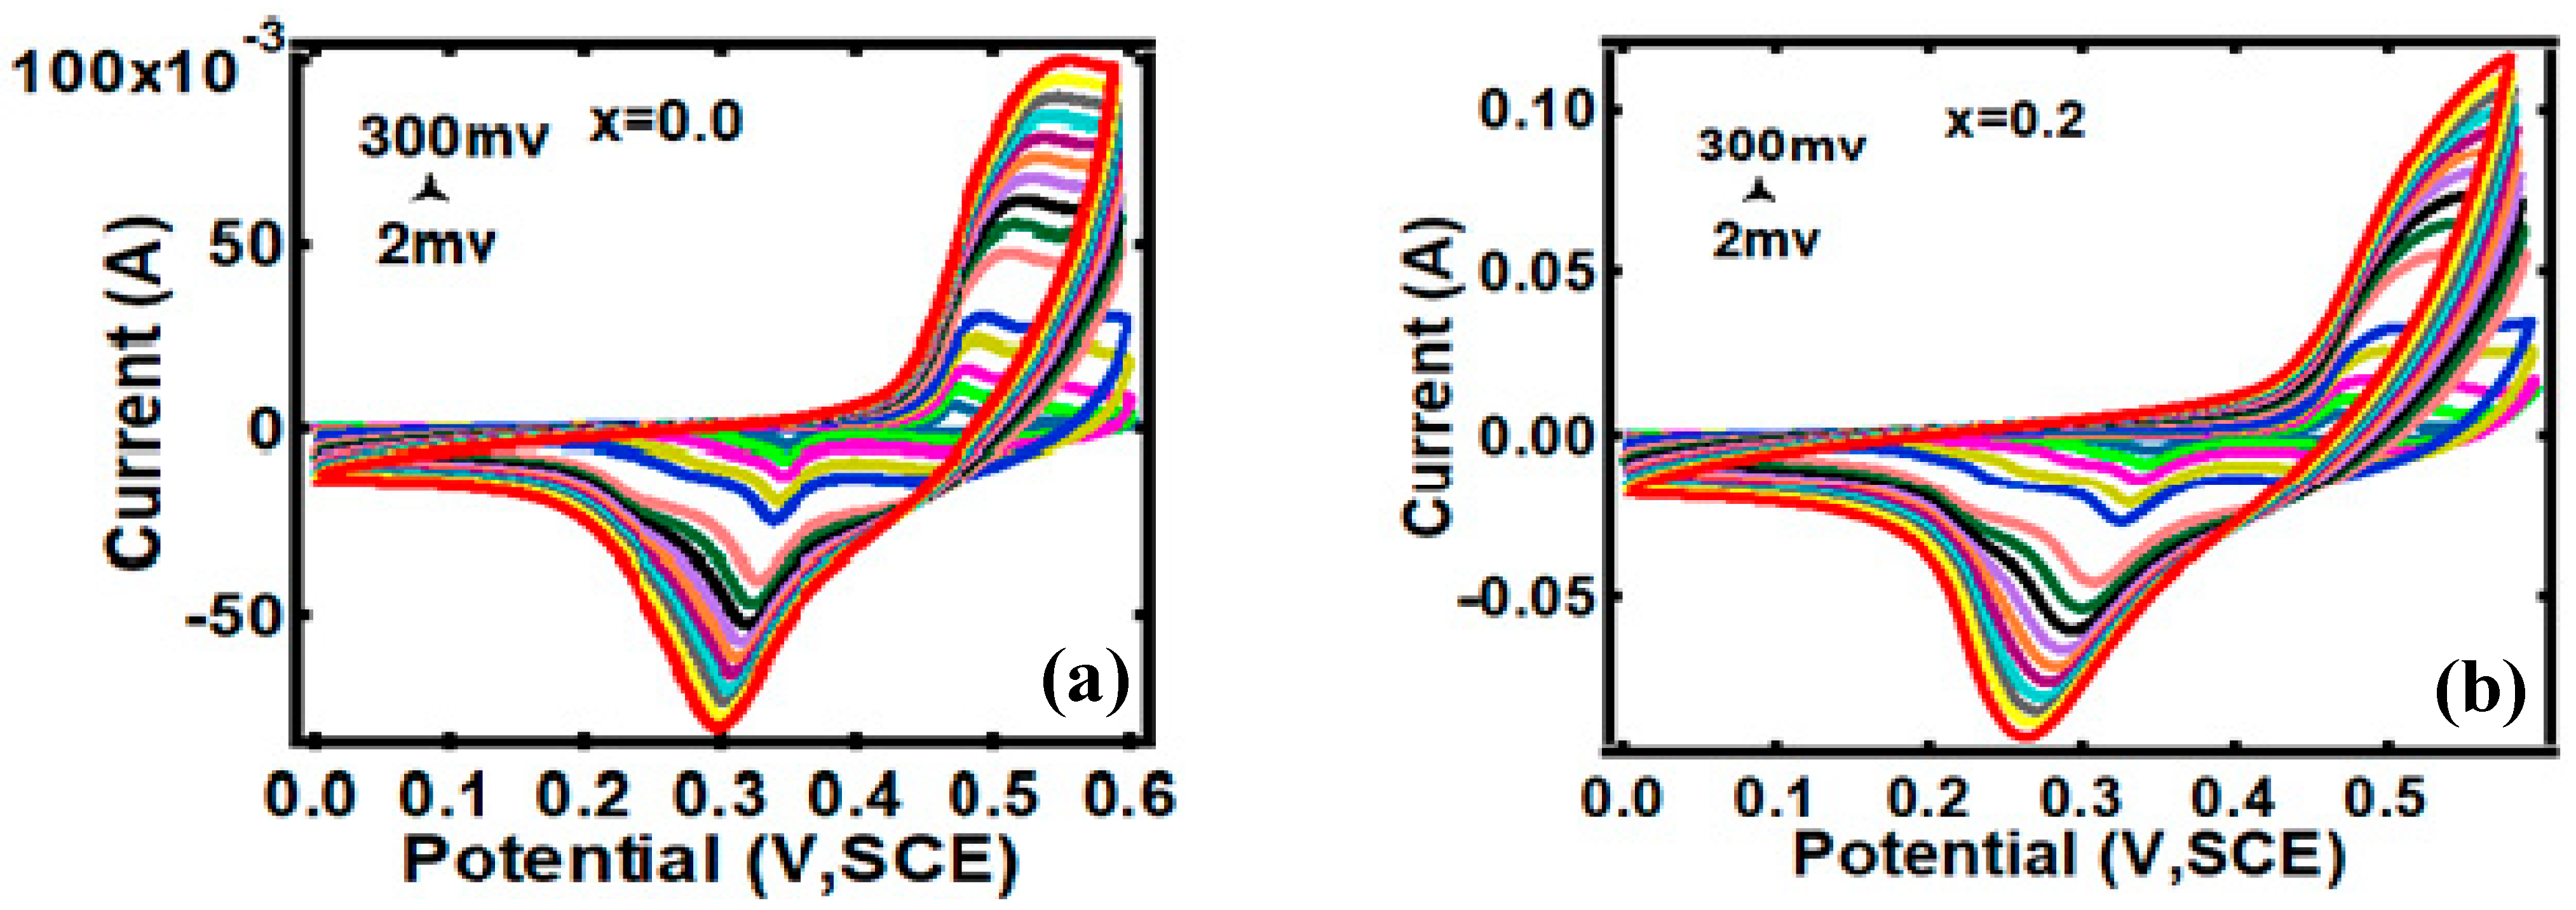
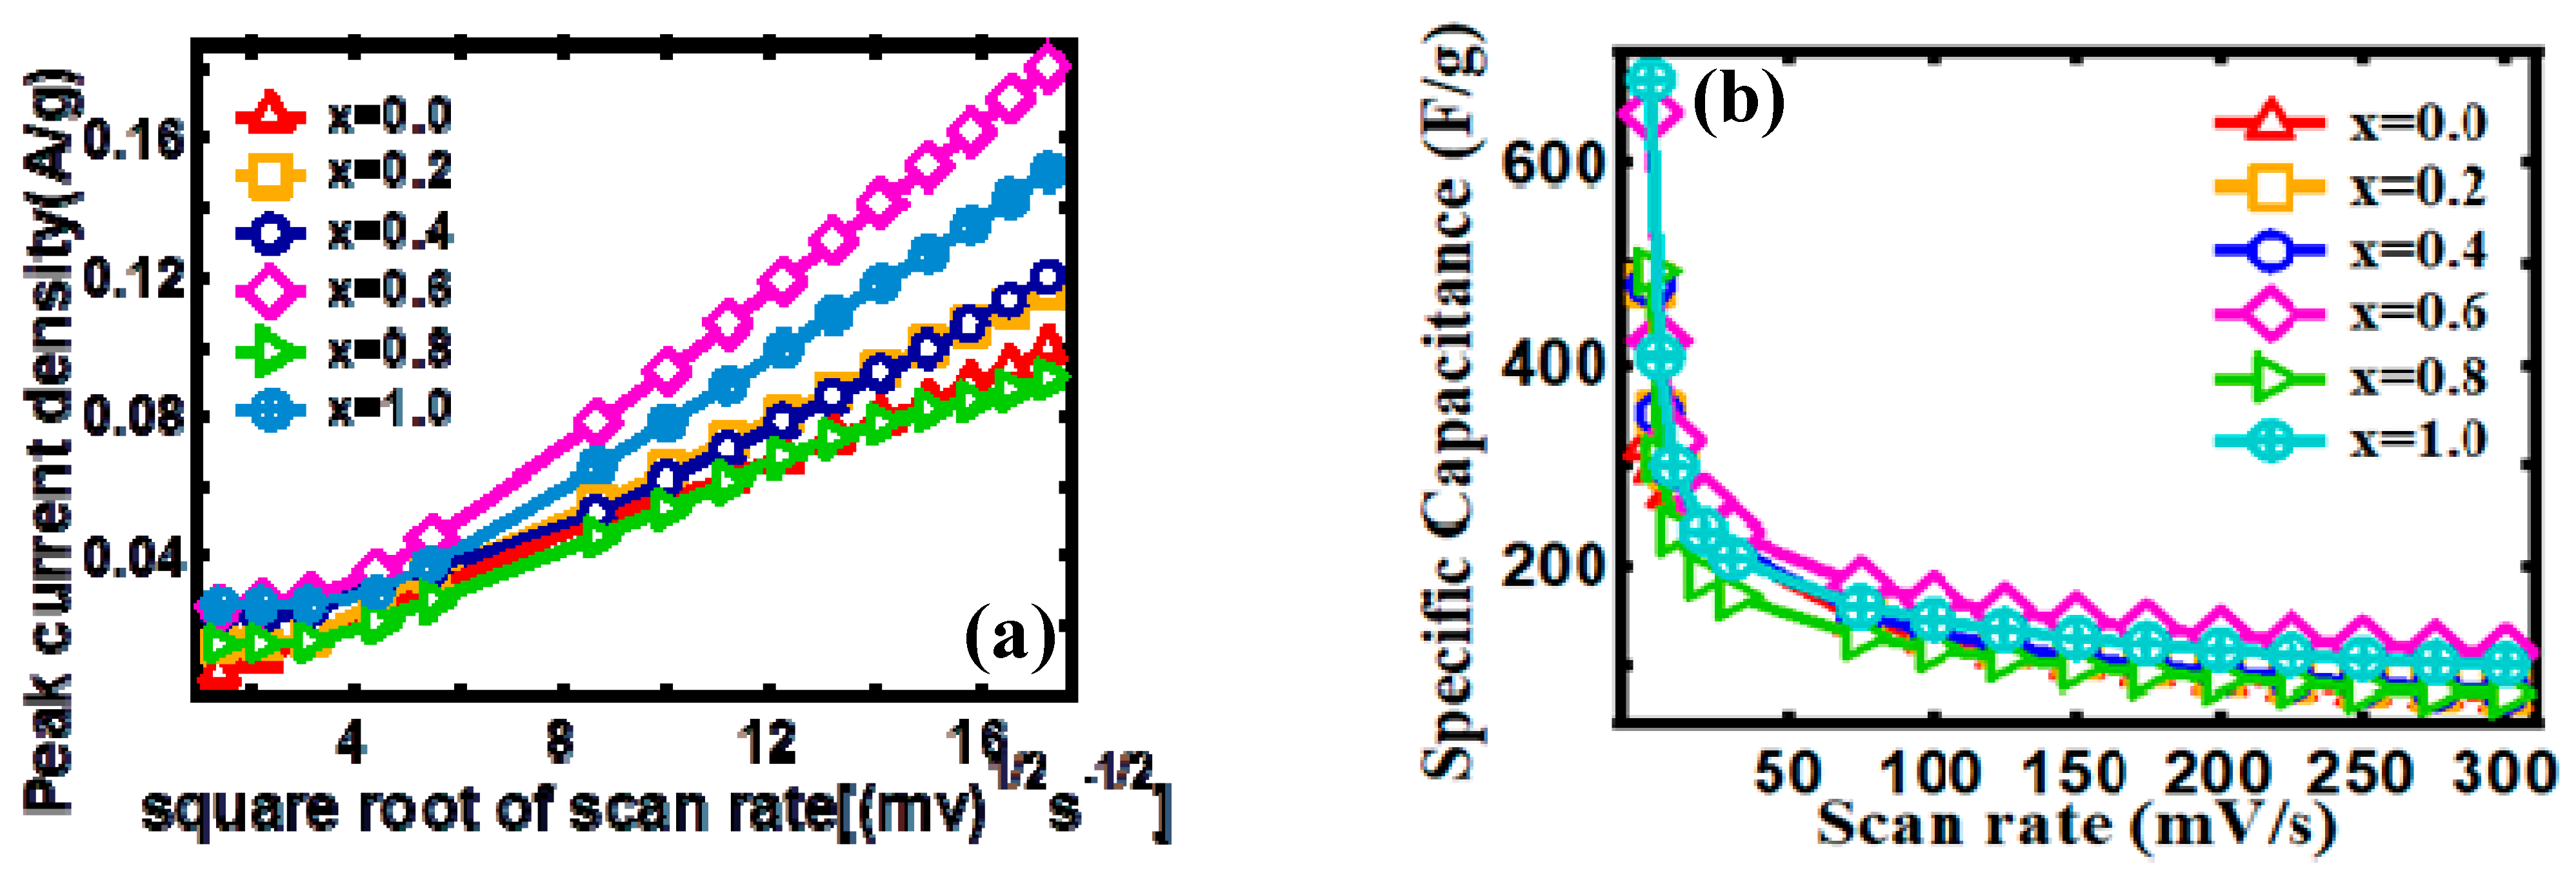
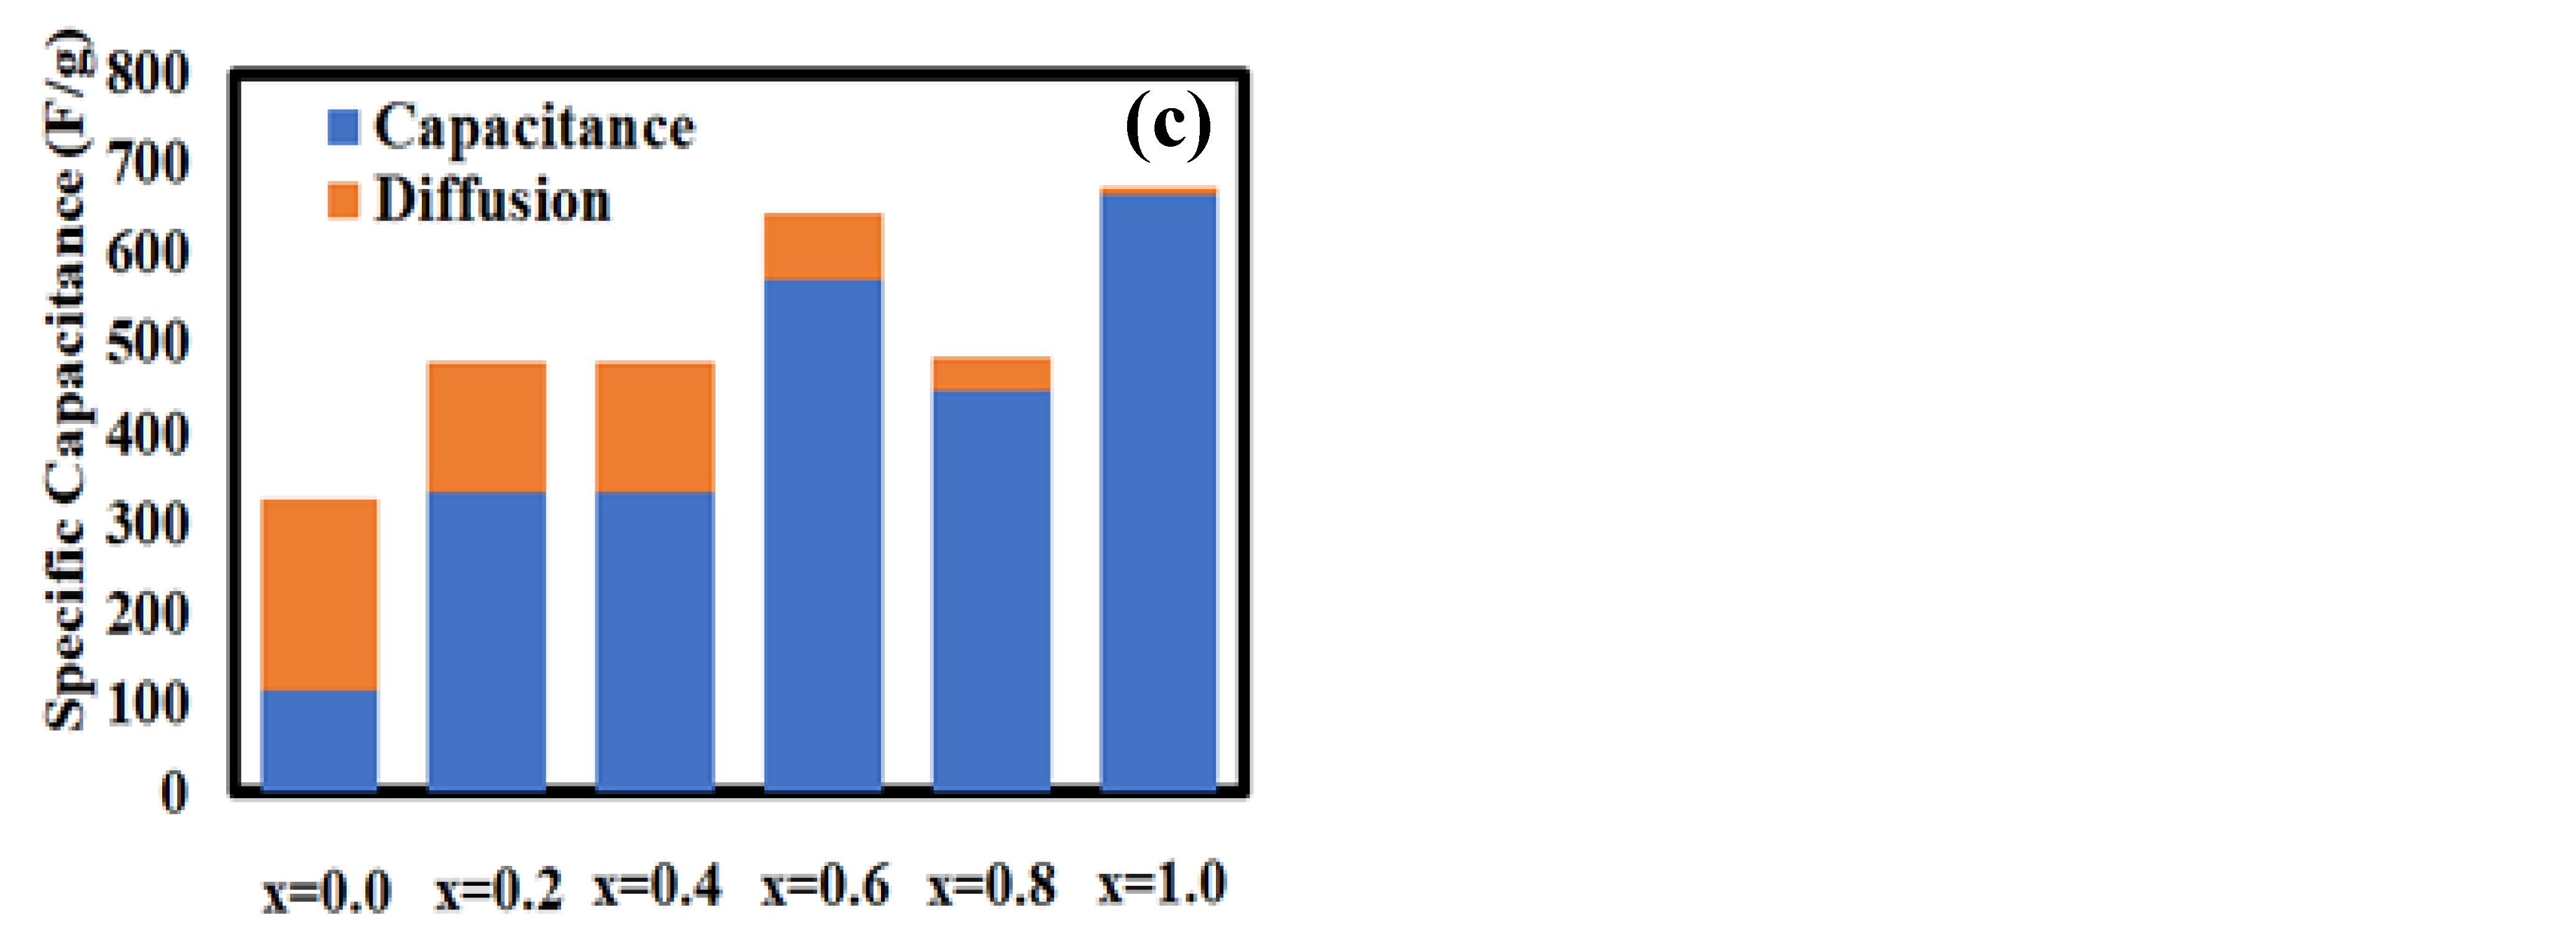
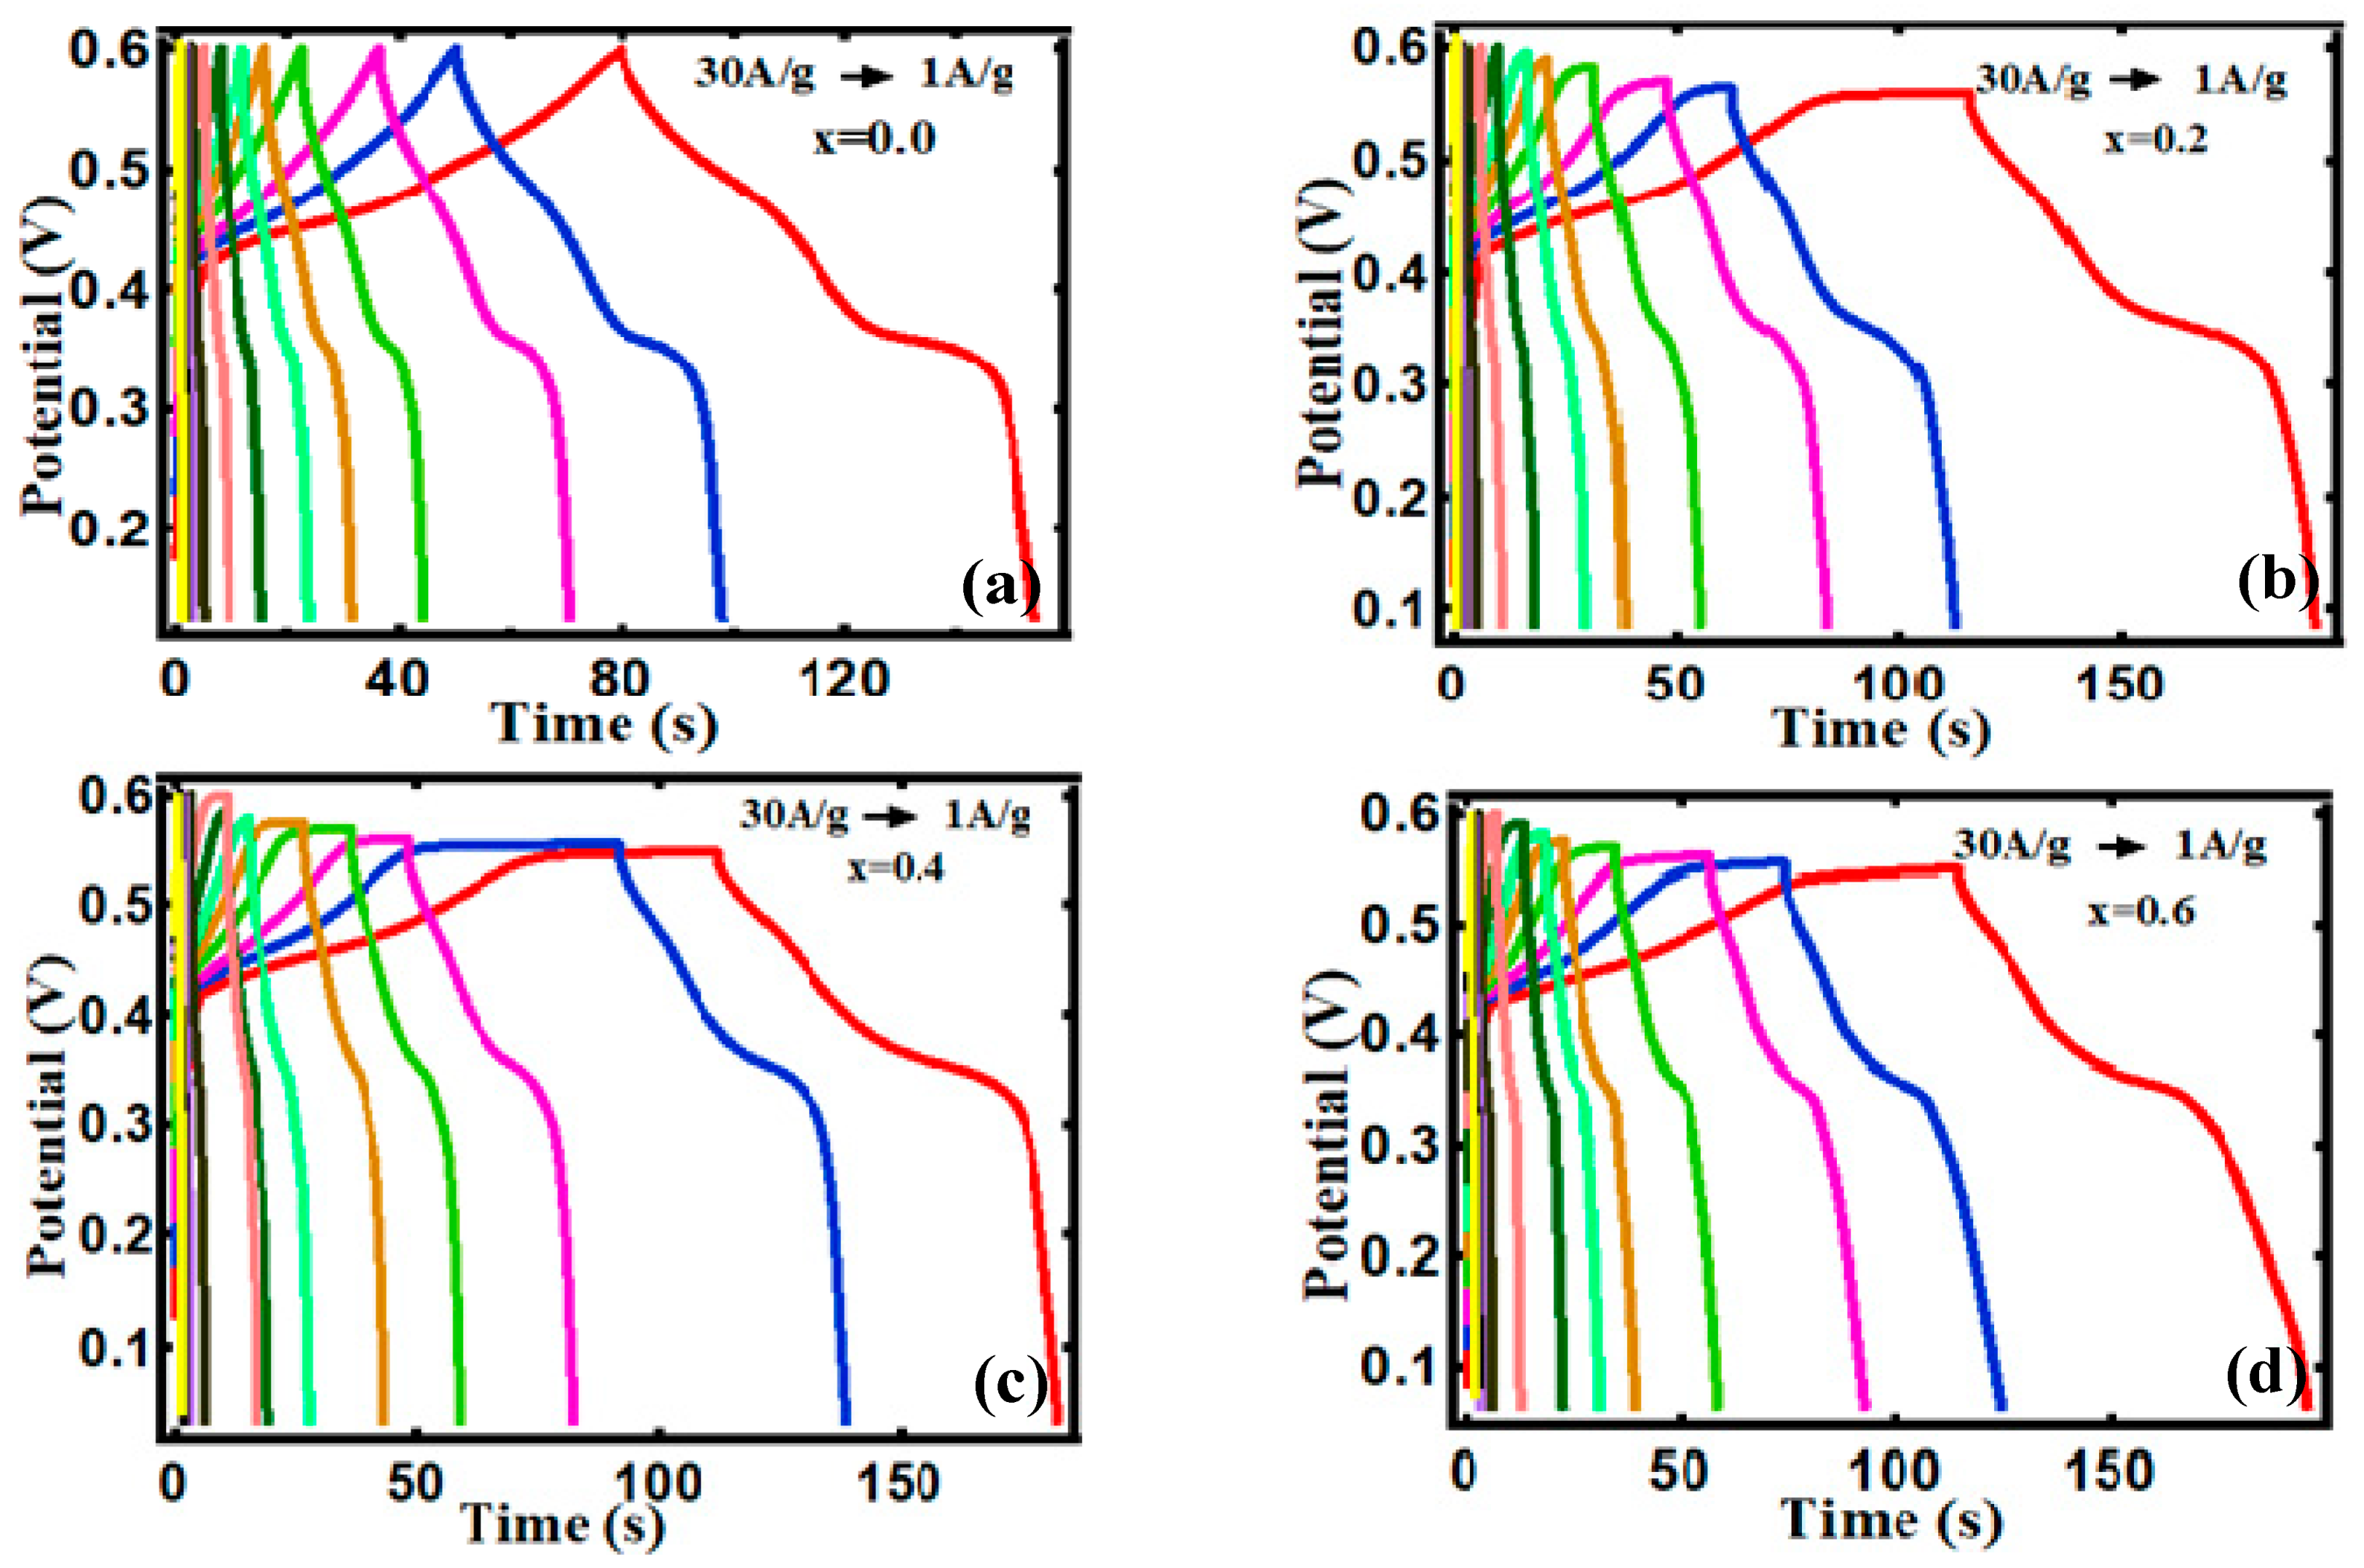
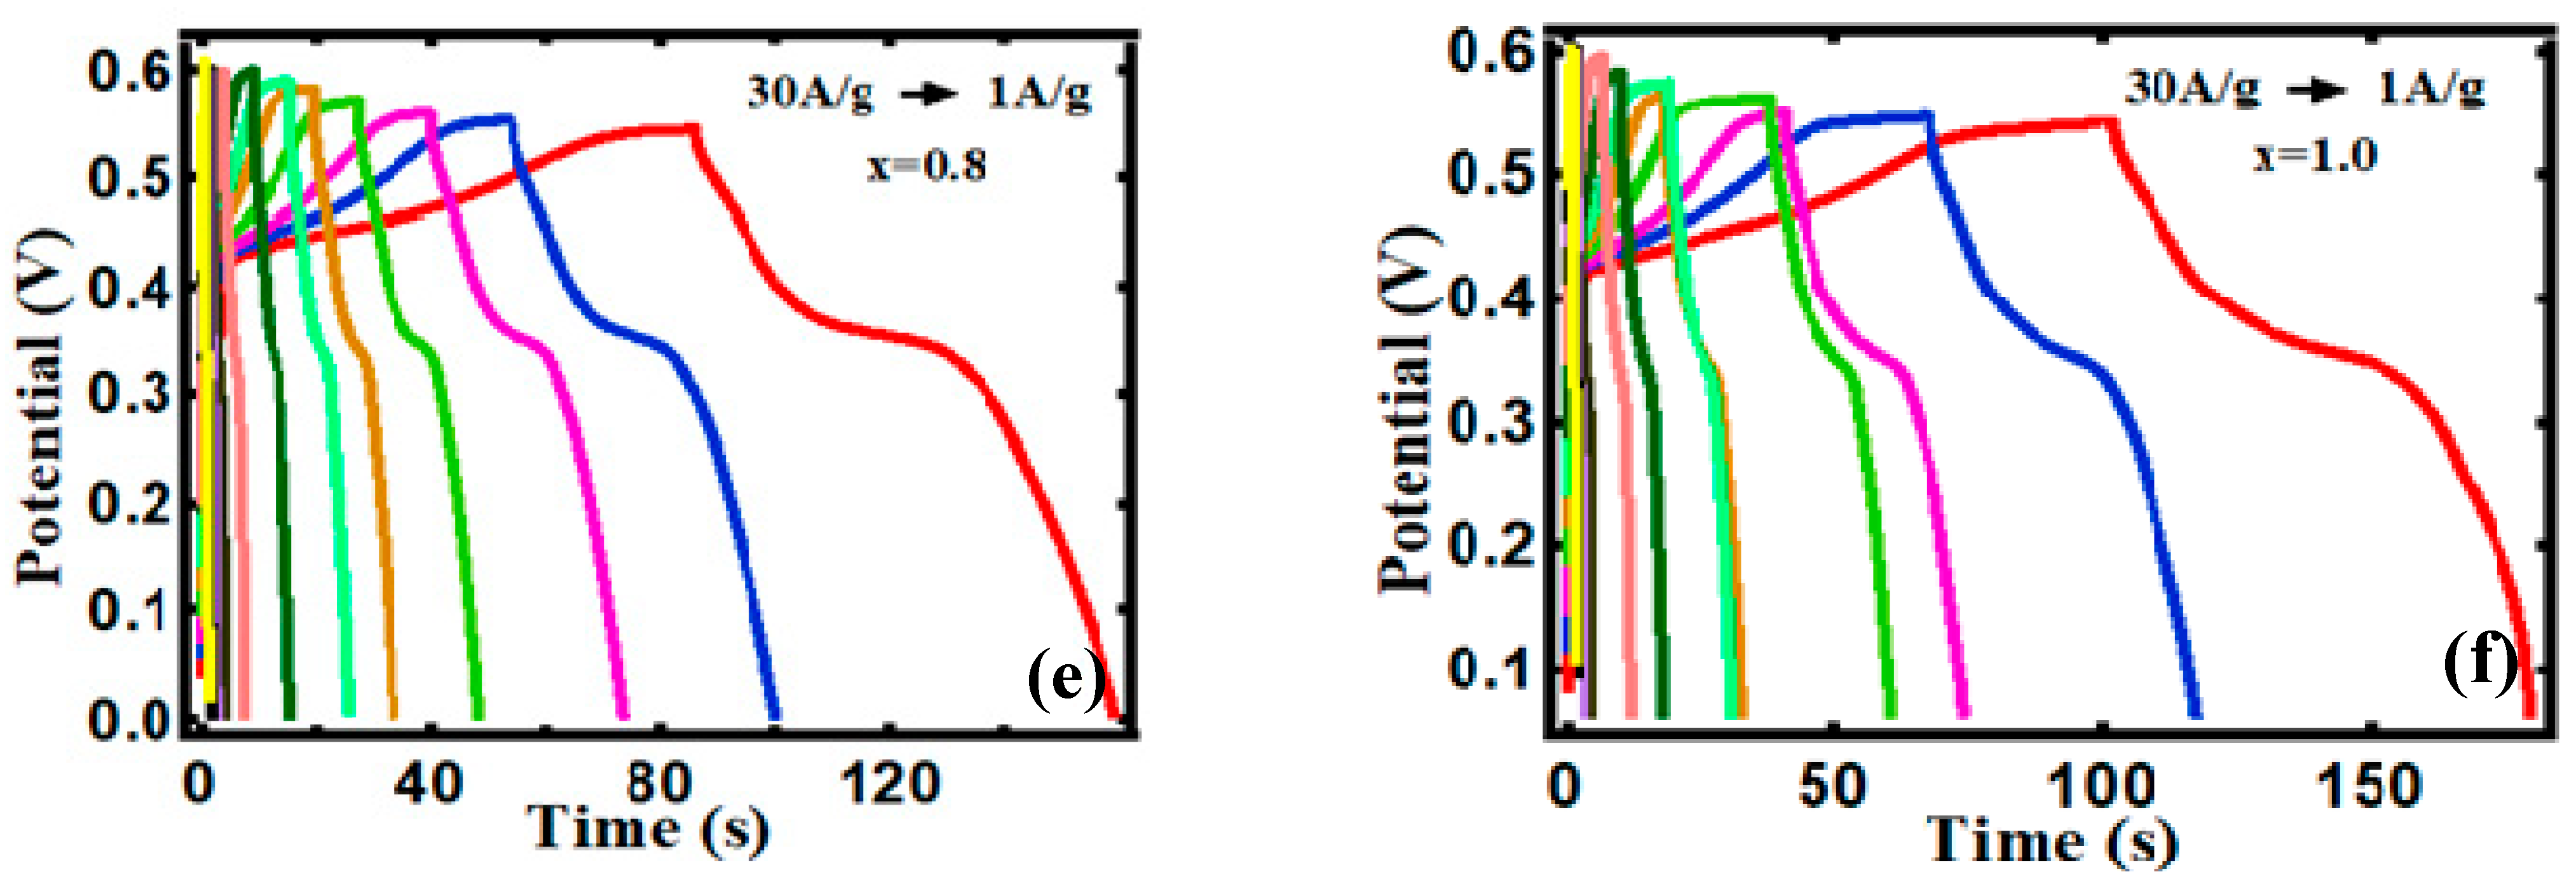
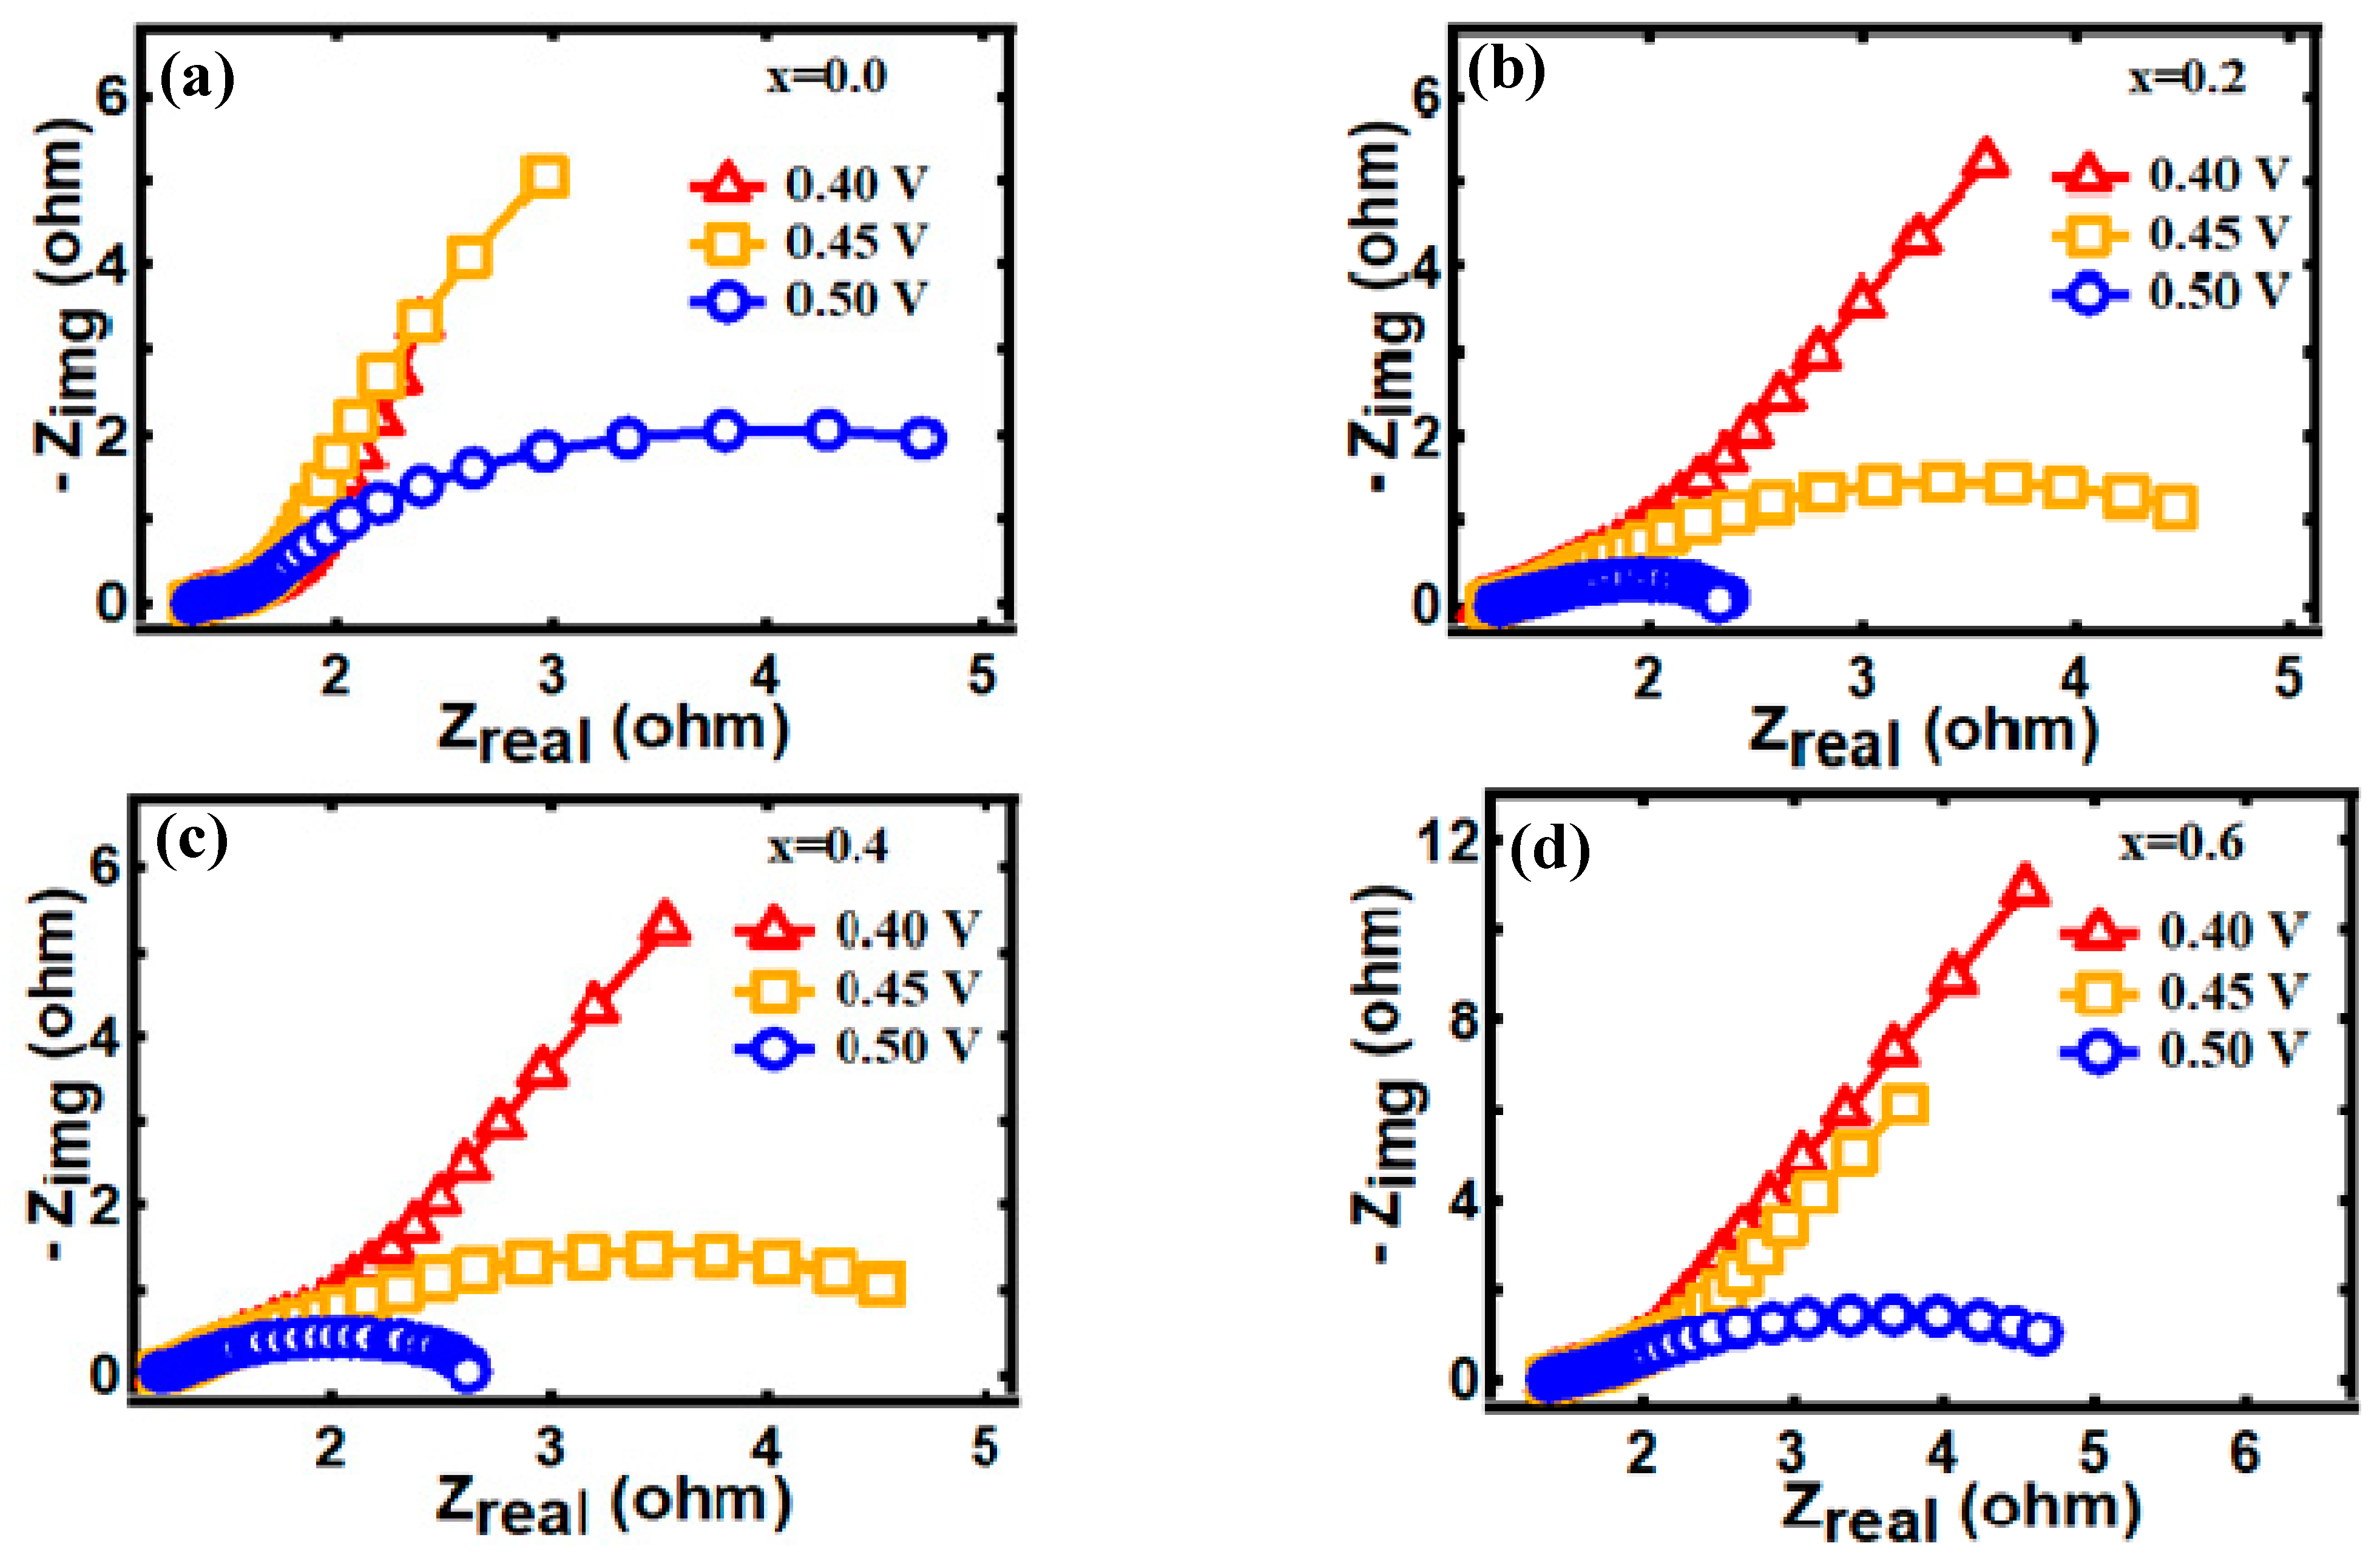
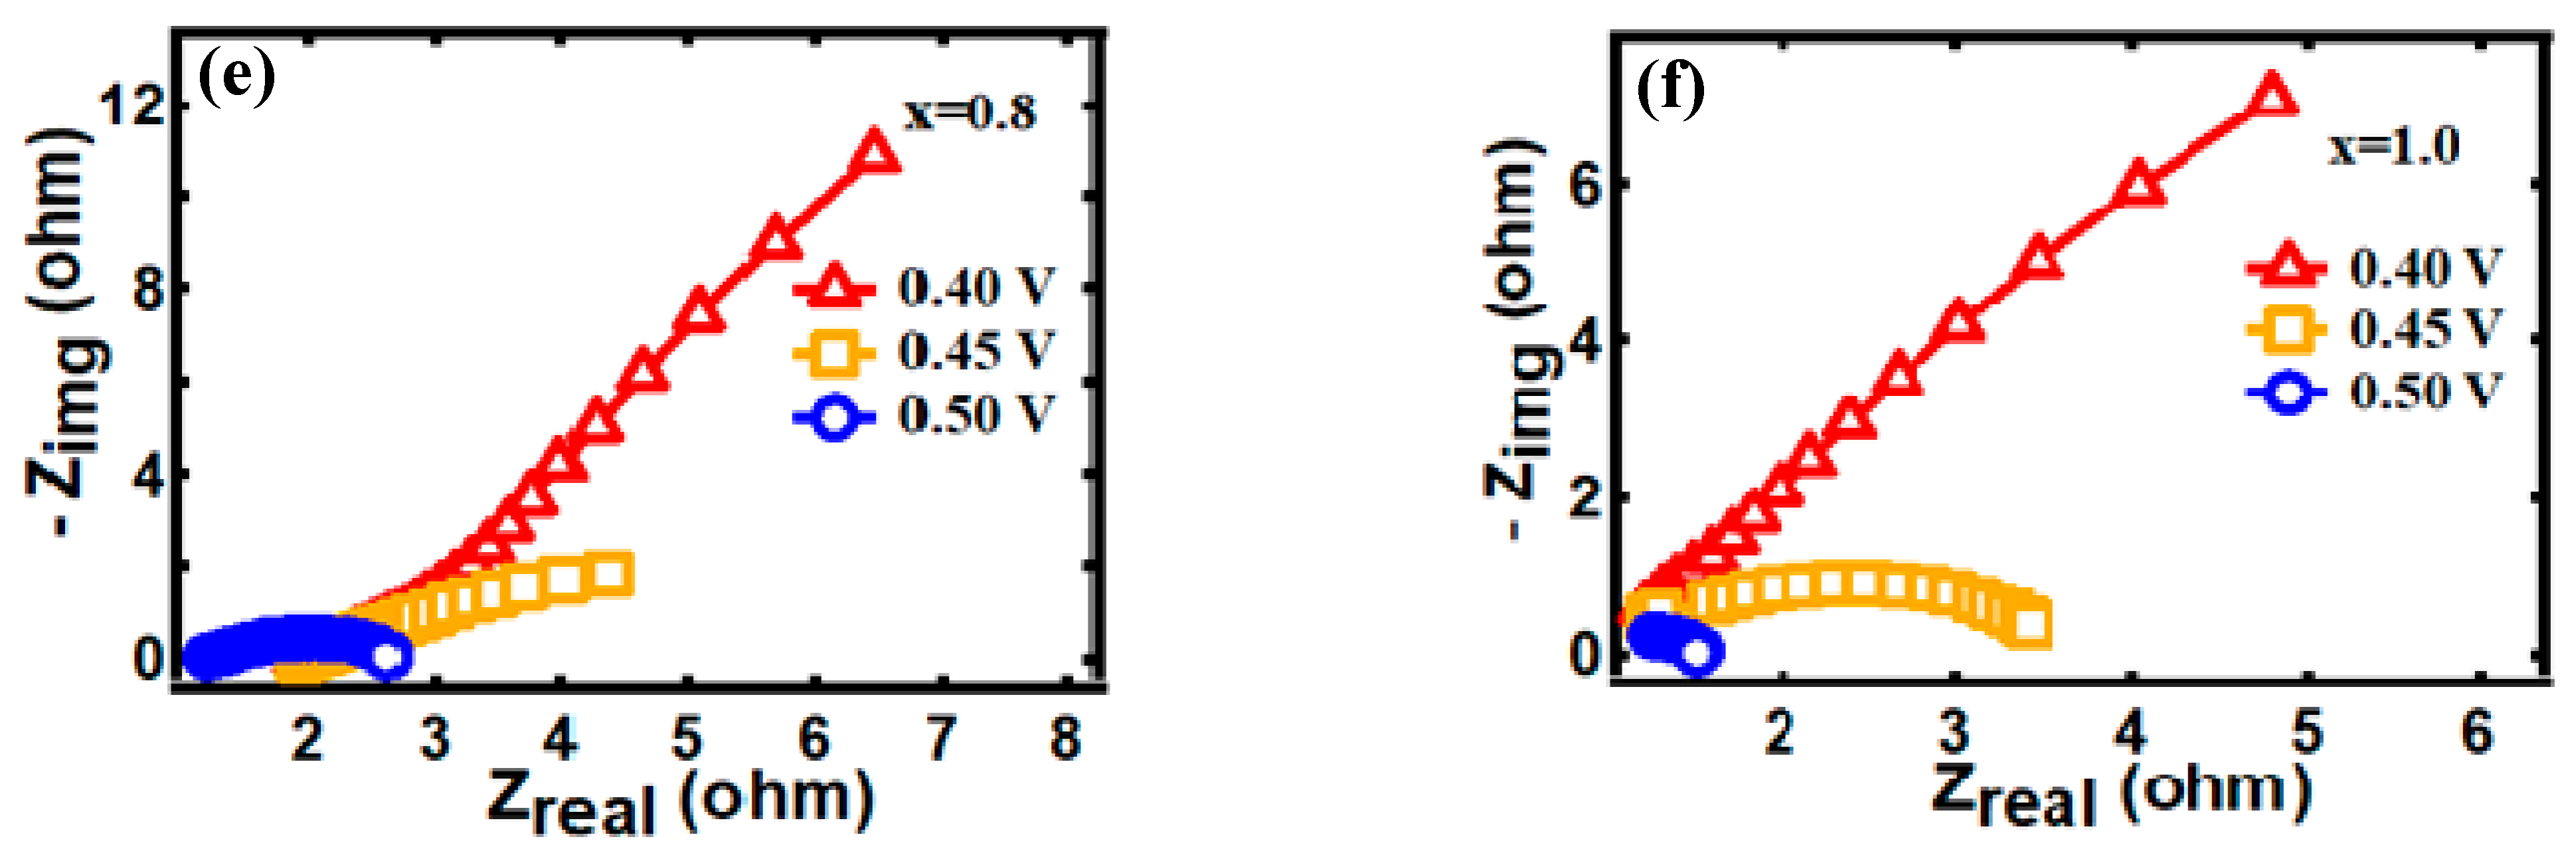
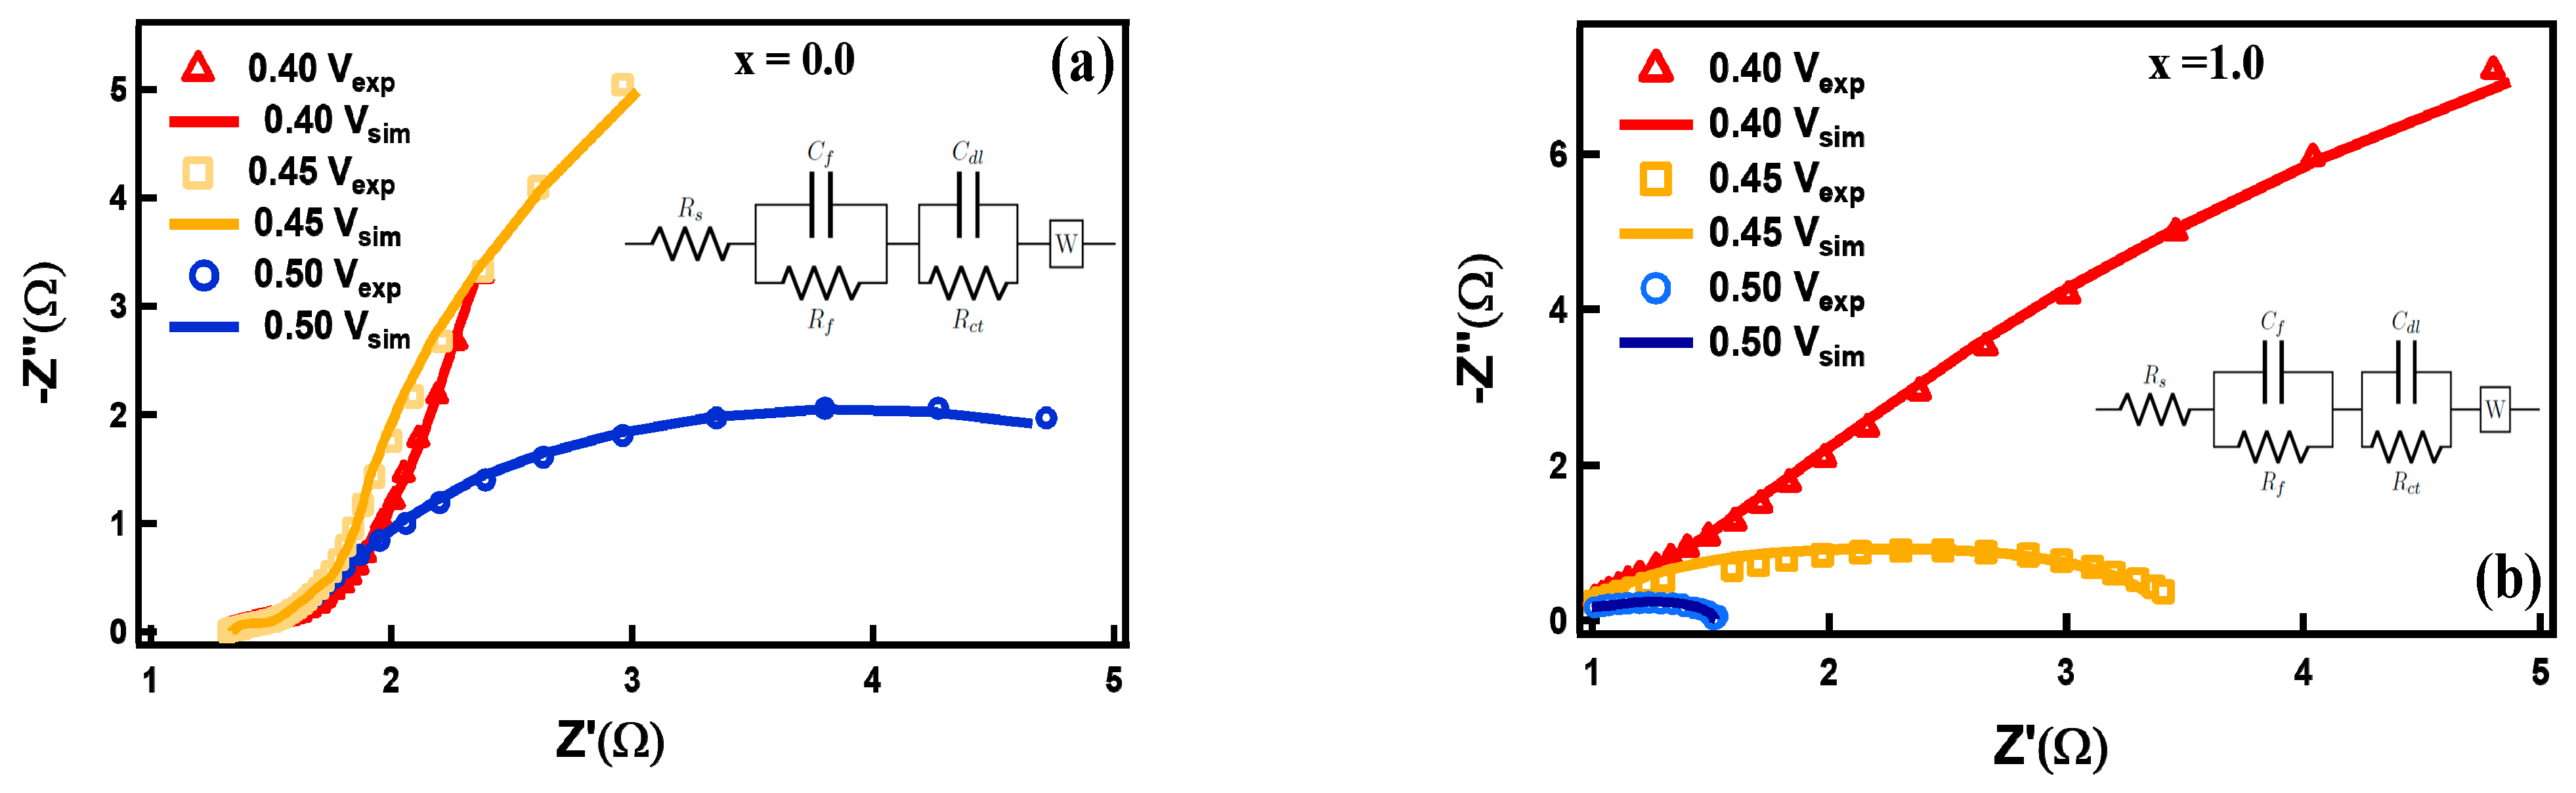
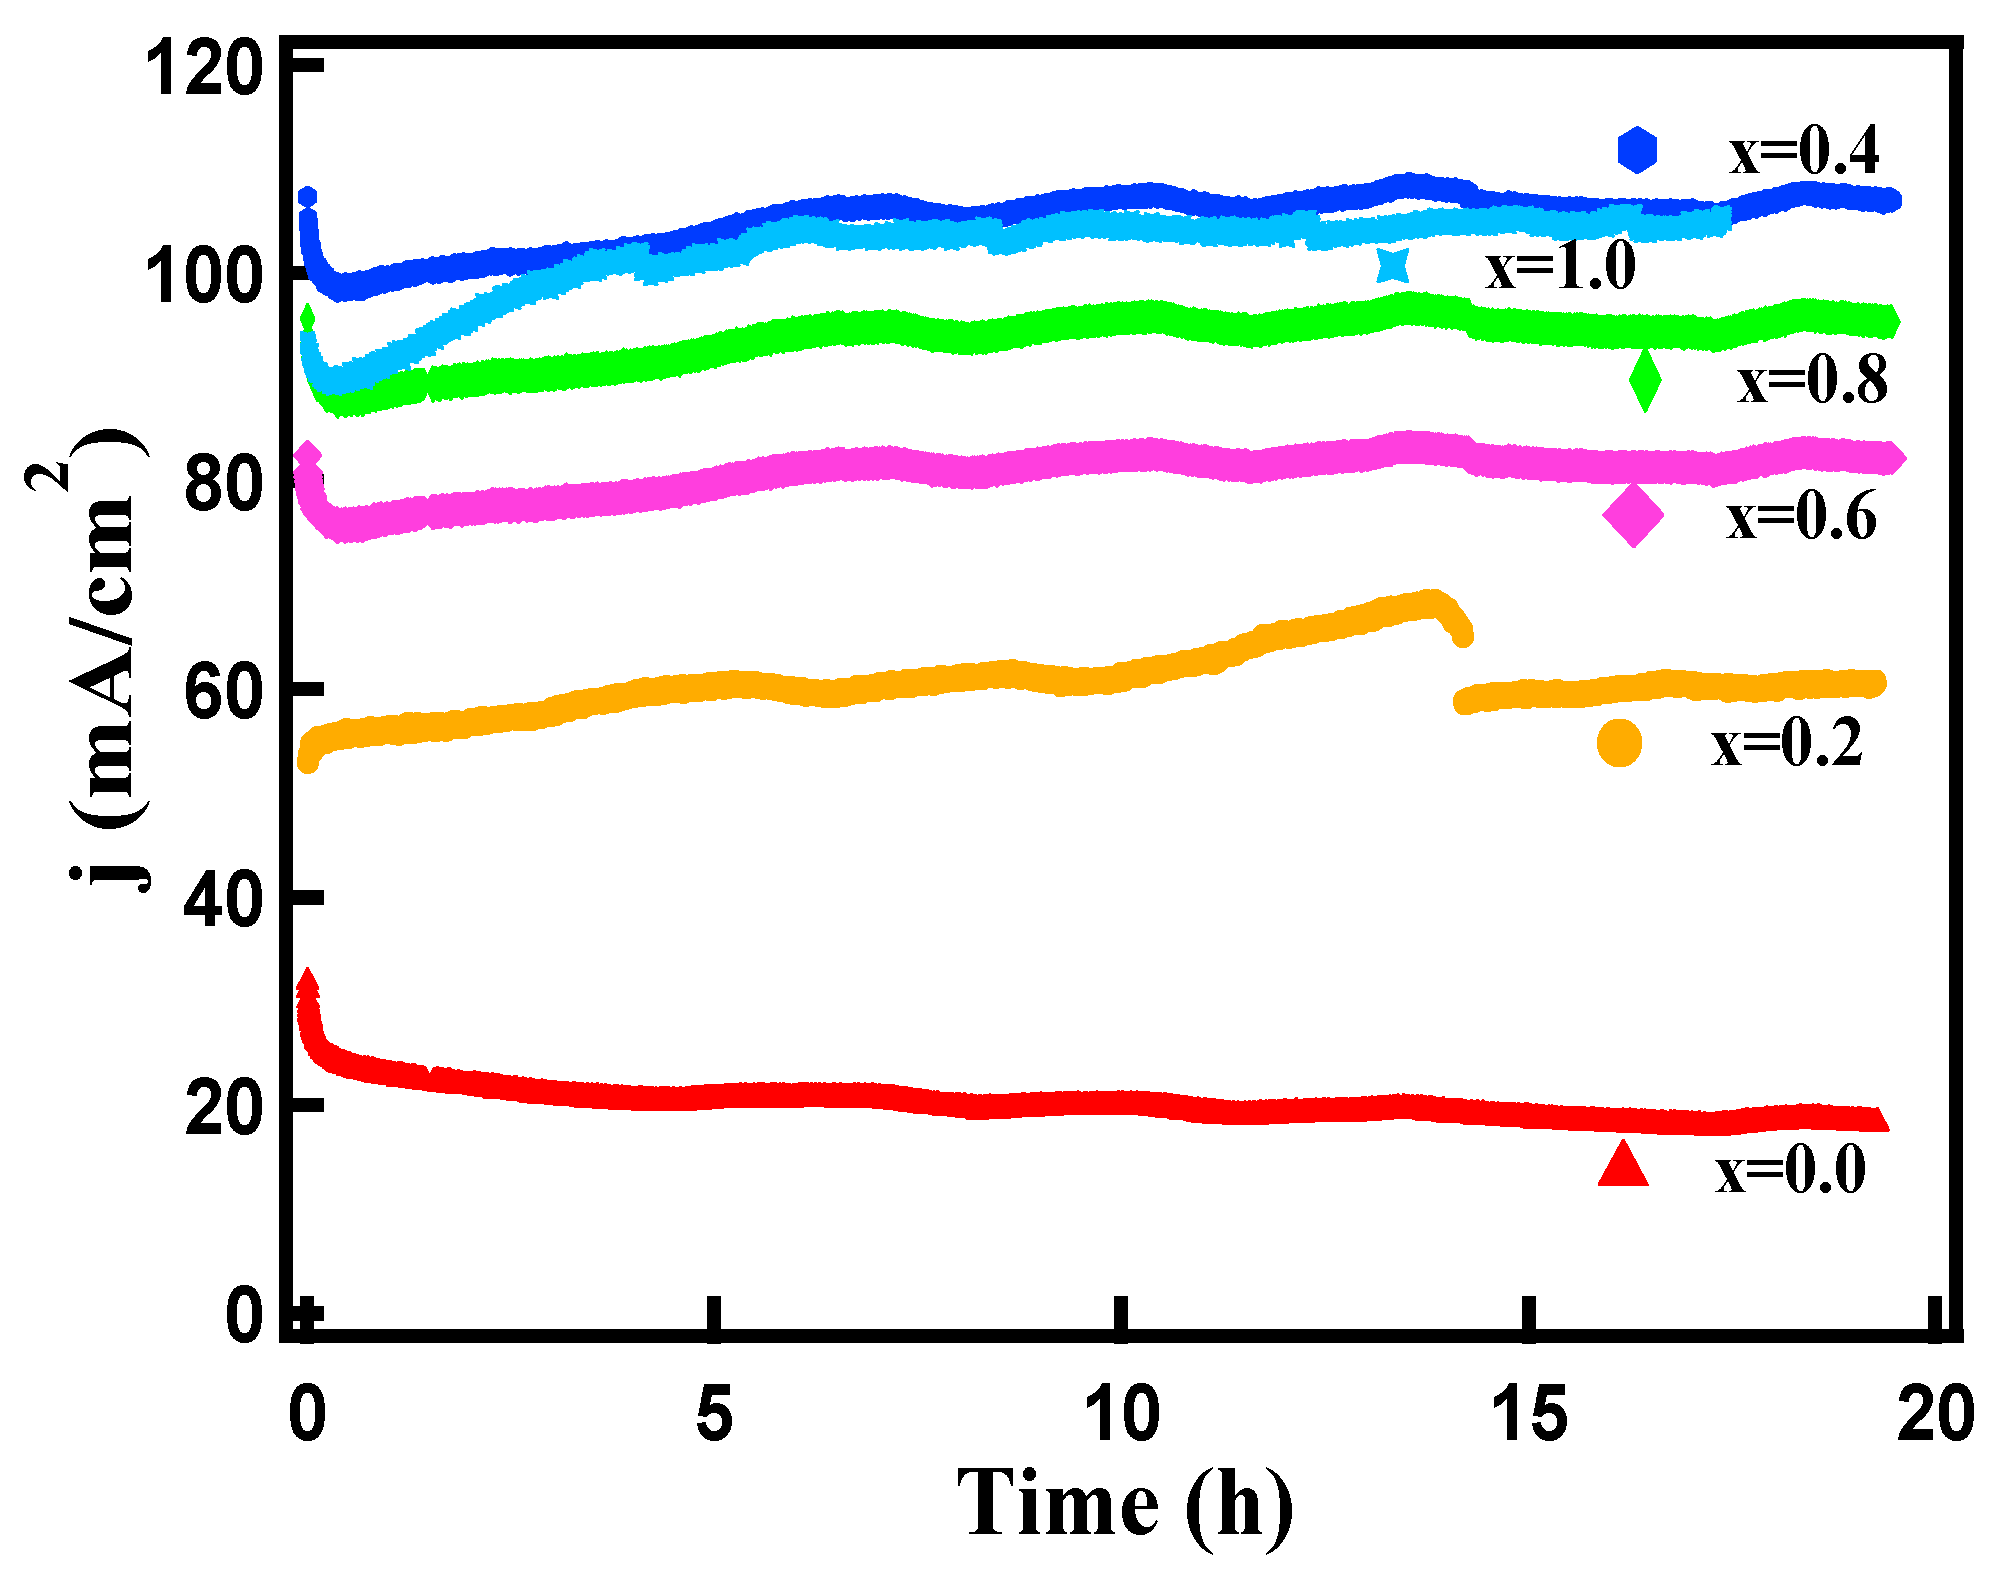
3.2. Electrocapacitive Study

The electrochemical performance of FexCo3-xO4 nanostructures is determined using cyclic voltammetry (CV) and galvanostatic charge-discharge (GCD) techniques. Figure 4a–f) illustrates the cyclic voltammograms acquired at various scan rates (2–300 mV/s) in a voltage window of 0–0.6 V (vs. SCE). The Equation below gives the faradic reaction for FexCo3-xO4 [32].
FexCo3-xO4 + OH + H2O ↔ x FeOOH + (3-x) CoOOH + e
CoOOH + OH ↔ CoO2 + H2O + e
FeOOH + H2O ↔ Fe(OH)3 ↔ FeO2 + H2O + e
Oxidation and reduction peaks in the cathodic and anodic scans were seen in all CV curves [45]. The pseudocapacitive character of electrodes is indicated by non-rectangular and asymmetric CV curves [46]. The CV curves of FexCo3-xO4 show no additional redox peaks, indicating that the redox processes in FexCo3-xO4 are quite similar to those in Co3O4. The peaks are due to the redox reaction related to M-O/ M-O-OH, where M stands for Fe or Co ions [28]. A positive shift in oxidation peak potential and a negative shift in reduction peak potential are seen when the scan rate increases [47]. This PC characteristic is derived from the faradaic redox reaction related to the reversible reaction of Fe2+/Fe3+ and Co3+/Co4+ transitions.
Figure 5a shows the Randles–Sevcik plots of the FexCo3-xO4 samples. When the scan rate increases from 2 to 300 mV s−1, the anodic peak current (Ipa) and the cathodic peak current (Ipc) both increase. More precisely, both Ipa and Ipc vary linearly with the square root of the scan rate (ν1/2) described by the Randles-Sevcik equation [48]. This relationship indicates that the redox reaction at the electrode–electrolyte interface is fast, quasi-reversible, and limited by electrolyte diffusion [49]. The positive shift in the oxidation peak and the negative shift in the reduction peak potential show that the electrode materials have low resistance and have strong electrochemical reversibility [27]. The specific capacitance was calculated from CV curves using the Equation below [29,50,51]:
Csp = (I*t)/(m*ΔV)
Here, Csp is the specific capacitance (F/g), I (A) is the charge-discharge current, ΔV (V) is the potential range, m (g) is the mass of the electroactive materials, and t (s) is the discharging time. The Csp of FexCo3-xO4 samples as a function of scan speeds is shown in Figure 5b. The obtained values of Csp for FexCo3-xO4 nanostructures are 321, 479, 479, 649, 492, and 684 F/g at a scan rate of 2 mV/s for x = 0.0, 0.2, 0.4, 0.6, 0.8, and 1.0, respectively. Compared to all FexCo3-xO4 nanostructures, FexCo3-xO4, x = 1.0, exhibited the highest specific capacitance at all scan rates with a maximum value of 684 F/g at 2 mV/s. Higher electrochemical utilization and high electroactive surface area of the synthesized nanostructure occur for FexCo3-xO4, x = 1.0.
The total charge storage process is affected by factors such as the faradaic contribution from the insertion process of electrolyte ions, the faradaic contribution from the charge-transfer process, the high surface area contribution from pseudocapacitance, and the non-faradaic contribution from the double layer effects. Data from the CV are evaluated at various scan rates and can be used to characterize capacitive effects by equation [52].
I = a vb
Here, the peak current is I (A), the scan rate is v (mV/s), and a and b are adjustable parameters. The value of b defines the charge storage mechanism and b-values as a function of potential for the cathodic sweeps. The parameter b value is determined by plotting log(i) versus log(v) curves. If b = 1, then the capacitive surface mechanism is dominant, which indicates a fast near-surface controlled reaction, and if b = 0.5, it indicates a diffusion-controlled faradaic reaction during the charge storage mechanism [53]. Figure 5c shows the peak current vs. square root of the scan rate curve. These curves are fitted with Equation (2), which gives values of b~0.5392, 0.4792, 0.3714, 0.455, 0.4336, and 0.4158 for x = 0.0, 0.2, 0.4, 0.6, 0.8, and 1.0, respectively. When the b value approaches 0.5, it indicates that the electrochemical reaction is dominated by ionic diffusion, whereas, when it approaches 1, the capacitive behavior dominates the total process [54]. Furthermore, the lower value of the scan rate region in Figure 5c exhibits a linear relationship with the square root of the scan rate, indicating a quasi-reversible electrochemical process [55]. Figure 5c shows that, at scan rates greater than 100 mV/s, ion diffusion is limited to the surface of the active material of the electrode, i.e., EDLC dominates over the pseudocapacitor, and OH diffusion can adhere only to the outer layer of the nanostructure, which contributes less to the electrochemical capacitive behavior [56]. On the other hand, at scan rates lower than 100 mV/s, the faradaic redox reaction dominates due to more efficient use of the active material in the working electrode, and diffusion of OH ions can easily penetrate deep into the nanostructure’s interlayer, resulting in the adsorption of more ions and thus resulting in a higher specific capacitance [56].
There are two different mechanisms for current response at a fixed potential: the first is capacitive, and the second is the diffusion process [57]; the Equation below gives each contribution.
Csp = k1 + k2 v−1/2,
where k1 and k2 are determined from the Csp vs. v−1/2 linear plot; k2 is the slope, and k1 is the intercept. k1 indicates diffusion, and k2 shows capacitance contribution to the total specific capacitance for a given voltage. For the calculation, the specific capacitance was plotted against the slow scan rate up to a value of 20 mV/s and a regression fit was performed using Equation (3). The obtained values for k1 and k2 were used to determine the fractional contribution in terms of diffusion and capacitance from the total specific capacitance, given in Figure 5c. Figure 5c shows that the contribution to the current response at a fixed potential is more capacitive than diffusive, increasing with the Fe content.
Galvanostatic charge-discharge (GCD) experiments were carried out in 3M KOH solution within the voltage window of 0.0 to 0.6 at varied current densities ranging from 1 A/g to 30 A/g to further quantify the potential applicability of as-prepared electrodes for supercapacitors. Figure 6a–f shows GCD curves. These results indicate that FexCo3-xO4 electrodes can charge and discharge quickly with good electrochemical reversibility at various constant current densities. The non-linear relationship between potential and time in both charge-discharge cycles, as in CV curves, indicates that the capacitance of the studied nanomaterials is not constant between potential ranges and reflects typical PC behavior [58]. The non-linearity of the GCD curve is a consequence of the Co3+/Co4+ ions’ redox reactions with OH. The discharge process is divided into three distinct steps: the first is a rapid potential drop caused by internal resistance; the second is a slow potential decay at an intermediate time caused by the faradaic redox reaction, and the third is a fast potential decay caused by electric double layer capacitance [30]. The specific capacitance for electrodes of FexCo3-xO4 were calculated using Equation (1).
The occurrence of a voltage plateau in GCD curves confirms the pseudocapacitance behavior of electrodes concerning their discharging period [31]. The specific capacitance values of FexCo3-xO4, calculated using Equation (1) at 1 A/g, are 131, 146, 131, 153, 137, and 149 F/g for x = 0.0, 0.2, 0.4, 0.6, 0.8, and 1.0, respectively. Figure 7a shows the dependence of current density on specific capacitance. A decrease in the specific capacitance with the increase in the discharge current is caused by the insufficient time available for the diffusion of electrolyte ions into the inner electrode surface and the increase in potential drop towards higher discharge currents [59]. The Ragone plot shown in Figure 7b represents energy density vs. power density. The values of energy density and power density were calculated from GCD data according to the following equations,
Eg = ½(Csp)(dV)2;
Pg = (Eg)/(dt)2,
where Eg (Wh/kg) is the average energy density, Csp (F/g) is the specific capacitance, and dV (V) is the potential difference drop during the discharging process. Pg (W/kg) is the average power density, and dt(s) is the discharge time [60]. The specific capacitance, stability, and power density of the FexCo3-xO4 electrode are compared with other reported metal oxides in Table 3. According to the results, the proposed catalyst has comparable or higher power density, stability, and specific capacitances to many other metal oxide electrocatalysts. The superior performance of the FexCo3-xO4 electrode results from the significant decrease in the band-gap upon Fe doping, as elucidated in the DFT study below. For comparison, the band-gap of Mn-doped Co3O4 is reported to be 1.51 eV [61], Sm-doped Co3O4 is reported to be 3.57 eV [62], and Cr-doped Co3O4 to be 2.44 eV [63].
Table 3. Comparison of specific capacitance, stability, and power density of FexCo3-xO4 electrode with other reported Co-based catalysts (here, AC stands for activated carbon).
CatalystsSp. Capacitince (F/g)@1A/gStability % (Cycles)Power Density
(W/g)
Ref.
FexCo3-xO4 at (x = 1)14982.7 (1000)0.27This work
FexCo3-xO4 at (x = 0)13184.7 (1000)0.30This work
Co3O4 nanonet73990.2 (1000)--[64]
Co3O4//AC107.398 (1500)0.22[65]
Co3O4 nanocrystal284.2----[66]
Fe3O467.983 (2000)--[67]
Fe3O4@C74.495 (1500)0.3[67]
Porous Co3O4150100 (3400)--[68]
Fe-Co3O4/graphene73499.2 (1000)--[20]
Co3O440----[22]
Fe–Co3O469.872--[22]
Mn–Co3O477373.9 (5000)--[23]
Cd–Co3O473790 (3500)--[24]
The cyclic stability of FexCo3-xO4 electrodes was evaluated by repeated charge-discharge measurements up to 5000 cycles at a constant current density of 10 A/g in the potential range between 0.0 to 0.6 V in 3M KOH, as shown in Figure 8. The percentage retention in specific capacitance was calculated using Equation (6):
% Retention in specific capacitance = (C#/C1) × 100
where C# is specific capacitance at various cycles, and C1 is the specific capacitance at the first cycle. Hence, the % retention in specific capacitance after 5000 cycles x = 0.0, 0.2, 0.4, 0.6, 0.8, and 1.0 are 80.4%, 91.3%, 63.4%, 76.7%, 77.4%, and 76.1%, respectively. This shows that, even after 5000 cycles, the electrode shows outstanding cyclic stability, and hence, there is not so much difference in the specific capacitance from their initial values in x = 0.0. Furthermore, the Coulombic efficiency for x = 0.0, 0.2, 0.4, 0.6, 0.8, and 1.0 after 5000 cycles is 100%, 98.5 %, 96.2%, 94.5%, 94.4%, and 93%, respectively. Both % retention and Coulombic efficiency are shown in Figure 8a–f, respectively.

3.3. DFT Study

In our DFT computation, we are dealing with a cell with 28 atoms, 12 Co atoms, and 16 oxygen atoms. There are eight octahedra and four tetrahedra sites in Co. So, our first job was to find the most favorable sites for Fe. Calculations show that Fe atoms first prefer to go to octahedral sites. After all of them are occupied, they go to tetrahedra sites. It is also found that the Fe atoms occupying two different sites prefer to have opposite magnetic moments. Those that occupy octahedral sites have negative magnetic moments, and tetrahedral sites have positive magnetic moments. Figure 2d shows that the bandgap varies from 0.60 eV to 1.09 eV for the different values of x from 0.0 to 2.0. For the pure Co3O4 system, a value of 1.09 eV is obtained, which is close to the reported value under the GW approximation [69]. Doping of Fe over Co causes the bandgap to decrease, reaching a minimum, and then increase. The smallest bandgap has a value of 0.60 eV corresponding to the FeCo2O4 compound. The calculation thus shows that FeCo2O4 could be more conductive than other forms of FexCo3-xO4 (0 ≤ x ≤ 2), which is important for practical applications.

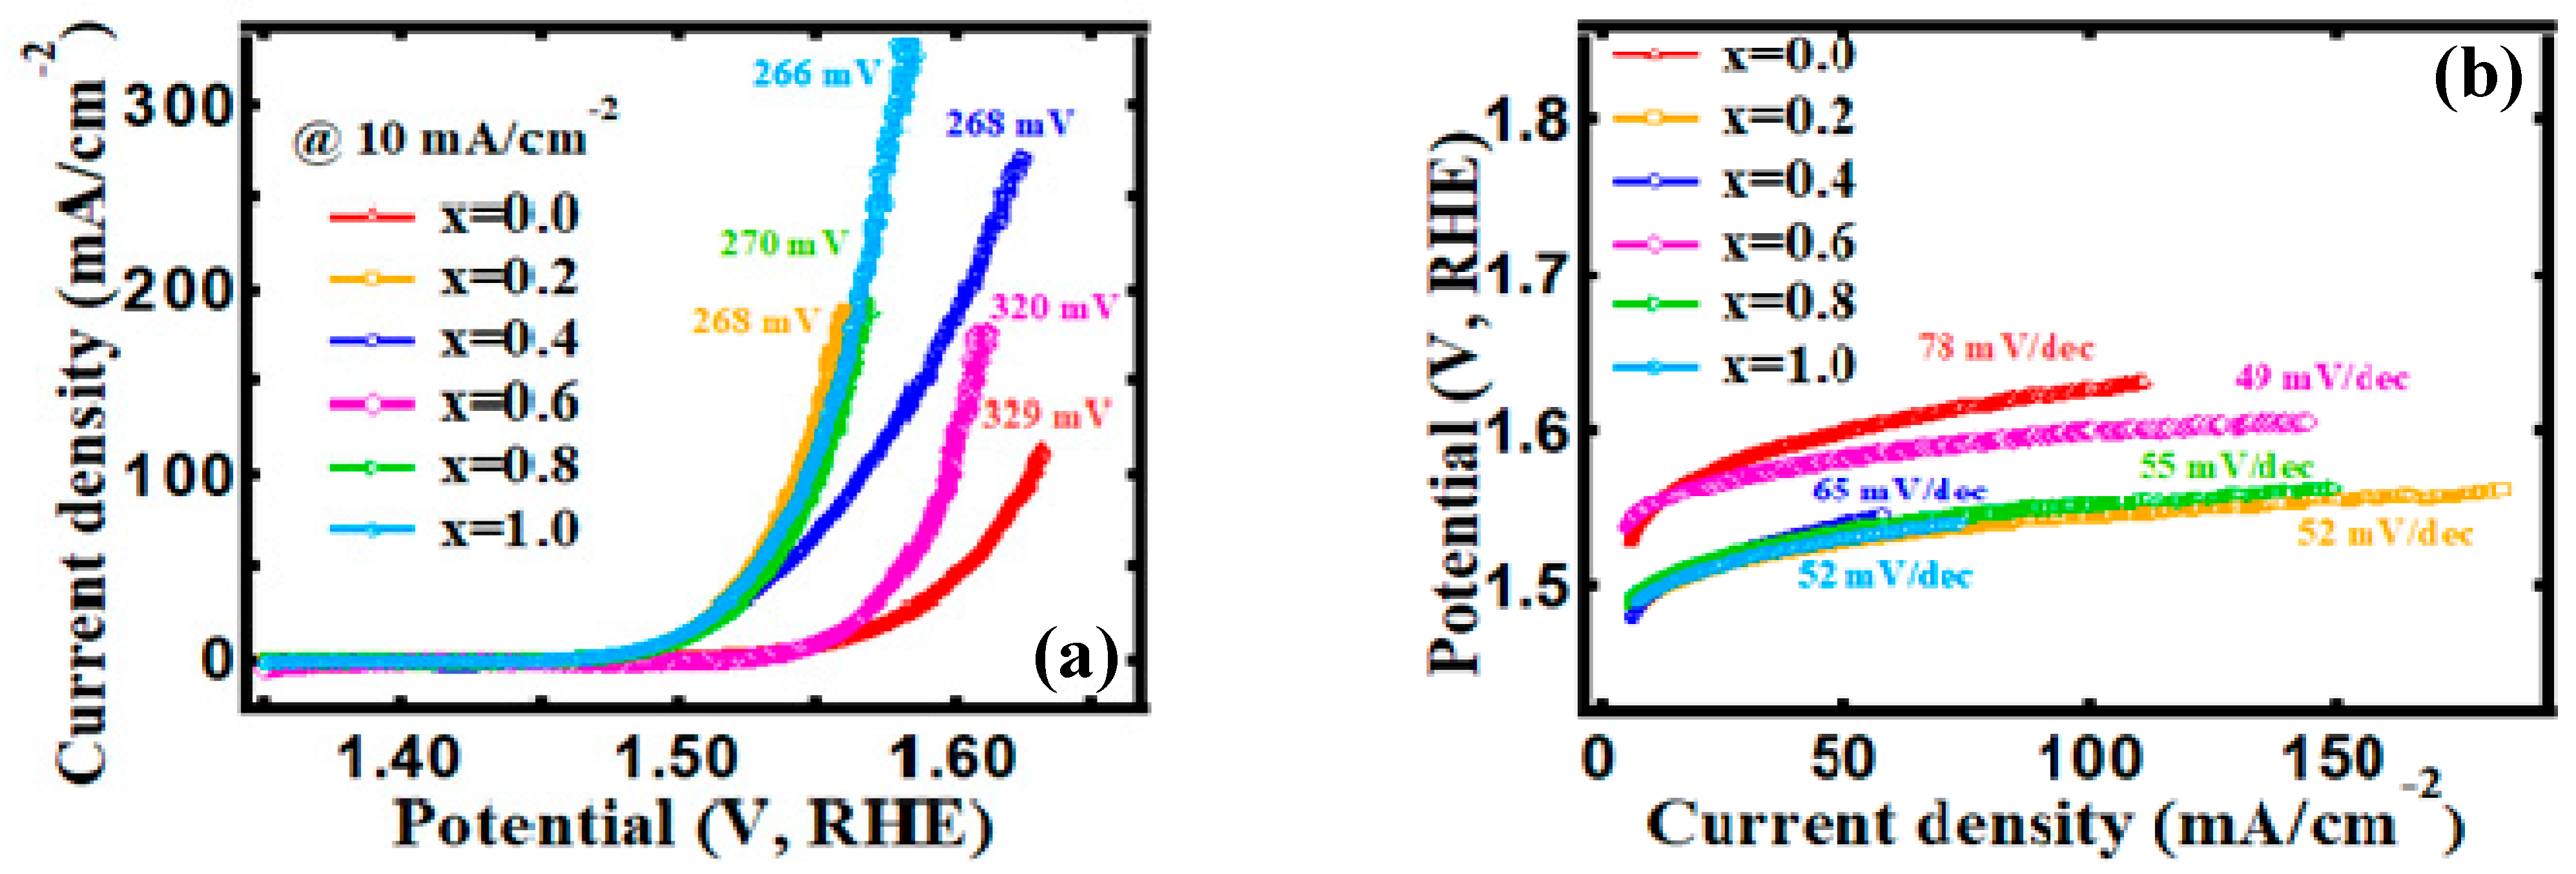
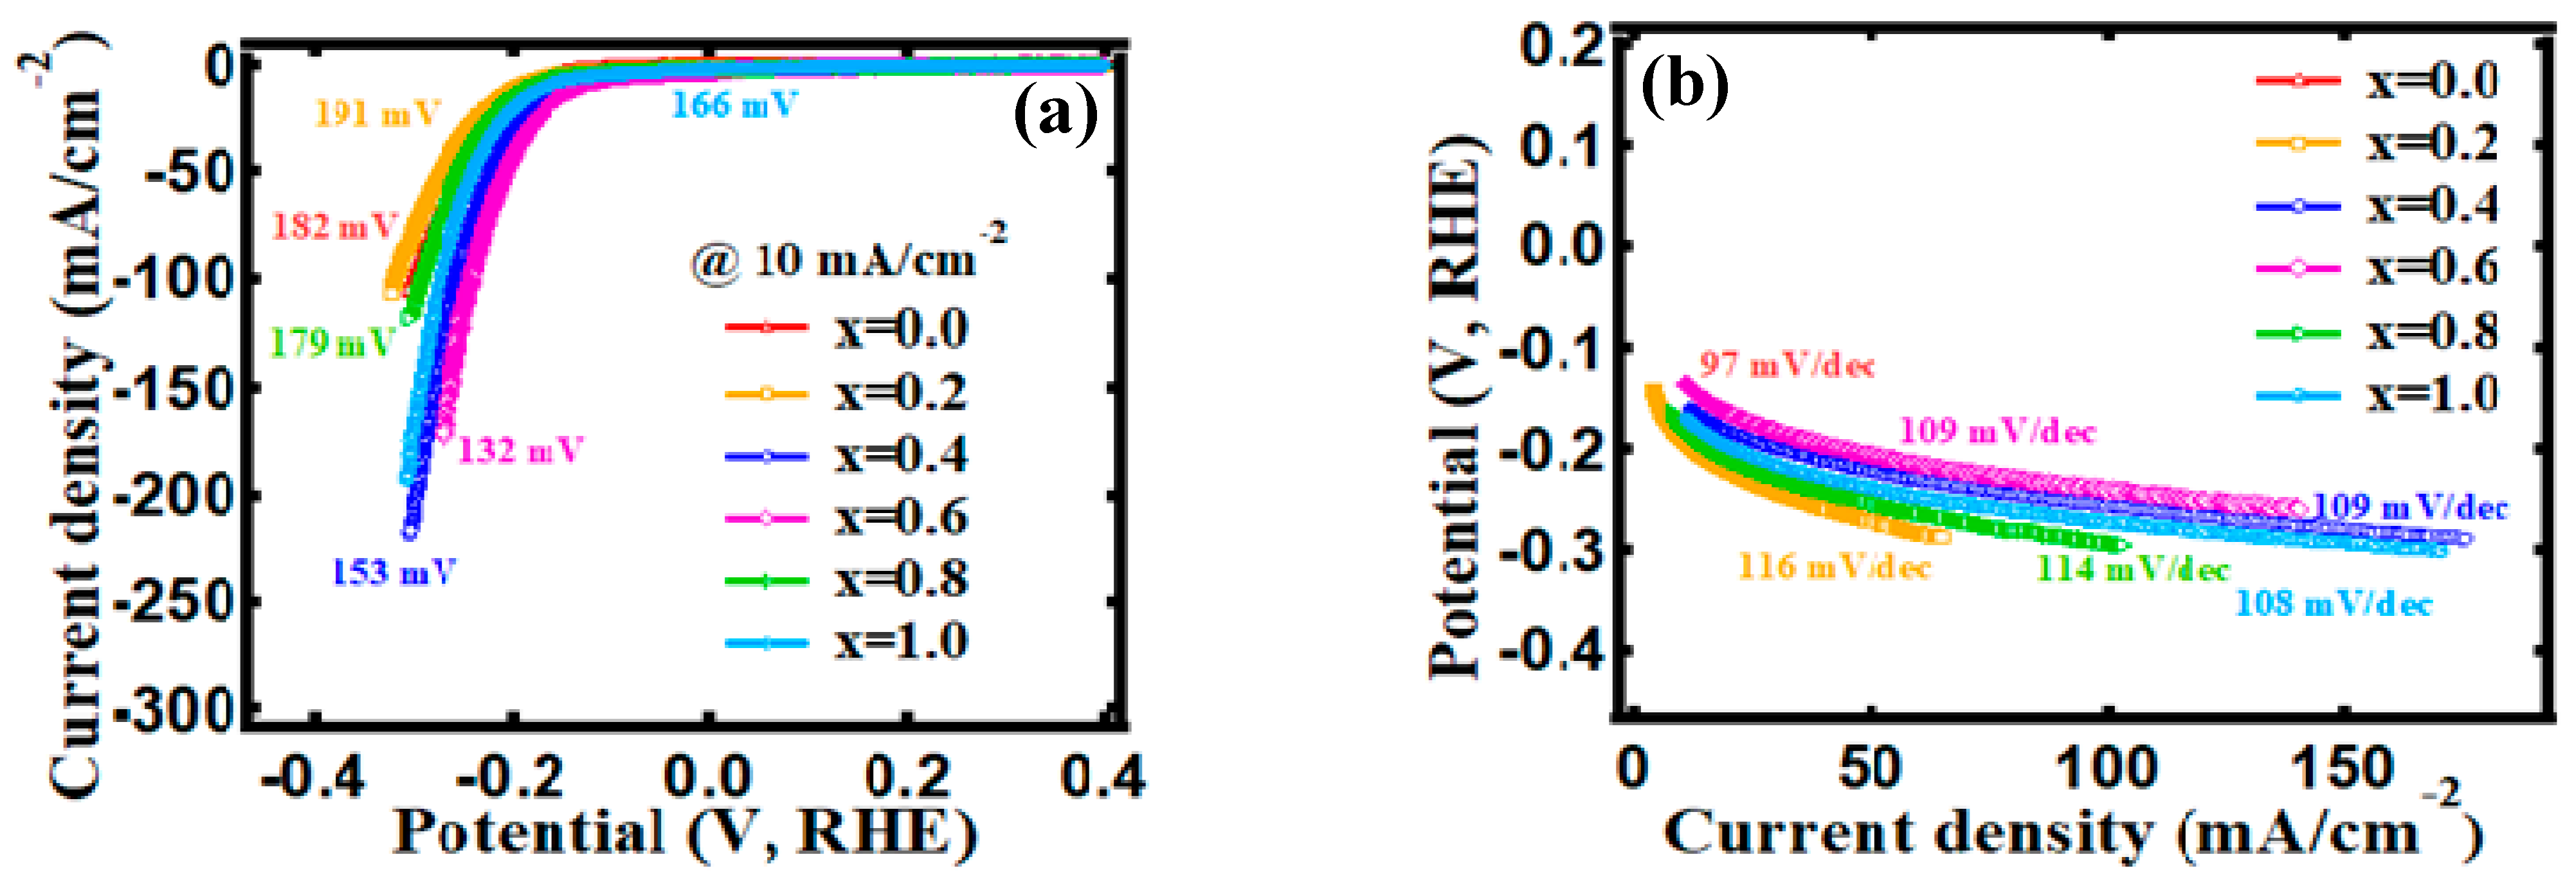
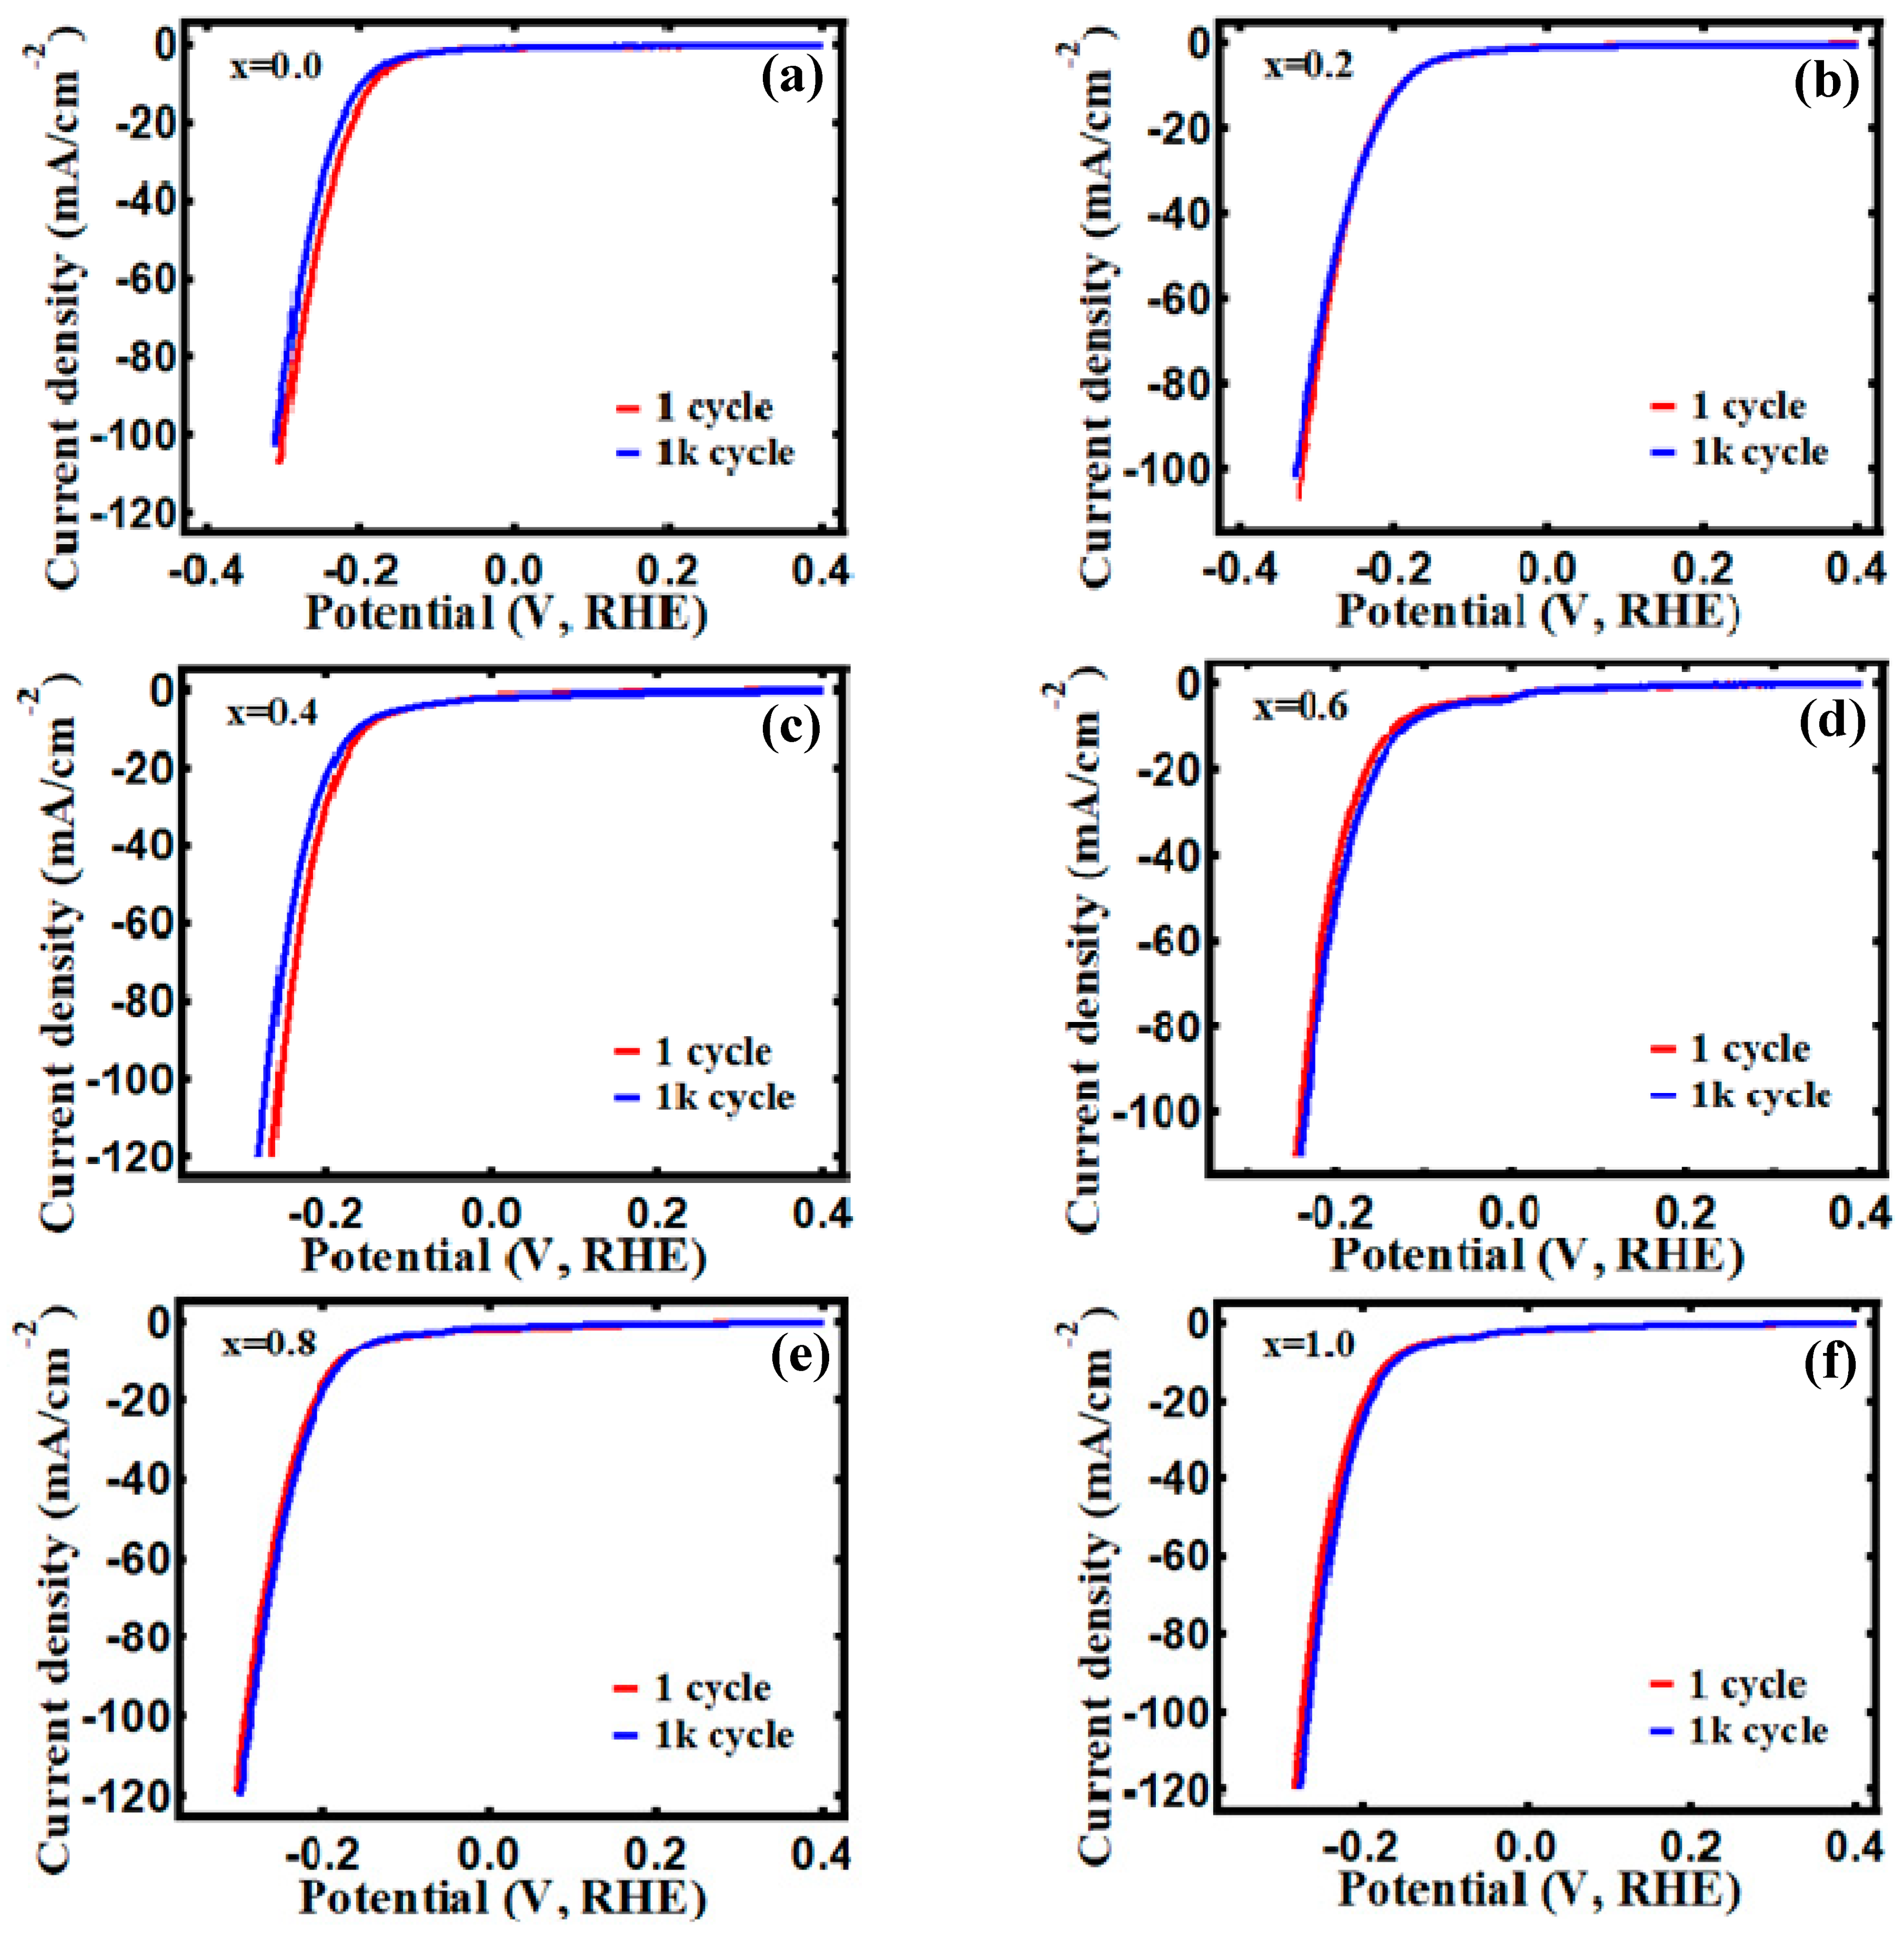
3.4. Electrocatalytic Behavior

The electrochemical water splitting performance of FexCo3-xO4 samples as an electrocatalyst was explored in a 1 M KOH electrolyte. Firstly, the OER activity of all samples was analyzed using linear sweep voltammetric (LSV) at a scan rate of 2 mV/s in Figure 9a. It was observed that the introduction of Fe3+ induced a change in electrocatalytic behavior by leading to an improvement in electrocatalyst performance. As a result, the onset overpotential of 245 mV and overpotential of 266 mV was achieved for the x = 1.0 sample to deliver the current density of 2 and 10 mA/cm2, respectively. Table 4 shows the onset overpotential (at 2 mA/cm2 current density) and overpotential (at 10 mA/cm2 current density), both of which are indicators of electrocatalytic activity. Tafel slopes are calculated using the following Equation: η = a + b log j, where η is the overpotential, a is the constant, b is the Tafel slope, and j is the current density. Figure 9b shows the value of the Tafel slopes, which are 78, 52, 55, 65, 49, 55, and 52 mV/dec for x = 0.0, 0.2, 0.4, 0.6, 0.8, and 1.0, respectively. The Tafel slope fell dramatically after doping Fe3+ on cobalt oxide, indicating an enhanced OER kinetic reaction, similar to the reduced overpotential.
The stability of the electrocatalyst is also a crucial factor for catalyst development, so the first LSV polarization curve was compared with the curve after CV 1000 cycles. Figure 10 showed almost perfect overlaps of the 1stand 1000th cycles, suggesting all electrocatalysts have great stability towards OER. The electrocatalytic HER performance was also investigated using LSV at 2 mV/s in Figure 11a. After being Fe3+ doped (x = 0.6), cobalt oxide with an overpotential of 182 mV showed a greatly reduced overpotential of 136 mV (at the 10 mA/cm2 current density) and a low onset overpotential of 1 mV (at the 2 mA/cm2 current density). A tendency to improve HER performance was observed after Fe’s introduction. The onset overpotential and overpotential are listed in Table 4. Figure 11b shows the Tafel slope for all samples, and the observed Tafel slope was 97, 116, 109, 109, 114, and 108 for x = 0.0, 0.2, 0.4, 0.6, 0.8, and 1.0, respectively. For stability towards HER, the LSV 1st graph and 1000th graph were compared, as seen in Figure 12. There was no discernible difference when comparing the two curves, demonstrating that the electrodes are quite stable for HER. For both the HER and OER processes, the acquired results reveal an adequate and long-lasting response. As a result, the given results make the material appealing for practical industrial electrolysis applications.
Figure 13 displays the Nyquist plots for all samples. Electrochemical impedance spectroscopy (EIS) measurements were performed at 10 mV AC amplitude in the frequency range of 0.05 Hz to 10 kHz. The electrolyte resistance is represented by the intersection value of the real axis, which is roughly 0.5/cm2 for all samples. This resistance is generally attributed to the wire, electrode material, and electrolyte resistance [70]. In addition, the diameter of the semicircle indicates the resistance at the interface between the FexCo3-xO4 electrodes and the 1 M KOH electrolyte. All graphs showed a decrease in the diameter with increased voltage and decreased resistance in the order of x = 1.0, 0.2, 0.8, 0.4, 0.6, and 0.0. The introduction of Fe3+ increased the conductivity at the interface between the electrode and the electrolyte, which significantly influenced the high activity of the iron-doped cobalt oxide.
Therefore, the impedance data were analyzed using a modified version of the well-known equivalent electric circuit of Armstrong and Henderson [71,72]. For example, Figure 14 presents the experimental and simulated EIS spectra of FexCo3-xO4 at x = 0.0 and x = 1.0, along with their equivalent circuits. All samples show a similar circuit behavior. The figures represent experimental data (exp), and the solid line represents the simulation data (sim). The equivalent circuits consist of electrolyte resistance Rs, solid electrolyte interphase resistance Rf, solid electrolyte interphase capacitance Cf, charge-transfer resistance Rct, double layer capacitance Cdl, and Warburg diffusion impedance W, respectively. The elements of the equivalent circuit help understand the charge transfer process during electrochemical analysis [73]. EIS curves begin with a suppressed semicircle at a low-frequency range followed by another highly eccentric arc at a higher frequency region. This arc may be related to electrode-electrolyte interphase resistance coupled with double-layered capacitance [74]. The simulated values of resistance Rs of the sample FexCo3-xO4 are shown decreasing from x = 0.0 to x = 1.0, as can be realized by looking at the shifted curves of Figure 14a,b towards the lower value of the real impedance Z’ axis. The decreasing value of Rs and Rf may be due to the higher content of Fe in the sample and increased grain boundaries to make a smooth electrode-electrolyte interface. Such an interface allows a more ionic path to perform an excellent electrochemical reaction [75]. Furthermore, the FexCo3-xO4 samples showed a low loss of current density during prolonged chronoamperometry experiments, Figure 15, indicating that the electrode has the potential to maintain stability over time. Although there is some fluctuation owing to gas generation, all electrodes have excellent endurance, since the graph remains stable for a long time.
Table 5 compares the OER/HER performance of the FexCo3-xO4 sample (x = 1.0) to that of other doped cobalt-based materials previously reported. Our findings demonstrate indisputably that the FexCo3-xO4 compound is an effective electrocatalyst for OER/HER applications. Several reasons should be examined to explain improved electrocatalytic performance after Fe3+ is doped in cobalt oxide. The expansion of the active sites due to the increase in surface area and the increase in conductivity due to the decrease in the bandgap could have influenced the electrocatalysis activity. In addition, a preliminary DFT study looking at the adsorption energy showed that incorporating Fe atoms into the lattice of Co3O4 significantly lowers the adsorption energy difference from OH* to O* from 1.90 to 1.54 eV [76]. Given the hierarchical structure of FexCo3-xO4, all doped Fe3+ are expected to reside near the surface [77]. Thus, our results show that the proposed catalyst can be capitalized to produce hydrogen and oxygen gas at a considerable rate due to the cost-effective, earth-abundant, and inexpensive catalyst.
Table 5. Comparison of OER/HER results of FexCo3-xO4 electrode with other recently reported Co-based catalysts reports in 1M KOH.
CatalystOERHERRef.
Overpotential, η10
mV
Tafel Slope
(mV/dec)
Overpotential, η10
mV
Tafel Slope
(mV/dec)
Co3O44236935191[78]
Fe–Co3O429539120--[79]
Fe–Co3O438060----[21]
NixCo3-xO43203817098[80]
CoFe2O449048----[81]
Co3O4/C360------[82]
Fe–Co3O426243----[76]
Co3O4/Co–Fe oxide29761----[83]
Fe–Co–O NS26053----[84]
Co–Fe–O frame29062----[85]
Fe–CoS2----4032[86]
FeCo2O4510237400215[33]

4. Conclusions

In conclusion, a simple and cost-effective strategy using the hydrothermal method has been developed to report the effect of Fe3+ doping on the structural and electrochemical performance of the Co3O4 nanostructure. The experimental results revealed the dependence of surface area, specific capacitance, bandgap, and electrochemical performance of Co3O4 on Fe3+ content. Excellent electrochemical performance was obtained for FexCo3-xO4, x = 1.0. Moreover, the appropriate doping of Fe atoms has modified the morphology of Co3O4 particles, resulting in the shortening of the ion transportation path, which provided much better conductivity. The electrochemical characterization shows that the nanocomposite shows low dynamic potential compared to its counterparts for both HER and OER in alkaline solution. According to the findings, Fe3+ can be a cost-effective and good substitute for cobalt in Co3O4 to achieve excellent electrochemical and water-splitting performance.

Author Contributions

Conceptualization, S.R.M.; Methodology, D.G. and J.C.; Validation, S.K., and R.K.G.; Formal Analysis, S.K.; Investigation, S.R.M.; Resources, S.K.; Data Curation, X.S., T.P.P. and R.B.; Writing—Original Draft Preparation, D.G. and S.R.M.; Writing—Review & Editing, S.K. and S.R.M.; Visualization, S.R.M.; Supervision, S.R.M. and S.K.; Project Administration, S.R.M.; Funding Acquisition, S.R.M. All authors have read and agreed to the published version of the manuscript.

Funding

To support this research, Mishra acknowledges FRG funds from the University of Memphis, Memphis, TN, USA. Ram K. Gupta expresses his sincere acknowledgment of the Polymer Chemistry Initiative at Pittsburg State University, Pittsburg, KS for providing research support for this project.

Institutional Review Board Statement

Not applicable.

Informed Consent Statement

Not applicable.

Data Availability Statement

The data presented in this study are openly available on request.

Conflicts of Interest

The authors declare that they have no conflict of interest.

References

  1. Weidner, J.; Barwe, S.; Sliozberg, K.; Piontek, S.; Masa, J.; Apfel, U.; Schuhmann, W. Cobalt–metalloid alloys for electrochemical oxidation of 5-hydroxymethylfurfural as an alternative anode reaction in lieu of oxygen evolution during water splitting. Beilstein J. Org. Chem. 2018, 14, 1436–1445. [Google Scholar] [CrossRef]
  2. Yue, Z.; Zhu, W.; Li, Y.; Wei, Z.; Hu, N.; Suo, Y.; Wang, J. Surface Engineering of a Nickel Oxide-Nickel Hybrid Nanoarray as a Versatile Catalyst for Both Superior Water and Urea Oxidation. Inorg. Chem. 2018, 57, 4693. [Google Scholar] [CrossRef]
  3. Esswein, A.J.; Nocera, D.G. Hydrogen Production by Molecular Photocatalysis. Chem. Rev. 2007, 107, 4022–4047. [Google Scholar] [CrossRef] [PubMed]
  4. Liu, C.; Tang, J.; Chen, H.M.; Liu, B.; Yang, P. A fully integrated nanosystem of semiconductor nanowires for direct solar water splitting. Nano Lett. 2013, 13, 2989–2992. [Google Scholar] [CrossRef]
  5. Maeda, K.; Domen, K. Photocatalytic Water Splitting: Recent Progress and Future Challenges. J. Phys. Chem. Lett. 2010, 1, 2655–2661. [Google Scholar] [CrossRef]
  6. Zhang, M.; He, L.; Shi, T.; Zha, R. Nanocasting and direct synthesis strategies for mesoporous carbons as supercapacitor electrodes. Chem. Mater. 2018, 30, 7391–7412. [Google Scholar] [CrossRef]
  7. Tian, Q.; Wang, X.; Huang, Z.; Guo, X. Nanostructured (Co, Mn)3O4 for high capacitive supercapacitor applications. Nanoscale Res. Lett. 2017, 12, 214. [Google Scholar] [CrossRef] [PubMed] [Green Version]
  8. Liu, X.; Wu, Z.; Yin, Y. Hierarchical NiCo2S4@ PANI core/shell nanowires grown on carbon fiber with enhanced electrochemical performance for hybrid supercapacitors. Chem. Eng. J. 2017, 323, 330–339. [Google Scholar] [CrossRef]
  9. Xiong, S.; Yuan, C.; Zhang, X.; Xi, B.; Qian, Y. Controllable synthesis of mesoporous Co3O4 nanostructures with tunable morphology for application in super-capacitors. Chem. Eur. J. 2009, 15, 5320–5326. [Google Scholar] [CrossRef]
  10. Nkeng, P.; Koenig, J.F.; Gautier, J.I.; Chartier, P.; Poillerat, G. Enhancement of surface areas of Co3O4 and NiCo2O4 electrocatalysts prepared by spray pyrolysis. J. Electroanal. Chem. 1996, 402, 81–89. [Google Scholar] [CrossRef]
  11. Li, W.; Xu, L.; Chen, J. Co3O4 Nanomaterials in Lithium-Ion Batteries and Gas Sensors. Adv. Funct. Mater. 2005, 15, 851. [Google Scholar] [CrossRef]
  12. Choi, K.; Kim, H.; Kim, K.; Liu, D.; Cao, G.; Lee, J. C2H5OH sensing characteristics of various Co3O4 nanostructures prepared by solvothermal reaction. Sens. Actuators B 2010, 146, 183–189. [Google Scholar] [CrossRef]
  13. Kupfer, B.; Majhi, K.; Keller, D.A.; Bouhadana, Y.; Ruhle, S.; Barad, H.N.; Anderson, A.Y.; Zaban, A. Renewable Energy: Thin Film Co3O4/TiO2 Heterojunction Solar Cells. Adv. Energy Mater. 2015, 5, 1401007. [Google Scholar] [CrossRef]
  14. Mariammal, R.N.; Ramachandran, K.; Kalaiselvan, G.; Arumugam, S.; Renganathan, B.; Sastikumar, D. Effect of magnetism on the ethanol sensitivity of undoped and Mn-doped CuO nanoflakes. Appl. Surf. Sci. 2013, 270, 545–552. [Google Scholar] [CrossRef]
  15. Martin-Gonzalez, M.S.; Fernandez, J.F.; Rubio-Marcos, F.; Lorite, I.; Costa-Kramer, J.L.; Quesada, A.; Banares, M.A.; Fierro, J.L.G. Insights into the room temperature magnetism of ZnO/Co3O4 mixtures. J. Appl. Phys. 2008, 103, 083905. [Google Scholar] [CrossRef] [Green Version]
  16. Khan, A.; Shkir, M.; Ashraf, I.M.; el-Toni, A.M.; Aldalbahi, A.; AlFaify, S. One-step straightforward synthesis of Tb-doped NiO nanocomposites using flash combustion method: Structural, optical, luminescent, and electrical switching properties. Ceram. Int. 2020, 46, 10678–10690. [Google Scholar] [CrossRef]
  17. Dong, Y.; Zhao, J.; Zhang, J.Y.; Chen, Y.; Yang, X.; Song, W.; Wei, L.; Li, W. Synergy of Mn and Ni enhanced catalytic performance for toluene combustion over Ni-doped α-MnO2 catalysts. Chem. Eng. J. 2020, 388, 124244. [Google Scholar] [CrossRef]
  18. Dong, C.; Qu, Z.; Jiang, X.; Ren, Y. Tuning oxygen vacancy concentration of MnO2 through metal doping for improved toluene oxidation. J. Hazard. Mater. 2020, 391, 122181. [Google Scholar] [CrossRef]
  19. Han, X.; Cui, Y.; Liu, H. Ce-doped Mn3O4 as high-performance anode material for lithium ion batteries. J. Alloys Compd. 2020, 814, 152348. [Google Scholar] [CrossRef]
  20. Wang, S.; Li, Q.; Chen, M.; Pu, W.; Wu, Y.; Yang, M. Electrochemical capacitance performance of Fe-doped Co3O4/graphene nanocomposite: Investigation on the effect of iron. Electrochim. Acta 2016, 215, 473–482. [Google Scholar] [CrossRef]
  21. Xiao, C.; Lu, X.; Zhao, C. Unusual Synergistic Effects upon Incorporation of Fe and/or Ni into Mesoporous Co3O4 for Enhanced Oxygen Evolution. Chem. Commun. Camb. UK 2014, 50, 10122–10125. [Google Scholar] [CrossRef] [PubMed]
  22. Manickam, M.; Ponnuswamy, V.; Sankar, C.; Suresh, R.; Mariappan, R.; Bose, A.C.; Chandrasekaran, J. Structural, optical, electrical and electrochemical properties of Fe:Co3O4 thin films for supercapacitor applications. J. Mater. Sci. Mater. Electron. 2017, 28, 18951–18965. [Google Scholar] [CrossRef]
  23. Chen, H.; Wang, J.; Liao, F.; Han, X.; Zhang, Y.; Xu, C.; Gao, L. Uniform and porous Mn-doped Co3O4 microspheres: Solvothermal synthesis and their superior supercapacitor performances. Ceram. Int. 2019, 45, 11876–11882. [Google Scholar] [CrossRef]
  24. Deng, S.; Xiao, X.; Chen, G.; Wang, L.; Wang, Y. Cd doped porous Co3O4 nanosheets as electrode material for high performance supercapacitor application. Electrochim. Acta 2016, 196, 316–327. [Google Scholar] [CrossRef]
  25. Zhu, Y.P.; Guo, C.; Zheng, Y.; Qiao, S.Z. Surface and interface engineering of noble-metal-free electrocatalysts for efficient energy conversion processes. Acc. Chem. Res. 2017, 50, 915e923. [Google Scholar] [CrossRef] [PubMed]
  26. Liu, J.; Wang, J.; Zhang, B.; Ruan, Y.; Lv, L.; Ji, X.; Xu, K.; Miao, L.; Jiang, J. Hierarchical NiCo2S4@ NiFe LDH heterostructures supported on nickel foam for enhanced overall-water-splitting activity. ACS Appl. Mater. Interfaces 2017, 9, 15364e15372. [Google Scholar] [CrossRef] [PubMed]
  27. Zhu, Y.; Pu, X.; Song, W.; Wu, Z.; Zhou, Z.; He, X.; Lu, F.; Jing, M.; Tang, B.; Ji, X. High capacity NiCo2O4 nanorods as electrode materials for supercapacitor. J. Alloys Compd. 2014, 617, 988–993. [Google Scholar] [CrossRef]
  28. Zou, R.; Xu, K.; Wang, T.; He, G.; Liu, Q.; Zhang, Z.; Hu, J. Chain-like NiCo2O4 nanowires with different exposed reactive planes for high-performance supercapacitors. J. Mater. Chem. A 2013, 1, 8560–8566. [Google Scholar] [CrossRef]
  29. Guragain, D.; Zequine, C.; Gupta, R.K.; Mishra, S.R. Facile Synthesis of Bio-Template Tubular MCo2O4 (M= Cr, Mn, Ni) Microstructure and Its Electrochemical Performance in Aqueous Electrolyte. Processes 2020, 8, 343. [Google Scholar] [CrossRef] [Green Version]
  30. Hao, C.; Zhou, S.; Wang, J.; Wang, X.; Gao, H.; Ge, C. Preparation of hierarchical spinel NiCo2O4 nanowires for high-performance supercapacitors. Ind. Eng. Chem. Res. 2018, 57, 2517–2525. [Google Scholar] [CrossRef]
  31. Guo, J.; Yin, Z.; Zang, X.; Dai, Z.; Zhang, Y.; Huang, W.; Dong, X. Facile one-pot synthesis of NiCo2O4 hollow spheres with a controllable number of shells for high-performance supercapacitors. Nano Res. 2017, 10, 405–414. [Google Scholar] [CrossRef]
  32. Guo, X.; Yang, C.; Huang, G.; He, B. High-performance supercapacitors based on flower-like FexCo3-xO4 electrodes. J. Alloys Compd. 2018, 735, 184–192. [Google Scholar] [CrossRef]
  33. Kundu, A.; Robby, A.; Shit, A.; Jo, H.J.; Park, S.Y. Construction of FeCo2O4@N-Doped Carbon Dots Nanoflowers as Binder Free Electrode for Reduction and Oxidation of Water. Materials 2020, 13, 3119. [Google Scholar] [CrossRef]
  34. Guragain, D.; Bhattarai, R.; Choi, J.; Lin, W.; Gupta, R.K.; Mishra, S.R.; Shen, X.; Perez, F. Electrochemical Performance of Aluminum Doped Ni1−xAlxCo2O4 Hierarchical Nanostructure: Experimental and Theoretical Study. Processes 2021, 9, 1750. [Google Scholar] [CrossRef]
  35. Perdew, J.P.; Burke, K.; Ernzerhof, M. Generalized gradient approximation made simple. Phys. Rev. Lett. 1996, 77, 3865. [Google Scholar] [CrossRef] [Green Version]
  36. Kresse, G.; Furthmüller, J. Efficient iterative schemes for ab initio total-energy calculations using a plane-wave basis set. Phys. Rev. B 1996, 54, 11169. [Google Scholar] [CrossRef]
  37. Kresse, G.; Joubert, D. From ultrasoft pseudopotentials to the projector augmented-wave method. Phys. Rev. B 1999, 59, 1758–1775. [Google Scholar] [CrossRef]
  38. Heyd, J.; Scuseria, G.E.; Ernzerhof, M. Hybrid functionals based on a screened Coulomb potential. J. Chem. Phys. 2003, 118, 8207–8215. [Google Scholar] [CrossRef] [Green Version]
  39. Guragain, D.; Zequine, C.; Poudel, T.; Neupane, D.; Gupta, R.K.; Mishra, S.R. Facile Synthesis of Bio-Templated Tubular Co3O4 Microstructure and Its Electrochemical Performance in Aqueous Electrolytes. J. Nanosci. Nanotechnol. 2020, 20, 3182–3194. [Google Scholar] [CrossRef] [PubMed]
  40. Sumadiyasa, M.; Manuaba, I.B.S. Determining Crystallite Size Using Scherrer Formula, Williamson-Hull Plot, and Particle Size with SEM. Bul. Fis. 2018, 19, 28–34. [Google Scholar] [CrossRef] [Green Version]
  41. Zhi, J.; Wang, Y.; Deng, S.; Hu, A. Study on the relation between pore size and supercapacitance in mesoporous carbon electrodes with silica-supported carbon nanomembranes. RSC Adv. 2014, 4, 40296–40300. [Google Scholar] [CrossRef]
  42. Kondrat, S.; Perez, C.R.; Presser, V.; Gogotsi, Y.; Kornyshev, A.A. Effect of pore size and its dispersity on the energy storage in nanoporous supercapacitors. Energy Environ. Sci. 2012, 5, 6474–6479. [Google Scholar] [CrossRef]
  43. Jayanthi, K.; Chawla, S.; Sood, K.N.; Chhibara, M.; Singh, S. Dopant induced morphology changes in ZnO nanocrystals. Appl. Surf. Sci. 2009, 255, 5869–5875. [Google Scholar] [CrossRef]
  44. Adhikari, H.; Ghimire, M.; Ranaweera, C.K.; Bhoyate, S.; Gupta, R.K.; Alam, J.; Mishra, S.R. Synthesis and electrochemical performance of hydrothermally synthesized Co3O4 nanostructured particles in presence of urea. J. Alloys Compd. 2017, 708, 628–638. [Google Scholar] [CrossRef]
  45. Pendashteh, A.; Rahmanifar, M.S.; Kaner, R.B.; Mousavi, M.S. Facile synthesis of nanostructured CuCo2O4 as a novel electrode material for high-rate supercapacitors. Chem. Commun. 2014, 50, 1972–1975. [Google Scholar] [CrossRef] [PubMed]
  46. Guragain, D.; Zequine, C.; Poudel, T.; Neupane, D.; Gupta, R.K.; Mishra, S.R. Influence of Urea on the Synthesis of NiCo2O4 Nanostructure: Morphological and Electrochemical Studies. J. Nanosci. Nanotechnol. 2020, 20, 2526–2537. [Google Scholar] [CrossRef]
  47. Liu, X.; Long, Q.; Jiang, C.; Zhan, B.; Li, C.; Liu, S.; Zhao, Q.; Dong, X. Facile and green synthesis of mesoporous Co3O4 nanocubes and their applications for supercapacitors. Nanoscale 2013, 5, 6525–6529. [Google Scholar] [CrossRef]
  48. Ren, J.; Bai, W.; Guan, G.; Zhang, Y.; Peng, H. Flexible and weaveable capacitor wire based on a carbon nanocomposite fiber. Adv. Mater. 2013, 25, 5965–5970. [Google Scholar] [CrossRef]
  49. Xu, P.; Gu, T.; Cao, Z.; Wei, B.; Yu, J.; Li, F.; Byun, J.H.; Lu, W.; Li, Q.; Chou, T.W. Carbon Nanotube Fiber-Based Stretchable Wire-Shaped Supercapacitors. Adv. Energy Mater. 2014, 4, 1300759. [Google Scholar] [CrossRef]
  50. Guragain, D.; Zequine, C.; Gupta, R.K.; Mishra, S.R. Effect of dopant on the morphology and electrochemical performance of Ni1-xCaxCo2O4 (0≤ x ≤ 0.8) oxide hierarchical structures. MRS Adv. 2020, 5, 2487–2494. [Google Scholar] [CrossRef]
  51. Karna, S.; Neupane, D.; Mishra, S.R.; Choi, J.; Gupta, R.K.; Mishra, S.R.; Karna, P. Electrochemical Behavior of S and C Mono-Doped Sodium Tantalate Photocatalysts. J. Electron. Mater. 2021, 50, 7133–7142. [Google Scholar] [CrossRef]
  52. Augustyn, V.; Come, J.; Lowe, M.A.; Kim, J.W.; Taberna, P.L.; Tolbert, S.H.; Abruña, H.D.; Simon, P.; Dunn, B. High-rate electrochemical energy storage through Li+ intercalation pseudocapacitance. Nat. Mater. 2018, 12, 518. [Google Scholar] [CrossRef]
  53. Zhai, S.; Karahan, H.E.; Wang, C.; Pei, Z.; Wei, L.; Chen, Y. 1D supercapacitors for emerging electronics: Current status and future directions. Adv. Mater. 2019, 1902387. [Google Scholar] [CrossRef]
  54. Kirubasankar, B.; Vijayan, S.; Angaiah, S. Sonochemical synthesis of a 2D–2D MoSe2/graphene nanohybrid electrode material for asymmetric supercapacitors. Sustain. Energy Fuels 2019, 3, 467–477. [Google Scholar] [CrossRef]
  55. Muhammad, H.; Tahiri, I.A.; Muhammad, M.; Masood, Z.; Versiani, M.A.; Khaliq, O.; Latif, M.; Hanif, M. A comprehensive heterogeneous electron transfer rate constant evaluation of dissolved oxygen in DMSO at glassy carbon electrode measured by different electrochemical methods. J. Electroanal. Chem. 2016, 775, 157–162. [Google Scholar] [CrossRef]
  56. Ali, G.A.; Fouad, O.A.; Makhlouf, S.A.; Yusoff, M.M.; Chong, K.F. Co3O4/SiO2 nanocomposites for supercapacitor application. J. Solid State Electrochem. 2014, 18, 2505–2512. [Google Scholar] [CrossRef] [Green Version]
  57. Wang, J.; Polleux, J.; Lim, J.; Dunn, B. Pseudocapacitive contributions to electrochemical energy storage in TiO2 (anatase) nanoparticles. J. Phys. Chem. C 2007, 111, 14925–14931. [Google Scholar] [CrossRef]
  58. Fu, H.; Liu, Y.; Chen, L.; Shi, Y.; Wong, W.; Hou, J.; Yu, F.; Wei, T.; Wang, H.; Guo, X. Designed formation of NiCo2O4 with different morphologies self-assembled from nanoparticles for asymmetric supercapacitors and electrocatalysts for oxygen evolution reaction. Electrochim. Acta 2019, 296, 719–729. [Google Scholar] [CrossRef]
  59. Qing, X.; Liu, S.; Huang, K.; Lv, K.; Yang, Y.; Lu, Z.; Fang, D.; Liang, X. Facile synthesis of Co3O4 nanoflowers grown on Ni foam with superior electrochemical performance. Electrochim. Acta 2011, 56, 4985–4991. [Google Scholar] [CrossRef]
  60. Kim, B.K.; Sy, S.; Yu, A.; Zhang, J. Electrochemical Supercapacitors for Energy Storage and Conversion. In Handbook of Clean Energy Systems; John Wiley & Sons, Ltd.: Hoboken, NJ, USA, 2015. [Google Scholar] [CrossRef]
  61. Lakehal, A.; Bouaza, A.; Benrabah, B.; Dalache, C.; Benhebal, H. Characterization of Mn-Doped Co3O4 Thin Films Prepared by Sol Gel-Based Dip-Coating Process. High Temp. Mater. Process. 2019, 38, 237–247. [Google Scholar] [CrossRef] [Green Version]
  62. Rahman, M.; Jamal, A.; Khan, S.B.; Faisal, M. Fabrication of Highly Sensitive Ethanol Chemical Sensor Based on Sm-Doped Co3O4 Nanokernels by a Hydrothermal Method. J. Phys. Chem. C 2011, 115, 9503–9510. [Google Scholar] [CrossRef]
  63. Hitkari, G.; Sandhya, S.; Gajanan, P.; Shrivash, M.; Kumar, D. Synthesis of Chromium Doped Cobalt Oxide (Cr:Co3O4) Nanoparticles by Co-Precipitation Method and Enhanced Photocatalytic Properties in the Visible Region. J. Mater. Sci. Eng. 2018, 7, 419. [Google Scholar] [CrossRef]
  64. Wang, Y.; Lei, Y.; Li, J.; Gu, L.; Yuan, H.; Xiao, D. Synthesis of 3D-Nanonet Hollow Structured Co3O4 for High Capacity Supercapacitor. ACS Appl. Mater. Interfaces 2014, 6, 6739–6747. [Google Scholar] [CrossRef]
  65. Tao, J.; Liu, N.; Li, L.; Su, J.; Gao, Y. Hierarchical nanostructures of polypyrrole@MnO2 composite electrodes for high performance solid-state asymmetric supercapacitors. Nanoscale 2014, 6, 2922. [Google Scholar] [CrossRef]
  66. Sun, D.; He, L.; Chen, R. Biomorphic composites composed of octahedral Co3O4 nanocrystals and mesoporous carbon microtubes templated from cotton for excellent supercapacitor electrodes. Appl. Surf. Sci. 2019, 465, 232–240. [Google Scholar] [CrossRef]
  67. Pu, J.; Shen, L.; Zhu, S.; Wang, J.; Zhang, W.; Wang, Z. Fe3O4@C core–shell microspheres: Synthesis, characterization, and application as supercapacitor electrodes. J. Solid State Electrochem. 2013, 18, 1067–1076. [Google Scholar] [CrossRef]
  68. Meng, F.; Fang, Z.; Li, Z.; Xu, W.; Wang, M.; Liu, Y.; Zhang, J.; Wang, W.; Zhao, D.; Guo, X.; et al. Porous Co3O4 materials prepared by solid-state thermolysis of a novel Co-MOF crystal and their superior energy storage performances for supercapacitors. Chem. A 2013, 1, 7235. [Google Scholar] [CrossRef]
  69. Singh, V.; Kosa, M.; Majhi, K.; Major, D.T. Putting DFT to the test: A first-principles study of electronic, magnetic, and optical properties of Co3O4. J. Chem. Theory Comput. 2015, 11, 64–72. [Google Scholar] [CrossRef] [PubMed]
  70. Amaral, L.; Cardoso, D.; Santos, D.; Sljukic, B.; Sequeira, C. Room temperature ionic liquids as electrolyte additives for the HER in alkaline media. J. Electrochem. Soc. 2017, 164, F427. [Google Scholar] [CrossRef]
  71. Armstrong, R.; Henderson, M. Impedance plane display of a reaction with an adsorbed intermediate. J. Electroanal. Chem. Interfacial Electrochem. 1972, 39, 81–90. [Google Scholar] [CrossRef]
  72. Krstajic, N.; Popovic, M.; Grgur, B.; Vojnovic, M.; Sepa, D. On the kinetics of the hydrogen evolution reaction on nickel in alkaline solution: Part I. The mechanism. J. Electroanal. Chem. 2001, 512, 16–26. [Google Scholar] [CrossRef]
  73. Mehta, N.K. Equivalent Circuit Model: Electrolytic Damage Assessment of the Scribed Coated Steel Surface Embedded with Corrosion Inhibitor Capsules. Am. J. Mater. Sci. 2013, 3, 149–161. [Google Scholar] [CrossRef]
  74. Matasso, A.; Wong, D.; Wetz, D.; Liu, F. Effects of High-Rate Cycling on the Bulk Internal Pressure Rise and Capacity Degradation of Commercial LiCoO2 Cells A. J. Electrochem. Soc. 2015, 162, A885–A891. [Google Scholar] [CrossRef]
  75. Wei, Z.; Ren, Y.; Wang, M.; He, J.; Huo, W.; Tang, H. Improving the Conductivity of Solid Polymer Electrolyte by Grain Reforming. Nanoscale Res. Lett. 2020, 15, 122. [Google Scholar] [CrossRef] [PubMed]
  76. Zhang, S.I.; Guan, B.Y.; Lu, X.F.; Xi, S.; Du, Y.; Lou, X.W. Metal Atom-doped Co3O4 hierarchical nanoplates for electrocatalytic Oxygen Evolution. Adv. Mater. 2020, 32, 2002235. [Google Scholar] [CrossRef]
  77. Zhong, X.; Yi, W.; Qu, Y.; Zhang, L.; Bai, H.; Zhu, Y.; Wan, Y.; Chen, S.; Yang, M.; Huang, L.; et al. Co Single-atom Anchored on Co3O4 and Nitrogen-Doped Active Carbon toward Bifunctional Catalyst for Zinc-Air Batteries. Appl. Catal. B 2020, 260, 118188. [Google Scholar] [CrossRef]
  78. Liu, H.; Xia, G.; Zhang, R.; Jiang, P.; Chen, J.; Chen, Q. MOF-derived RuO2/Co3O4 heterojunctions as highly efficient bifunctional electrocatalysts for HER and OER in alkaline solutions. RSC Adv. 2017, 7, 3686–3694. [Google Scholar] [CrossRef] [Green Version]
  79. Sheng, Y.; Botero, M.L.; Manuputty, M.Y.; Kraft, M.; Xu, R. Co3O4 and FexCo3–xO4 Nanoparticles/Films Synthesized in a Vapor-Fed Flame Aerosol Reactor for Oxygen Evolution. ACS Appl. Energy Mater. 2018, 1, 655–665. [Google Scholar] [CrossRef]
  80. Bao, J.; Liu, W.; Xie, J.; Xu, L.; Guan, M.; Lei, F.; Zhao, Y.; Huang, Y.; Xia, J.; Li, H. NixCo3-xO4 Nanoneedle Arrays Grown on Ni Foam as an Efficient Bifunctional Electrocatalyst for Full Water Splitting. Chem. Asian J. 2019, 14, 480–485. [Google Scholar] [CrossRef]
  81. Indra, A.; Menezes, P.W.; Sahraie, N.R.; Bergmann, A.; Das, C.; Tallarida, M.; Schmeißer, D.; Strasser, P.; Driess, M. Unification of Catalytic Water Oxidation and Oxygen Reduction Reactions: Amorphous Beat Crystalline Cobalt Iron Oxides. J. Am. Chem. Soc. 2014, 136, 17530–17536. [Google Scholar] [CrossRef]
  82. Zhang, C.; Antonietti, M.; Fellinger, T.P. Blood Ties: Co3O4 Decorated Blood Derived Carbon as a Superior Bifunctional Electrocatalyst. Adv. Funct. Mater. 2014, 24, 7655–7665. [Google Scholar] [CrossRef]
  83. Wang, X.; Yu, L.; Guan, B.Y.; Song, S.; Lou, X.W. Metal–Organic Framework Hybrid-Assisted Formation of Co3O4/Co-Fe Oxide Double-Shelled Nanoboxes for Enhanced Oxygen Evolution. Adv. Mater. 2018, 30, 1801211. [Google Scholar] [CrossRef]
  84. Wang, Q.; Xue, X.; Lei, Y.; Wang, Y.; Feng, Y.; Xiong, X.; Wang, D.; Li, Y. Engineering of Electronic States on Co3O4 Ultrathin Nanosheets by Cation Substitution and Anion Vacancies for Oxygen Evolution Reaction. Small 2020, 16, 2001571. [Google Scholar] [CrossRef]
  85. Nai, J.; Zhang, J.; Lou, X.W. Construction of Single-Crystalline PrussianBlue Analog Hollow Nanostructures with Tailorable Topologies. Chem 2018, 4, 1967–1982. [Google Scholar] [CrossRef] [Green Version]
  86. Liu, X.; He, J.; Zhao, S.; Liu, Y.; Zhao, Z.; Luo, J.; Hu, G.; Sun, X.; Ding, Y. Self-powered H2 production with bifunctional hydrazine as sole consumable. Nat. Commun. 2018, 9, 4365. [Google Scholar] [CrossRef] [PubMed]
Figure 1. Schematics of the hydrothermal synthesis process.
Processes 09 02176 g001
Figure 2. X-ray diffraction pattern (a), FTIR (b), N2 adsorption-desorption isotherms of catalysts under 77 K (the plot is offset along y axis for cosmetic purposes) (c), pore volume distribution (d), and DFT-calculated band-gap of FexCo3-xO4 (e).
Processes 09 02176 g002aProcesses 09 02176 g002b
Figure 3. SEM micrographs of Fe3+ doped FexCo3-xO4.
Processes 09 02176 g003
Figure 4. Cyclic voltammetry curves of FexCo3-xO4 electrode obtained in the scan rate of 5 mV/s to 300 mV/s measured in 3M KOH electrolytes (af).
Processes 09 02176 g004aProcesses 09 02176 g004b
Figure 5. Peak current vs. (scan rate)1/2 (a), variation of specific capacitance as a function of scan rate (b), and diffusion and capacitive contribution to the specific capacitance of FexCo3-xO4 (c).
Processes 09 02176 g005aProcesses 09 02176 g005b
Figure 6. Charge–discharge (GCD) curves of FexCo3-xO4 electrode measured in the current density window of 1 to 30 A/g under 3M KOH electrolytes (af).
Processes 09 02176 g006aProcesses 09 02176 g006b
Figure 7. Variation of specific capacitance as a function of current density for the samples (a) and energy density vs. power density for x = 0 and x = 1 (b).
Processes 09 02176 g007
Figure 8. Capacitance retention and Coulombic efficiency of the samples tested at 10 A/g current density up to 5000 cycles in 3M KOH electrolytes for FexCo3-xO4.
Processes 09 02176 g008aProcesses 09 02176 g008b
Figure 9. Polarization curves (a) and Tafel slopes for the samples for FexCo3-xO4 by OER process (b).
Processes 09 02176 g009
Figure 10. LSV polarization curves at various cycles to evaluate stability of FexCo3-xO4 by OER process.
Processes 09 02176 g010
Figure 11. LSV polarization curves for HER of FexCo3-xO4 in 1 M KOH (a), and Tafel slopes for the FexCo3-xO4 for HER process (b).
Processes 09 02176 g011
Figure 12. LSV polarization curves at various cycles to evaluate the stability of FexCo3-xO4 electrodes for HER process.
Processes 09 02176 g012
Figure 13. Electrochemical complex impedance (Nyquist) plots of the FexCo3-xO4 electrodes at various potentials (vs. SCE) measured in 1 M KOH.
Processes 09 02176 g013aProcesses 09 02176 g013b
Figure 14. Nyquist plots along with their equivalent circuit in the inset for FexCo3-xO4 x = 0.0 (a) and x = 1.0 (b). In plots, Z’ and Z” denote a real and an imaginary impedance, respectively.
Processes 09 02176 g014
Figure 15. Chronoamperometry characteristics of the FexCo3-xO4.
Processes 09 02176 g015
Table 1. Stoichiometry of chemicals used in the synthesis of FexCo3-xO4.
FexCo3-xO4
x
Co(NO3)2.6H2O (g)Fe(NO3)2.6H2O (g)ν1 (cm−1)ν2 (cm−1)
0.03.62650.0000538.060653.295
0.23.39340.3365544.557655.710
0.43.15910.6747546.877656.918
0.62.92371.0146549.661657.120
0.82.68701.3564550.125657.716
1.02.44901.6998551.517658.081
Table 2. Surface area parameters derived from the adsorption-desorption curves, the lattice parameter of as-synthesized FexCo3-xO4 from XRD, and crystallite size obtained using Scherrer’s formula.
FexCo3-xO4
x
BET Surface Area(m2/g)BJH Surface area (m2/g)BJH Avg. Pore Radius (nm)BJH Avg. Pore Volume (cc/g)Crystallite Size (nm)Lattice Parameter,
a (nm)
0.059.4781.481.4320.20219.43498.06235
0.264.0283.431.2700.18616.91048.05657
0.476.2275.851.5220.20118.35138.05746
0.668.36108.930.5310.21317.25228.06047
0.870.7475.783.2280.19118.42478.05297
1.087.4594.411.5110.18920.07338.06054
Table 4. Electrocatalytic performance of FexCo3-xO4.
Content, x.OERHER
Onset Overpotential (η0)Overpotential
10)
Onset Overpotential (η0)Overpotential
10)
0.0297 mV329 mV81 mV182 mV
0.2248 mV268 mV81 mV191 mV
0.4248 mV268 mV17 mV153 mV
0.6303 mV320 mV1 mV132 mV
0.8249 mV270 mV30 mV179 mV
1.0245 mV266 mV2 mV166 mV
Publisher’s Note: MDPI stays neutral with regard to jurisdictional claims in published maps and institutional affiliations.

