Article

Biocompatible Osmium Telluride-Polypyrrole Nanocomposite Material: Application in Prostate Specific Antigen Immunosensing

1
SensorLab (University of the Western Cape Sensor Laboratories), 4th Floor Chemical Sciences Building, Department of Chemistry, University of the Western Cape, Robert Sobukwe Road, Bellville, Cape Town 7535, South Africa
2
Institute for Nanotechnology and Water Sustainability (iNanoWS), College of Science, Engineering and Technology, Florida Campus, University of South Africa, Johannesburg 1710, South Africa
*
Authors to whom correspondence should be addressed.
Processes 2021, 9(12), 2203; https://doi.org/10.3390/pr9122203
Submission received: 10 September 2021 / Revised: 31 October 2021 / Accepted: 1 November 2021 / Published: 7 December 2021
(This article belongs to the Section Chemical Processes and Systems)

Abstract

:
Prostate cancer is a dominant global threat to society. It affects nearly 4000 men in South Africa annually, making it the second most threatening cancerous disease after lung cancer. A potential serological biomarker to monitor early diagnosis of prostate cancer is prostate specific antigen (PSA). We used the PSA biomarker in our work to develop an extremely sensitive electrochemical immunosensor to achieve low detection limits. The fabrication steps followed with the combination of thioglycolic acid capped osmium telluride quantum dots (TGA-OsTe2QD)-polypyrrole (PPy) nanocomposite and prostate specific antigen modified on a glassy carbon electrode. The UV-Vis signatures of TGA-OsTe2QD-PPy showed an absorption band at 262 nm which is attributed to the PPy and TGA-OsTe2QD composite. This band corresponds to the energy band gap of 4.4 and 5.4 eV. The CV responses of BSA|Ab|TGA-OsTe2QD|PPy|GCE modified electrode to prostate specific antigen (PSA) was studied within a range of 0–16 ng/mL PSA that was linear, herein referred to as liner range (LR), which produced a limit of detection (LOD) value of 0.36 ng/mL PSA. The values of the immunosensor’s calibration parameters (LR and LOD) make them suitable for real sample application, due to their coverage of the PSA concentration range (0–14 ng/mL) that is of clinical importance.

1. Introduction

Prostate cancer is a global threat to society due to its highly prevalent rate in males. The WHO determines prostate cancer to be the second leading cause of morbidity amongst the male population, counting more than 4000 cases in South Africa annually. The extent and morbidity ratio due to noncutaneous malignancy positions the cancer in the top five list of death-causing cancers worldwide [1,2]. The incidence of prostate cancer correlates to the factors of age and time of diagnosis. An early inspection of the malignancy seldom needs very little or no treatment at all. However, the asymptomatic behavior of cancerous cells at an early stage is a bottleneck for early cancer diagnosis, defining it as the most critical step. The typical symptoms do not manifest until the later stages of cancer, leaving out immediate care or are left treated due to hesitance on patient’s part to seek medical attention. Many diagnostic centers determine the cancer on basis of elevated prostate specific antigen levels. However, high PSA levels and other cancer appearing symptoms such as infection, inflammation or enlargement of prostate may not directly relate to this disease. These limitations in clinical assessment could be misleading and has a considerable ambiguity in a proper diagnosis [3]. It is due to these reasons that early diagnosis faces hurdles, and the patient is unaware of the disease until serious symptoms appear. ELISA test for quantitative monitoring of PSA in human serum, a physical examination of the prostate called Digital Rectum Examination (DRE), PSA blood test and MRI scan, are all clinical tests for this disease that may fail at some point of time due to very low sensitivity and detection limit. For example, ELISA has a detection range of 0–100 ng/mL which is quite low [4,5,6]. Therefore, objective strategies that could enable early diagnosis are overwhelmingly needed, not only due to the malignant disease but also to present cost-effective, sensitive, specific and non-invasive prognostic assessments in the market.
Numerous studies for cancer detection have been reported; however, the improved cancer survival rates are rather low. The limitation is due to the last stage detection and delayed diagnosis of cancerous cells, making tumors less curable. To achieve early detection of any cancerous disease, the discovery of specific, sensitive and reliable biomarkers is required [7]. Prostate specific antigen (PSA) is a potential biomarker considered as the most reliable tool for diagnostics of prostate cancers [8]. Studies illustrate more prominent detection of malignancies by PSA than DRE or any other isolated parameter. This theory led to the development of rapid and sensitive point of care testing (POCT) detection devices for PSA [9]. Electrochemical immunosensors in cancer clinical testing has outreached in this area and has potential advantages over other clinical analysis methods [10]. The portable detection systems are promising tools that hold the potential to convert complex assays in easy-to-use systems and distribute them amongst the community for their wide use [11]. Immunosensors can be designed to detect developing cancer biomarkers and to allow improved monitoring of cancer growth and patient therapy [12].
The introduction of nanomaterials in biosensing applications is due to their unique characteristic features desirable in this area such as small size, high surface area, excellent electronic properties, specific physicochemical characteristics and good biocompatibility [13,14]. The sensitivity of biosensors significantly increases by incorporation of nanomaterials at the interface, where most of the chemical reactions takes place [15]. At present, nanostructured platforms such as metals, metal oxides, conducting polymers and organic–inorganic hybrid nanocomposites are being used significantly as the immobilizing matrix to improve the signal and sensitivity of the biosensor [16]. Biocompatible thioglycolic acid (TGA) capped osmium telluride (TGA-OsTe2) quantum dot (QD) material was used as a mediator in this study. Conducting polymers, PPy used in this work, are commonly chosen in electrochemical experiments due to their biocompatible and inert nature. They prevent fouling of electrodes and cause minimal interference to electroactive materials [16]. PPy is used mostly in biosensors and immunosensors due to biocompatibility and the ease of immobilization of biological compounds [17]. It is important to note that nanomaterials are therefore decorated with conductive polymers in order to enhance biocompatibility and to achieve precise targeting [18]. Hence, in this study PPy was electrosynthesised on the glassy carbon electrode surface using 30 cycles. This was followed by the incorporation of the biocompatible TGA-OsTe2QD material onto the PPy|GCE modified electrode surface. Lastly, the electrochemical immunosensor for prostate specific antigen (PSA) was prepared by immobilizing anti-PSA antibody onto the TGA-OsTe2QD|PPy|GCE modified electrode for 6 h.

2. Experimental Details

2.1. Chemicals and Sample Preparation

Analytical grade sodium hydroxide (NaOH, 98%), granular sodium borohydride (NaBH4, 98%), osmium tetrachloride powder (OsCl4, 99%), tellurium powder (Te, 99.99%), thioglycolic acid (TGA, 99%), 1-ethyl-3-(3-dimethylaminopropyl) carbodiimide hydrochloride (EDC, 98%), N-hydroxysuccinimide (NHS, 98%), 0.1 M lithium perchlorate (LiClO4, 98%), pyrrole (non-distilled C4N5H, 98%), absolute ethanol, disodium hydrogen phosphate (Na2HPO4, ≥98%), sodium dihydrogen phosphate (NaH2PO4, 99%), 1% bovine serum albumin (BSA, ≥97%), the anti-prostate specific antigen antibody (ab 33609) and native human PSA protein (ab 96163) were all purchased from Merck, Johannesburg, South Africa. Micropolish II alumina powder 0.05 µm, 0.3 µm and 1.0 µm was purchased from Buehler, Lake Bluff, IL, USA. An amount of 0.1 M PBS (pH 7) was used as the working solution for all the electrochemical measurements. All the antibody and antigen stock solutions (100 µg/mL) and their working solutions (20 µg/mL) used in the experiment were prepared with 0.1 M PBS (pH 7, 4 °C) and kept in the fridge when not in use. All solutions were prepared using double distilled water and deoxygenated with nitrogen (N2) prior to use.

2.2. Instrumentation

All electrochemical experiments were performed using a conventional three electrode set up. Herein, a glassy carbon electrode (GCE), platinum wire and Ag/AgCl (3 M NaCl) act as the working, counter, and reference electrode, respectively. Voltammetric experiments were carried with a CHI 760E Electrochemical Workstation (CH Instruments, Inc., Shanghai, China). Ultraviolet-visible (UV-Vis) absorption measurements of the prepared TGA-OsTe2QD, PPy and TGA-OsTe2QD-PPy were obtained using 1 cm quartz cuvette on a Nicolet Evolution 100 UV-Visible Spectrophotometer (Thermo Electron, Cheshire, UK) over a wavelength range of 200 to 800 nm. The morphology, size and shape of TGA-OsTe2QD, PPy and TGA-OsTe2QD-PPy were characterized by high-resolution transmission electron microscopy (HR-TEM), using a Tecnai G2 F20X-Twin MAT 200KV HRTEM Spectrometer equipped with an Energy-Dispersive X-ray Spectroscopy (EDS) detector—product of Field Electron and Ion Company (FEI) Europe, Eindhoven, The Netherlands. Copper grid (Cu) was used as a sample holder to immobilize 2 µL sample solution to obtain micrographs, at room temperature. Small Angle X-Ray Scattering (SAXS) spectroscopic measurements were obtained with Anton Paar SAXSpace Spectrometer (Anton Paar, GmbH, North Ryde, Australia). Samples were placed in a 1 mm diameter quartz capillary positioned at a distance of 317 mm from the SDD camera and temperature controlled at 20 °C.

2.3. Synthesis of TGA Capped OsTe2QD

The synthesis of TGA-OsTe2QD was achieved via bottom-up approach by following the method illustrated by Chang et al. [19], with slight modifications. Osmium tetrachloride and tellurium powder were used as Os and Te sources, respectively. As a first step, osmium tetrachloride solution was prepared by addition of 0.056 g OsCl4 and 96 µL TGA capping in 25 mL distilled water under continuous stirring. Meanwhile, the solution was adjusted to a pH of ±12.06 using 0.1 M NaOH and was bubbled under nitrogen gas for 45 min at 25 °C. The second step involves preparation of NaHTe solution using NaBH4 as a reducing agent. Chemical reduction of tellurium ions occurred by mixing 0.0638 g of tellurium powder and 0.03783 g of NaBH4 in 25 mL distilled water under nitrogen gas for 30 min at 100 °C. Then, NaHTe precursor solution was introduced to OsCl4-TGA solution under constant stirring until a brownish-red color solution was obtained which indicates the formation of TGA capped OsTe2 quantum dots (TGA-OsTe2). Aliquots at different reflux time of TGA-OsTe2QD were collected at different time intervals (i.e., 10, 20, 40 and 60 min). This was done to study the effect of time on the formation of quantum dots. At 60 min final TGA-OsTe2QD material was obtained followed by immediate quenching.

2.4. Immunosensor Fabrication

A stepwise schematic representing the fabrication of electrochemical immunosensor is illustrated in Figure 1. The fabrication starts with polishing of glassy carbon electrode (GCE) on micro cloth pad to a mirror-like finish with 1 µm, 0.3 µm, and 0.05 µm alumina slurries. The step removes any adsorbed organic matter of the electrode surface which is followed by a thorough rinse with de-ionized water after each polishing step. The electrode is successively ultrasonicated for 10 min with absolute ethanol and distilled water to remove any possible absorbed alumina crystals on the GCE surface. The pretreated electrode was then electropolymerized using pyrrole monomer to make the electrode conductive. Pyrrole was distilled prior to use and stored in refrigerator in an air tight vial. Electropolymerization of pyrrole monomer was carried out in aqueous solutions using cyclic voltammetry in a three-electrode setup containing 100 µL monomer solution along with 0.1 M lithium perchlorate as the supporting electrolyte in 30 segments in the potential range of −0.8 to 0.8 V. The PPy|GCE modified electrode was functionalized with 8 µL of a solution consisting of TGA-OsTe2QD in the presence of 1-ethyl-3-[3-dimethylaminopropyl] carbodiimide/N-Hydroxysuccinimide (EDC/NHS, ratio 1:1) for 12 h at room temperature. The mixture served to activate the amine groups of the polypyrrole film for conjugation with the carboxyl groups of the TGA capped OsTe2 quantum dots. A drop of 5 µL anti-PSA solution (10 µg/mL of antibody in 0.1 M PBS, pH 7.0) was then drop casted onto TGA-OsTe2QD|PPy|GCE modified electrode surface and was allowed to dry for 6 h at 4 °C. The interaction of antibody with the modified electrode surface could leave free active sites and it is necessary to block them. For this, the modified electrode was immersed in 1% BSA solution (5 µL) for 30 min to block the active sites and to remove non-specific absorption on the surface. In each step electrochemical measurement were performed in a potential sweep between −1 to +1 V at 20 mV/s scan rate. The immunoreaction was performed by dipping Ab|TGA-OsTe2QD|PPy|GCE modified bioelectrode in 0.1 M PBS, pH 7.0, containing different PSA concentrations for 10 min. The variation in current response of immunoreactions upon PSA interaction with anti-PSA modified electrode was detected.

3. Results and Discussion

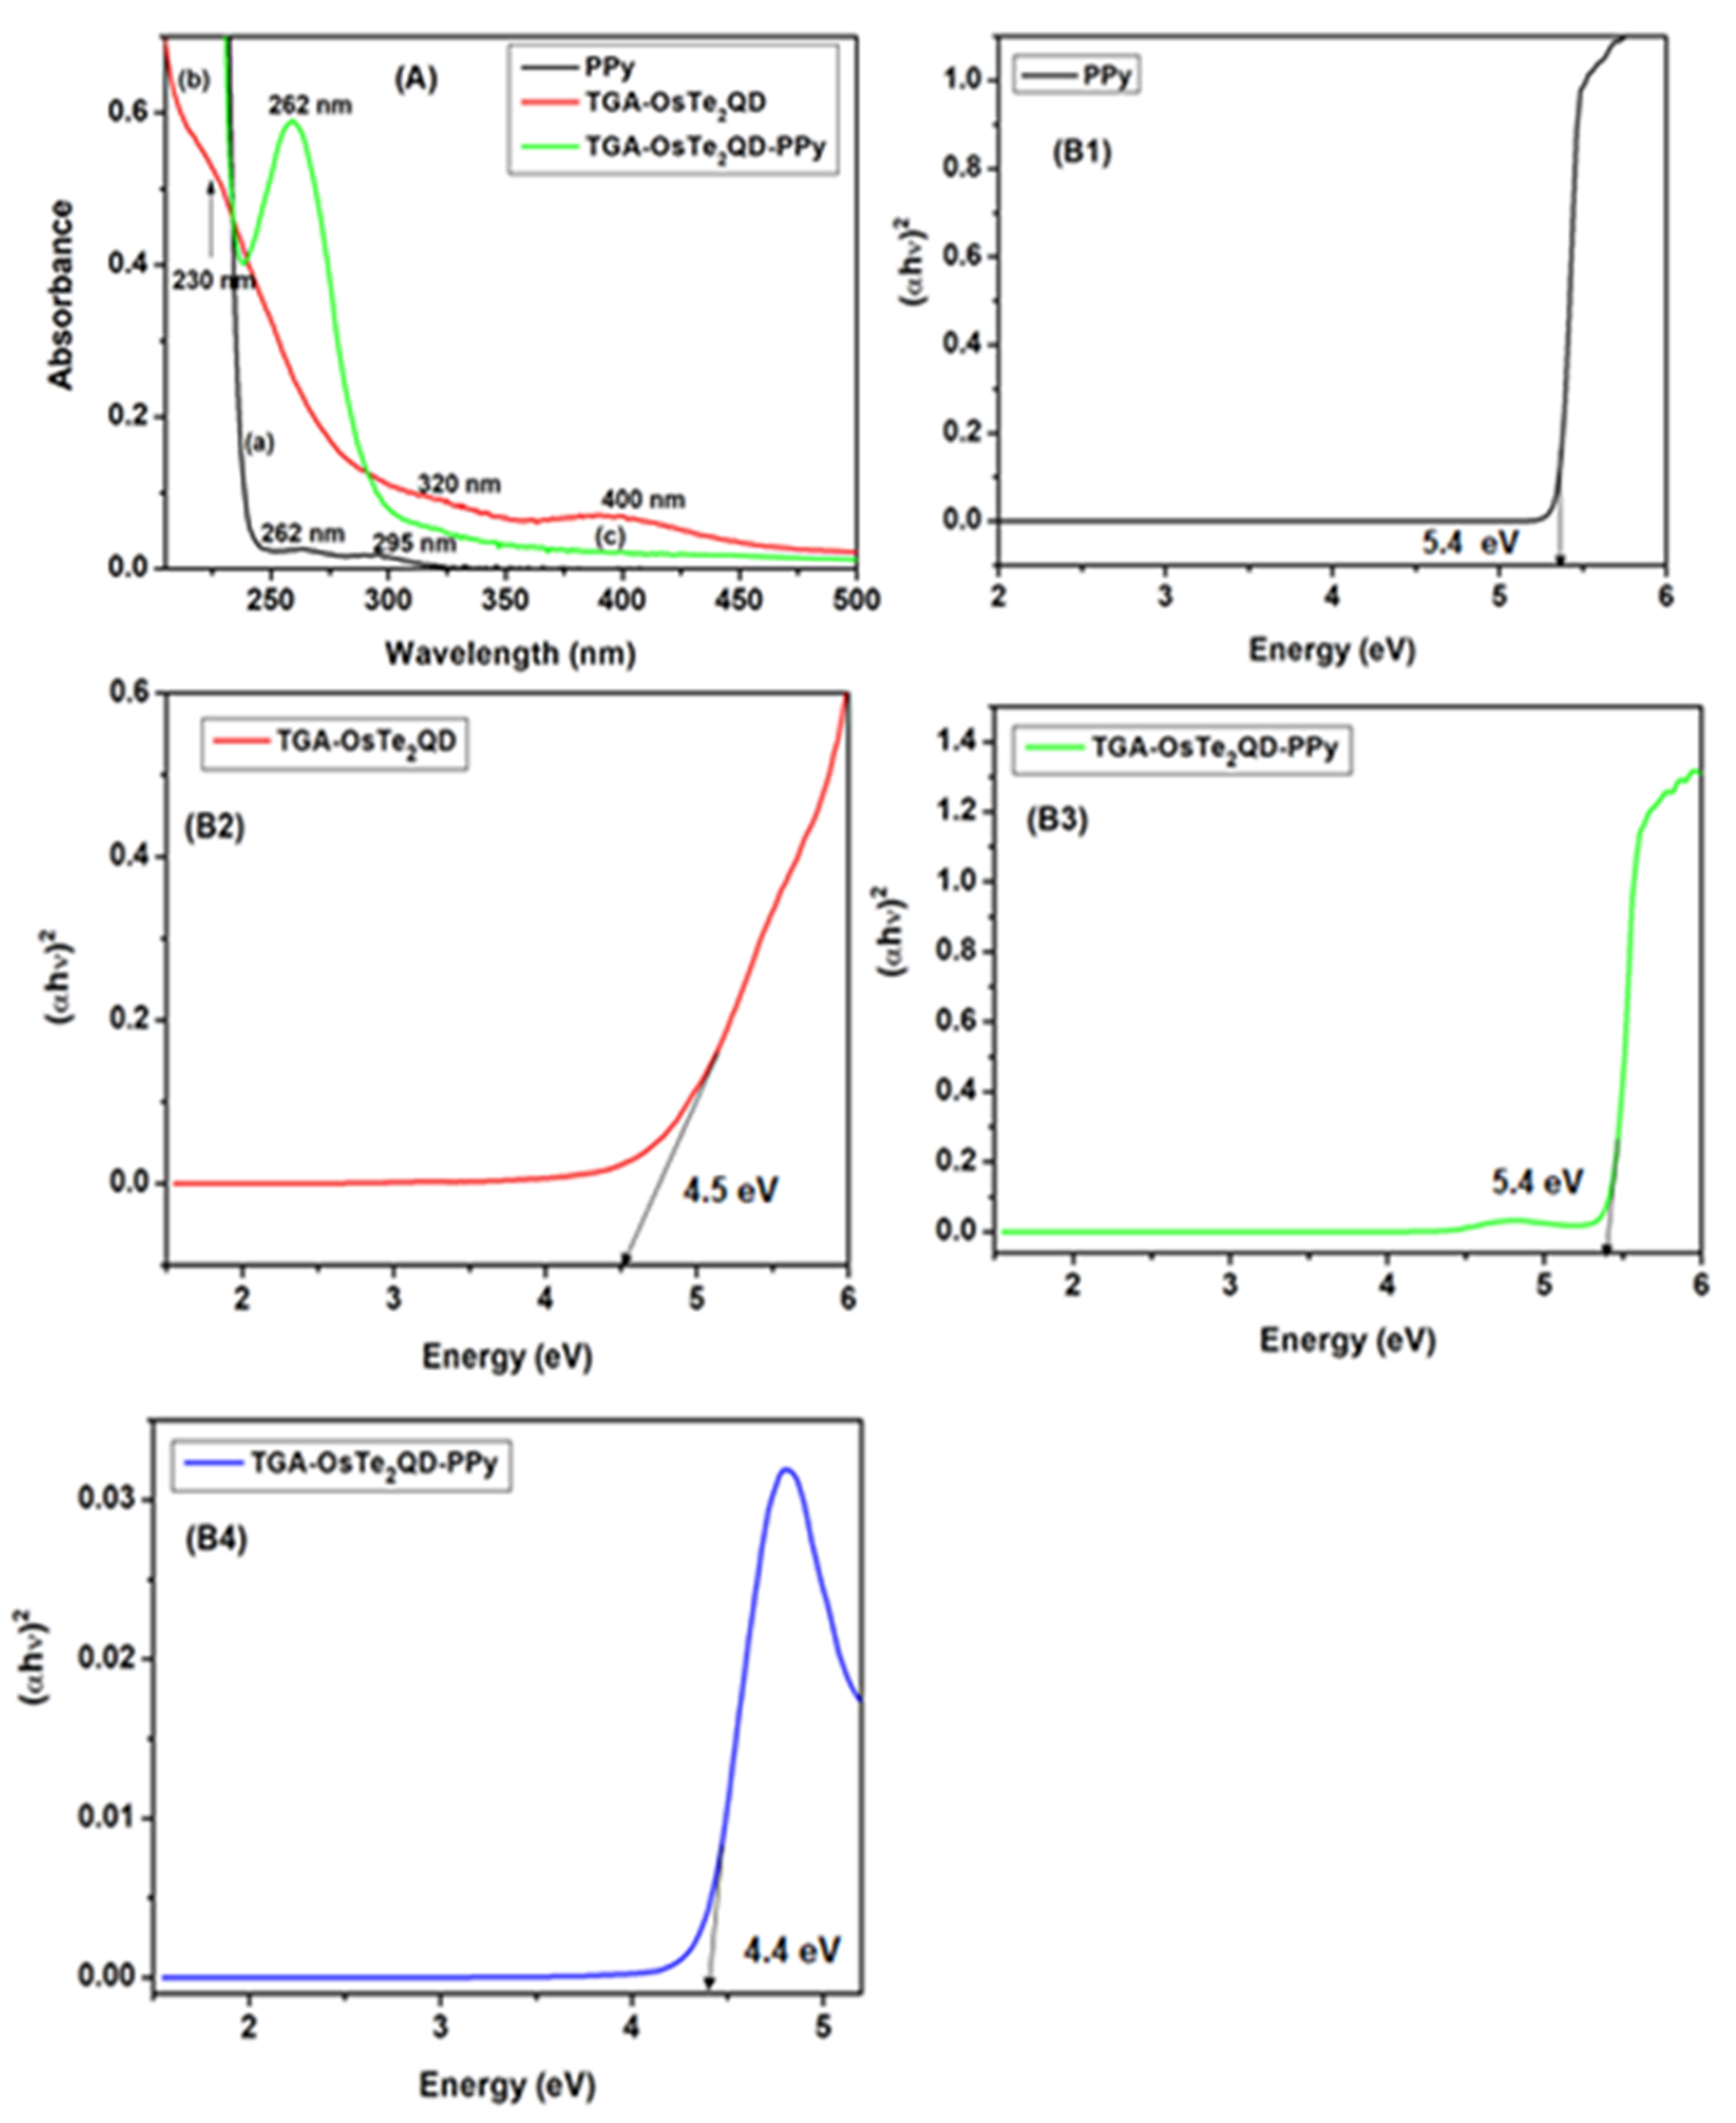
3.1. Optical Properties of TGA-OsTe2QD and PPy

UV-Vis spectrophotometer of PPy, TGA-OsTe2QD, and TGA-OsTe2QD-PPy materials are illustrated in Figure 2. As inspected carefully, Figure 2A line (a) shows two small absorbance bands at 262 nm and 295 nm which occurred due to π-π* interaction of polypyrrole aromatic ring [20]. It is important to note that TGA-OsTe2QD (Figure 2A, line(b)) exhibited three absorbance bands at 230 nm, 320 nm and 400 nm. The absorbance band at 230 nm is ascribed to the thioglycolic acid (TGA) capping agent which is in good agreement with previous findings on analogous mercaptocarboxylic acid molecules [21]. On the other hand, the absorbance band at 320 nm is due to d valence band of Os8+ [22]. Lastly, the formation of TGA-OsTe2QD was determined by the absorbance band appearing at 400 nm [23]. The incorporation of polypyrrole with TGA-OsTe2QD (Figure 2A, line (c)) produced a more pronounced absorbance band at 262 nm. This is due to the interaction between the functionalized quantum dots and polypyrrole functionalities [24]. Figure 2B shows extrapolation values for Tauc plots. As can be seen in Figure 2(B1), polypyrrole exhibited an energy band gap value of 5.4 eV. The results obtained are in agreement with already reported studies for PPy [25]. Table 1 summarizes the energy band gap values of metal telluride chalcogenides and metal–polymer composites. As can be seen, the HgTe and WTe2 obtained the lowest energy band gap values as compared to MoTe2 and CdTe. Thus, the obtained energy band gap value for TGA-OsTe2QD was found to be 4.5 eV (Figure 2(B2)). This value falls within the PbEuTe and PbSrTe band gap values of 4.5–4.7 eV [26]. On the other hand, the TGA-OsTe2QD-PPy mixture exhibited two energy band gaps at 5.4 eV and 4.4 eV. These two values are attributed to the individual transition of PPY and TGA-OsTe2QD as illustrated in Figure 2(B3,B4). Interestingly, these results are in accordance with the reported literature for ZnS-PPy (4.26–4.7 eV) and ZrO2-PPy (5.07 eV) [27,28].

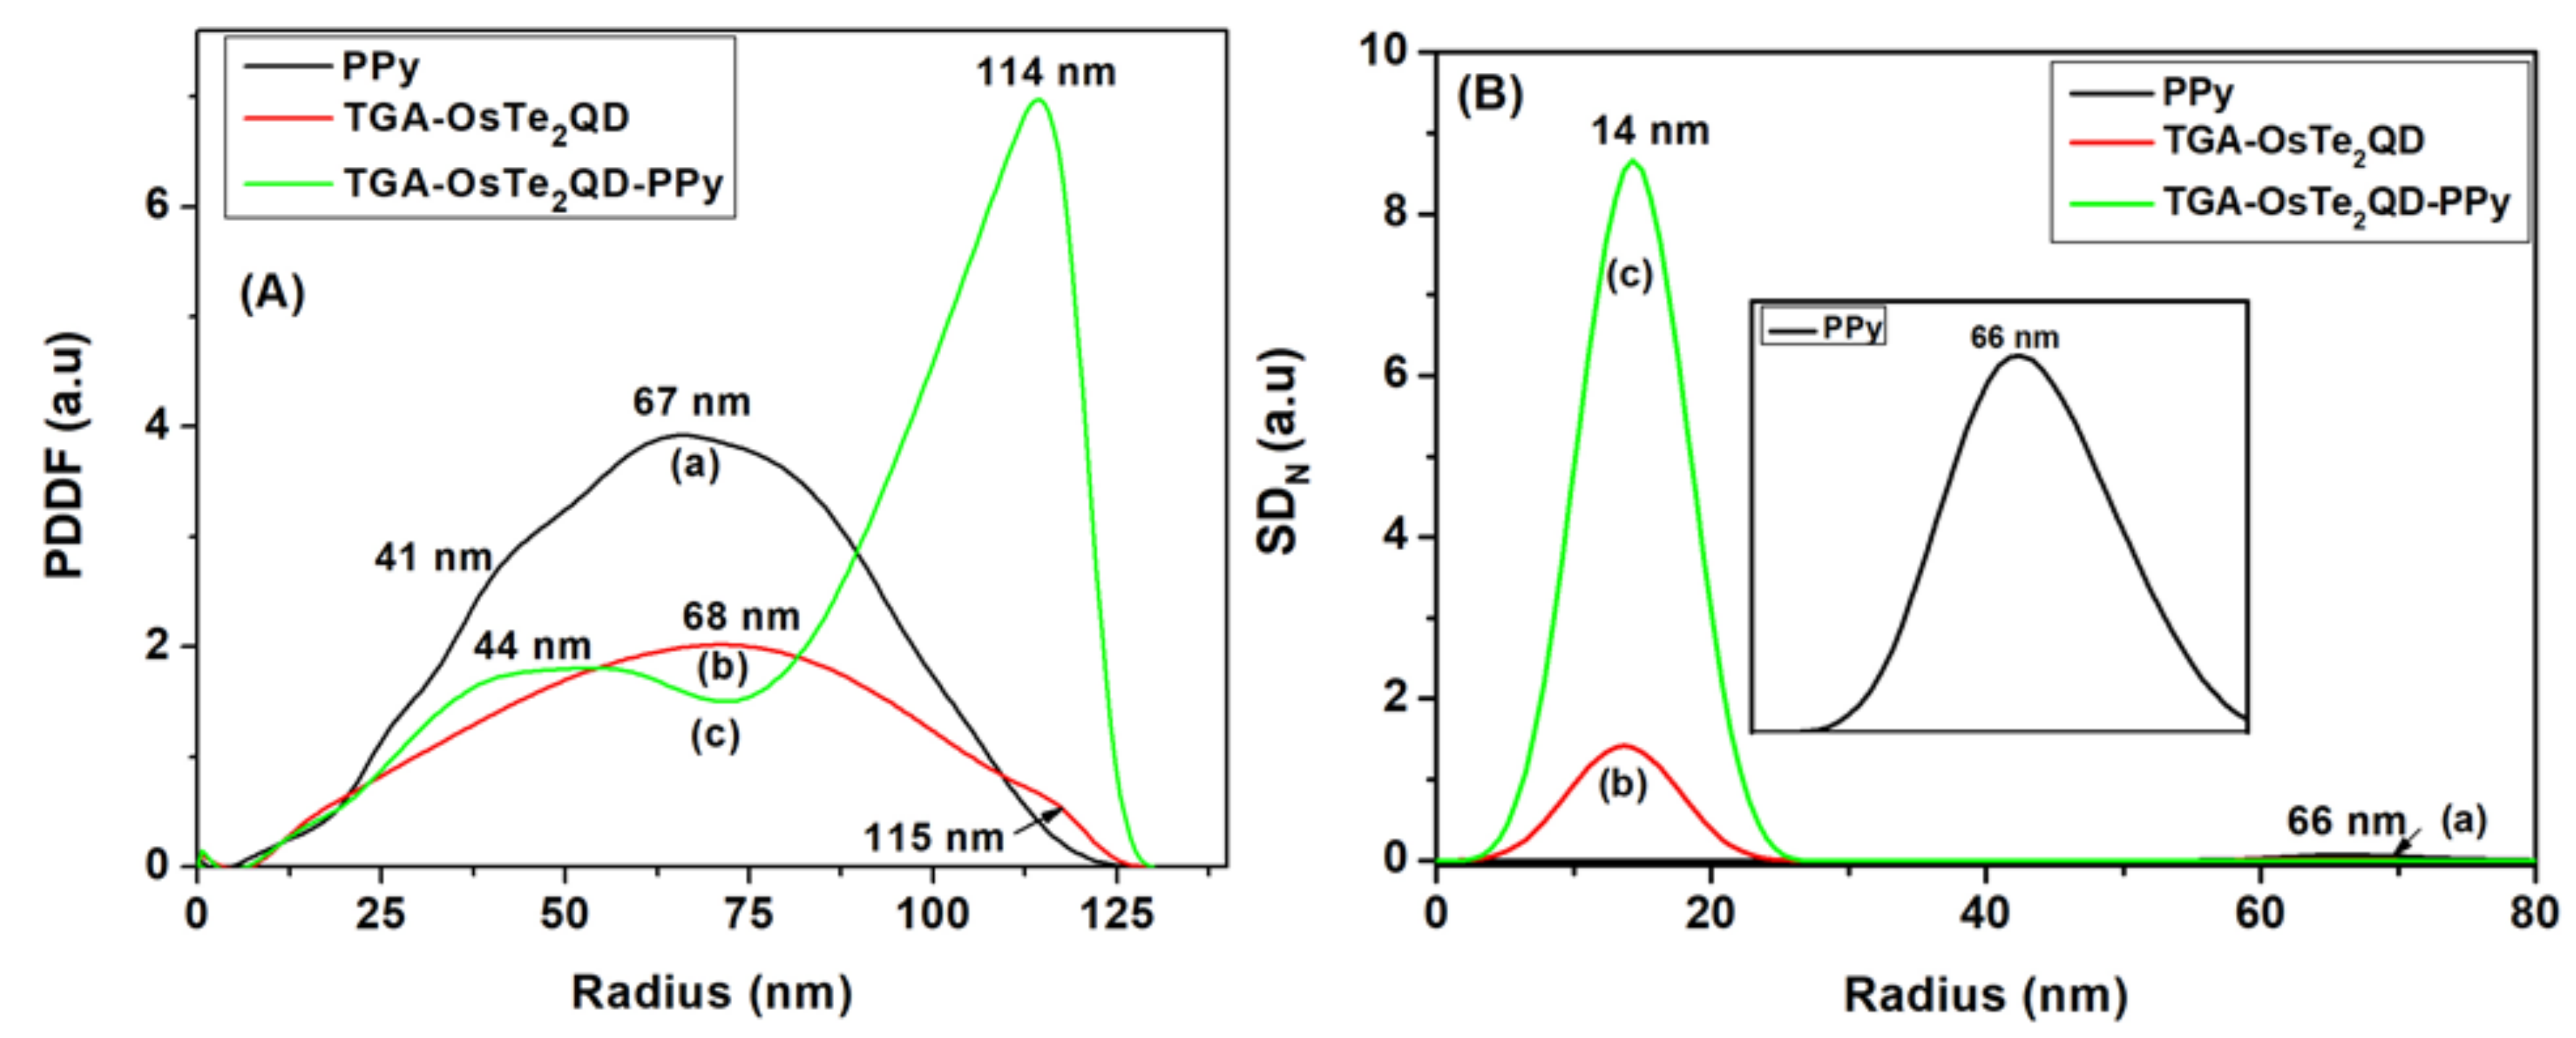
3.2. Internal Structure of TGA-OsTe2QD and PPy

Small Angle X-ray Scattering provides suitable information regarding the overall shape and sizes of the as-prepared nanomaterials. The technique can quantify key features of the particles to identify the shape and peak symmetry into spherical (or globular), prolate (or cylindrical) and oblate (or lamellar) [36]. Figure 3A shows the PDDF of (a) pyrrole which exhibits almost bell-shaped symmetrical structure. According to the literature, the presence of spherical-shaped particles form a bell-shaped peak, and hence formation of globular particles could be concluded [37]. The results are in agreement with previous literature, where the structure of pyrrole as a bulky circular ring is reported. The small humps could be due to the aggregation of particles as it is having a bulky appearance. This behavior is also observed in HR-TEM where pyrrole exhibits a cloudy structure at the micro level and circular rings of pyrrole could be seen when zoomed to nanometer range [38]. As shown in Figure 3A line (b), TGA-OsTe2QD exhibits a perfect bell-shaped structure indicating the presence of globular-shaped particles with maximum radius of 68 nm [39]. A small hump observed at 150 nm could be attributed to impurities and agglomeration. Interestingly, shown in Figure 3A line (c), TGA-OsTe2QD-PPy produced two peaks at 44 nm and 114 nm. The two subunits of aggregates or dumbbell make a PDDF which is rather defined by the appearance of a second peak, the same as the case of TGA-OsTe2QD-PPy. The two peaks represent the presence or interaction between TGA-OsTe2QD and PPy.
Figure 3B shows size distribution function weighted by number for PPy, TGA-OsTe2QD and TGA-OsTe2QD-PPy. It was observed that (a) PPy exhibited size distribution at 66 nm (insert a). However, (b) TGA OsTe2QD and (c) TGA-OsTe2QD-PPy show a narrow size distribution with a maximum radius of 14 nm. As inspected carefully, (c) TGA-OsTe2QD-PPy exhibited an enhanced peak (95%) higher than the TGA-OsTe2QD. This indicates that the combination of the materials enhances the signal.

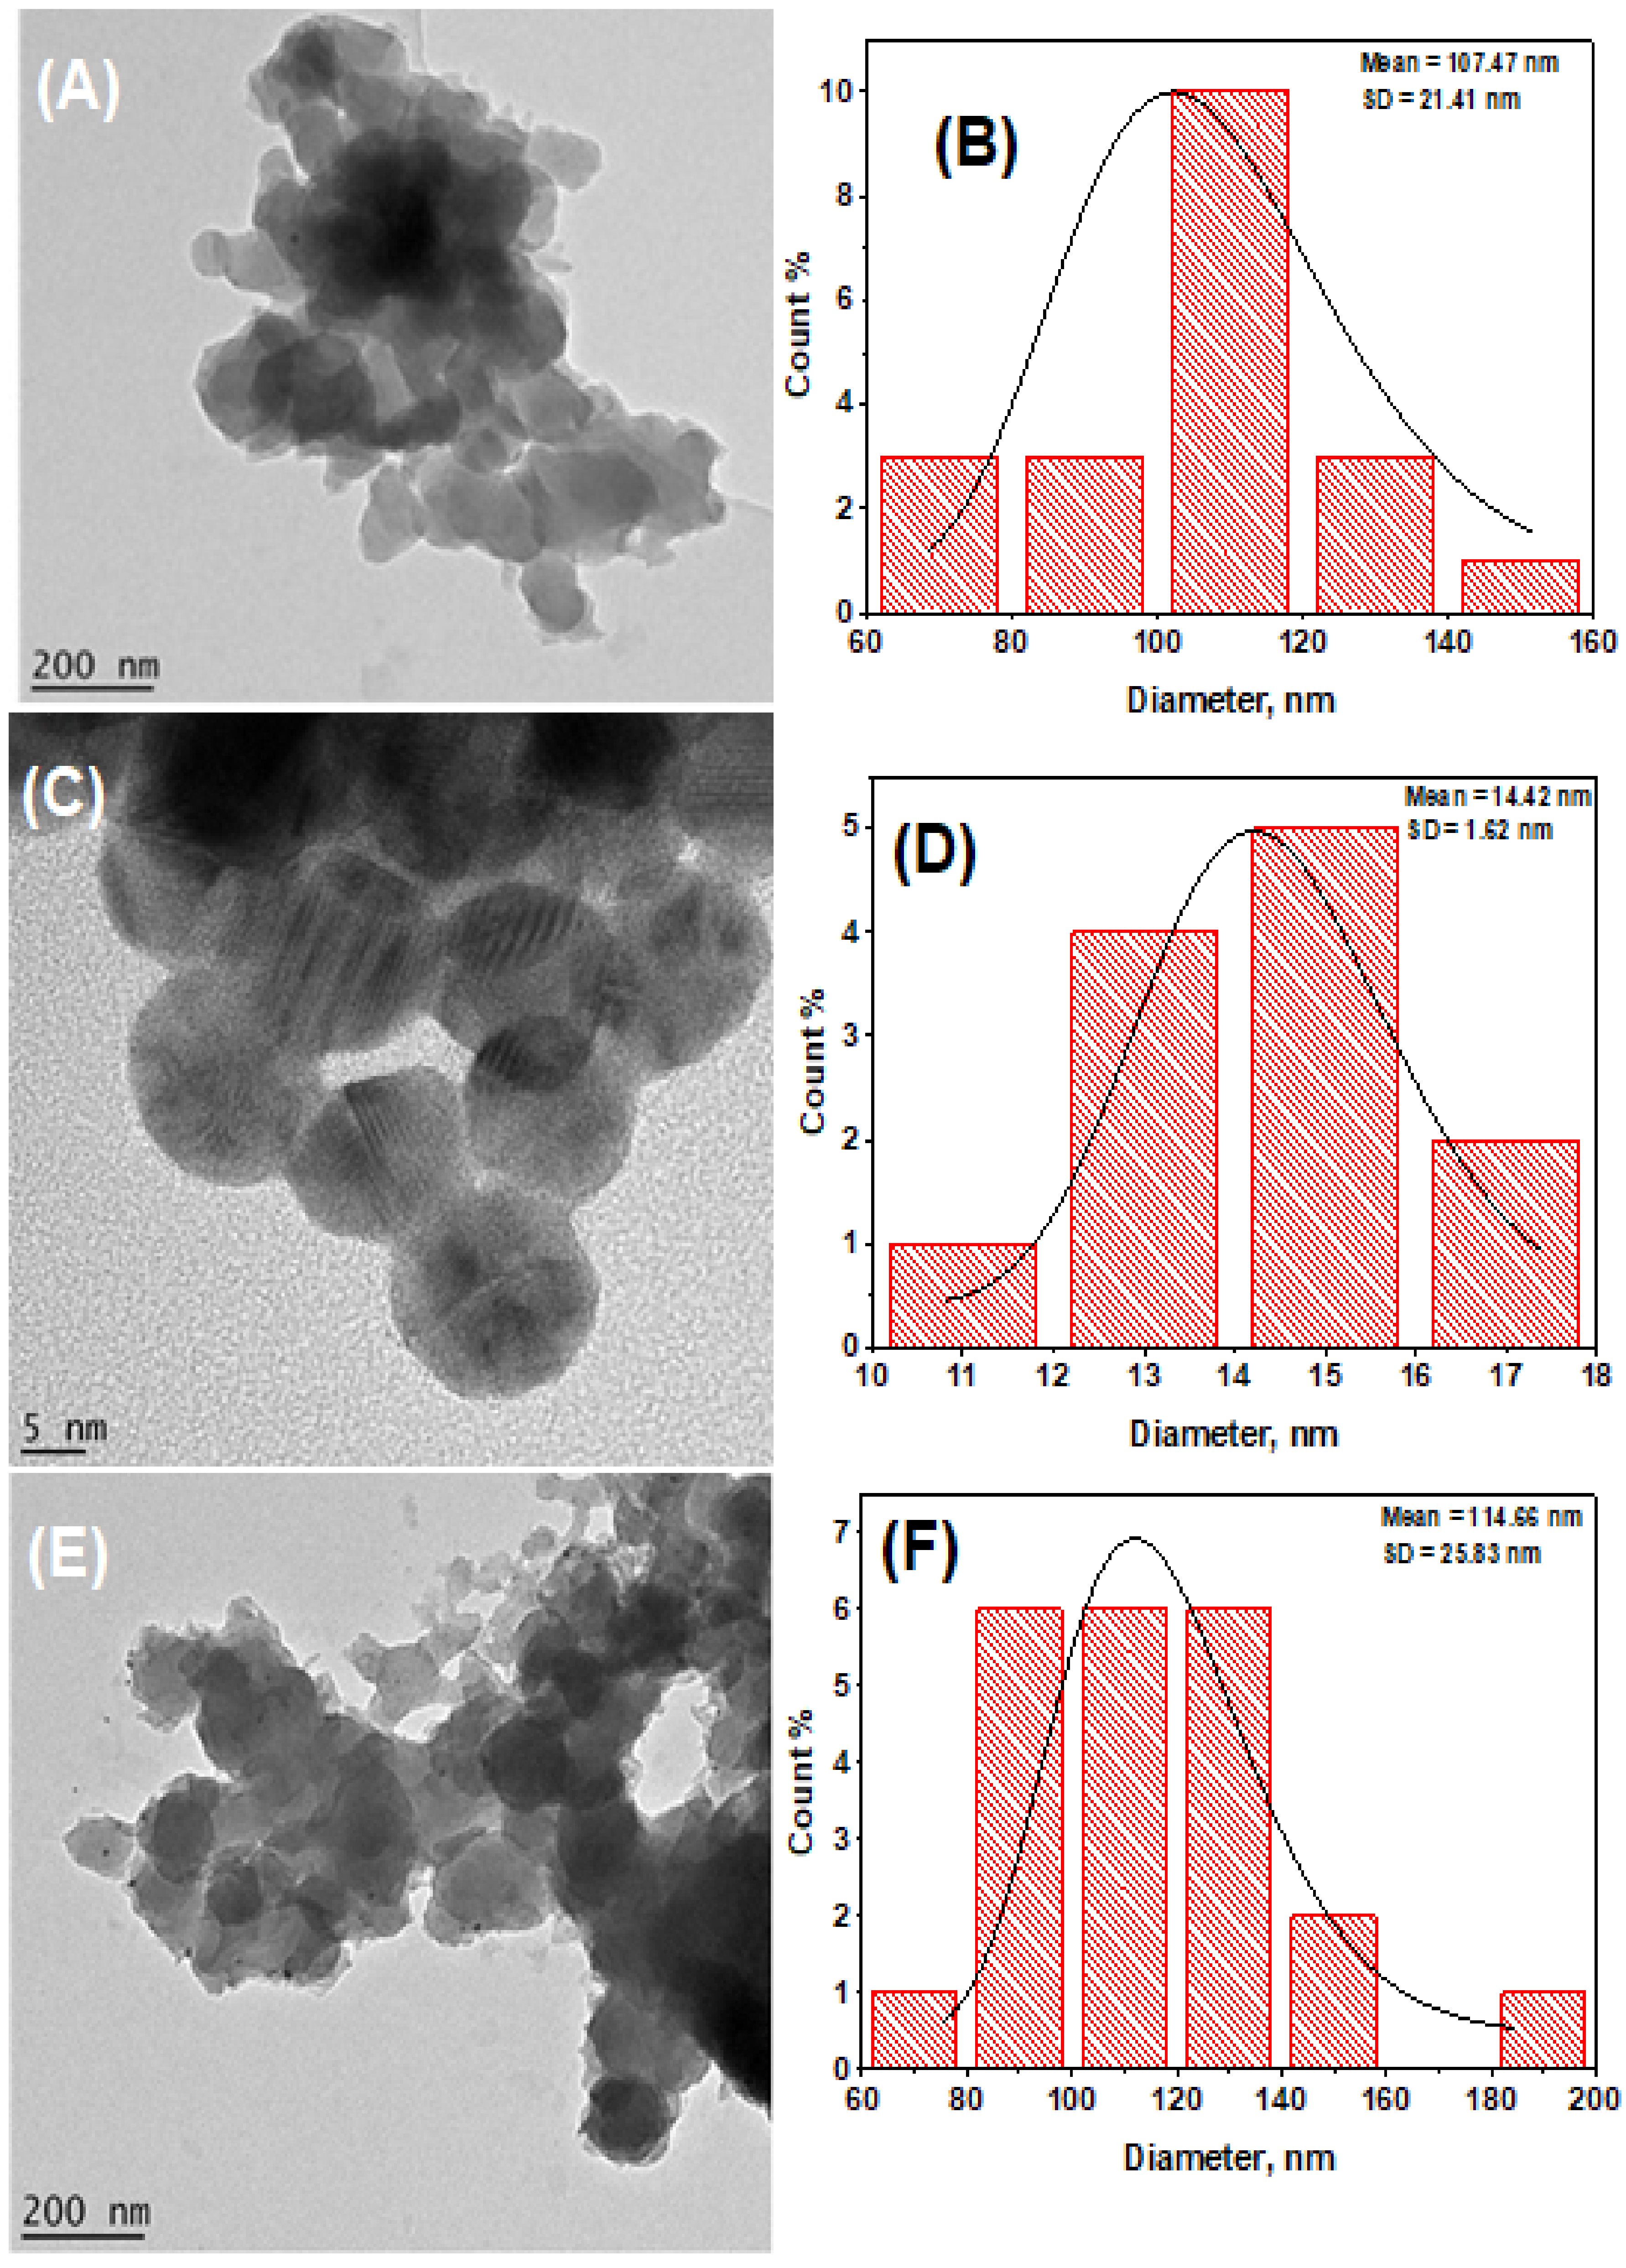
3.3. Morphological Properties of TGA-OsTe2QD and PPy

Further analysis of PPy, TGA-OsTe2QD, and TGA-OsTe2QD-PPy was performed by HR-TEM and corresponding statistical size distribution histograms (Figure 4), to validate the information about the shape, size and structure of the composite material. HR-TEM micrograph of PPy was taken at the scale view of 200 nm. The image shows a cloudy structure of aggregated polymeric particles, forming a bulky cloud with doughnut-shaped circular dark rings [40]. The corresponding size distribution ranges from 60–160 nm, with maximum size distribution of 107 nm (Figure 4B). TGA-OsTe2QD (Figure 4C) exhibits globular-shaped particles with a homogeneous size distribution of 5 nm. The results are comparable and in good agreement with the QDs UV-Vis absorption spectra which showed a significant absorption band and could be attributed to refluxing process that allows the growth of globular sized QD material [41]. The affirmation of crystallinity was done by lattice fringes, estimating an average diameter of the QDs to be 1–2 nm. On the other hand, Figure 4C TGA-OsTe2QD-PPy at a scale view of 20 nm shows aggregates of cloudy structure along with the presence of globular shaped particles [37]. The pyrrole monomer and the QD combined together to form aggregates, comparable to SAXS histogram. It can be seen that the particle sizes of TGA-OsTe2QD-PPy were slightly bigger than in TGA-OsTe2QD material. The increase in particle sizes are attributed to the interaction between TGA-OsTe2QD and polypyrrole during the growth into larger particles.

3.4. Electroanalysis of Immunosensor Platform

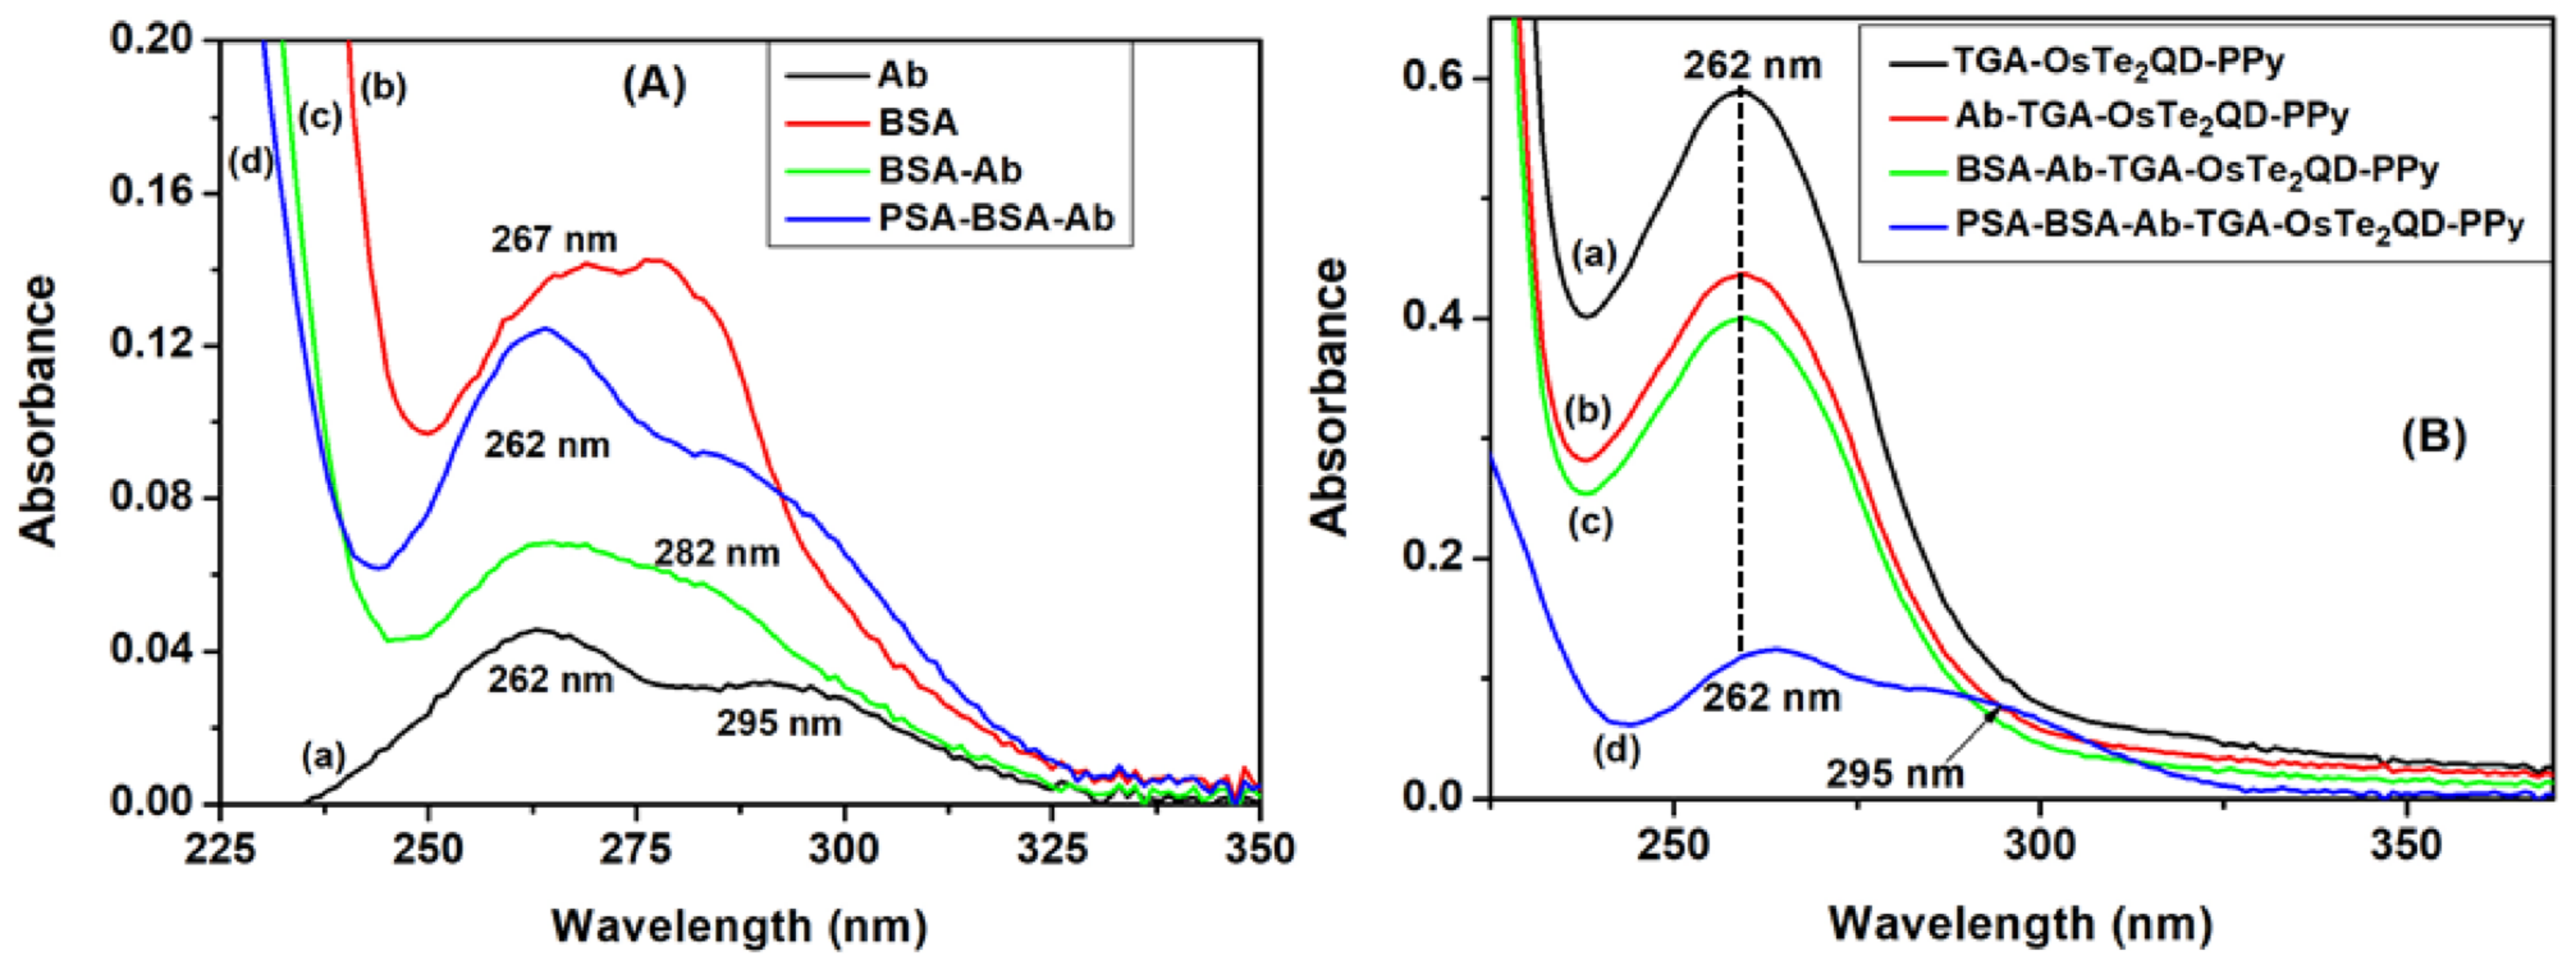
3.4.1. Analysis of Biosensor Platform

Herein, antibody (Ab) exhibited two absorbance bands at 262 nm and 295 nm at a relatively low absorbance value due to quenching effect as shown in Figure 5A line (a). The presented spectral absorbance bands results from amino acid residues, particularly tryptophan (Trp, 295 nm), tyrosine (Tyr, 295 nm) and phenylalanine (Phe, 262 nm) [42]. The absorbance band at 262 nm is ascribed to π-π* and n-π* electronic transitions of aromatic heterocycle in Phe [43]. On the other hand, the disulfide bond of Trp residue (cystine) is responsible for the absorbance band at 295 nm [44]. It was noticed that BSA (Figure 5A, line (b)) showed a special broad absorbance band at 267 nm with high absorbance intensity value of 0.15. This band is ascribed to π-π* transitions of some aromatic amino acids of BSA [45]. Noteworthy, a solution containing a mixture of BSA and antibody resulted in a slight increase of antibody absorbance intensity as illustrated in Figure 5A line (c). Lastly, Figure 5A line (d) shows the presence of PSA in a solution mixture of BSA and antibody which caused an increase in the absorbance band at 262 nm. The increase is caused by interactions among charged amino groups (NH2) of PSA and amino acids arising from BSA-Ab [46].
The antibody has a quenching effect on the material which reduces the absorbance intensity when attached to the nanocomposite, as is evident from the UV-Vis spectra of antibody alone which has the lowest absorbance behavior (Figure 5A, line (a)). A similar response was observed when antibodies (Ab) were added to the solution containing a mixture of TGA-QsTe2QD-PPy, which resulted in a decrease of absorbance band at 262 nm (Figure 5B, line (b)). This decrease is attributed to the covalent bonding interaction between the carboxylic group (COOH-) of TGA-OsTe2QD and amino group (NH2) of the antibody [47]. Figure 5B shows sequential addition of (c) BSA and (d) PSA in a solution mixture containing Ab-TGA-OsTe2QD-PPy which leads to a gradual decrease in the absorbance band at 262 nm due to further quenching of biomolecules. The addition of PSA in the solution mixture of BSA-Ab-TGA-OsTe2QD-PPy reveals two small and broad peaks at 262 nm and 295 nm. The results are comparable to the absorbance spectra of PPy solution where the monomer shows an exact behavior due π-π* interaction of polypyrrole aromatic ring (Figure 2A, line (a)).

3.4.2. Electrochemistry of the Immunosensor Platform

Electrochemical deposition is a convenient method for electrpolymerization of PPy thin films on the electrode surface [48]. This method provides a better way of synthesizing PPy films and is able to monitor the properties including thickness and surface topography that can be easily controlled by the electrochemical polymerization conditions (e.g., electrode potential, current density, and electrolyte solutions). The crucial parameters of a thin film are its film thickness and topography, and electrochemical deposition holds a good control over it. These could be easily modified by altering the polymerization conditions, such as the number of cyclic scans, electrode potential and concentration of electrolyte solutions [49]. Figure 6A shows the electrosynthesis process of 0.1 M pyrrole (PPy) monomer in 0.1 M lithium perchlorate (LiClO4) using cyclic voltammetry within a potential range of −1 and 1 V at a scan rate of 20 mV/s for 30 cycles. The growth of polypyrrole films on the electrode surface was measured by monitoring the increase in current waves. As can be seen, the oxidation peak observed at 0.21 V was due to the neutral species of PPy that is oxidized to PPy+ [50]. During the reduction process, one reduction peak was observed at 0.01 V due to the cationic species of PPy+ being reduced back to its original form (PPy).
Figure 6B shows CV measurements comparing the characteristic features of (a) GCE, (b) TGA-OsTe2QD|PPy|GCE, (c) Ab|TGA-OsTe2QD|PPy|GCE, (d) BSA|Ab|TGA-OsTe2QD|PPy|GCE and (e) PSA-BSA|Ab|TGA-OsTe2QD|PPy|GCE at a potential window of −1 to 1 V in 0.1 M PBS, pH 7. As can be seen, the presence of the TGA-OsTe2QD (curve b) on the PPy|GCE modified electrode resulted in an increase in current response. Two prominent oxidation peaks at −0.51 V and 0.1 V as well as one reduction peak at −0.52 V are observed for (c) Ab|TGA-OsTe2QD|PPy|GCE (curve c). The peaks are assigned to the interactions between carboxylic and amino groups from TGA capped QDs and antibody. [51]. Such an enhancement is associated with an enhanced electron transfer from the electrode to buffer solution. On the other hand, electroactive charged TGA-OsTe2QD|PPy|GCE surface serves as a good environment for antibody immobilization. This indeed improves PSA sensing limitations [52]. Furthermore, the electrochemical current response for the BSA|Ab|TGA-OsTe2QD|PPy|GCE (curve d) decreased. At this point, a hinderance in in charge transfer is expected due to the insulating characteristics of BSA. This confirms that BSA is effectively immobilized on electrode surface blocking most non-binding sites. The blockage results in less available electroactive surface which evidently decreases the current magnitude [53]. The PSA-BSA|Ab|TGA-OsTe2QD|PPy|GCE for 10 ng/mL PSA (curve e) showed a decrease in current due to hindrance in electron transfer as a result of the capture of the PSA by its antibody. It is important to note that the capture promoted a slight shift of the reduction peak due to the immunosensor surface modification [54].

3.4.3. Electrochemical Responses for PSA

For an efficient electrochemical detection of PSA, important experimental parameters were optimized such as the incubation time and appropriate concentration of antibody incubation on the surface of TGA-OsTe2QD|PPy|GCE. Firstly, the incubation time was varied to optimize the time period essential for the best response. Four sets of electrodes were fabricated with TGA-OsTe2QD|PPy|GCE and subsequently incubated with 5 µL of 20 µg/mL Ab for 3, 6, 9, 15 and 24 h. As can be seen in Figure 7A, the current increases with increasing incubation time from 2 to 9 h, and thereafter starts decreasing at 15 and 24 h. The highest current response was obtained at 6 h, and hence was selected as an optimum time for antibody (Ab) incubation. The influence of increasing the concentration of the antibody was studied from 1 ng/mL Ab to 100 ng/mL Ab. It is evident from Figure 7B that 10 ng/mL Ab exhibited the maximum current response, and this concentration was employed for further analysis.
The interaction of analyte with antibodies causes immunoreactions at the electrode surface. These reactions cause alternation in the current response [53]. Figure 7C shows the CV responses of the immunosensor electrode (BSA|Ab|TGA-OsTe2QD|PPy|GCE) in the presence of PSA concentrations. The presence of PSA resulted in a decrease in the cyclic voltammetric cathodic peak currents, as shown in Figure 7C for 10–16 ng/mL PSA. This decrease is ascribed to the interaction between the antigen and antibody which confirms the successful immuno-complex formation. The immuno-complex results in electron transfer hindrance to the electrode due to the insulating behavior of PSA. Figure 7D is the BSA|Ab|TGA-OsTe2QD|PPy|GCE immunosensor’s calibration plot, which gave a linear dependence of the decrease in the cathodic peak current (taken at − 0.52 V of the CVs in Figure 7C) with increase in PSA concentration. A limit of detection (LOD) value of 0.36 ng/mL and a linear range (LR) value of 0–15 ng/mL, respectively, were calculated for the PSA concentrations studied. The linear regression analysis of the calibration plot in Figure 7D gave a R2 value of 99.9% and a sensor sensitivity value of 2.56 ± 0.11 µA/(ng/mL).
Jonoush et al., 2019 [55], reported an LOD value of 1.4 ng/mL for PSA immunosensor based on GO/AuNPs composite as a platform. Thus, the immunosensor’s LOD value was four orders of magnitudes higher than what was obtained for the PSA immunosensor developed in this current work. Table 2 represents other PSA based immunosensors, which implies that the immunosensor reported in this study is very sensitive.

4. Conclusions

We designed a novel nanocomposite film composed of TGA-OsTe2QD-PPy on a glassy carbon electrode. The film is designed to construct an electrochemical immunosensor for a rapid and sensitive detection of PSA. The proposed nanocomposite exhibited high current response. Its stable response and an advantage of being biocompatible makes the film well competent for electrochemical immunosensors. The proposed immunosensor integrates the advantages of sensitive electrochemical detection and specific immunoreaction with nanoparticle amplification technique, which could provide a promising tool for PSA detection. The BSA|Ab|TGA-OsTe2QD-PPy immunosensor exhibits improved sensing characteristics such as a linear range of 0–15 ng/mL (i.e., the concentration range studied was linear) and the limit of detection value of 0.36 ng/mL. The linear range and the limit of detection values of the immunosensor cover the physiologically relevant PSA levels (0–14 ng/mL) [60] for ascertaining prostate cancer related health conditions. The immunosensor was constructed with a highly selective anti-PSA antibody, which was shown in previous work [61] not to exhibit false positive signal in the presence of other proteins (i.e., interferences), such as alpha fetal protein (AFP), carcinoembryonic antigen (CEA), human chorionic gonadotropin (HCG), immunoglobulin G (IgG) and thrombin.

Author Contributions

R.G., investigation, writing-original draft preparation. U.F., data curation, validation, writing-reviewing and editing. E.I., was responsible for project administration, writing-reviewing and editing. All authors have read and agreed to the published version of the manuscript.

Funding

This research was funded by the National Research Foundation (NRF) of South Africa, Grant number 85102.

Institutional Review Board Statement

Not applicable.

Informed Consent Statement

Not applicable.

Data Availability Statement

The data presented in this study are available on request from the corresponding author. The data are not publicly available due to privacy restriction.

Conflicts of Interest

The authors declare no conflict of interest.

References

  1. Quintero-Jaime, A.F.; Berenguer-Murcia, Á.; Cazorla-Amorós, D.; Morallón, E. Carbon nanotubes modified with Au for electrochemical detection of prostate specific antigen: Effect of Au nanoparticle size distribution. Front. Chem. 2019, 7, 1–12. [Google Scholar] [CrossRef] [PubMed] [Green Version]
  2. Lin, Y.Y.; Wang, J.; Liu, G.; Wu, H.; Wai, C.M.; Lin, Y. A nanoparticle label/immunochromatographic electrochemical biosensor for rapid and sensitive detection of prostate-specific antigen. Biosens. Bioelectron. 2008, 23, 1659–1665. [Google Scholar] [CrossRef]
  3. Kanyong, P.; Rawlinson, S.; Davis, J. Immunochemical assays and nucleic-acid detection techniques for clinical diagnosis of prostate cancer. J. Cancer 2016, 7, 523–531. [Google Scholar] [CrossRef] [PubMed] [Green Version]
  4. Kang, B.J.; Jeun, M.; Jang, G.H.; Song, S.H.; Jeong, I.G.; Kim, C.S.; Searson, P.C.; Lee, K.H. Diagnosis of prostate cancer via nanotechnological approach. Int. J. Nanomed. 2015, 10, 6555–6569. [Google Scholar] [CrossRef] [Green Version]
  5. Schröder, F.H.; van der Maas, P.; Beemsterboer, P.; Kruger, A.B.; Hoedemaeker, R.; Rietbergen, J.; Kranse, R. Evaluation of the digital rectal examination as a screening test for prostate cancer. J. Natl. Cancer Inst. 1998, 90, 1817–1823. [Google Scholar] [CrossRef] [PubMed] [Green Version]
  6. Sharma, S. Imaging and intervention in prostate cancer: Current perspectives and future trends. Indian J. Radiol. Imaging 2014, 24, 139–148. [Google Scholar] [CrossRef]
  7. Li, J.; Guan, X.; Fan, Z.; Ching, L.M.; Li, Y.; Wang, X.; Cao, W.M.; Liu, D.X. Non-invasive biomarkers for early detection of breast cancer. Cancers 2020, 12, 2767. [Google Scholar] [CrossRef]
  8. Prensner, J.R.; Rubin, M.A.; Wei, J.T.; Chinnaiyan, A.M. Beyond PSA: The next generation of prostate cancer biomarkers. Sci. Transl. Med. 2012, 4, 127rv3. [Google Scholar] [CrossRef] [Green Version]
  9. Nayak, S.; Blumenfeld, N.R.; Laksanasopin, T.; Sia, S.K. POC Diagnostics: Recent Devs in a Connected Age. Physiol. Behav. 2018, 176, 139–148. [Google Scholar] [CrossRef]
  10. Cui, F.; Zhou, Z.; Zhou, H.S. Review—Measurement and Analysis of Cancer Biomarkers Based on Electrochemical Biosensors. J. Electrochem. Soc. 2020, 167, 037525. [Google Scholar] [CrossRef]
  11. Bilkey, G.A.; Burns, B.L.; Coles, E.P.; Bowman, F.L.; Beilby, J.P.; Pachter, N.S.; Baynam, G.; Hugh, H.J.; Nowak, K.J.; Weeramanthri, T.S. Genomic testing for human health and disease across the life cycle: Applications and ethical, legal, and social challenges. Front. Public Health 2019, 7, 1–11. [Google Scholar] [CrossRef] [PubMed]
  12. Zheng, Y.; Li, J.; Zhou, B.; Ian, H.; Shao, H. Advanced sensitivity amplification strategies for voltammetric immunosensors of tumor marker: State of the art. Biosens. Bioelectron. 2021, 178, 113021. [Google Scholar] [CrossRef]
  13. Baig, N.; Kammakakam, I.; Falath, W. Nanomaterials: A review of synthesis methods, properties, recent progress, and challenges. Mater. Adv. 2021, 2, 1821–1871. [Google Scholar] [CrossRef]
  14. Cavalcante, F.T.T.; Falcão, I.R.d.A.; Souza, J.E.d.S.; Rocha, T.G.; de Sousa, I.G.; Cavalcante, A.L.G.; de Oliveira, A.L.B.; de Sousa, M.C.M.; Santos, J.C.S.d. Designing of Nanomaterials-Based Enzymatic Biosensors: Synthesis, Properties, and Applications. Electrochem 2021, 2, 149–184. [Google Scholar] [CrossRef]
  15. Adeyoju, O.; Iwuoha, E.I.; Smyth, M.R. Reactivities of amperometric organic phase peroxidase-modified electrodes in the presence and absence of thiourea and ethylenethiourea as inhibitors. Anal. Chim. Acta 1995, 305, 57–64. [Google Scholar] [CrossRef]
  16. El-Said, W.A.; Abdelshakour, M.; Choi, J.H.; Choi, J.W. Application of conducting polymer nanostructures to electrochemical biosensors. Molecules 2020, 25, 307. [Google Scholar] [CrossRef] [Green Version]
  17. Ramanavicius, S.; Ramanavicius, A. Conducting polymers in the design of biosensors and biofuel cells. Polymers 2021, 13, 49. [Google Scholar] [CrossRef] [PubMed]
  18. Gómez, I.J.; Sulleiro, M.V.; Mantione, D.; Alegret, N. Carbon nanomaterials embedded in conductive polymers: A state of the art. Polymers 2021, 13, 745. [Google Scholar] [CrossRef]
  19. Cheng, Y.; Da Ling, S.; Geng, Y.; Wang, Y.; Xu, J. Microfluidic synthesis of quantum dots and their applications in bio-sensing and bio-imaging. Nanoscale Adv. 2021, 3, 2180–2195. [Google Scholar] [CrossRef]
  20. Shrikrushna, S.; Kher, J.A.; Kulkarni, M.V. Influence of Dodecylbenzene Sulfonic Acid Doping on Structural, Morphological, Electrical and Optical Properties on Polypyrrole/3C-SiC Nanocomposites. J. Nanomed. Nanotechnol. 2015, 6, 1–6. [Google Scholar] [CrossRef] [Green Version]
  21. Attar, A.R.; Blumling, D.E.; Knappenberger, K.L. Photodissociation of thioglycolic acid studied by femtosecond time-resolved transient absorption spectroscopy. J. Chem. Phys. 2011, 134, 024514. [Google Scholar] [CrossRef]
  22. Anantharaj, S.; Nithiyanantham, U.; Ede, S.R.; Ayyappan, E.; Kundu, S. π-stacking intercalation and reductant assisted stabilization of osmium organosol for catalysis and SERS applications. RSC Adv. 2015, 5, 11850–11860. [Google Scholar] [CrossRef]
  23. Strabler, C.M.; Sinn, S.; Pehn, R.; Pann, J.; Dutzler, J.; Viertl, W.; Prock, J.; Ehrmann, K.; Weninger, A.; Kopacka, H.; et al. Stabilisation effects of phosphane ligands in the homogeneous approach of sunlight induced hydrogen production. Faraday Discuss. 2017, 198, 211–233. [Google Scholar] [CrossRef]
  24. Ramanavicius, A.; Karabanovas, V.; Ramanaviciene, A.; Rotomskis, R. Stabilization of (CdSe)ZnS quantum dots with polypyrrole formed by UV/VIS irradiationinitiated polymerization. J. Nanosci. Nanotechnol. 2009, 9, 1909–1915. [Google Scholar] [CrossRef] [PubMed]
  25. Ali, A.A.; Elmahdy, M.M.; Sarhan, A.; Abdel Hamid, M.I.; Ahmed, M.T. Structure and dynamics of polypyrrole/chitosan nanocomposites. Polym. Int. 2018, 67, 1615–1628. [Google Scholar] [CrossRef]
  26. Zogg, H.; Arnold, M.; Felder, F.; Rahim, M.; Fill, M.; Boye, D. Epitaxial lead-chalcogenides on Si and BaF2 for mid-IR detectors and emitters including cavities. In Proceedings of the SPIE 7082, Infrared Spaceborne Remote Sensing and Instrumentation XVI, 70820H, San Diego, CA, USA, 10–14 August 2008. [Google Scholar] [CrossRef]
  27. Dutta, K. Green synthesis and transport properties of ZnS-PPy hybrid nanocomposites. Int. J. Sci. Eng. Res. 2018, 9, 249–264. [Google Scholar]
  28. Kaur Sidhu, G.; Kumar, R. Study the Structural and Optical behaviour of Conducting Polymer based nanocomposites: ZrO2-Polypyrrole Nanocomposites. In IOP Conference Series: Materials Science and Engineering, Proceedings of the Second International Conference on Materials Science and Technology (ICMST 2016), Kerala, India, 5–8 June 2016; IOP Publishing, Ltd.: Bristol, UK, 2018; Volume 360. [Google Scholar] [CrossRef]
  29. Gholamrezaei, S.; Salavati-Niasari, M.; Ghanbari, D.; Bagheri, S. Hydrothermal preparation of silver telluride nanostructures and photo-catalytic investigation in degradation of toxic dyes. Sci. Rep. 2016, 6, 20060. [Google Scholar] [CrossRef] [PubMed] [Green Version]
  30. Singh, K.J.; Ahmed, T.; Gautam, P.; Sadhu, A.; Lien, D.-H.; Chen, S.-C.; Chueh, Y.-L.; Kuo, H.-C. Recent Advances in Two-Dimensional Quantum Dots and Their Applications. Nanomaterials 2021, 11, 1549. [Google Scholar] [CrossRef]
  31. Sadrolhosseini, A.R.; Rashid, S.A.; Noor, A.S.M.; Kharazmi, A.; Lim, H.N.; Mahdi, M.A. Optical Band Gap and Thermal Diffusivity of Polypyrrole-Nanoparticles Decorated Reduced Graphene Oxide Nanocomposite Layer. J. Nanomater. 2016, 2016, 1949042. [Google Scholar] [CrossRef]
  32. Guerrero-Gonzalez, R.; Orona, F.A.; Saucedo-Flores, E.; Ruelas, R.; Pelayo-Ceja, J.E.; Lopez-Delgado, R.; Cordova-Rubio, A.; Álvarez-Ramos, M.E.; Ayon, A. Synthesis of Si and CdTe quantum dots and their combined use as down-shifting photoluminescent centers in Si solar cells. Mater. Renew. Sustain. Energy 2019, 8, 14. [Google Scholar] [CrossRef] [Green Version]
  33. Gaponik, N.P.; Talapin, D.V.; Rogach, A.L.; Eychmuller, A. Electrochemical synthesis of CdTe nanocrystal/polypyrrole composites for optoelectronic applications. J. Mater. Chem. 2000, 10, 2163–2166. [Google Scholar] [CrossRef]
  34. Ruppert, C.; Aslan, O.B.; Heinz, T.F. Optical Properties and Band Gap of Single- and Few-Layer MoTe2 Crystals. Nano Lett. 2014, 14, 6231–6236. [Google Scholar] [CrossRef] [PubMed]
  35. Abdi, M.M.; Ekramul Mahmud, H.N.M.; Abdullah, L.C.; Kassim, A.; Rahman, M.Z.A.; Chyi, J.L.Y. Optical band gap and conductivity measurements of polypyrrole-chitosan composite thin films. Chin. J. Polym. Sci. 2012, 30, 93–100. [Google Scholar] [CrossRef]
  36. Feleni, U.; Sidwaba, U.; Makelane, H.; Iwuoha, E. Core–Shell Palladium Telluride Quantum Biosensor for Detecting Indinavir Drug. J. Nanosci. Nanotechnol. 2019, 19, 7974–7981. [Google Scholar] [CrossRef]
  37. Bilibana, M.P.; Feleni, U.; Williams, A.R.; Iwuoha, E. Impedimetric microcystin-LR aptasensor prepared with sulfonated poly(2,5-dimethoxyaniline)–silver nanocomposite. Processes 2021, 9, 179. [Google Scholar] [CrossRef]
  38. Oh, J.; Lee, J.S.; Jang, J. Ruthenium decorated polypyrrole nanoparticles for highly sensitive hydrogen gas sensors using component ratio and protonation control. Polymers 2020, 12, 1427. [Google Scholar] [CrossRef]
  39. Pacoste, L.C.; Jijana, A.N.; Feleni, U.; Iwuoha, E. Mercaptoalkanoic Acid-Induced Band Gap Attenuation of Copper Selenide Quantum Dot. ChemistrySelect 2020, 5, 4994–5005. [Google Scholar] [CrossRef]
  40. Maruthamuthu, S.; Chandrasekaran, J.; Manoharan, D.; Magesh, R. Conductivity and dielectric analysis of Nanocolloidal polypyrrole particles functionalized with Higher weight percentage of poly(styrene sulfonate) using the dispersion polymerization method. J. Polym. Eng. 2017, 37, 481–492. [Google Scholar] [CrossRef]
  41. Memela, M.; Feleni, U.; Mdluli, S.; Ramoroka, M.E.; Ekwere, P.; Douman, S.; Iwuoha, E. Electro-photovoltaics of Polymer-stabilized Copper–Indium Selenide Quantum Dot. Electroanalysis 2020, 32, 3086–3097. [Google Scholar] [CrossRef]
  42. Antosiewicz, J.M.; Shugar, D. UV–Vis spectroscopy of tyrosine side-groups in studies of protein structure. Part 2: Selected applications. Biophys. Rev. 2016, 8, 163–177. [Google Scholar] [CrossRef] [Green Version]
  43. Antosiewicz, J.M.; Shugar, D. UV–Vis spectroscopy of tyrosine side-groups in studies of protein structure. Part 1: Basic principles and properties of tyrosine chromophore. Biophys. Rev. 2016, 8, 151–161. [Google Scholar] [CrossRef] [Green Version]
  44. Bertozo, L.d.C.; Neto, E.T.; de Oliveira, L.C.; Ximenes, V.F. Oxidative alteration of Trp-214 and Lys-199 in human serum albumin increases binding affinity with phenylbutazone: A combined experimental and computational investigation. Int. J. Mol. Sci. 2018, 19, 2868. [Google Scholar] [CrossRef] [Green Version]
  45. Cao, X.; He, Y.; Liu, D.; He, Y.; Hou, X.; Cheng, Y.; Liu, J. Characterization of interaction between scoparone and bovine serum albumin: Spectroscopic and molecular docking methods. RSC Adv. 2018, 8, 25519–25525. [Google Scholar] [CrossRef] [Green Version]
  46. Farschi, F.; Saadati, A.; Hasanzadeh, M. A novel immunosensor for the monitoring of PSA using binding of biotinylated antibody to the prostate specific antigen based on nano-ink modified flexible paper substrate: Efficient method for diagnosis of cancer using biosensing technology. Heliyon 2020, 6, e04327. [Google Scholar] [CrossRef]
  47. Hayashi, M.; Tournilhac, F. Thermal stability enhancement of hydrogen bonded semicrystalline thermoplastics achieved by combination of aramide chemistry and supramolecular chemistry. Polym. Chem. 2017, 8, 461–471. [Google Scholar] [CrossRef]
  48. Hefnawy, A.; Mostafa, D.; Ebrahim, S.; Soliman, M. Micro composite multi structural formable steel: Optimization of electrodeposition parameters and anti-corrosion properties of polypyrrole coatings. Biointerface Res. Appl. Chem. 2021, 11, 13402–13411. [Google Scholar] [CrossRef]
  49. Kim, S.; Jang, L.K.; Park, H.S.; Lee, J.Y. Electrochemical deposition of conductive and adhesive polypyrrole-dopamine films. Sci. Rep. 2016, 6, 30475. [Google Scholar] [CrossRef] [PubMed] [Green Version]
  50. Hess, E.H.; Waryo, T.; Sadik, O.A.; Iwuoha, E.I.; Baker, P.G.L. Constitution of novel polyamic acid/polypyrrole composite films by in-situ electropolymerization. Electrochim. Acta 2014, 128, 439–447. [Google Scholar] [CrossRef]
  51. Muñoz, R.; Santos, E.M.; Galan-Vidal, C.A.; Miranda, J.M.; Lopez-Santamarina, A.; Rodriguez, J.A. Ternary quantum dots in chemical analysis. Synthesis and detection mechanisms. Molecules 2021, 26, 2764. [Google Scholar] [CrossRef]
  52. Popov, A.; Brasiunas, B.; Kausaite-Minkstimiene, A.; Ramanaviciene, A. Metal nanoparticle and quantum dot tags for signal amplification in electrochemical immunosensors for biomarker detection. Chemosensors 2021, 9, 85. [Google Scholar] [CrossRef]
  53. Upan, J.; Youngvises, N.; Tuantranont, A.; Karuwan, C.; Banet, P.; Aubert, P.H.; Jakmunee, J. A simple label-free electrochemical sensor for sensitive detection of alpha-fetoprotein based on specific aptamer immobilized platinum nanoparticles/carboxylated-graphene oxide. Sci. Rep. 2021, 11, 13969. [Google Scholar] [CrossRef]
  54. Oliveira, N.; Costa-Rama, E.; Viswanathan, S.; Delerue-Matos, C.; Pereira, L.; Morais, S. Label-free Voltammetric Immunosensor for Prostate Specific Antigen Detection. Electroanalysis 2018, 30, 2604–2611. [Google Scholar] [CrossRef]
  55. Jonous Akbari, Z.; Shayeh, J.S.; Yazdian, F.; Yadegari, A.; Hashemi, M.; Omidi, M. An electrochemical biosensor for prostate cancer biomarker detection using graphene oxide–gold nanostructures. Eng. Life Sci. 2019, 19, 206–216. [Google Scholar] [CrossRef] [PubMed] [Green Version]
  56. Chu, Y.; Wang, H.; Ma, H.; Wu, D.; Du, B.; Wei, Q. Sandwich-type electrochemical immunosensor for ultrasensitive detection of prostate-specific antigen using palladium-doped cuprous oxide nanoparticles. RSC Adv. 2016, 6, 84698–84704. [Google Scholar] [CrossRef]
  57. Wu, D.; Liu, Y.; Wang, Y.; Hu, L.; Ma, H.; Wang, G.; Wei, Q. Label-free Electrochemiluminescent Immunosensor for Detection of Prostate Specific Antigen based on Aminated Graphene Quantum Dots and Carboxyl Graphene Quantum Dots. Sci. Rep. 2016, 6, 20511. [Google Scholar] [CrossRef] [PubMed] [Green Version]
  58. Dey, A.; Kaushik, A.; Arya, S.K.; Bhansali, S. Mediator free highly sensitive polyaniline-gold hybrid nanocomposite based immunosensor for prostate-specific antigen (PSA) detection. J. Mater. Chem. 2012, 22, 14763–14772. [Google Scholar] [CrossRef]
  59. Rafique, S.; Bin, W.; Bhatti, A.S. Electrochemical immunosensor for prostate-specific antigens using a label-free second antibody based on silica nanoparticles and polymer brush. Bioelectrochemistry 2015, 101, 75–83. [Google Scholar] [CrossRef]
  60. Mandal, N.; Pakira, V.; Samanta, N.; Das, N.; Chakraborty, S.; Pramanick, B.; RoyChaudhuri, C. PSA detection using label free graphene FET with coplanar electrodes based microfluidic point of care diagnostic device. Talanta 2021, 222, 121581. [Google Scholar] [CrossRef] [PubMed]
  61. Liu, S.; Huo, Y.; Bai, J.; Ning, B.; Peng, Y.; Li, S.; Han, D.; Kang, W.; Gao, Z. Rapid and sensitive detection of prostate-specific antigen via label-free frequency shift Raman of sensing graphene. Biosens. Bioelectron. 2020, 158, 112184. [Google Scholar] [CrossRef]
Figure 1. Schematic representation of electrochemical immunosensor.
Processes 09 02203 g001
Figure 2. UV-Vis spectra and Tauc plot (A,B1B4) of (a) PPy, (b) TGA-OsTe2QD and (c) TGA-OsTe2QD-PPy in a wavelength range of 200–500 nm.
Processes 09 02203 g002
Figure 3. (A,B) SAXS free model PDDF and size distribution weighted by number for (a) PPy, (b) TGA-OsTe2QD and (c) TGA-OsTe2QD-PPy.
Processes 09 02203 g003
Figure 4. HR-TEM micrographs of (A) PPy, (C) TGA-OsTe2QD and (E) TGA-OsTe2QD-PPy at 200 nm and 5 nm scale view. (B,D,F) show statistical size distribution histograms of PPy, TGA-OsTe2QD, and TGA-OsTe2QD-PPy, respectively.
Processes 09 02203 g004
Figure 5. Optical signatures of (A): (a) Ab, (b) BSA, (c) BSA-Ab and (d) PSA-BSA-Ab. (B) UV-Vis spectrophotometer of (a) TGA-OsTe2QD-PPy, (b) Ab-TGA-OsTe2QD-PPy, (c) BSA-Ab-TGA-OsTe2QD-PPy and (d) PSA-BSA-Ab-TGA-OsTe2QD-PPy in 0.1 M PBS, pH 7.
Processes 09 02203 g005
Figure 6. (A) Electrosynthesis of pyrrole monomer in 0.1 M LiOCl4 solution at a potential window of −1 to 1 V at a scan rate of 20 mV/s for 30 cycles. (B) CV measurements of immunosensor platform where curve a represents GCE, curve b TGA-OsTe2QD|PPy|GCE, curve c Ab|TGA-OsTe2QD|PPy, curve d BSA|Ab|TGA-OsTe2QD|PPy|GCE and curve e PSA|BSA|Ab|TGA-OsTe2QD|PPy|GCE (for 10 ng/mL PSA) in 0.1 M PBS at 20 mV/s in the potential window of −1 to 1 V.
Processes 09 02203 g006
Figure 7. (A) Incubation time responses (i.e., CV cathodic peak currents at 20 mV/s) for the formation of Ab|TGA-OsTe2QD|PPy|GCE immunosensor electrode with 5 µL of 20 µg/mL Ab in 0.1 M PBS pH 7. (B) Ab concentration dependence of the Ab|TGA-OsTe2QD|PPy|GCE immunosensor electrode responses (i.e., CV cathodic peak currents at 20 mV/s) for 1–100 ng/mL Ab and 6 h incubation time in 0.1 M PBS pH 7. (C) CV responses of the PSA immunosensor at 20 mV/s, in 0.1 M PBS pH 7. (D) Linear calibration of the PSA immunosensor (i.e., BSA|Ab|TGA-OsTe2QD|PPy|GCE) plotted with peak current values obtained from (C) at −0.52 V (standard errors of triplicate experiments are represented by error bars).
Processes 09 02203 g007
Table 1. Energy band gap values of metal telluride chalcogenides and metal–polymer composites.
Metal Telluride
Chalcogenides
Band Gap
Energy (eV)
ReferenceMetal–Polymer CompositesBand Gap
Energy (eV)
Reference
PbEuTe
PbSrTe
4.5
4.7
[26]ZnS-PPy4.26–4.7[27]
Ag2Te3.64[29]ZrO2-PPy5.07[28]
WTe20.2[30]NPs/rGO-PPy3.58–3.85[31]
CdTe2.15–2.28[32]CdTe-PPy1.45[33]
MoTe21.15[34]CHI-PPY1.30–2.32[35]
OsTe24.5This workOsTe2-PPy4.4 and 5.4This work
Table 2. Comparison of the proposed method with already reported immunosensor for PSA.
Electrode MaterialsDetection MethodLinear Range (ng/mL)Limit of Detection (ng/mL)Ref.
Pd@Cu2O NPsEIS10−5–1 × 1022 × 10−6[56]
Au/Ag-rGO/Animated-GQD/Carboxyl-GQDsECL1 × 10−3–102.9 × 10⁻⁴[57]
AuNP-PANI/AuDPV1 × 10−3–1 × 1026 × 10−4[58]
Au-NS/POEGMA-co-GMA brushEIS5 × 10−3–1 × 1032.3 × 10−3[59]
GO/AuNPsCV-1.4[55]
TGA-OsTe2QD-PPyCV0–150.36This work
Publisher’s Note: MDPI stays neutral with regard to jurisdictional claims in published maps and institutional affiliations.

