Abstract
The emission from industries and the mobility sector is under strong legal regulations in many countries worldwide. In Germany, the amendment to the 17th BlmSchV (Federal pollution control ordinance), which has been in force for waste incineration plants since 2013, has given rise to a new limit for nitrogen oxides of 150 mg/m3 as the daily mean level from 2019 on. A similar focus is on biomass-fired plants. According to the MCP (medium combustion plant) guideline of the EU, as a consequence, existing plants are required to either increase their consumption of ammonia water for nitrogen oxide reduction (SNCR process) or back fit SCR catalysts as secondary measures, which is a costly procedure. This paper presents a novel two-stage process in which an oscillating supply of secondary air allows nitrogen oxides to be reduced by approx. 50% at a good burnout level, which may obviate the need for secondary measures. Besides experimental investigations in a fixed bed reactor, CFD simulations confirm a high potential for reduction of nitrogen oxides. Together with the company POLZENITH, this process is under development for scale-up in a biomass incineration plant as a next step.
1. Introduction
Nitrogen oxides, dust, and sulfur oxides are significant contributors to smog and acid rain and thereby directly or indirectly jeopardize the living conditions for humans and animals. Hence on the part of the legislature under consideration of the Best Available Technology (BAT), the emission requirements for stationary and mobile incinerators are continuously tightened. At present this is applied for motors (EU-standard 6, update in September 2019 [1]), as well as for waste incineration plants [2] or the medium combustion plant guideline [3]. To meet the guidelines and to improve the overall efficiencies the thermal processes are continuously optimized.
This overview contribution targets to summarize the Best Available Technology for nitrogen oxides reduction by the means of primary and secondary measures including our research on the subject of oscillating combustion as an innovative approach [4,5]. Our approach combines well-known measures for nitrogen oxides reduction through the air- and fuel-staging [6] with pathways investigated in the oscillating mode of operation of natural gas firing [7] as well as in pulverized fuel boilers [4].
Nitrogen oxides (NOx) are a sum of NO and NO2. In municipal waste and biomass incinerators, NO is mainly produced (ca. 95%), while NO2 is generated after combustion during cooling of the flue gases or in the atmosphere [6].
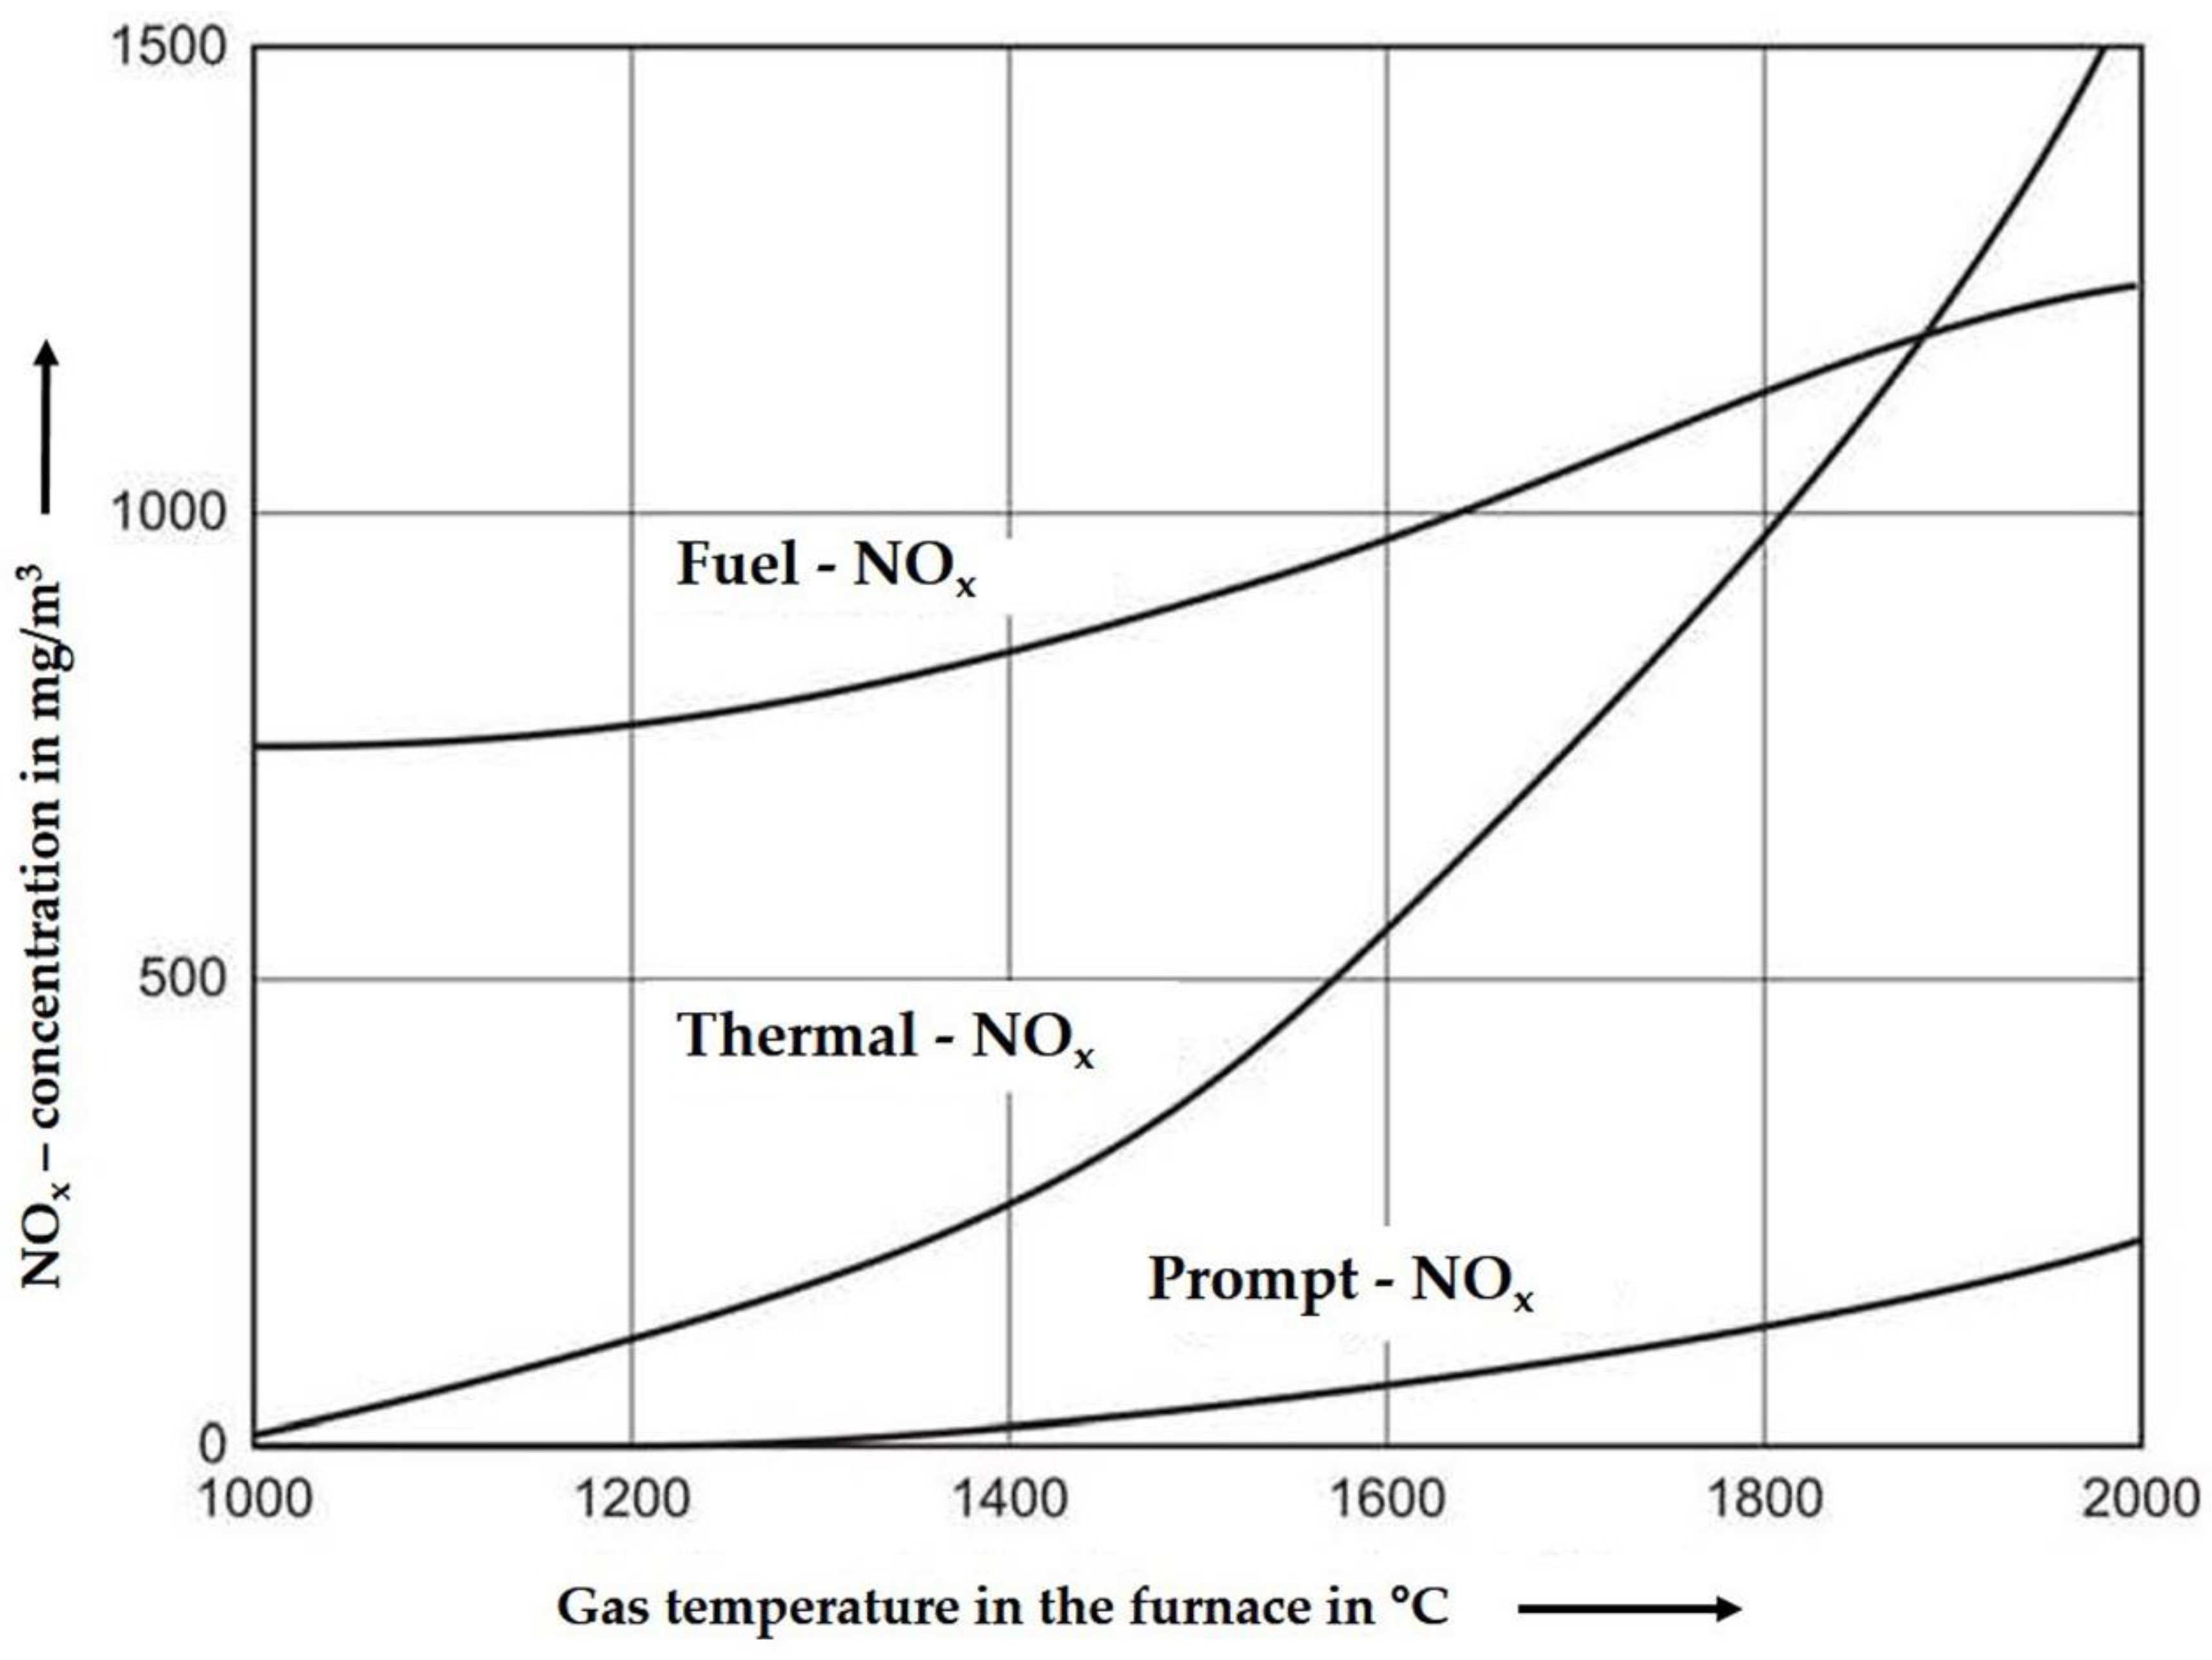
During combustion, NOx is formed along different pathways (Figure 1):
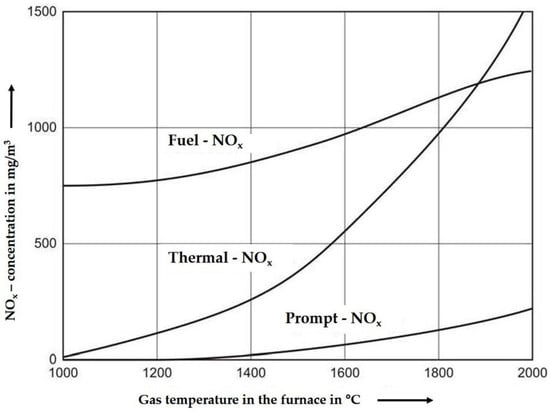
Figure 1.
Different formation paths of NOx as a function of temperature [8].
One pathway is the chemical reaction of the fuel nitrogen (organic or inorganic) with oxygen at a minimum temperature of about 800 °C (see Figure 1 “Fuel-NOx”). The so-called “Prompt-NOx” is formed under gasification conditions between fuel nitrogen and radicals of hydrocarbons, a formation that starts at higher temperatures. There is less temperature influence compared to the last pathway—the formation of “Thermal-NOx”. This kind of NOx is mainly formed at temperatures above 1300 °C with oxygen and nitrogen of the air reacting with each other. In combustion processes, these three mechanisms are coupled with each other depending on the flame temperature, stoichiometry, and residence time. The NOx formation increases with increasing air ratio and residence time. In combustors with grate and fluidized bed technologies the temperature does not exceed 1200 °C, so the formation of thermal-NOx and prompt-NOx could be neglected. The kinetics and pathways of NO formation and degradation are deepened in the MDPI paper [4], Section 2.
With the help of oscillating air addition at appropriate basic conditions, the NOx formed from the fuel nitrogen can be reduced to 50% [9] as is shown later.
2. Oscillating Combustion
The positive influence of oscillation on nitrogen oxide reduction is well known, represented e.g., in [10,11,12,13] on the primary reduction of NOx emissions from furnaces.
The basic idea of oscillating combustion is that the oxidant or the fuel flow is interrupted in time. The amplitude of the injected oxidant may also differ and influences the NOx reduction, as discussed in the numerical approach. The prerequisite for this is, that the NOx reducing agent ammonia is formed in this sub-stoichiometrically operated zone, which can reduce nitrogen oxides already formed in the fuel conversion. The oscillation frequency is the result of optimization for CO remaining in the exhaust gas and the goal of reducing NOx. More detailed information about this principle can be found in Section 2 in [4].
In previous work [11,12,13] the NOx reduction potential is investigated by an oscillating addition of a gaseous energy carrier such as natural gas. The results presented show that an oscillating addition of secondary air during the combustion of chipboard cubes in a fixed-bed reactor also leads to a significant reduction in NOx emissions. This effect was to be proven by the current work, employing a technical fuel like waste wood from furniture industries instead of the “model fuel” chipboard cubes.
3. Materials and Methods
The experimental work was executed in a fixed bed reactor for validation of the numerical simulations with CFD and LES.
3.1. Experimental Approach
The basic research was done in the lab facility, named “KLEAA” which is a German acronym for “Karlsruhe lab facility for the combustion behavior of waste”.
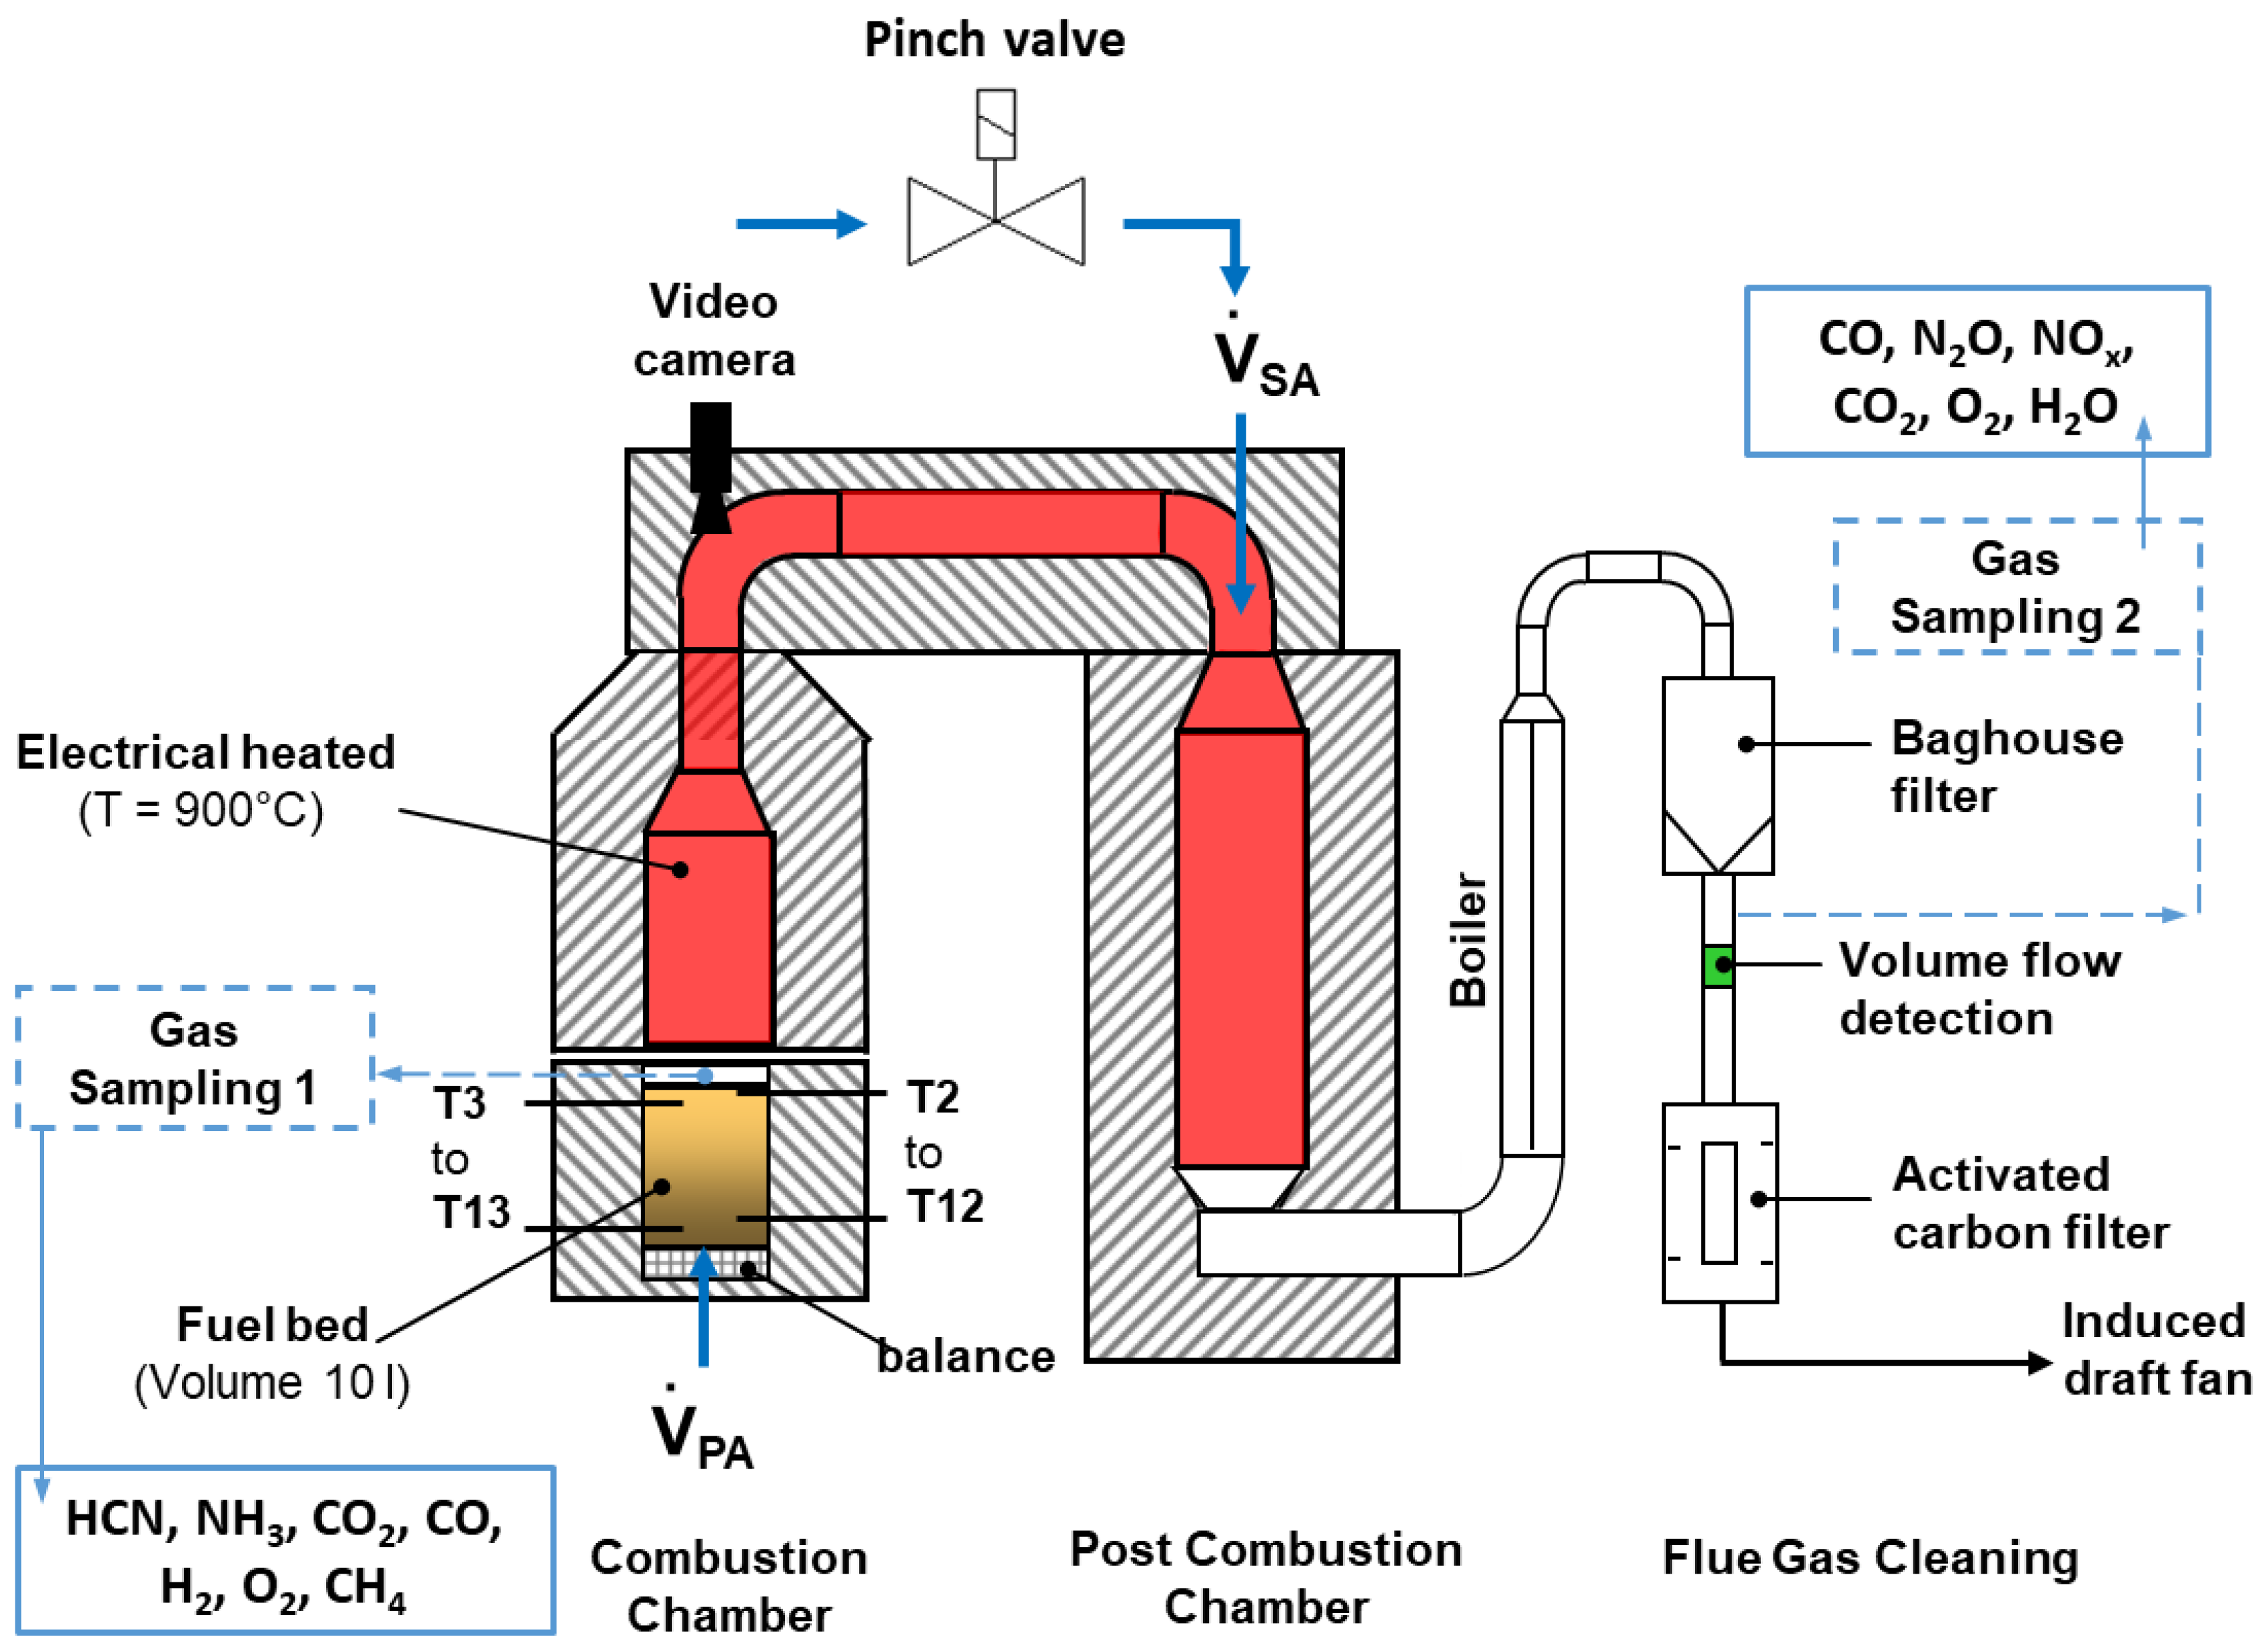
The experimental studies to characterize the combustion behavior and the influence of oscillation on nitrogen oxide reduction were carried out with waste wood from furniture industries. The waste wood contains a high level of nitrogen of approx. 4 wt.% in the as-delivered state, which makes it most suitable for these experiments. The test facility is made up mainly of the combustion chamber with the bed of material and the heated furnace (d = 220 mm, l = 990 mm), the post-combustion chamber (pcc, d = 220 mm, l = 2000 mm), and the flue gas cleaning system (heat exchanger, filter chamber, carbon adsorber, Figure 2). The volume of the fuel bed to be studied is approximately 10 L. The furnace and the pcc were heated electrically to 900 °C. Primary air is supplied from below through a sintered metal plate.
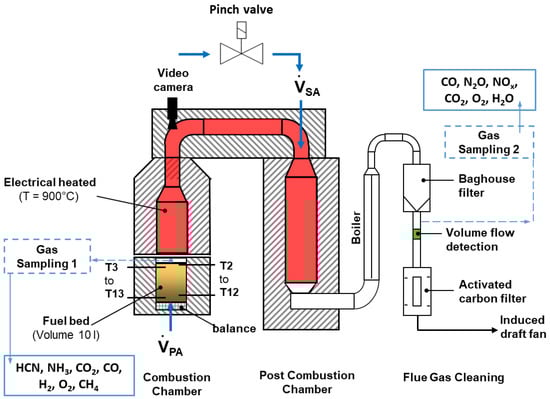
Figure 2.
Schematic design of the KLEAA fixed-bed reactor at ITC.
For the combustion experiments, the mobile lower part of the combustion chamber filled with the fuel at ambient temperature is connected airtight with the combustion chamber, and the feed of primary air is started. The fuel sample is ignited by the heat emitted via radiation from atop and burns up in an almost plane front moving downward opposite to the primary airflow.
This non-steady combustion process corresponds to the incineration of fuel on a continuously operated grate. Experimental and numerical results obtained at KLEAA, are the basis for the transfer to the technical-scale incinerator at POLZENITH. This method was already proofed for the combustion of municipal waste in KLEAA and a municipal waste incinerator [14].
For complete burnout of unburnt components, the flue gas is directed from the combustion chamber into the pcc via a connecting channel (d = 110 mm, l = 1040 mm) discharging from the combustion chamber. At the top of the post-combustion chamber, secondary air is introduced radially through two nozzles (d = 8 mm) which are arranged slightly shifted against one another. A pinch valve interrupts the airflow to obtain an oscillating combustion mode.
The concentration of flue gas species is determined at two measuring positions, one right above the fuel bed and one at the outlet of the post-combustion chamber. The temperatures are measured both in the fuel bed over the entire height of the bed and along the flue gas path.
The H2, CH4, CO2, CO, and O2 gas concentrations are extracted through a water-cooled probe above the fuel bed. HCN and NH3 concentrations are analyzed from the water condensed in the gas sampling system and the gas volume extracted. In addition, O2, H2O, CO, NOx, N2O, and CO2 are determined downstream of the post-combustion chamber at measurement position 2. Prior to the release of the flue gas into the environment, a boiler cools the flow down to 140 °C, a baghouse filter retains fly ash while an activated carbon filter adsorbs halogens, among other species.
For optical evaluation of the combustion process of the solid matter, a camera is installed approximately 2 m above the fuel bed.

Table 1.
Tests outline.
Table 2.
Fuel specifications.
All volume flows and concentrations are given in m3/h and mg/m3 refer to standard conditions in temperature and pressure.
The waste wood and the pellets are gasified in the combustion chamber with the supply of 10 m3/h, which means, that the flue gas contains unburnt components, such as CO and CH4, which must be post combusted by the means of the secondary air injection.
All experiments were performed at constant primary and variable secondary air volume flows and comparable fuel charges (approx. 2.5 kg per test for the waste wood). After the first investigations with the waste wood, the profiles of the gas species above the fuel bed indicate a transient combustion behavior, and effects of oscillating on NOx were not detected. The main reason for this is the fine particles below 2 mm in the waste wood, which have a major effect on the air distribution in the fuel and on the specific surface (kinetics, heat transfer), see Figure 3.
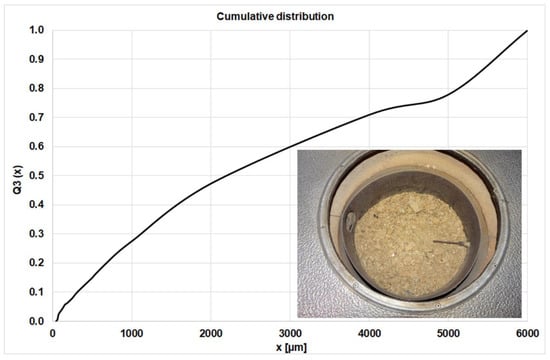
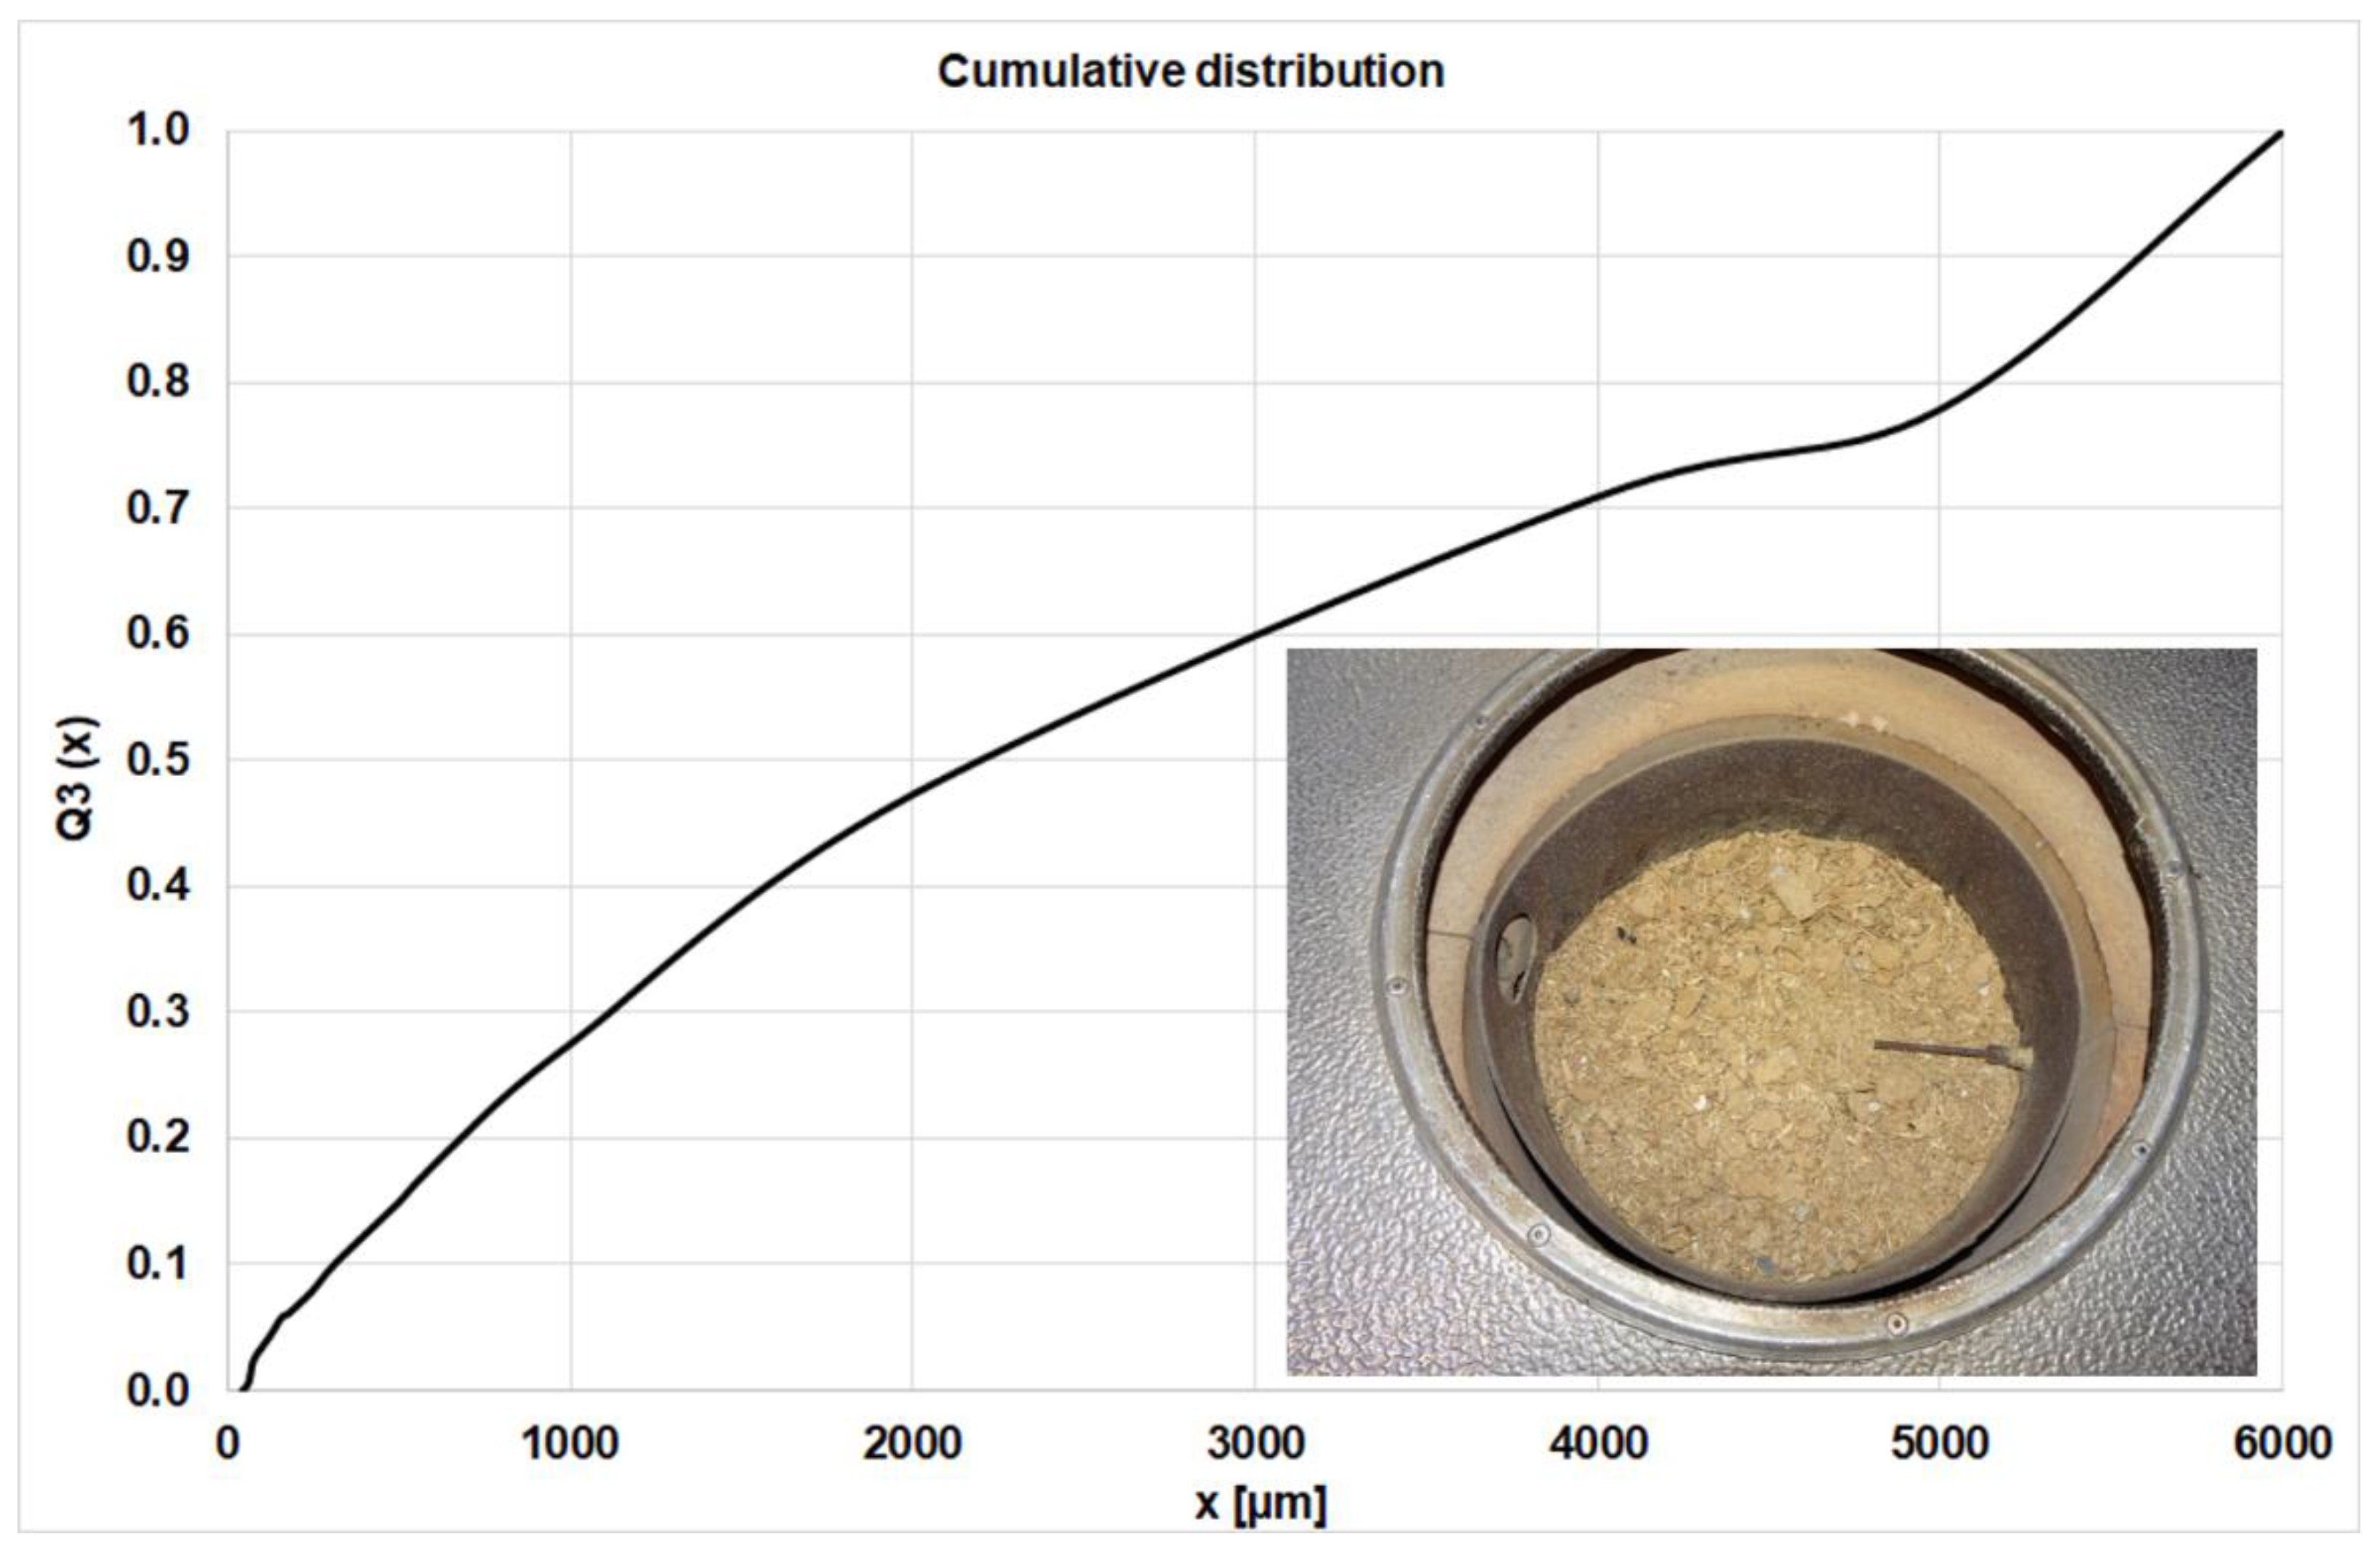
Figure 3.
Cumulative Particle Size Distribution of the waste wood.
The particle size distribution was measured three times, using a sieve tower and the averaged values are plotted in Figure 3. Below 2 mm there are 47 wt.% of the particles, so the influence of these fine particles on the flow and heat transfer properties is large.
To homogenize the combustion behavior and avoid fluctuations in stoichiometry in the fuel bed, the waste wood was pelletized.
The waste wood contains about 4 wt.% of nitrogen, which is a high value compared to unprocessed natural wood with values below 1 wt.% and the main challenge for the NOx emissions [15]. Critical species like S and Cl are in low concentrations, so the risk of corrosion in the boiler should be small. After the pelletization, the lower heating value increased slightly to 17.8 MJ/kg compared to the waste wood with 17.2 MJ/kg. The bulk density is reduced from 250 kg/m3 to 130 kg/m3.
3.2. Numerical Approach
3.2.1. Numerical Mesh and Modeling Approach
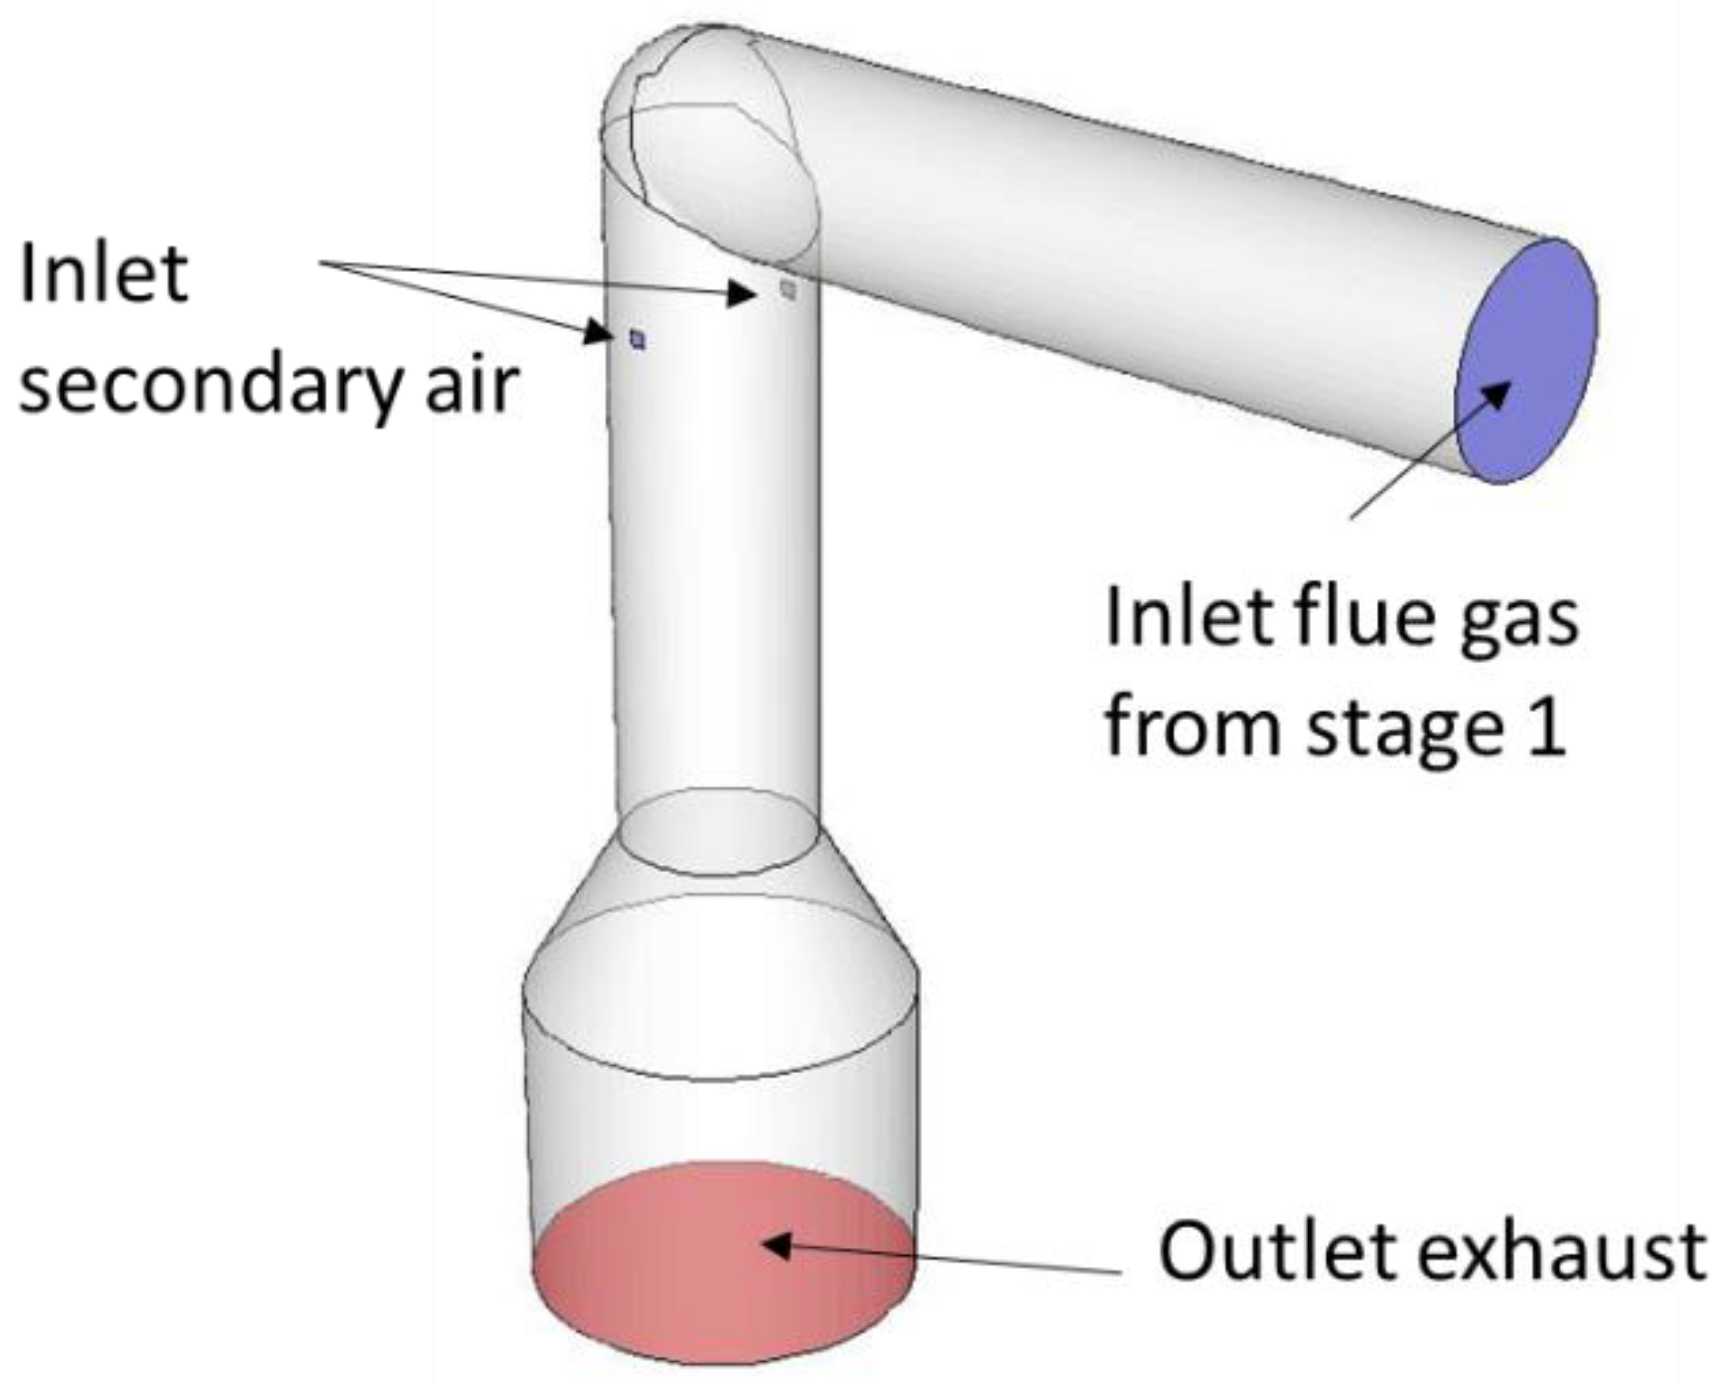
The main subject of interest of the CFD simulation is the NOx reduction due to the oscillating secondary air in the pcc. Preemptive simulations of the whole pcc have shown that the combustion of the flue gas leaving the combustion chamber through the connecting channel occurs mainly in the middle to the upper part of the pcc. Thus, for better computational efficiency, the numerical investigation solely focuses on this part of the KLEAA (Figure 4). The mesh contains around 70,000 hexaeder cells, with refined cells at the position of the secondary air inlets, where air and flue gas mix and secondary combustion occur.
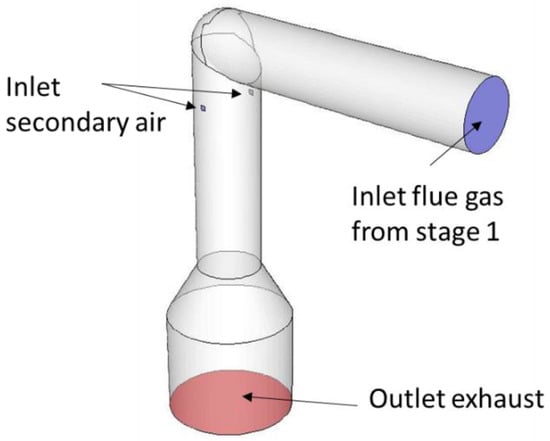
Figure 4.
Computational Domain of the post-combustion chamber.
The flue gas combustion and the NOx-forming are modeled with a detailed reaction mechanism. As this modeling approach is computationally very expensive, only a time section of the quasi-steady-state combustion of the fuel bed is simulated. This quasi-steady-state phase is characterized by an ignition front moving through the fuel bed at a constant speed where drying, pyrolysis as well as char combustion occur parallel and at a constant rate. Consequently, the temperature, momentum and species composition of the flue gas entering the pcc is constant over time. This is true for both modes of secondary air supply, with and without oscillation, as the combustion process in both chambers is separated spatially and the mode of secondary air supply does not influence the fuel-bed combustion. In the case of the experiments without oscillating air, the combustion in the pcc during the chosen timeframe can be considered as a steady-state. The corresponding simulation is therefore obtained as a steady-state solution. The simulation of the experiment with oscillating secondary air is transient.
The initial condition of the transient simulation is taken from the converged steady-state solution. With this approach, the influence of oscillating air on the NOx formation can directly be identified.
3.2.2. Turbulent Flow Modeling and Solver Parameter
The simulations are performed with the commercial pressure-based CFD solver of ANSYS Fluent (Version 17.2). The Detached Eddy Simulation (DES) model is used to model the transient turbulent flow, with the realizable k-epsilon model as the underlying RANS model [16]. The Pressure-Velocity coupling uses the SIMPLEC algorithm. Radiation, turbulent kinetic energy, and dissipation rate are discretized using first-order schemes. Energy, Species, Momentum, Pressure, and the transient term are discretized by second-order schemes. The residuals of the equations were set to 10−9 and reached the order 10−4 (energy equation) and 10−1 (the continuity equation), respectively.
For the steady-state solutions, the realizable k-epsilon model with enhanced wall treatment is used instead of the DES model. The remaining solver settings were the same as for the transient case. The residuals of the energy equation and the continuity equation for the steady-state solutions reached the order of 10−6.
3.2.3. Radiation Model
The radiative heat transfer between surface-surface and surface-flue gas is modeled with the Discrete Ordinate model (DO). The DO model discretizes the angular space in discrete solid angles, each associated with a spatial direction, and solves the radiative transfer equation (RTE) for each direction. A discretization of 3 × 3 solid angles per octant is applied to the angular space and a radiative solver frequency of 10 is chosen. The absorption coefficient of the flue gas is calculated via the standard WSGGM Model of Fluent [16].
3.2.4. Combustion and NOx Model
The post-combustion of the primary flue with air in the pcc is controlled by the turbulent mixing of these two flows. A common approach to model turbulent, non-premixed combustion is by using the flamelet concept from Peters [17,18,19]. For steady-state simulations, the “Steady Diffusion Flamelet” (SDF) is generally used. One of the great advantages of the SDF is its computational efficiency. Chemical reaction source terms are calculated and tabulated in advance of the actual simulation and only transport equations for energy, mean mixture fraction, and mean mixture fraction variance are solved for. A disadvantage of the SDF approach is, that it is not suitable for slow chemistry such as NOx formation.
An alternative for modeling the combustion process is the Eddy Dissipation Concept (EDC) from Magnussen [20]. The EDC is able to model turbulence-chemistry interaction and allows the inclusion of detailed chemistry. It is assumed that the combustion occurs within the small turbulent structures of the turbulent flow which can be considered as a constant pressure reactor. Within these structures, the species react at the given cell temperature and pressure over a defined time scale. The numerical integration of the reaction rates is carried out with the ISAT algorithm (In-Situ Adaptive Tabulation). Details of this algorithm are described by Pope [21]. Utilizing EDC-ISAT, slow chemistry can be modeled. The downside of EDC-ISAT is, that the system becomes numerically stiff if many species react at disparate time scales, thus the computational costs can become very expensive.
Nonetheless, with regard to the experimental conditions, EDC-ISAT seems to be the best solution to model the post-combustion and NOx formation. In many situations, NOx formation is modeled in a post-processing fashion (e.g., [22]), which is prohibitive in this case because of the transient behavior. Also, it is expected that due to the oscillating air, a broad range of intermediate thermo-chemical compositions will occur, where global NOx reaction mechanisms like De Soete [23], Brink + Kilpinen [24], Mitchel + Tarbell [25] will probably lose a lot of their validity.
Several the skeletal and detailed reaction mechanism for NOx formation in biomass combustion system exists. The most accurate is the detailed reaction mechanism from Glarborg et al. [26]. Other notable detailed mechanisms are the ones from Kilpinen [27] or the GRI 3.0 [28]. A large number of species and elemental reactions often renders the detailed mechanisms incompatible for the simulation of larger technical systems due to the high computational demands. In this work, a skeletal mechanism, derived from the Glarborg mechanism and proposed by Li et al. (LI32) [29], is used as a compromise between accuracy and computational effort.
3.2.5. Boundary Conditions
Temperature and Momentum:
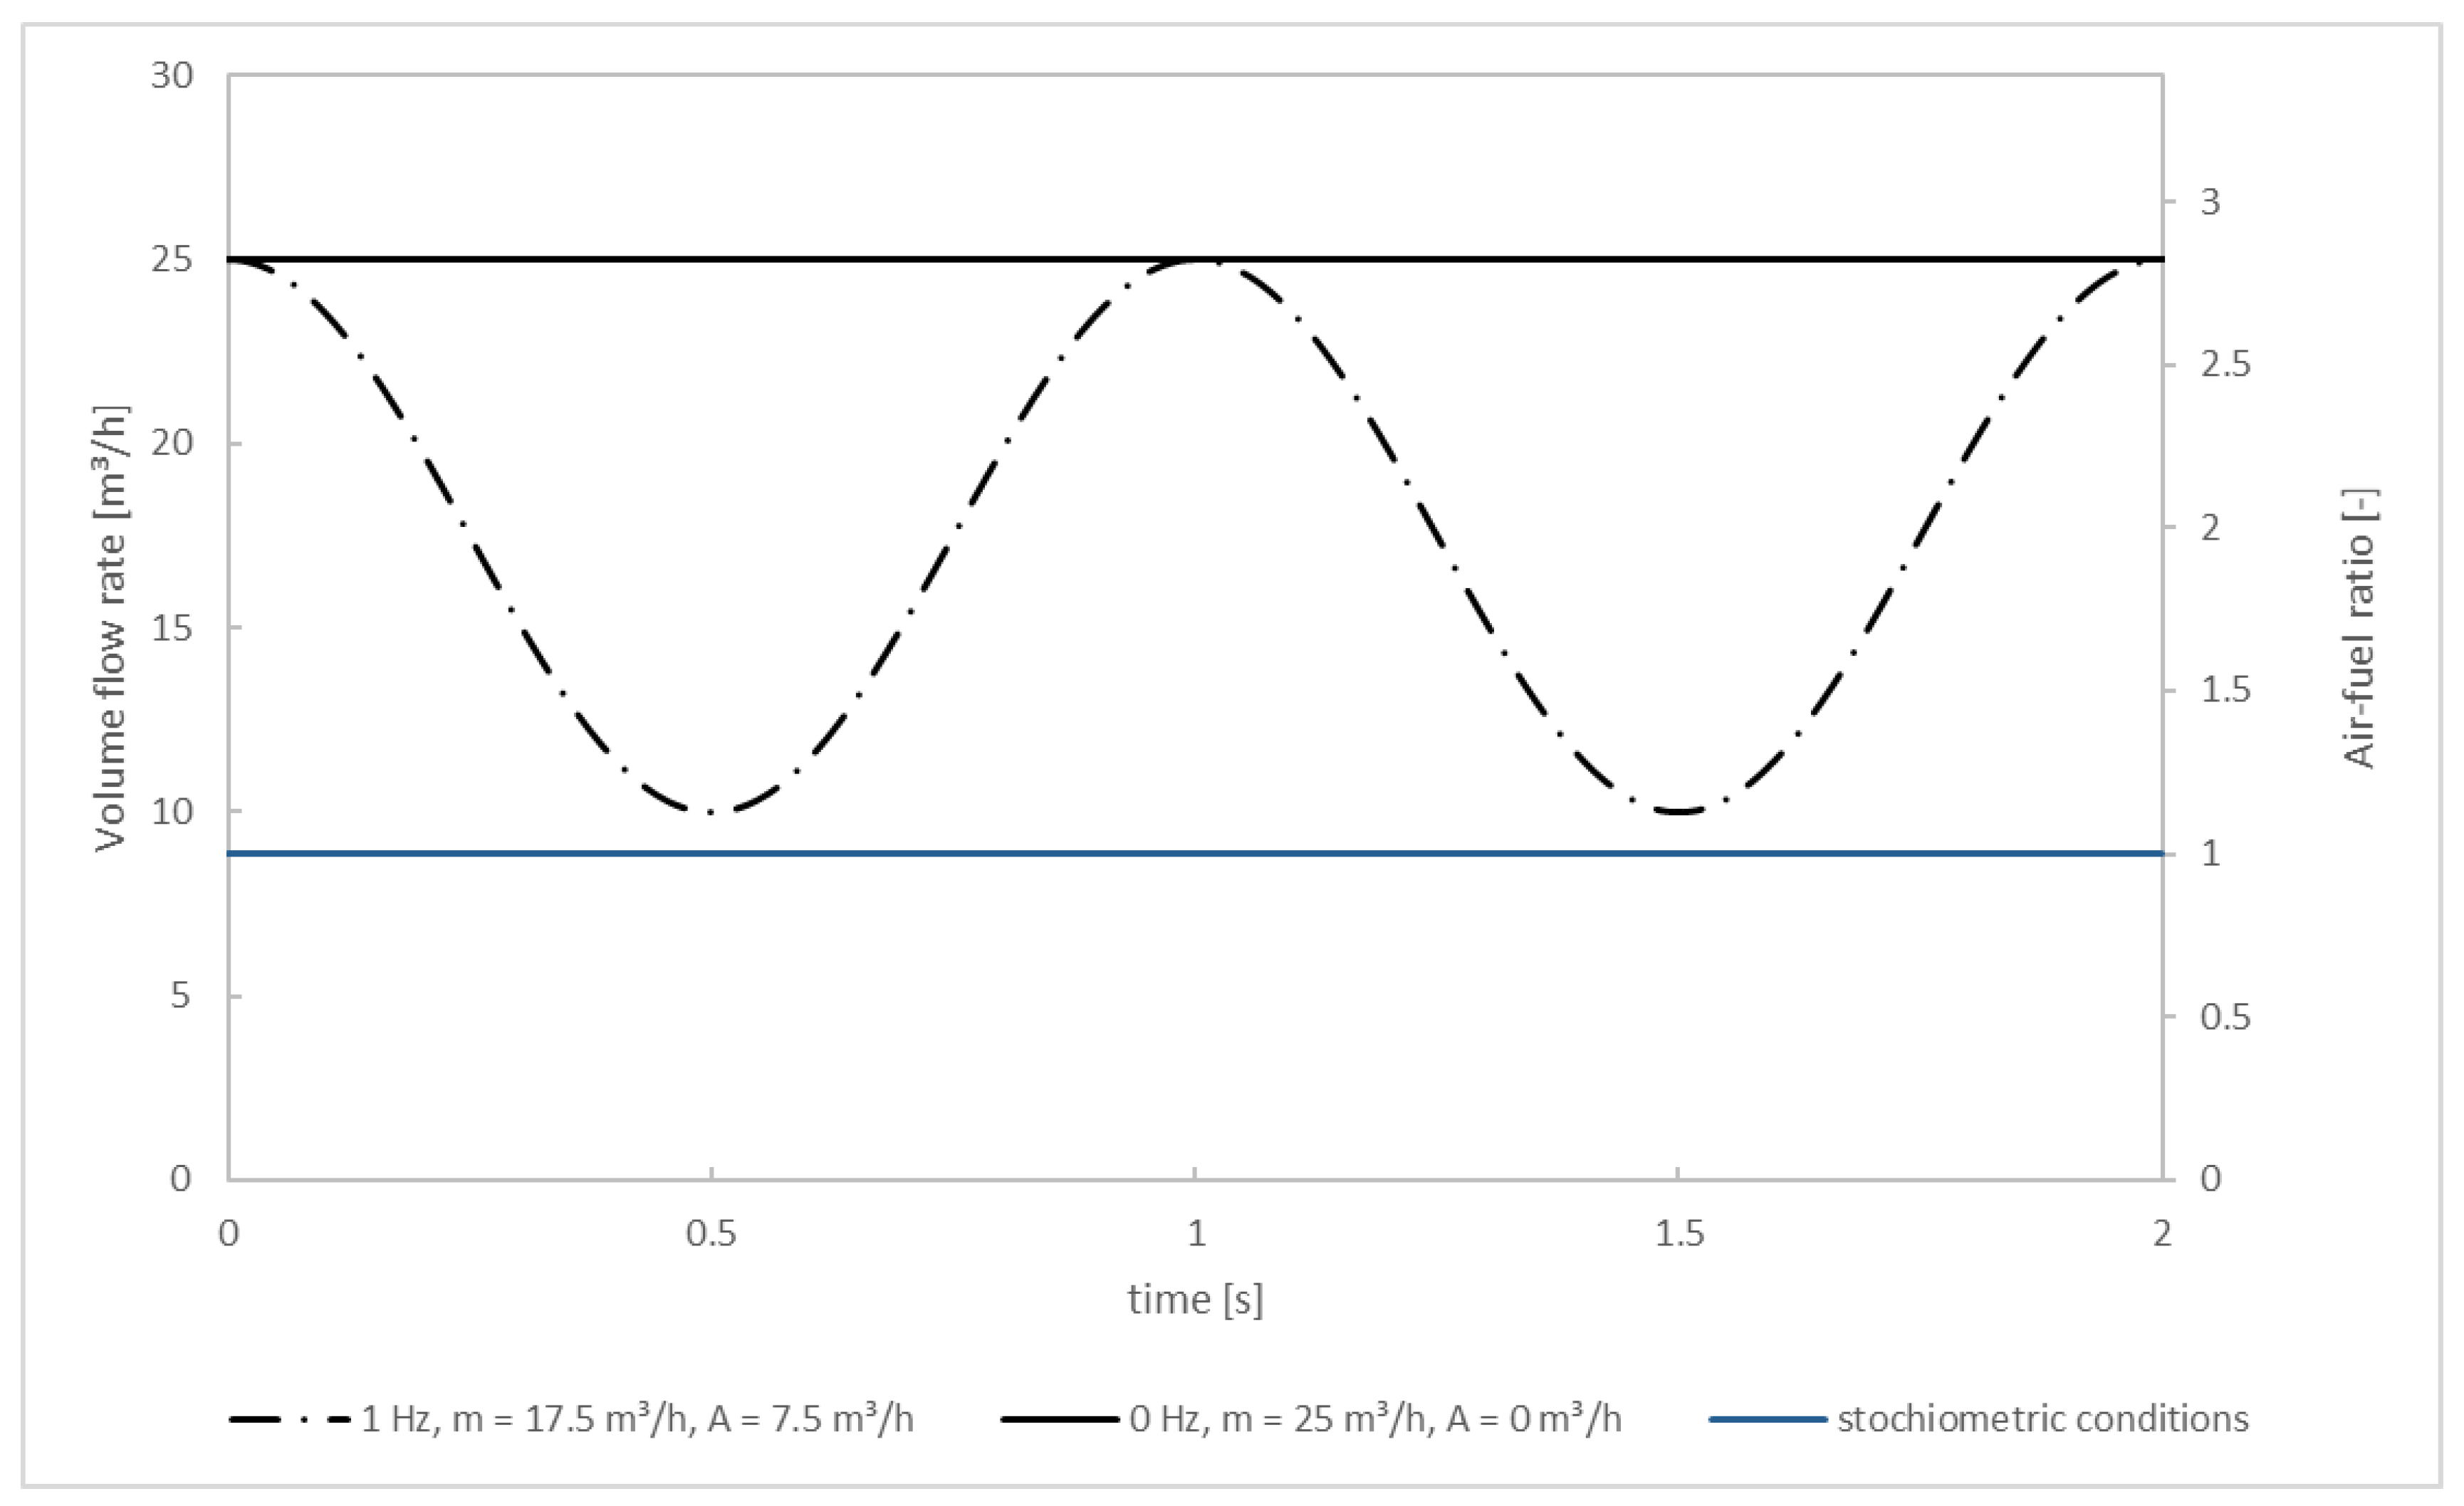
Wall temperatures and temperatures of the inlet streams are set to the values from the experiment. That is, 900 °C for the walls and the flue gas and 25 °C for the secondary air. The mass flow of the flue gas equals the mass flow of the primary air (at 10 m3/h) plus the mass per second released from the fuel bed through drying/pyrolysis/char combustion plus the mass flow of N2 used for cooling the camera above the fuel bed. The mass per second released from the fuel bed during quasi-stationary combustion for test: pellet 1 (without oscillation) is 1.5 × 10⁻³ kg/s resulting in a flue gas mass flow of 5.784 × 10⁻³ kg/s. This constant flow rate is used for the steady-state as well as for the transient simulation. The mass flow rate for the secondary air in the steady-state solution (no oscillation) is 12.5 m3/h at each of the two secondary air inlets, thus 25 m3/h in total. For the transient simulation (oscillation) the secondary air’s oscillation is idealized and assumed sinusoidal (Figure 5). This approximation is chosen because of the smooth progress of the curve over time, preventing numerical instabilities and divergence in the chemical solver that could occur, for example, in the case of rectangular curve progress. The oscillation frequency of f = 1 Hz was investigated and compared to the non-oscillating case. The sinuses phase is shifted by half the respective frequency to start at 25 m3/h, allowing to use of the converged steady-state solution. Originating from there, the flow rate decreases down to 10 m3/h, which is equivalent to an average flow rate of 17.5 m3/h with an amplitude of 7.5 m3/h. Afterward, the flow rate increases back to 25 m3/h. The reason for staying below 25 m3/h is because it is expected that a reduction of NOx (compared to the non-oscillating operating mode) can only be achieved if local O2 concentrations drop below a certain level since it is well known that the NOx formation corresponds proportionally to the O2 concentration. The blue line marks the (total) flow rate of secondary air needed for stoichiometric combustion of the flue gas (air-fuel ratio = 1). It can be seen that even in the oscillating mode the overall combustion process is always over-stoichiometric. Nonetheless, a NOx reduction is possible because air is diffusively and convectively mixed into the flue gas over time, resulting in spatial gradients of the O2 concentration.
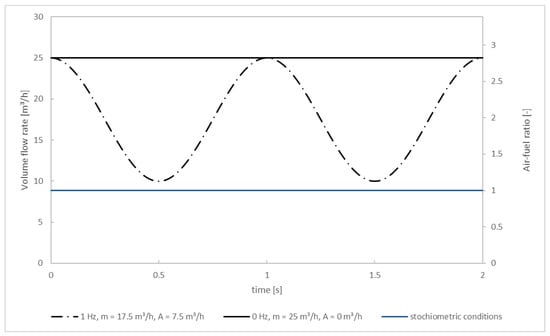
Figure 5.
Volume flow rate and air-fuel ratio for the simulations.
Species:
The flue gas at the inlet of the pcc consists of several main combustion species (CO, CO2, CH4, H2, H2O, O2), N-species from the Fuel (NO, HCN, NH3), and N2. As H2O is not being measured in the inlet, this value is iteratively adapted to hit the outlet concentration of H2O after the post-combustion for the non-oscillating mode according to Table 4. The composition of the flue gas is derived using experimental data from the KLEAA, an empirical NO-model, and the open-source library Cantera [30]. The surface of the solid fuel bed is the starting point of the derivation. The NO concentration immediately above the fuel bed was calculated with the empirical model from Stubenberger et al. [31] using the fuel-N content (~4 wt.%). They determined empirical conversion rates of NO, HCN, and NH3 for several types of woody biomass with different N-content and under changing stoichiometric air ratios in the fuel bed. The concentrations of NH3 and HCN above the bed were calculated using the average value of the two experiments, resulting in 5080 mg/m3 and 157 mg/m3, respectively. However, the main combustion species make up the largest fraction of the flue gas above the solid bed with >99 vol.%. Using a python tool and the Cantera library, the major species (measured in the KLEAA during quasi-steady-state combustion of the pelletized waste wood) and the released N-species are mixed and a representative flue gas composition above the solid fuel bed is determined (Table 3). Next, the flue gas passes through the combustion chamber and into the pcc via the connecting channel. Due to the elevated temperatures (900 °C) and O2 being in excess in the flue gas, the composition changes before reaching the pcc inlet. To account for this, a 1D plug-flow reactor simulation is performed, using the distance between the inlet and the solid fuel bed as well as the flow rate to determine an average residence time. The Glarborg [26] reaction mechanism is used for this kinetic calculation. As expected, oxidizable components like CO, H2, CH4 are further decreased. Also, the composition is diluted by the N2 from the camera cooling. The final composition of the flue gas at the inlet is shown in Table 3 and used as input for the steady-state and the transient simulation.
Table 3.
Measured and derived flue gas composition above the fuel bed and at the pcc inlet.
Concerning the depicted experimental values, all of these are averaged values for a defined time frame in the steady-state phase after the ignition of the fuel. An indicator for the relevant time frame is the concentration of Corg, calculated as CH4 above the fuel bed —if this concentration is lower than 0.1 vol.% the degassing and the release of HCN and ammonia is assumed to be finished (see Figure 9).
Due to the about 26% higher mass flow in “pellet2” selected species concentrations increase, too (CO, CH4, NH3, and HCN).
3.2.6. Simulation Procedure
Steady-state solution:
A two-step procedure is used to calculate the steady-state solution. First, a simulation with the non-adiabatic SDF model is performed with a hydrocarbon mechanism from Bui-Pham et al. [32]. Because the SDF solves the transport equation for a conserved scalar (mean mixture fraction) closure of mass is guaranteed. This preliminary calculation of a combustion solution is essential before using the EDC-ISAT algorithm because the simulation would take too long otherwise. The final steady-state solution is calculated with the resulting flow field, temperature field, and species distribution whereby the flow field is frozen and only species and energy are solved for.
The quality of the final steady-state solution also depends on the solver settings of the ISAT algorithm. The absolute and relative error tolerance of the ODE solver for all simulations are set to 10−8 and 10−9, respectively. The maximum storage (maximum RAM) used by the ISAT table is set to 2000 MB. according to the recommendations of Pang et al. [33] to increase calculation performance. The most important parameter to control accuracy and computation speed is the ISAT error tolerance. Its default value is 10−3 and offers a good compromise between accuracy and speed. A lower value offers higher accuracy at the cost of additional computational effort. Values of 10−2 and 5 × 10⁻⁴ were tested in advance to evaluate the influence of the error tolerance on these two parameters. The species concentrations of the converged solution for 10−3 and 5 × 10⁻⁴ are very similar, while for 10−2, slightly higher H2O, CO2, and NOx concentrations were calculated. It was deduced that an error tolerance of 10−3 is sufficient for the steady-state solution.
Transient solution:
Upon achieving a converged steady-state solution the transient simulations are performed with the steady-state solution as an initial condition. The secondary air immediately begins oscillating after starting the simulation (see Figure 5). The time step size is 2 × 10⁻⁵ s and it is ensured that the CFL condition is always met. The solver settings for the ISAT were the same as for the steady-state solution.
The transient calculations were run in parallel (10 processes) on a system with two Intel Xeons (E5-2630 v3 @ 2.4 GHz, 8 cores). The average clock time per time iteration was ~40 s and a timeframe of 2 s is simulated. Because of the periodic behavior of the sinusoidal oscillation with otherwise constant boundary conditions, data collected from this timeframe is sufficient to analyze the influence of the secondary air oscillation on the NOx formation.
To summarize, two simulations are performed. One steady-state simulation represents the case with pelletized waste wood without oscillating secondary air and one transient simulation with oscillating secondary air (f = 1 Hz).
4. Results
This Section is divided into experimental and numerical results.
4.1. Experiments
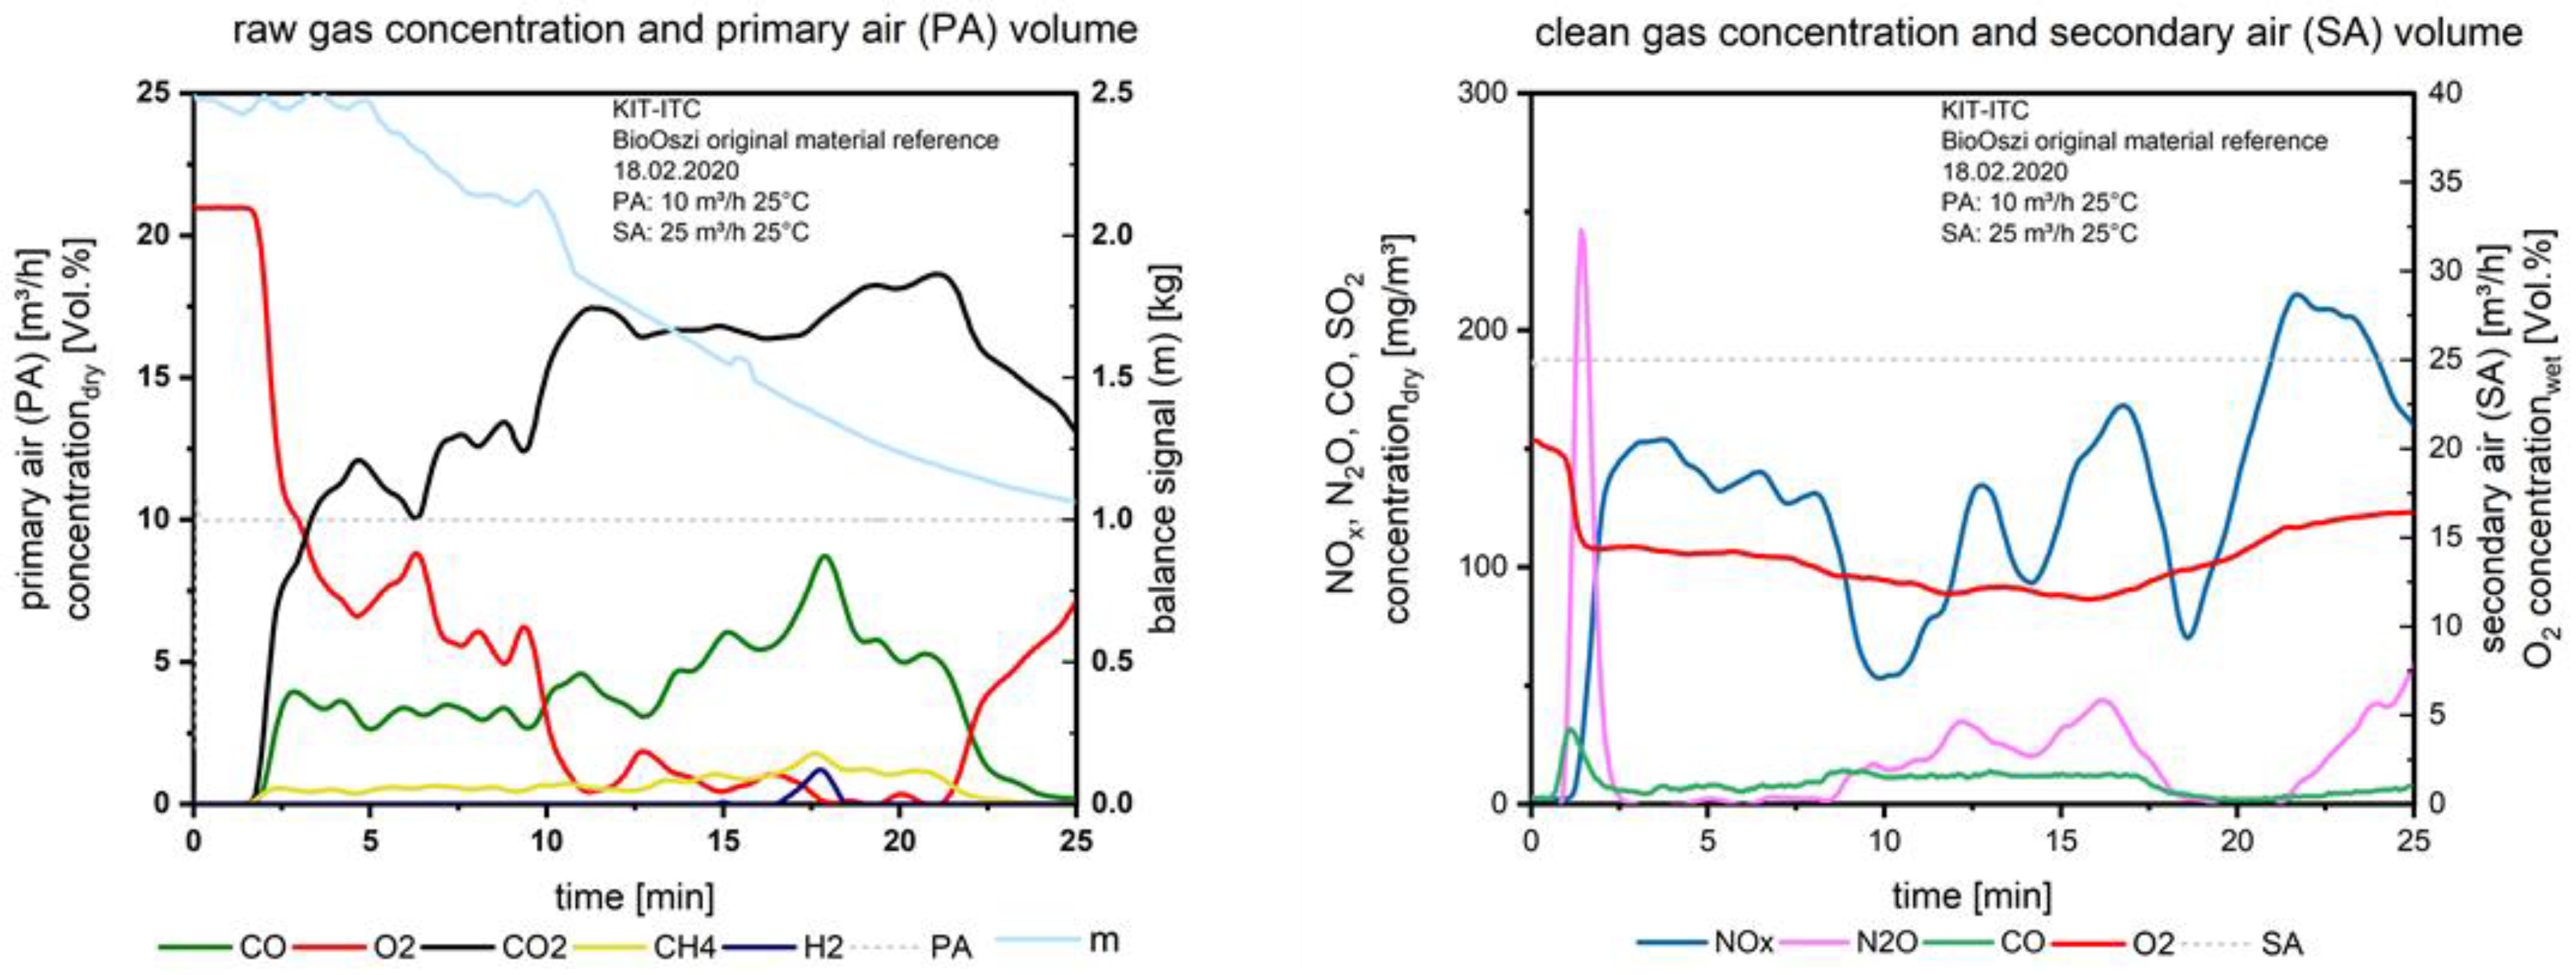
After the material is entered into the combustion chamber and the primary air is supplied, the test run starts. Two minutes later the first fuel layer ignites due to thermal radiation from the surrounding walls and the combustion is initiated. Figure 6 shows the gas concentrations measured above the fuel bed (left), the constant volume flow of the primary air (dashed line) at 10 m3/h on the left axis as well as the signal of the balance in kg, plotted on the right axis.
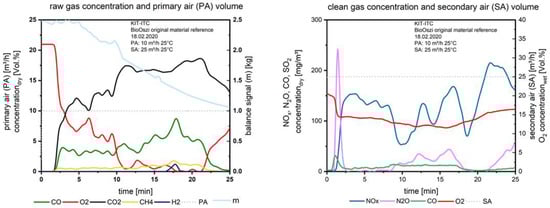
Figure 6.
Flue gas concentrations before and after secondary air addition during combustion of the waste wood.
The balance is sensitive regarding frictional connections, e.g., of fuel, which lies on the thermocouples. The fluctuation in the balanced signal therefore could be linearized for evaluation. In Figure 6, on the right, the clean gas concentration after the secondary air injection is plotted, the amount of secondary air (dashed line), as well as the O2 concentration (red line), are ordered on the right axis. The “target value”, the NOx (blue line), is plotted on the left axis.
During the degassing of the fuel (layer per layer, see Figure 6, left, CO and CH4 are stable until the 13th minute. CO is increasing up to a maximum of about 8 vol.%, decreasing to zero at the end of the test. CO is formed during the pyrolysis and the char gasification and combustion. First, the fuel must be heated up, dried, and devolatilized, then the char conversion starts. After the O2− concentration reaches values close to zero (11th minute) the char, which is formed until this time, is converted to CO; when the ignition front reaches the bottom of the fixed bed, the final char burnout starts after the 21st minute, O2 is increasing, CH4 is decreasing. The peak of CO2 correlates with the start of the char burnout.
At the small H2 peak at the 18th minute, the degassing process has reached a local maximum. Due to the heterogeneity of the waste wood, only a few time slots exist for gasification. When the O2 is near zero the first time, the NOx (Figure 6 right) drops down from ca. 130 mg/m3 to ca. 50 mg/m3; this corresponds to the air staging as a primary measure to reduce NOx. When the O2 slightly increases to a value of 2 vol.% at the 13th minute, the NOx increases, the same for the 14th minute: here again O2 is at a minimum close to zero, NOx decreases, the same issue at the 18th minute. The strong increase of NOx during the char burnout refers to the formation of NOx from the nitrogen in the char. CO after the secondary air injection is more or less stable.
The peak of N2O at the beginning of the combustion refers to the release of HCN from pyrolysis, together with O2, N2O is formed at lower temperatures (below 900 °C), this is well known from the operation of fluidized bed incinerators, e.g., with sewage sludge. The maximum peak of N2O correlates with a small peak of CO; this is based on the mechanism [8]:
NCO + NO → N2O + CO
When H2 is available, see e.g., at the 18th minute, N2O is reduced [8].
In the second test, the oscillation with 1 Hz was started at the 5th minute, which could be seen in Figure 7 on the right, the secondary airflow is fluctuating (dashed line).
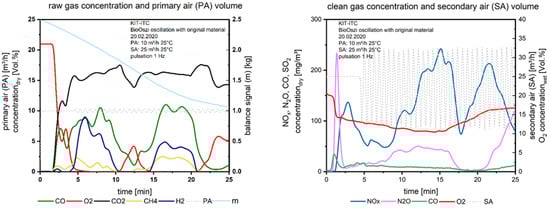
Figure 7.
Flue gas concentrations before and after secondary air addition during combustion of the waste wood with oscillation.
If we compare the gas concentrations above the fuel bed with waste wood in Figure 6 and Figure 7, left we recognize the uneven combustion behavior of this fuel: The combustion seems to be separated into two sections (Figure 7), one until the 10th minute, the second until the 20th minute. From the balanced signal, we recognize a stable mass release, the fluctuations of gaseous species do not affect the mass conversion, it is a linear function until the char burnout starts at the 20th minute. The uneven combustion is led back to the fine particles in the waste wood. These particles are distributed statistically when entering the fuel into the bin, filling holes surrounded by bigger particles. The primary air flows around these local areas with fines due to the higher pressure drop, so the oxygen is not equally distributed across the fixed bed. Similar findings were made with waste wood in a project together with AREVA [15].
What we see again: Before starting the oscillation until the 5th minute, O2 is decreasing, NOx, too. When starting the oscillation from the 5th minute the first gasification period until the 10th minute is generated, NOx is not decreasing further, so in this case, it is difficult to distinguish between the effect of air staging and oscillating combustion on the NOx reduction. In the following short period of O2 excess above the fuel bed (10th to 15th minute), NOx is increasing to a maximum, reaching a minimum at the 18th minute, when the O2 is stable at zero between the 15th and 20th minute. The second peak of NOx after the 20th minute is again justified by the conversion of fuel nitrogen during the char burnout.
To reduce the effects of the physical properties of the waste wood (particle sizes) the waste wood was pelletized.
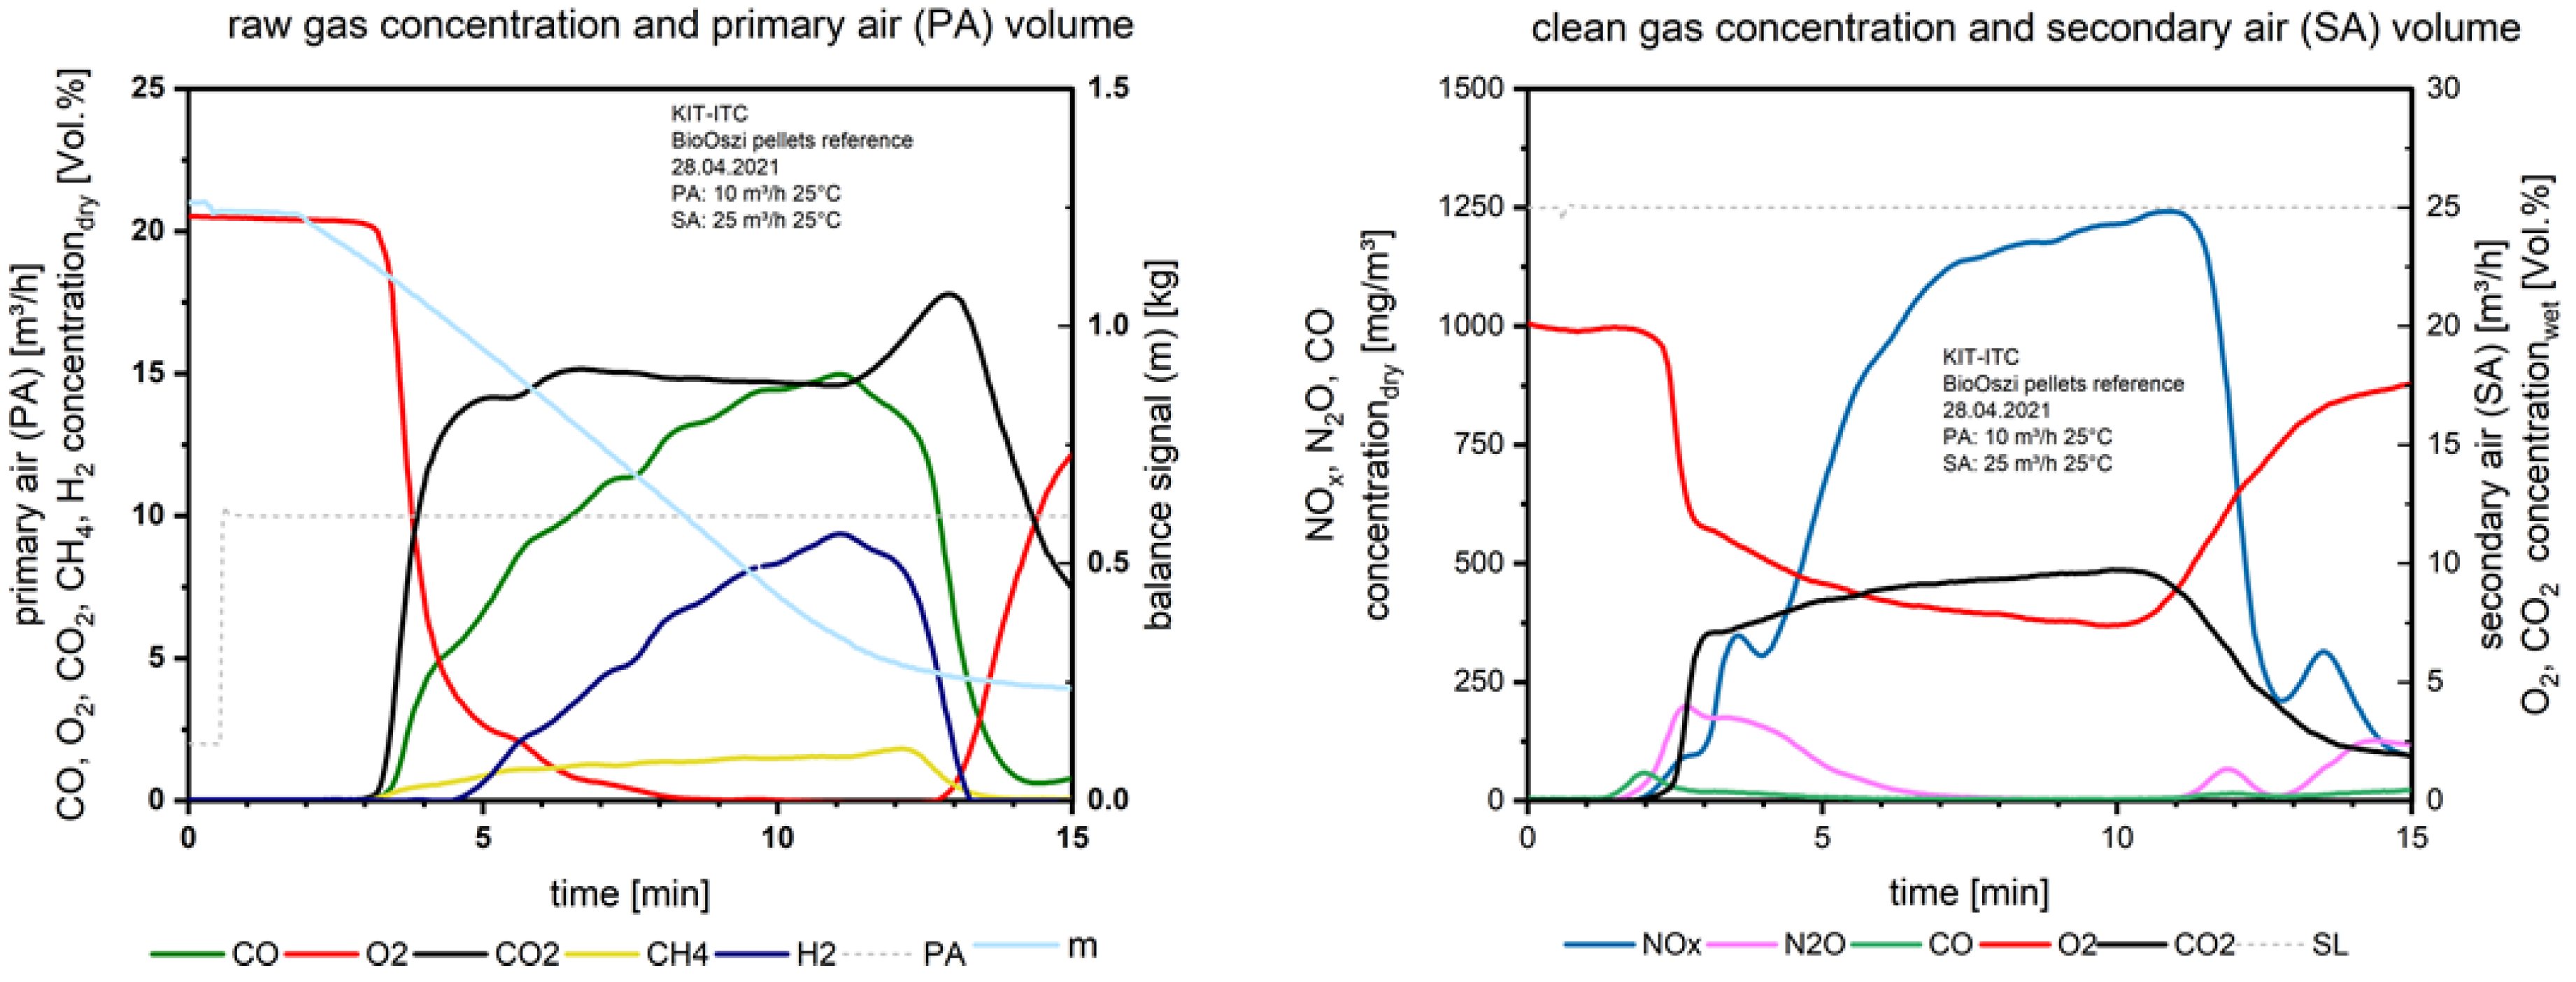
Figure 8 shows the combustion characteristics of the pelletized waste wood. The combustion parameters raw and clean gas concentrations are stable in contrast to Figure 6 and Figure 7 with the waste wood.
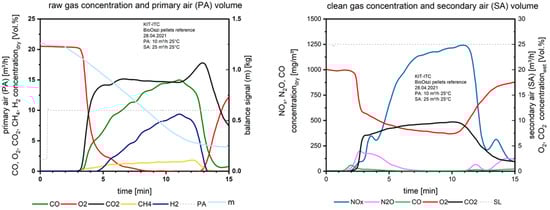
Figure 8.
Flue gas concentrations before and after secondary air addition during combustion of the pelletized waste wood.
Due to the pelletizing the material is solidified and releases higher amounts of the gaseous species per time unit. This is especially visible for the NOx emission; the values are much higher compared to the waste wood combustion at comparable O2 concentrations in the clean gas.
The CO and H2 concentrations above the fuel bed on the left in Figure 8 are increasing during the main combustion zone due to partial gasification of already formed char with water vapor. The water vapor is generated from drying and the pyrolysis processes which take place parallel to the combustion.
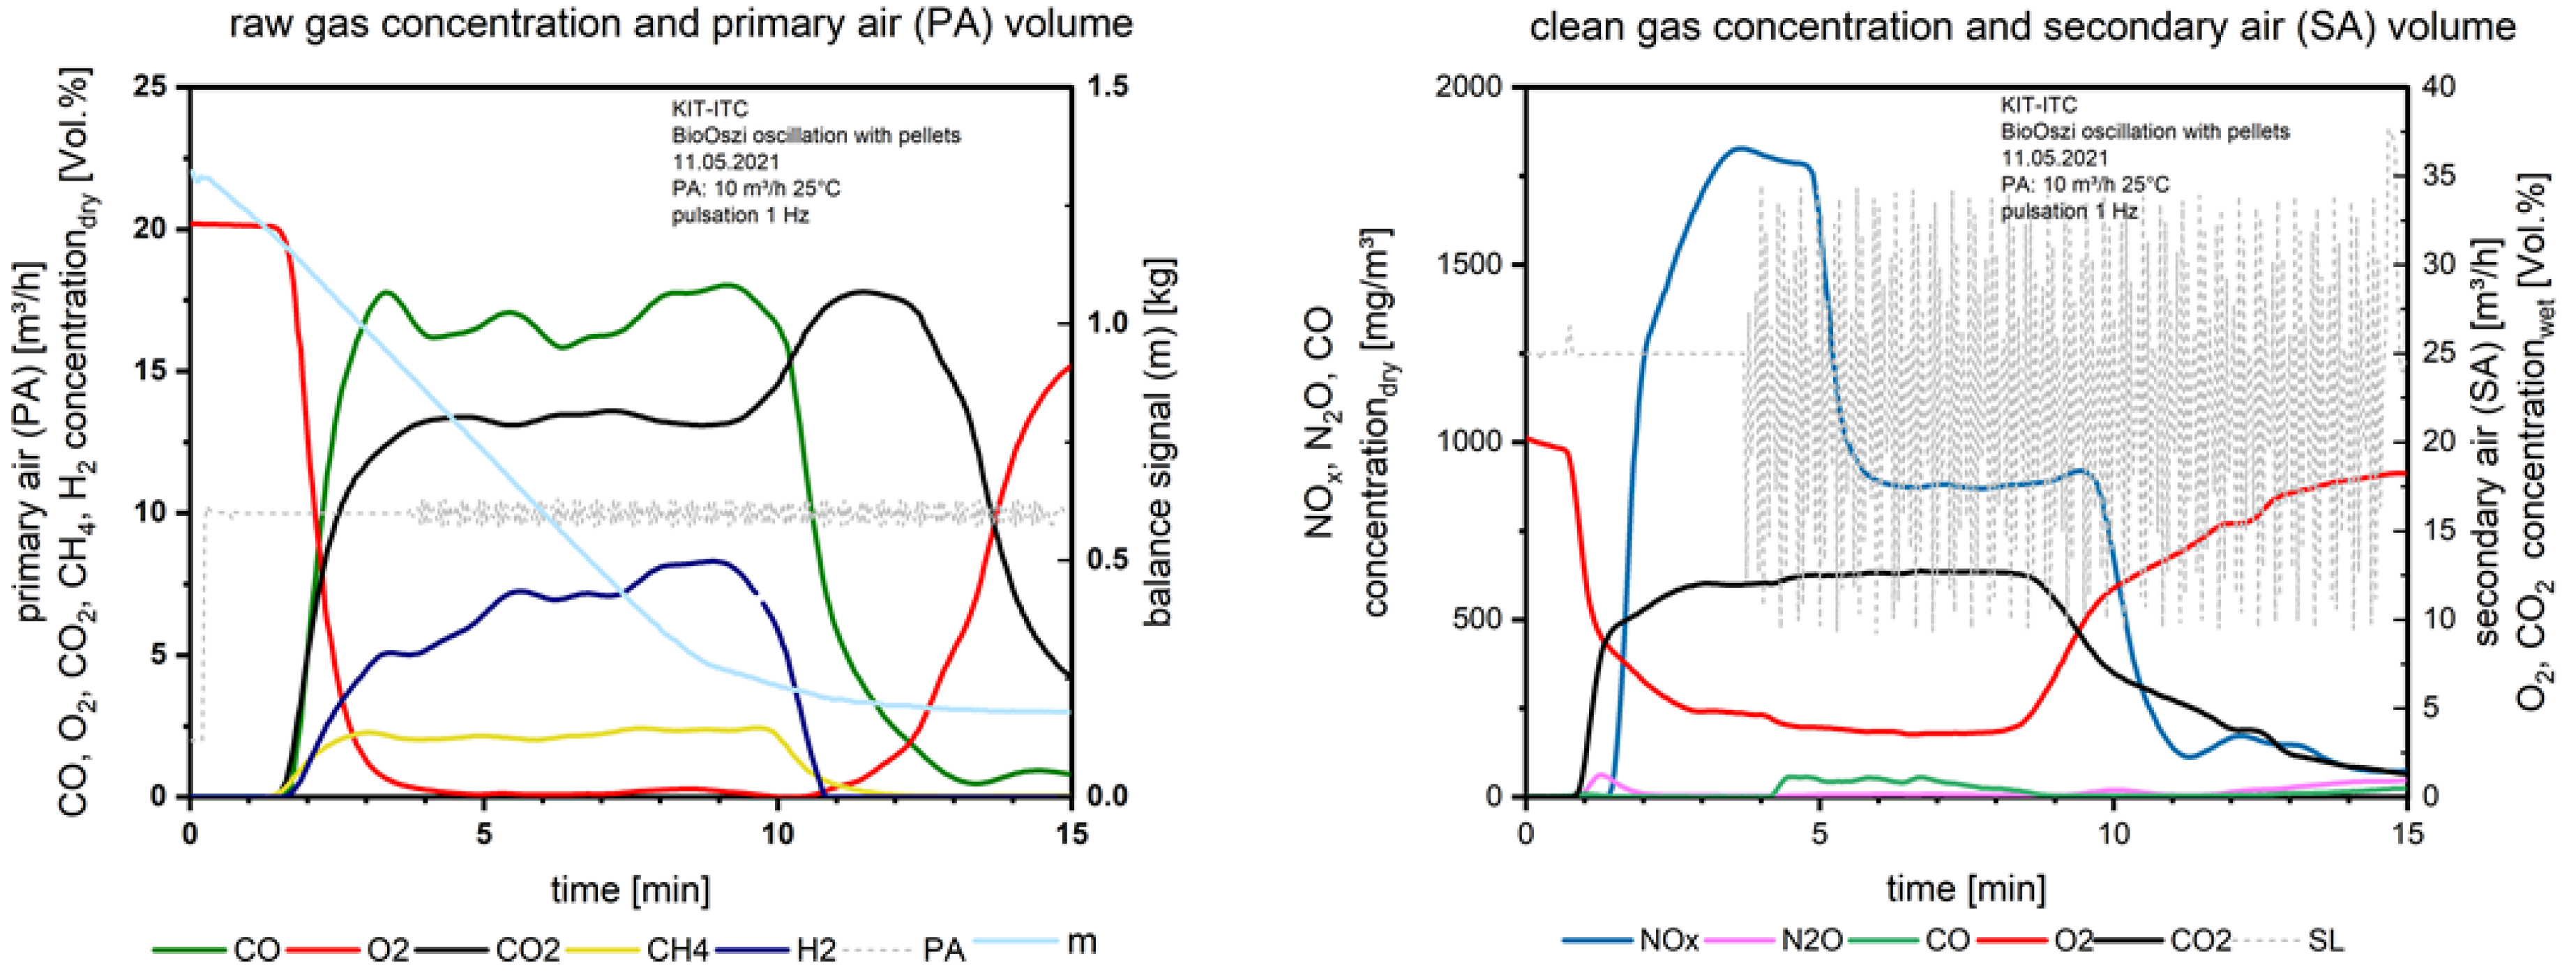
When starting the oscillation (Figure 9) from the 4th minute, the NOx drops down 1 min later from 1780 mg/m3 to 870 mg/m3.
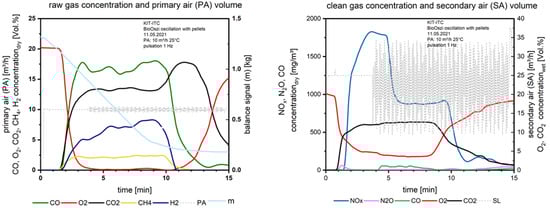
Figure 9.
Flue gas concentrations before and after secondary air addition during combustion of the pelletized waste wood with oscillation.
Here the effect of oscillation is detectable. With 1 Hz the frequency is high enough to avoid CO increase but reduces NOx significantly. To reduce the influence of excess oxygen in the flue gas on NOx formation after secondary air injection (9.35 vol.% with no oscillation and 4.5 vol.% with oscillation), in future experiments the oxygen concentration should be adapted in the oscillation mode by increasing the secondary air supply. The thermal efficiency is increasing for the case of oscillating combustion because of the lower stoichiometry (expressed by λ). Comparing the oxygen concentration in the flue gas after the secondary air injection in Figure 8 and Figure 9 (right), the oxygen content is reduced due to the interrupted airflow from the oscillation.
4.2. Simulations
Steady-state solution:
For the steady-state solution, the species concentration at the outlet of the pcc is compared with the pellet 1 experiment in Table 4. The values for the simulation are averaged over the surface. Also, it should be noted that the values captured in the simulation are at half the height of the pcc, while in the experiment the values were measured further downstream. However, most of the reaction occurs in the top half of the pcc. Previous simulations of the whole pcc confirmed that the simulated concentrations further downstream barely change.
Table 4.
Clean gas concentration for pellet 1 experiment and the steady-state simulation.
The simulated values of NOx are overestimated by ~47%. A possible explanation for this is that the combustion conditions in the pcc somewhat differ between simulation and experiment, as can be recognized from the different concentrations of CO2 and O2, respectively. The CO2 concentration in the simulation is larger by approximately 0.7%, while the O2 concentration is smaller by approximately the same amount. This implies that more heat is released during combustion in the simulation, resulting in a higher NOx concentration due to an increase in reaction rate. Also, the amount of NOx above the fuel bed calculated by the empirical model (see Section 3.2.5) could be too high which also would probably explain the higher NOx concentration in the clean flue gas. The calculated number for NOx above the fuel bed could not be verified by experimental data. In future experiments, an additional analyzer based on the chemiluminescence technique should be implemented.
As a result of the fitting procedure, the H2O concentrations match well. The N2O and CO concentrations are smaller in the simulation. Since the absolute amounts are extremely small it is very difficult to match the experimental values unless the experimental conditions are not exactly reproduced in the simulation. Nonetheless, the good agreement in the order of magnitude shows that the simulation approach can calculate these values. The overall good agreement with the experimental values shows that the chosen modeling approach is well suited to simulate the combustion and NOx formation in the pcc.
Transient-solution:
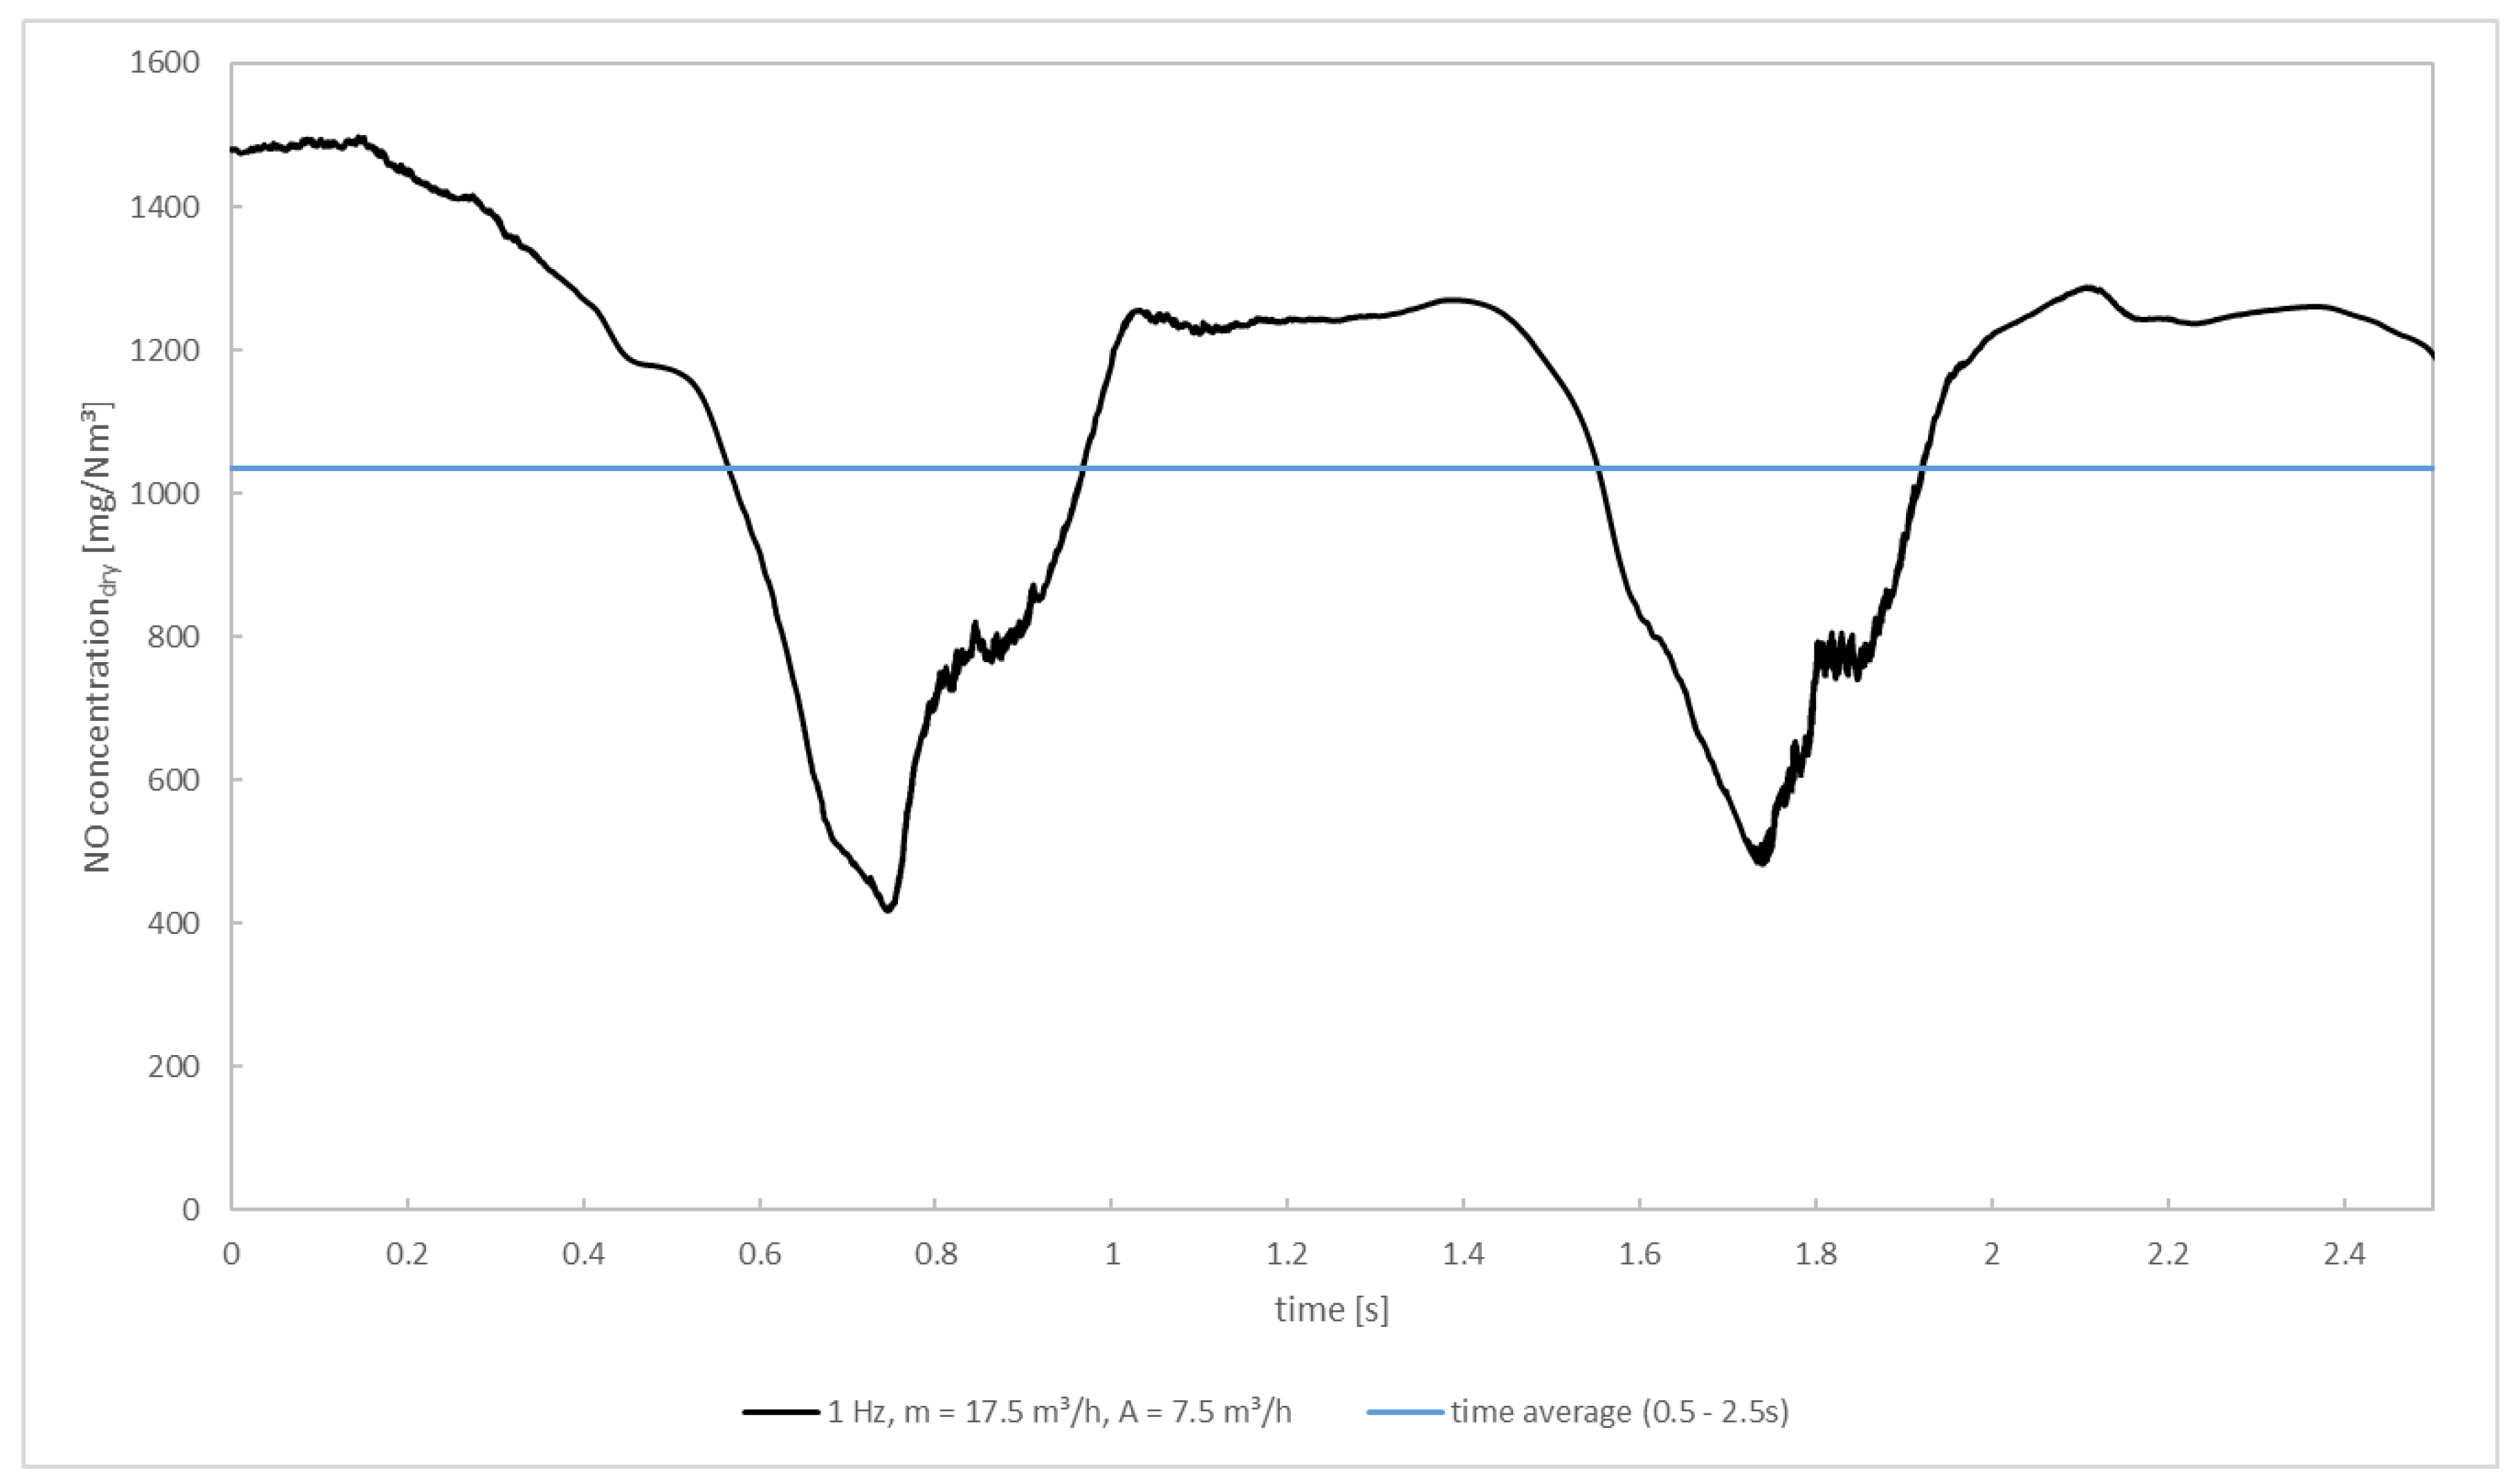
At first, the description of the transient simulation focuses on the time development of NOx as the species of interest. The development of the NOx concentration overtime at the outlet of the pcc for f = 1 Hz as well as its time average in the interval 0.5–2.5 s is depicted in Figure 10. It can be recognized that the development of the NOx concentrations grossly follows the flow rate of the secondary air, showing deviations from the secondary air’s sinusoidal course because air and flue gas must spatially mix first and consecutively react. The initial concentration of ~1480 mg/m3 (dry, 11 vol.%-O2) equals the outlet concentration of the converge steady-state solution. Shortly after starting the oscillation, the NOx concentration decreases. It drops down to a value of 417 mg/m3 at 0.75 s where it only stays for a short moment before increasing again. This time, the NOx concentration reaches a value of 1242 mg/m3, which is a bit lower than the initial value. It remains at this level for roughly 0.45 s before decreasing again. The time-averaged NOx concentration is 1035 mg/m3. This equals a reduction of the NOx concentration of 30.0% compared to the simulation case without oscillating secondary air.
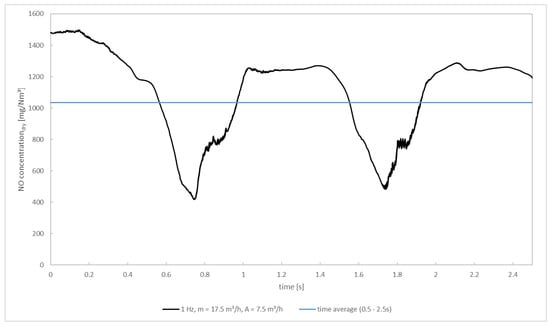
Figure 10.
NOx concentration at the outlet of the post—combustion chamber for the transient simulation.
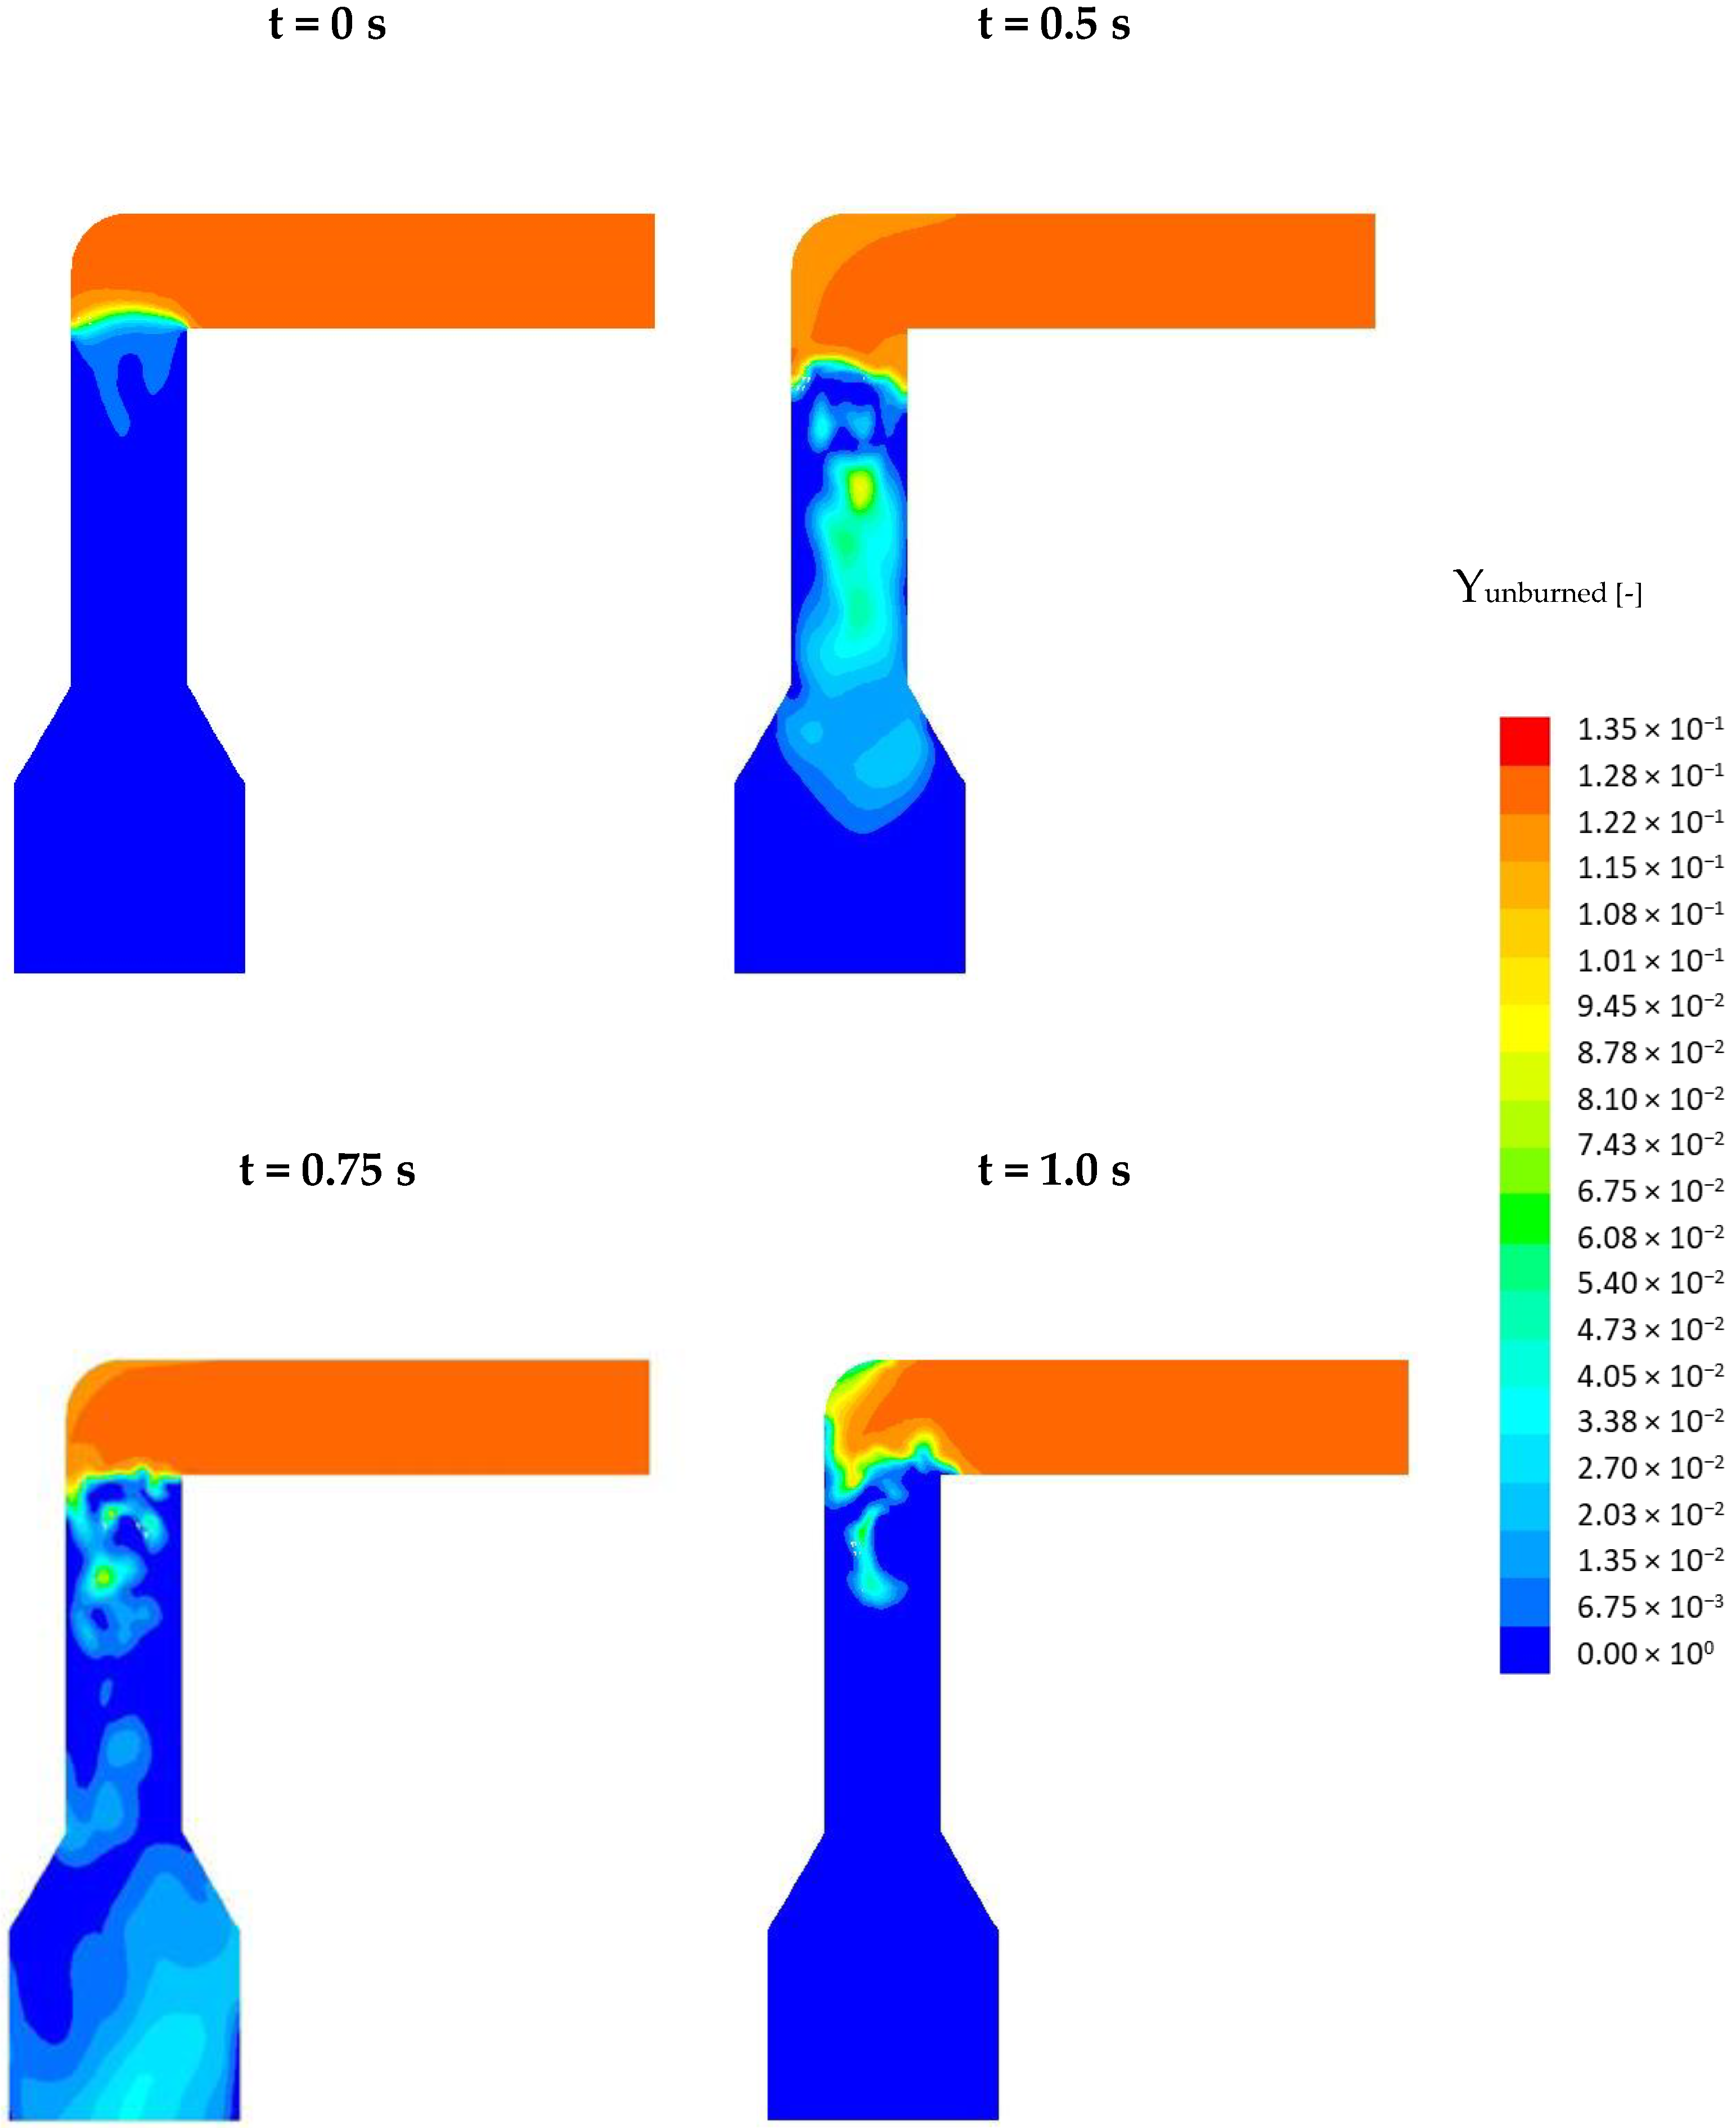
So, how does the frequency influence the NOx formation? This is explained in Figure 11. Here, the profiles of the mass fraction of the unburned, oxidable main combustion species (H2, CO, CH4) are depicted in a cross-section of the pcc. The top, left profile corresponds to the steady-state solution (t = 0 s) The three other profiles correspond to the time frames 0.5, 0.75, and 1 s. At t = 0 s a still unburned flue gas (red) flows through the connecting channel into the pcc. At the entrance into the pcc, the flue gas is quickly burned with the air and a flame front (green) develops. Below the flame front, the mixture is completely burned (blue) because of the high air-fuel ratio. Oscillating the secondary air causes instabilities in the flame front which can be recognized at t = 0.5 s. More important, due to the lower mass flow of air, local substoichiometric conditions occur, as can be recognized from the light blue and green coloring, especially at t = 0.5 and 0.75 s. Inside these zones of lower stoichiometry, the NOx which was previously formed inside the flame front is reduced. The total reduction of NOx depends on the size of these substoichiometric zones and the residence time of the NOx inside these zones. From t = 0 s up to t = 0.5 s these zones grow in size while from 0.5 s to 1.0 s their size decreases again. At t = 1 s, smaller zones with substoichiometric conditions are still present which is why the NOx concentration does not increase back to its initial value. From Figure 10 it can be recognized that the curve starts to behave periodically meaning that the profiles depicted below will repeatedly occur.
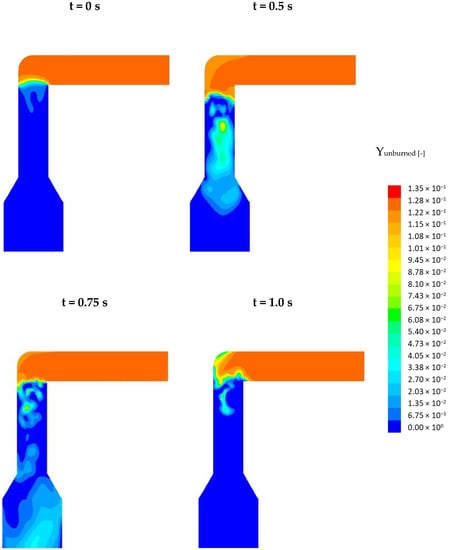
Figure 11.
Profiles of the mass fraction of the unburned species (CO, CH4, H2) in the simulation with oscillating SA.
Comparison of the NOx for the transient simulation and the experiment
At first, it should be noted that a one-to-one quantitative comparison between the concentrations in the simulation and the experiment “pellet2” is not possible. The inlet conditions of the transient simulation were derived from the experimental data of “pellet1” (non-oscillating SA) while in practice, the inlet conditions at the pcc for experiment “pellet 2” slightly different, as it is presented in the raw gas concentration above the fuel bed (comparison of concentrations in Figure 8 and Figure 9, left). For the oscillating case (“pellet2”), a higher mass flow of volatiles leaves the fuel bed (the balanced signal shows a higher slope), resulting also in a different gas composition at the pcc inlet. However, the NOx concentration in the clean gas for both experiments is very similar with 1121.34 mg/m3-dry-11%-O2 (“pellet2”, an average of 3–5 min, before oscillation starts; attention: the values are calculated to 11% of oxygen) and 1006.23 mg/m3-dry-11%-O2. For the simulation, the NOx concentration under non-oscillating conditions is about 1479 mg/m3- dry-11%-O2.
The NOx concentration with oscillating SA is 564 mg/m3-dry-11%-O2, i.e., it is 50% and 44% lower than under non-oscillating conditions. In the simulation, the time-averaged NOx concentration with oscillating SA is 1035 mg/m3-dry-11%-O2. Because of a higher concentration under non-oscillating conditions, the concentration under oscillating conditions is higher as well. Nonetheless, the amount of which NOx is reduced due to the oscillation airflow can still be compared. The NOx reduction in the simulation is 30.0% and agrees reasonably well with the experimental data. The order of magnitude to reduce NO is determined significantly by
- (a)
- the size of the reduction zone,
- (b)
- the residence time in the reduction zone and
- (c)
- the stoichiometry inside the reduction zone.
Due to the idealized sinusoidal progression of the SA flow rate, these conditions probably differ between experiment and simulation. Nonetheless, the fundamental impact of the oscillating SA on the formation and reduction of NOx in the pcc is reflected in the simulation, and the experimental trends are confirmed. Further improvements could also be achieved by using a more detailed reaction mechanism to cover a broader range of thermos-chemical compositions, which occur in the pcc due to the SL oscillation. This would then in turn result in longer simulation times.
It is expected that with further fine-tuning of the flue gas inlet conditions and the progression of the SA flow rate, the calculated NOx concentrations will be in better agreement with the experimental values.
5. Conclusions
Waste wood combustion is characterized by an uneven ignition and combustion behavior. The heterogeneity results from fine particles in the fuel, locally reducing the permeability of the combusting bulk. The low reduction in nitrogen oxides is presumably due to uneven combustion: There are combustion phases in which the oxygen content above the solid material is zero; during these times, low NOx concentrations are measured in the clean gas. If, on the other hand, the oxygen content in the raw gas increases, the NOx concentration increases, too.
To minimize these effects, pellets were produced from the fuel. The pellets show a much more even, but significantly faster combustion due to the lower moisture content and a lower bulk density.
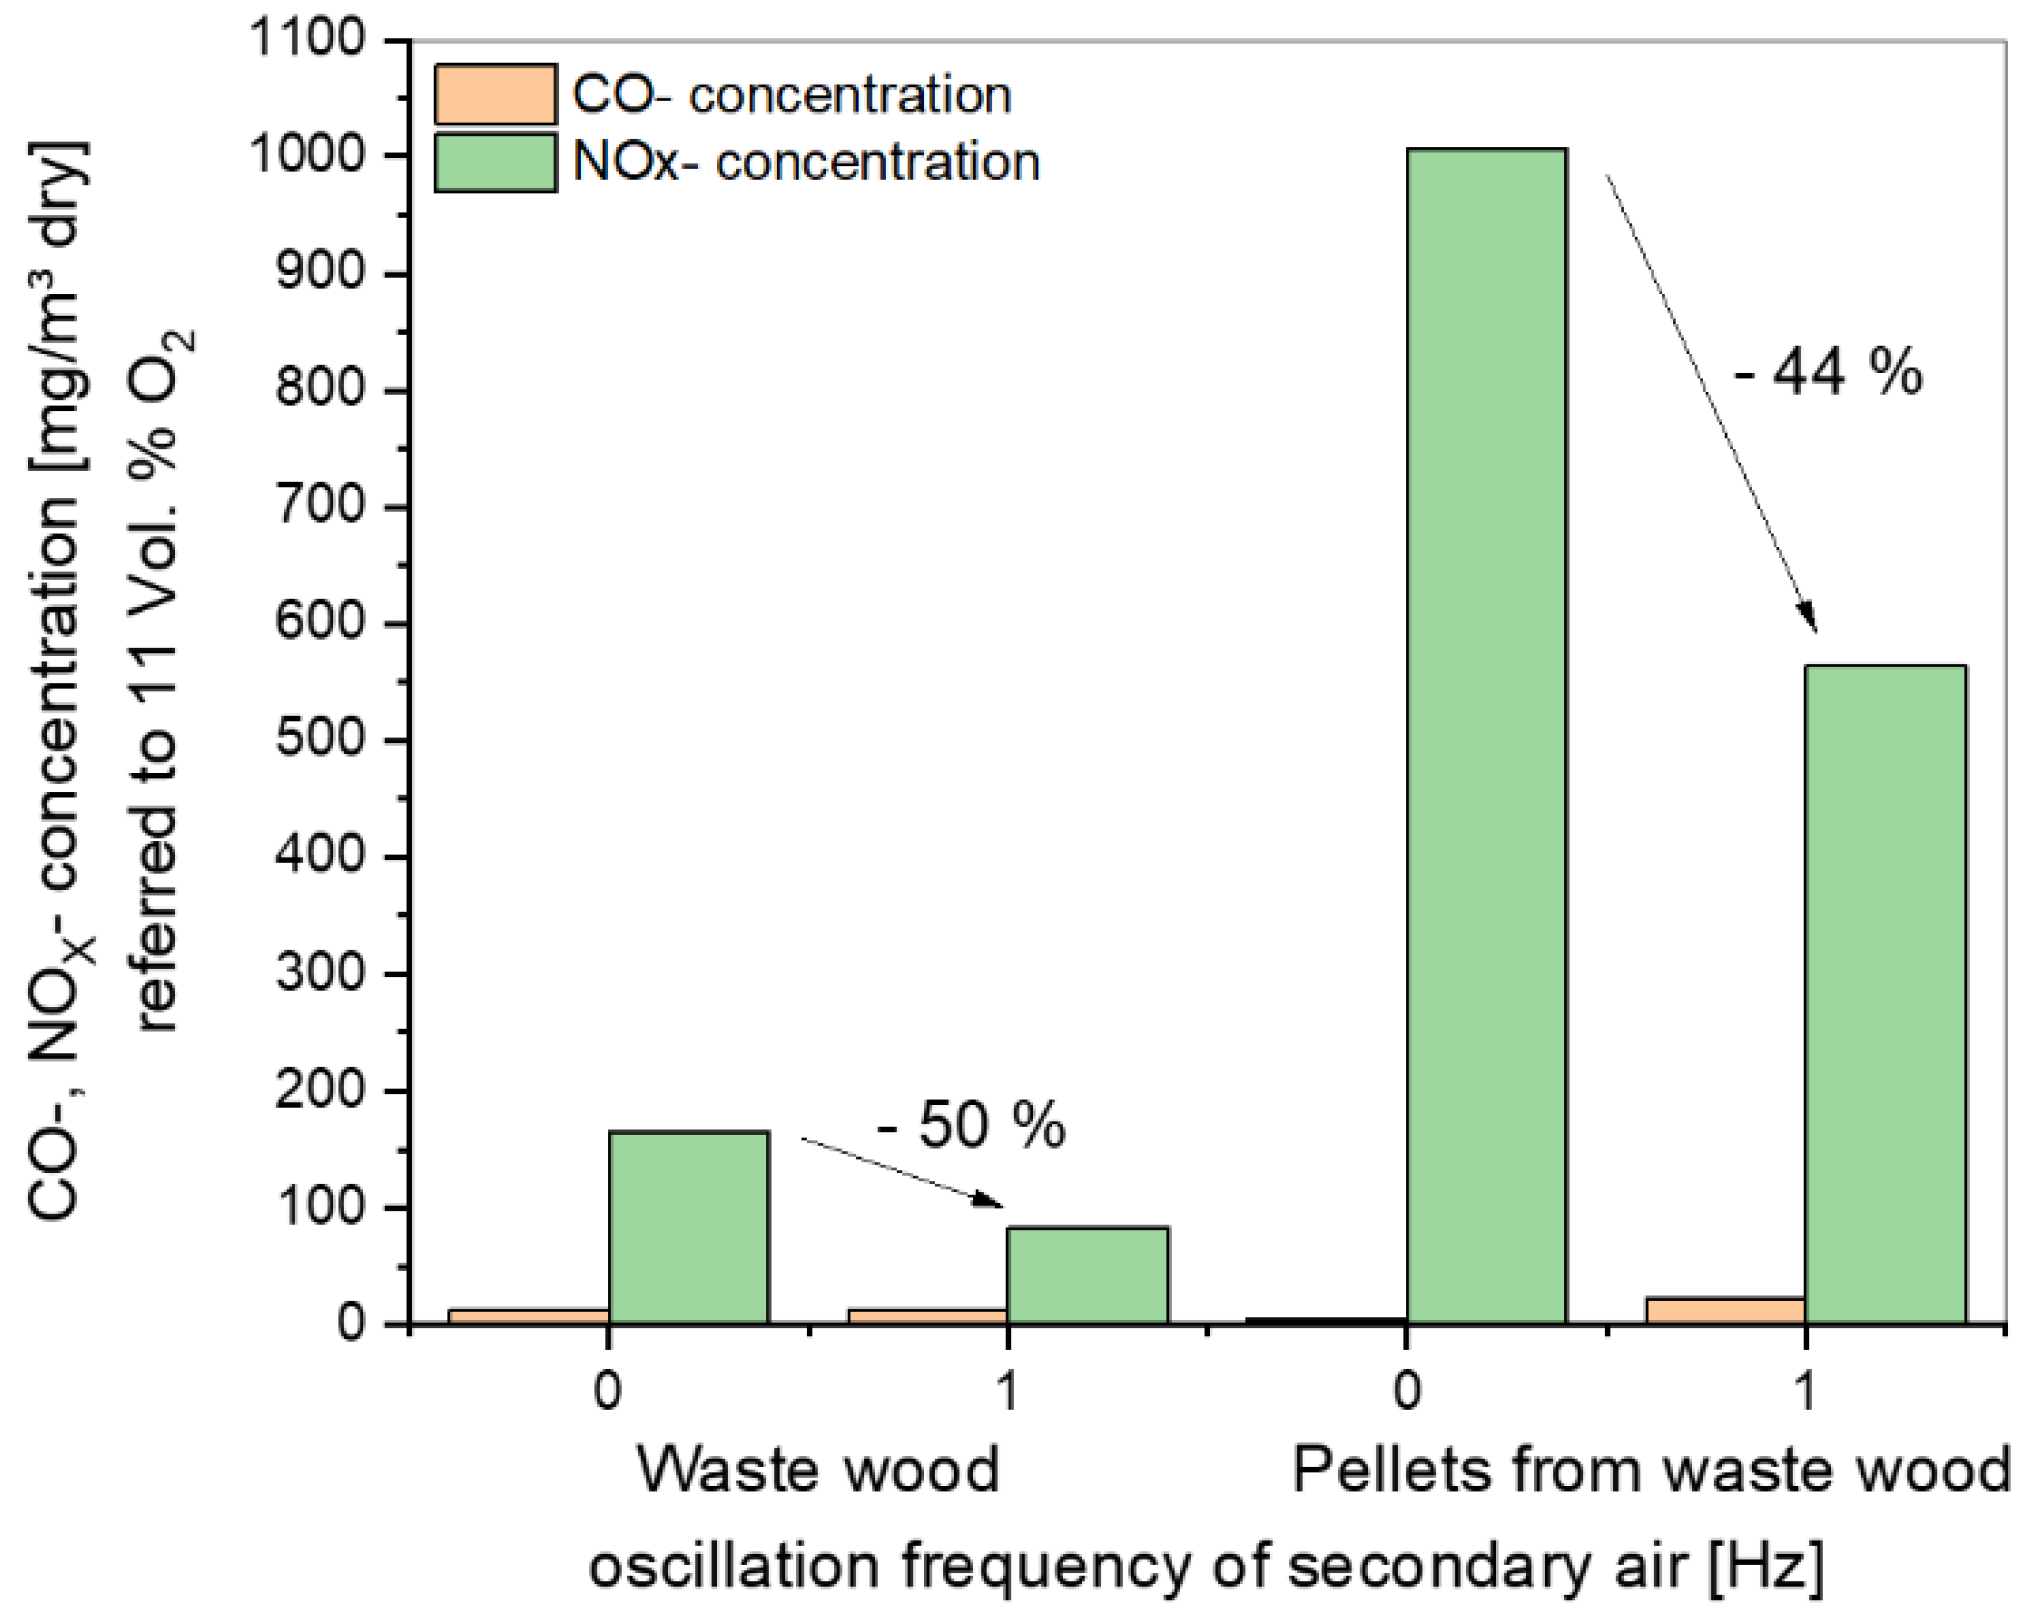
A comparison of CO and NOx concentrations as a function of the oscillation frequency of secondary air is shown in Figure 12. For comparison, all values were normalized to a standard O2 content of 11 vol.%.
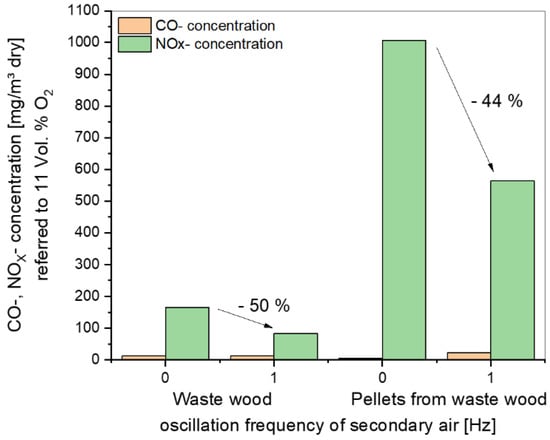
Figure 12.
Summary plot of the CO and NOx concentrations as a function of the oscillation frequency of secondary air for the experimental data.
The positive influence of oscillation on the reduction of NOx concentrations can be seen for both materials, but in the case of waste wood, the results must be considered separately for the effect of air staging and oscillation. With a frequency of 1 Hz for the pelletized material, the CO increased slightly. Here an optimization of CO and NOx has to be considered to get the best frequency for both species.
The simulation model utilizes a detailed kinetic mechanism to calculate NOx formation. The good agreement with the experimental case without oscillating SA shows that the modeling approach is generally well suited to describe the combustion of the flue gas and the formation of NOx in the pcc. Also, for the experimental case with oscillating SA, the trend of the NOx reduction is successfully reflected by the simulation.
Considering both, the results from the experiment and the simulation, oscillating SA as a means to reduce NOx seems to be a promising method and an alternative to other technologies like SNCR or SCR.
6. Discussion/Outlook
In the amendments to the 13th Federal Environmental Impact Protection Ordinance and the 17th Federal Environmental Impact Protection Ordinance and the present Clean Air Regulations, the NOx limits have been adapted to the state of technical development in furnace technology and flue gas cleaning and are reduced accordingly. Nitrogen oxides can be reduced by primary and secondary measures. Where primary measures reduce NOx already in the raw gas after the addition of secondary air in two-stage processes to a level below the limit, this saves expenses for secondary measures, such as SNCR or SCR technologies. A process has been developed and filed for a patent at KIT where, in a two-stage process, oscillating addition of secondary air allowed nitrogen oxide concentrations to be reduced, at simultaneously low CO contents in the flue gas, by some 50% compared to conventional air staging.
In principle, this process can be employed in all multi-stage combustion processes using lumpy, liquid, and gaseous fuels. Currently, a project has started to investigate the NOx reduction with oscillation for NH3 combustion as a carbon-free fuel together with the “Gas-Wärme-Institut” in Essen [34].
At present, our cooperation partner is studying the transferability of the concept to an industrial scale within a research project [35]. Because of the larger volumes of the flow ducts and the volume flows to be switched, imposing a specific oscillation is technically ambitious. Application of the oscillation must not cause any undesirable effects in the plant, such as increased noise level or vibrations of components.
The actual facility generating the oscillation also must have high availability and reliability. Because of the oscillation frequency, the large volume flows, and the anticipated operating life of the oscillator, such systems as valves or dampers are out of consideration.
7. Patents
PCT announcement https://patentscope.wipo.int/search/en/detail.jsf?docId=WO2017067540.
Author Contributions
H.-J.G., Invention, design of the investigations, patent announcement, analysis, and interpretation of data, draft work. K.A., Literature review, cover letter, analysis of particle size distribution, evaluation of data, wording. M.H., Operation of KLEAA, providing experimental data and preparation of the figures. D.S., Critical review and scientific discussions. B.J., Simulation set-up, Data-evaluation, writing. S.W., Critical review, and scientific discussions. V.S., Critical review and scientific discussions. P.D., Discussion, and technical outlook. G.P., Discussion and technical outlook. All authors have read and agreed to the published version of the manuscript.
Funding
This research was funded by the Federal Ministry of Education and Research of Germany (BMBF) via the project “Reduktion der NOx-Emissionen in Kleinfeuerungsanlagen zur energetischen Biomassenutzung durch oszillierende Verbrennungsluftzufuhr”, grants 01LY1823A, 01LY1823B and 01LY1823C.
Institutional Review Board Statement
Not applicable.
Informed Consent Statement
Not applicable.
Data Availability Statement
The results generated in this study are scheduled for industrial scale validation at a combustion facility at our industrial partner POLZENITH GmbH &Co. KG. Prior to this matter data are available on request.
Acknowledgments
The authors would like to thank Reis for his technical support. The authors acknowledge the financial support by the Federal Ministry of Education and Research of Germany (BMBF) in the project “Reduktion der NOx-Emissionen in Kleinfeuerungsanlagen zur energetischen Biomassenutzung durch oszillierende Verbrennungsluftzufuhr”, via grants 01LY1823A, 01LY1823B and 01LY1823C. We acknowledge support from the KIT-Publication Fund of the Karlsruhe Institute of Technology.
Conflicts of Interest
The authors declare no conflict of interest. The funders had no role in the design of the study; in the collection, analyses, or interpretation of data; in the writing of the manuscript, or in the decision to publish the results.
References
- Available online: https://www.delphi.com/sites/default/files/2020-04/DELPHI%20booklet%20emission%20passenger%20cars%202020%20online%20complet.pdf (accessed on 7 December 2021).
- Koger, S. Reaktionskinetische Untersuchungen zur Umwandlung stickstoffhaltiger Gaskomponenten unter Bedingungen der Abfallverbrennung; KIT Scientific Publishing: Karlsruhe, Germany, 2010. [Google Scholar]
- The Medium Combustion Plant Directive. Available online: https://ec.europa.eu/environment/industry/stationary/mcp.htm (accessed on 6 December 2021).
- Jolibois, N.; Aleksandrov, K.; Hauser, M.; Stapf, D.; Seifert, H.; Matthes, J.; Waibel, P.; Vogelbacher, M.; Keller, H.B.; Gehrmann, H.-J. Analysis of Oscillating Combustion for NOx Reduction in Pulverized Fuel Boilers. Inventions 2021, 6, 9. [Google Scholar] [CrossRef]
- Freudenmann, T.; Gehrmann, H.-J.; Aleksandrov, K.; El-Haji, M.; Stapf, D. Hybrid Models for Efficient Control, Optimization, and Monitoring of Thermo-Chemical Processes and Plants. Processes 2021, 9, 515. [Google Scholar] [CrossRef]
- Stapf, D. Experimentell basierte Weiterentwicklung von Berechnungsmodellen der NOx-Emission technischer Verbrennungssysteme. In Fortschrittsberichte VDI. 1998; VDI-Verlag: Düsseldorf, Germany, 1998. [Google Scholar]
- Miller, J.A.; Bowman, C.T. Mechanism and modeling of nitrogen chemistry in combustion. Prog. Energy Combust. Sci. 1989, 15, 287–338. [Google Scholar] [CrossRef]
- Beckmann, M. Beschreibung Unterschiedlicher Techniken und deren Entwicklungspotentiale zur Minderung von Stickstoffoxiden im Abgas von Abfallverbrennungsanlagen. und Ersatzbrennstoff-Kraftwerken Hinsichtlich Leistungsfähigkeit, Kosten und Energieverbrauch, Dessau-Roßlau, 2011. Available online: https://www.umweltbundesamt.de/publikationen/beschreibung-unterschiedlicher-techniken-deren (accessed on 6 December 2021).
- Gehrmann, H.-J.; Baris, D.; Stapf, D.; Seifert, H.; Zorbach, I. Stickoxidminderung durch oszillatorische Verbrennung bei der Rostfeuerung. Energ. Aus Abfall Bd. 2018, 15, 243–253. [Google Scholar]
- Freudenmann, T.; Gehrmann, H.-J.; El-Haji, M.; Stapf, D. Hybridmodelle zur effizienten Regelung, Optimierung und Überwachung von thermo-chemischen Prozessen und Anlagen am Beispiel der oszillierenden Verbrennung. In Proceedings of the 29 Deutscher Flammentag, 29 Deutscher Flammentag, Bochum, Germany, 17–18 September 2019. [Google Scholar]
- Cho, H.; Cho, K.W.; Kim, H.J. NOx Emission Characteristics in Radiant Tube Burner with Oscillating Combustion Technology. Trans. Korean Soc. Mech. Eng. B 2008, 32, 100–106. [Google Scholar] [CrossRef]
- Scherello, A.; Konold, U.; Flamme, M.; Kremer, H. Experimentelle Untersuchung zum Einfluss der oszillierenden Verbrennung auf die Wärmeübertragung und die Stickoxidemissionen vom Gasflammen; Final Report af an AiF-Project; Gaswärme-Institut: Essen, Germany, 2002. [Google Scholar]
- Wagner, J.C. NOx Emission Reduction by Oscillating Combustion. Final Report GTI Project No. 61111; Gas Technology Institute: Des Plaines, IL, USA, 2004. [Google Scholar]
- Mätzing, H.; Gehrmann, H.-J.; Seifert, H.; Stapf, D. Modelling grate combustion of biomass and low rank fuels with CFD application. Waste Manag. 2018, 78, 686–697. [Google Scholar] [CrossRef] [PubMed]
- Gehrmann, H.-J.; Mätzing, H.; Nowak, P.; Baris, D.; Seifert, H.; Dupont, C.; Defoort, F.; Peyrot, M.; Castagno, F. Waste wood characterization and combustion behaviour in pilot lab scale. J. Energy Inst. 2020, 93, 1634–1641. [Google Scholar] [CrossRef]
- Ansys® Fluent, Release 17.2, Ansys Fluent Theory Guide; ANSYS, Inc.: Canonsburg, PA, USA, 2016.
- Peters, N. Laminar Flamelet Concepts in Turbulent Combustion. Combust. Inst. 1986, 21, 1231–1250. [Google Scholar] [CrossRef]
- Peters, N. Laminar Diffusion Flamelet Models in Non Premixed Combustion. Prog. Energy Combust. Sci. 1984, 10, 319–339. [Google Scholar] [CrossRef]
- Bray, K.N.; Peters, N. Laminar Flamelets in Turbulent Flames. In Turbulent Reacting Flows; Libby, P.A., Williams, F.A., Eds.; Elsevier Academic Press: Amsterdam, The Netherlands, 1994; pp. 63–114. [Google Scholar]
- Magnussen, B.F. On the Structure of Turbulence and a Generalized Eddy Dissipation Concept for Chemical Reaction in Turbulent Flow. In Proceedings of the Nineteenth AIAA Meeting, St. Louise, MO, USA, 12–15 January 1981. [Google Scholar]
- Pope, S.B. Computationally efficient implementation of combustion chemistry using in-situ adaptive tabulation. Combust. Theory Model. 1997, 1, 41–63. [Google Scholar] [CrossRef]
- Buchmayr, M.; Gruber, J.; Hargassner, M.; Hochenauer, C. Performance analysis of a steady flamelet model for the use in small-scale biomass combustion under extreme air-staged conditions. J. Energy Inst. 2017, 91, 534–548. [Google Scholar] [CrossRef]
- De Soete, G.G. Overall Reaction Rates of NO and N2 Formation from Fuel Nitrogen. In Proceedings of the 15th Symp. (Int’I.) on Combustion, Tokyo, Japan, 25–31 August 1974. [Google Scholar]
- Brink, A.; Kilpinen, P. A Simplified Kinetic Rate Expression for Describing the Oxidation of Fuel-N in Biomass Combustion; Report 00-10; Process Chemistry Group: Abo Akademi, Finland, 2000. [Google Scholar]
- Mitchell, J.W.; Tarbell, J.M. A Kinetic Model of Nitric Oxide Formation During Pulverized Coal Combustion. AIChE J. 1982, 28, 302–311. [Google Scholar] [CrossRef]
- Glarborg, P.; Miller, J.A.; Ruscic, B.; Klippenstein, S.J. Modeling nitrogen chemistry in combustion. Prog. Energy Combust. Sci. 2018, 67, 31–68. [Google Scholar] [CrossRef] [Green Version]
- Kilpinen, P. Detailed Kinetic Scheme “Kilpinen 97”; Åbo Akademi University-PCG: Turku, Finland, 1997. [Google Scholar]
- Smith, G.P.; Golden, D.M.; Frenklach, M.; Moriarty, N.W.; Eiteneer, B.; Goldenberg, M.; Bowman, C.T.; Hanson, R.K.; Song, S.; Gardiner, W.C., Jr.; et al. Available online: http://combustion.berkeley.edu/gri-mech/version30/text30.html (accessed on 24 November 2021).
- Li, T.; Skreiberg, O.; Lovas, T.; Glarborg, P. Skeletal mechanisms for prediction of NOx emission in solid fuel combustion. Fuel 2019, 254, 115569. [Google Scholar] [CrossRef]
- Goodwin, D.G.; Speth, R.L.; Moffat, H.K.; Weber, B.W. Cantera: An Object-Oriented Software Toolkit for Chemical Kinetics, Thermodynamics, and Transport Processes. Version 2.4. 2021. Available online: https://www.cantera.org (accessed on 2 December 2021).
- Stubenberger, G.; Scharler, R.; Zahirovic, S.; Obernberger, I. Experimental investigation of nitrogen species release from different solid biomass fuels as a basis for release models. Fuel 2008, 87, 793–806. [Google Scholar] [CrossRef]
- Bui-Pham, M.; Seshadri, K. Comparison between experimental measurements and numerical calculations of the structure of heptane-air diffusion flames. Combust. Sci. Technol. 1991, 79, 293–310. [Google Scholar] [CrossRef]
- Pang, K.M.; Ng, H.K.; Gan, S. In-cylinder diesel spray combustion simulations using parallel computation: A performance benchmarking study. Appl. Energy 2012, 93, 466–478. [Google Scholar] [CrossRef]
- Stickoxidminderung bei der Oszillierenden Verbrennung von Ammoniak als Kohlenstofffreiem Energieträger. Available online: https://www.gwiessen.de/fileadmin/dateien/pdf/Forschung/Steckbriefe_lfd._Projekte/Jahr_2021/Projektsteckbrief_AmOszi.pdf (accessed on 6 December 2021).
- BioOszi Reduction of NOx-Emissions in Small Combustion Plants for Energetic Utilization of Biomass via Oscillating Combustion Air Supply. Available online: https://www.itc.kit.edu/downloads/BioOszi_Steckbrief_en_01022019.pdf (accessed on 6 December 2021).

Publisher’s Note: MDPI stays neutral with regard to jurisdictional claims in published maps and institutional affiliations. |
© 2021 by the authors. Licensee MDPI, Basel, Switzerland. This article is an open access article distributed under the terms and conditions of the Creative Commons Attribution (CC BY) license (https://creativecommons.org/licenses/by/4.0/).