
Research on Flow Stability and Vibration of an Industrial Hydraulic Turbine


Abstract
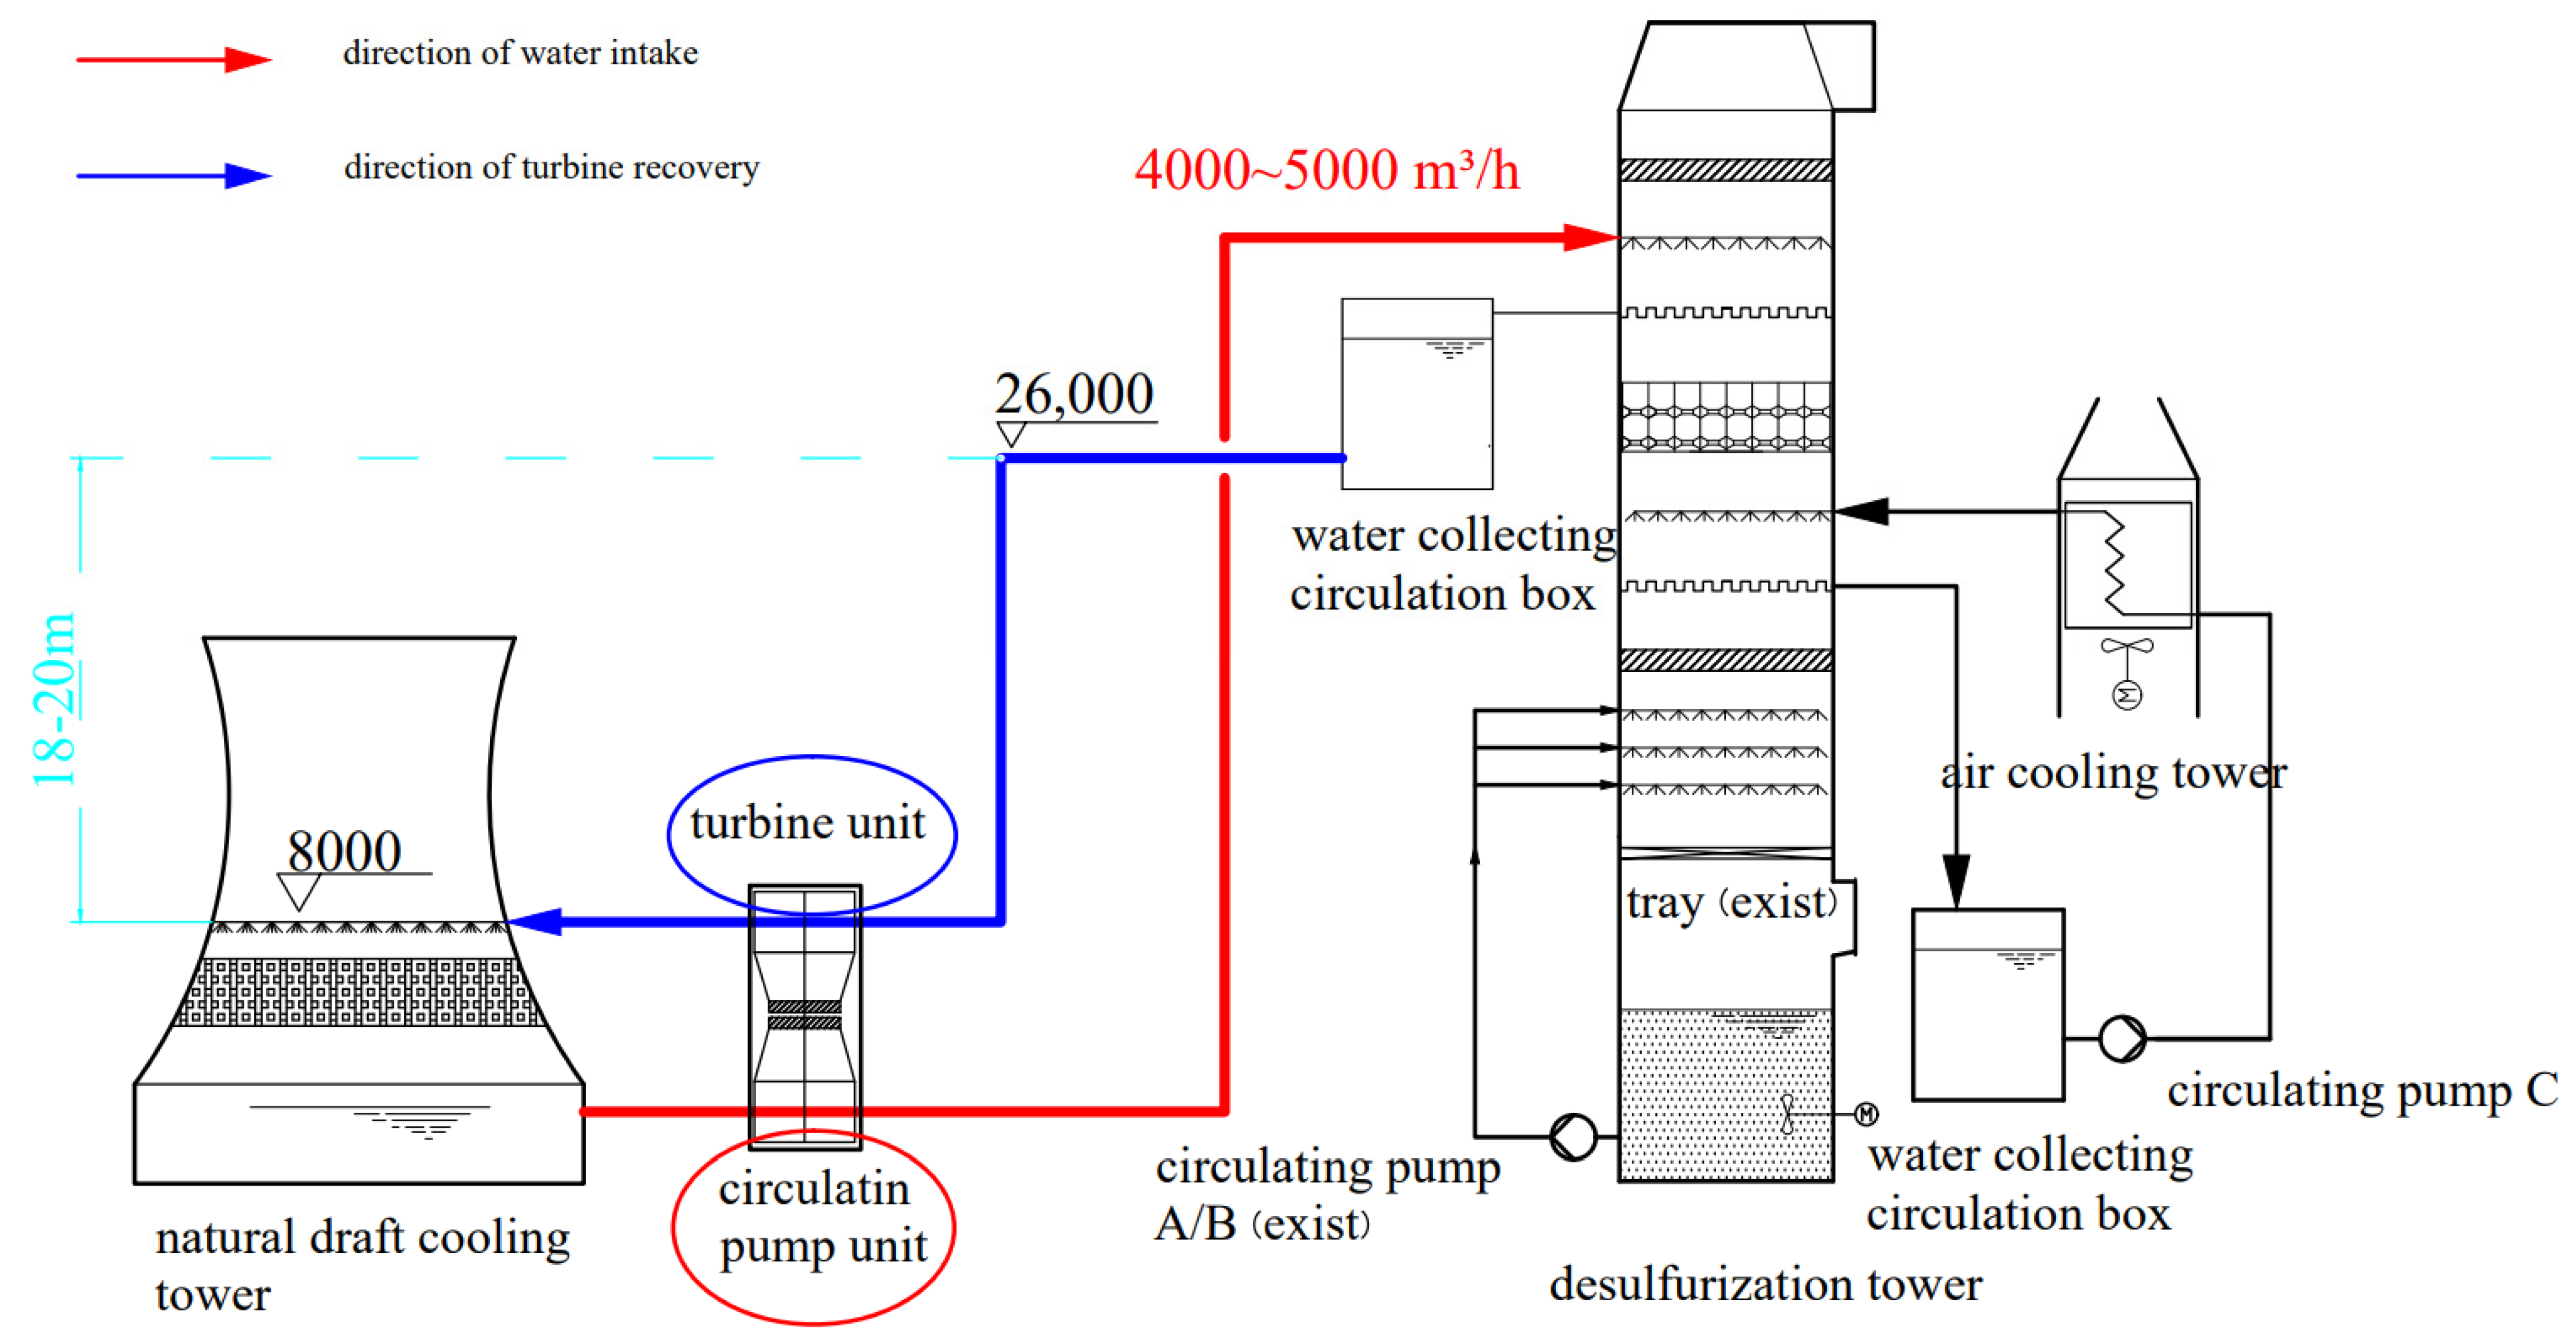
:1. Introduction
2. Research Object and Theoretical Analysis
2.1. Turbine Main Geometric Parameters
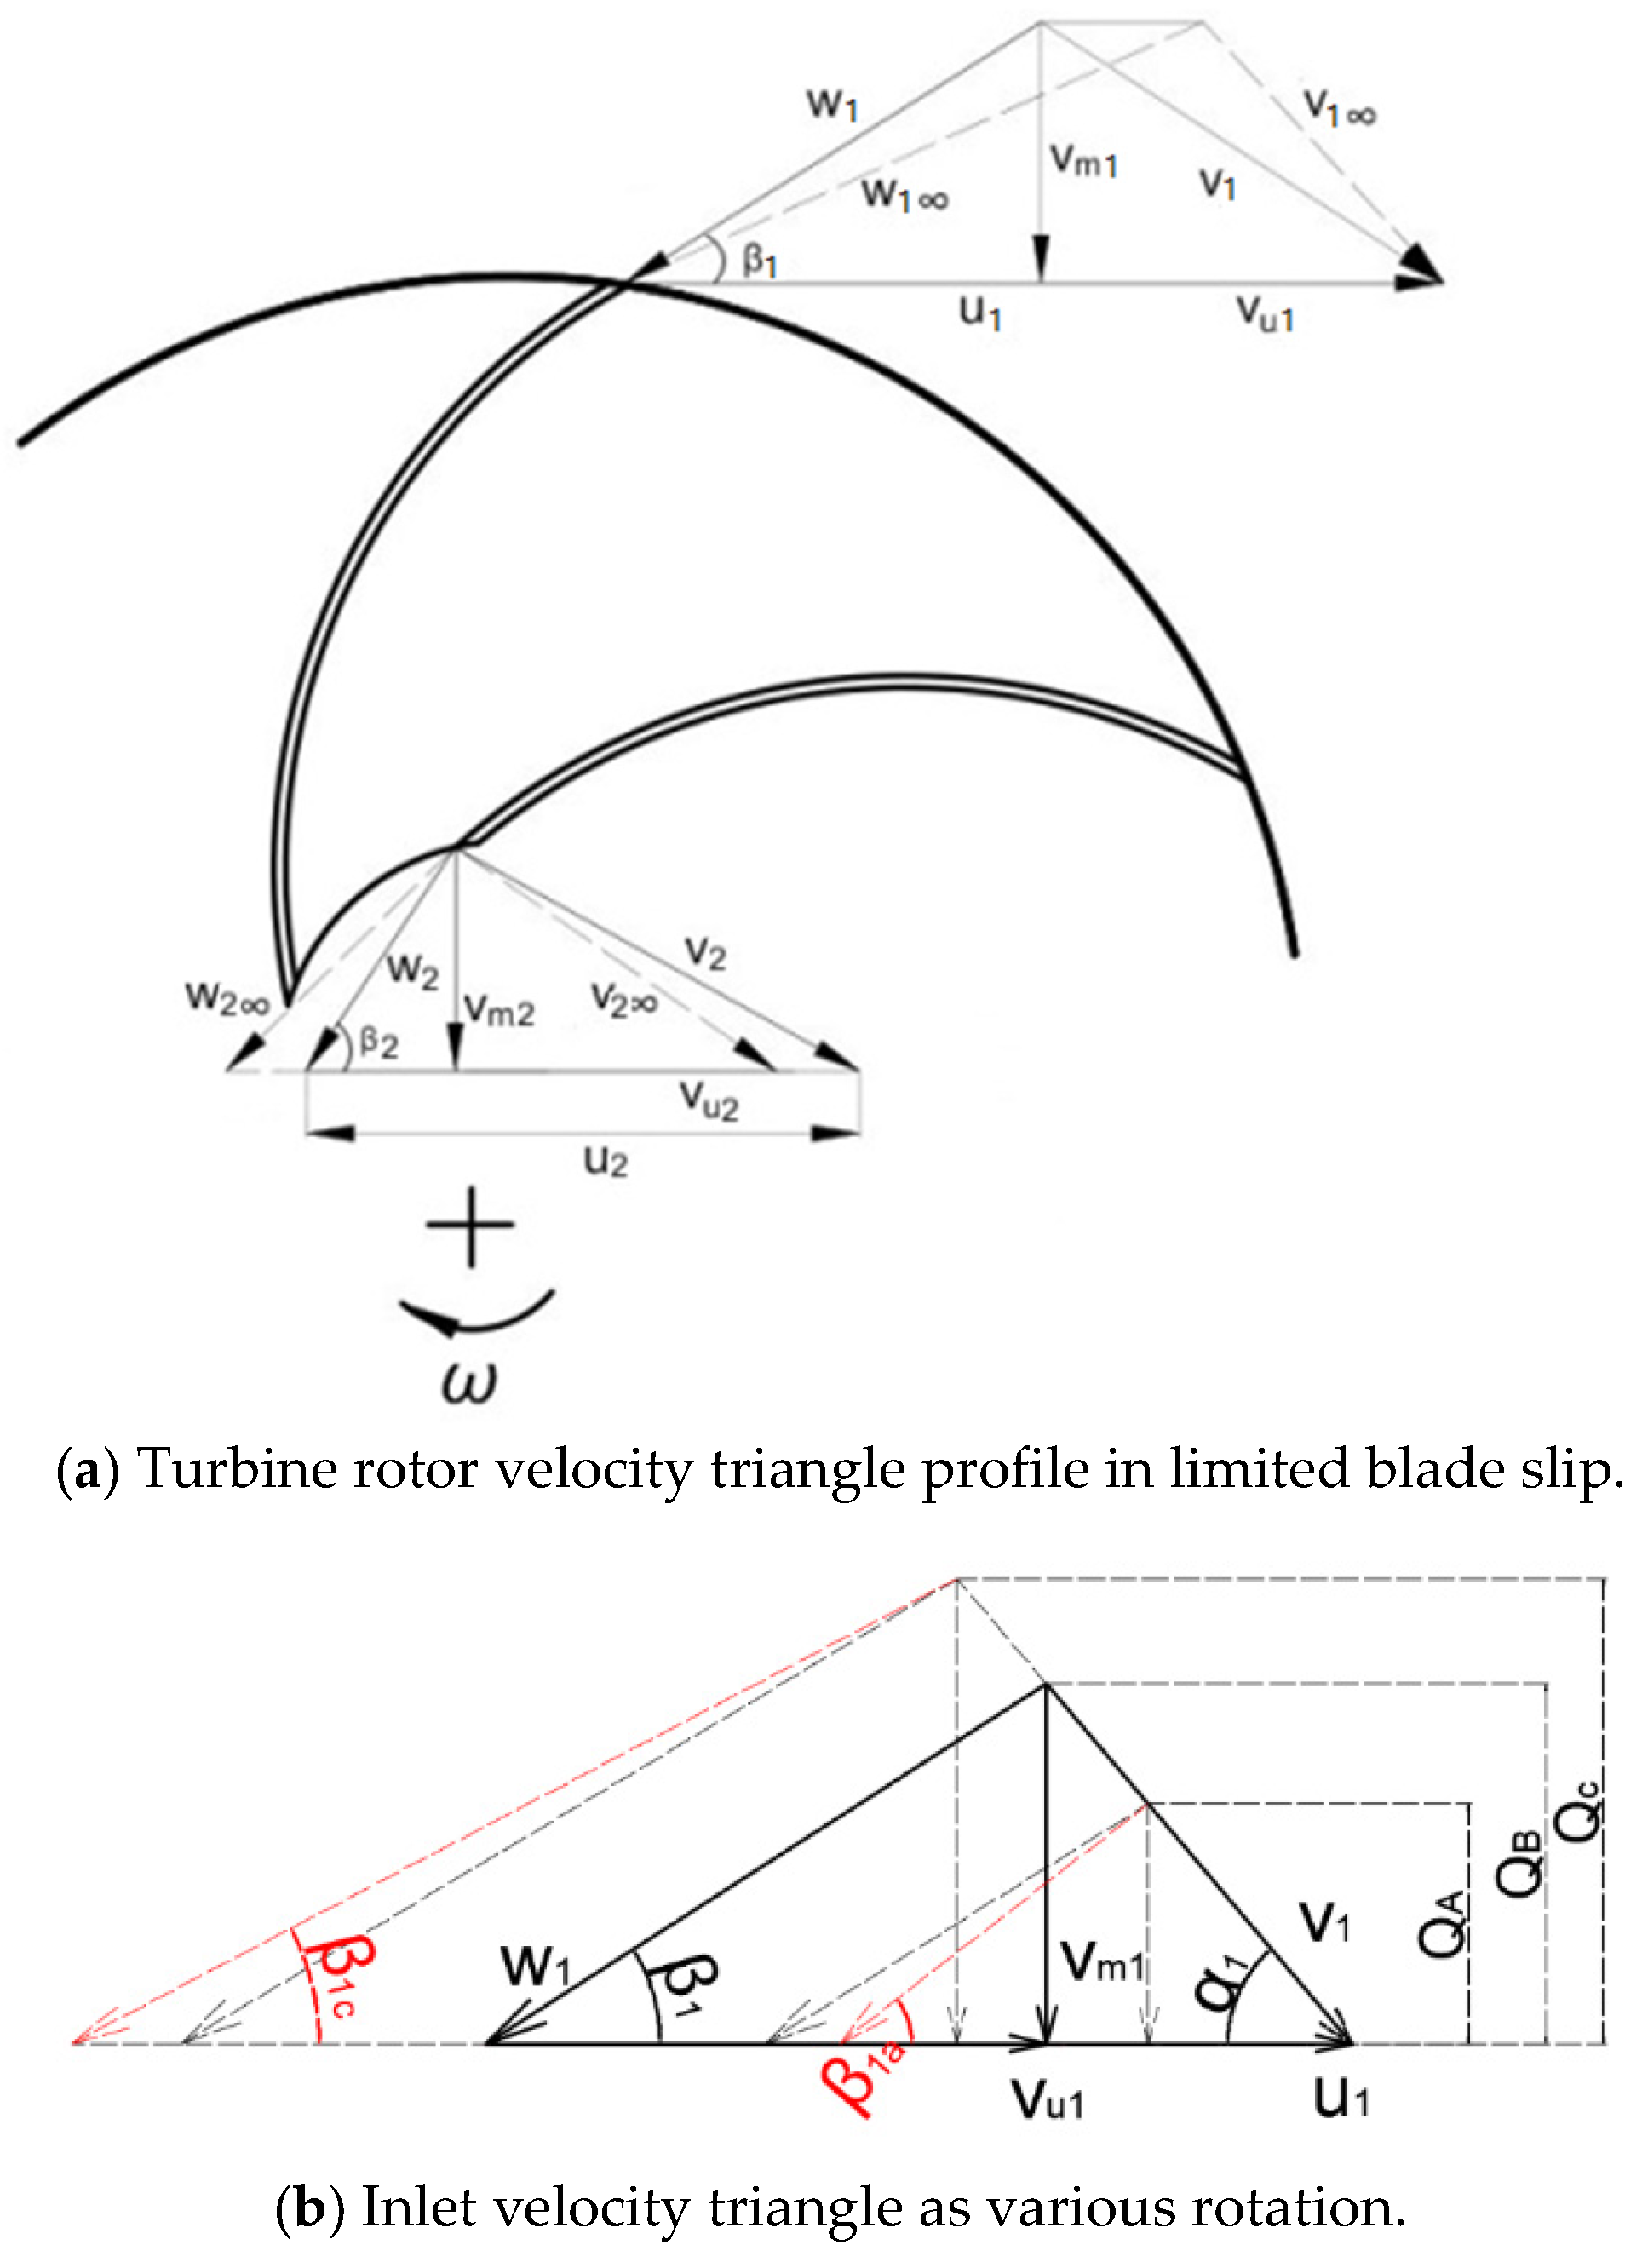
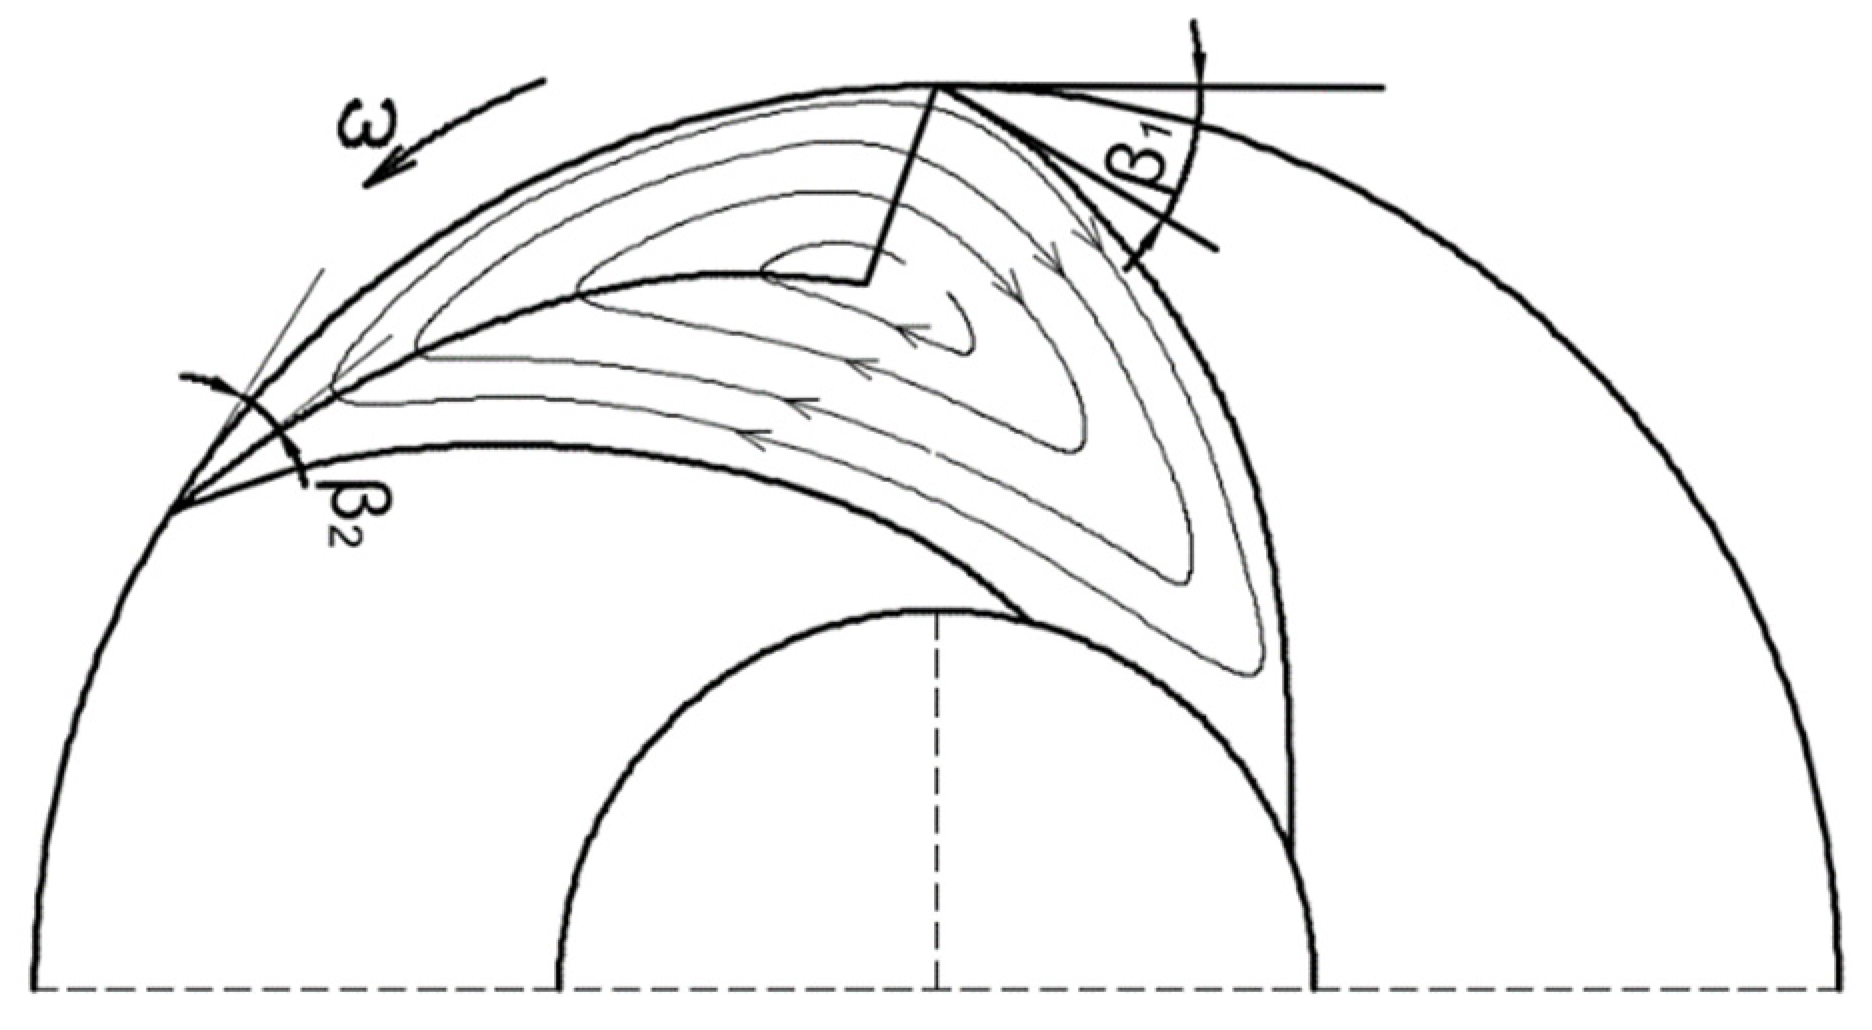
2.2. Theoretical Analysis
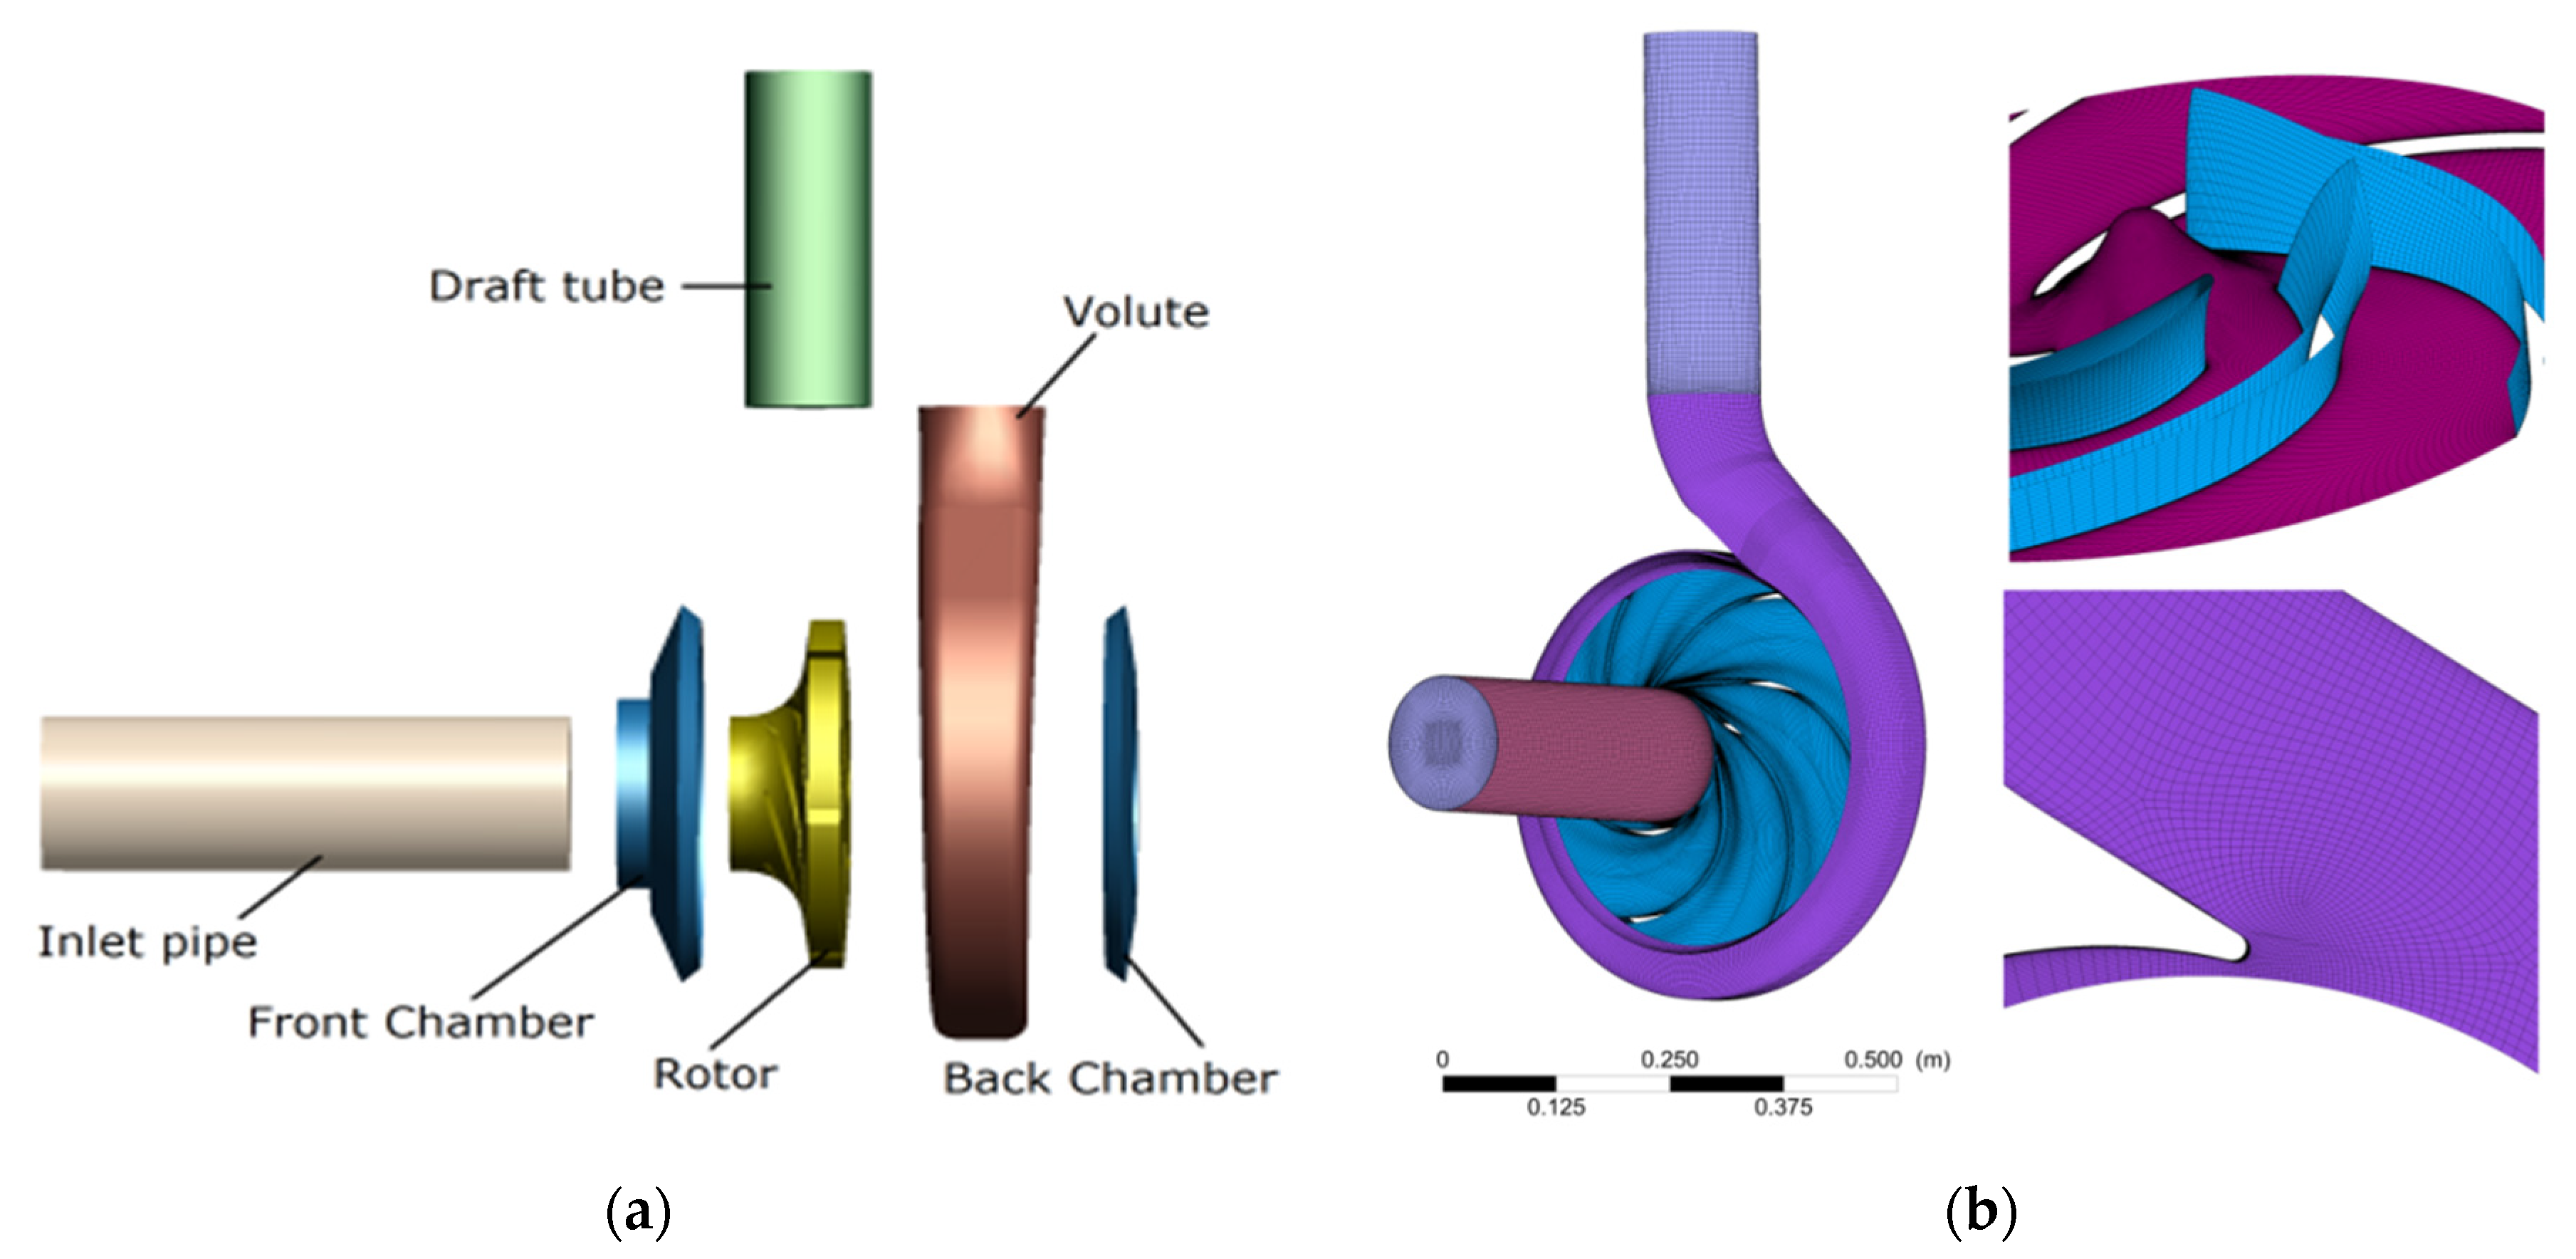
3. Numerical Procedure
3.1. Mesh Generation
3.2. Solution Parameters
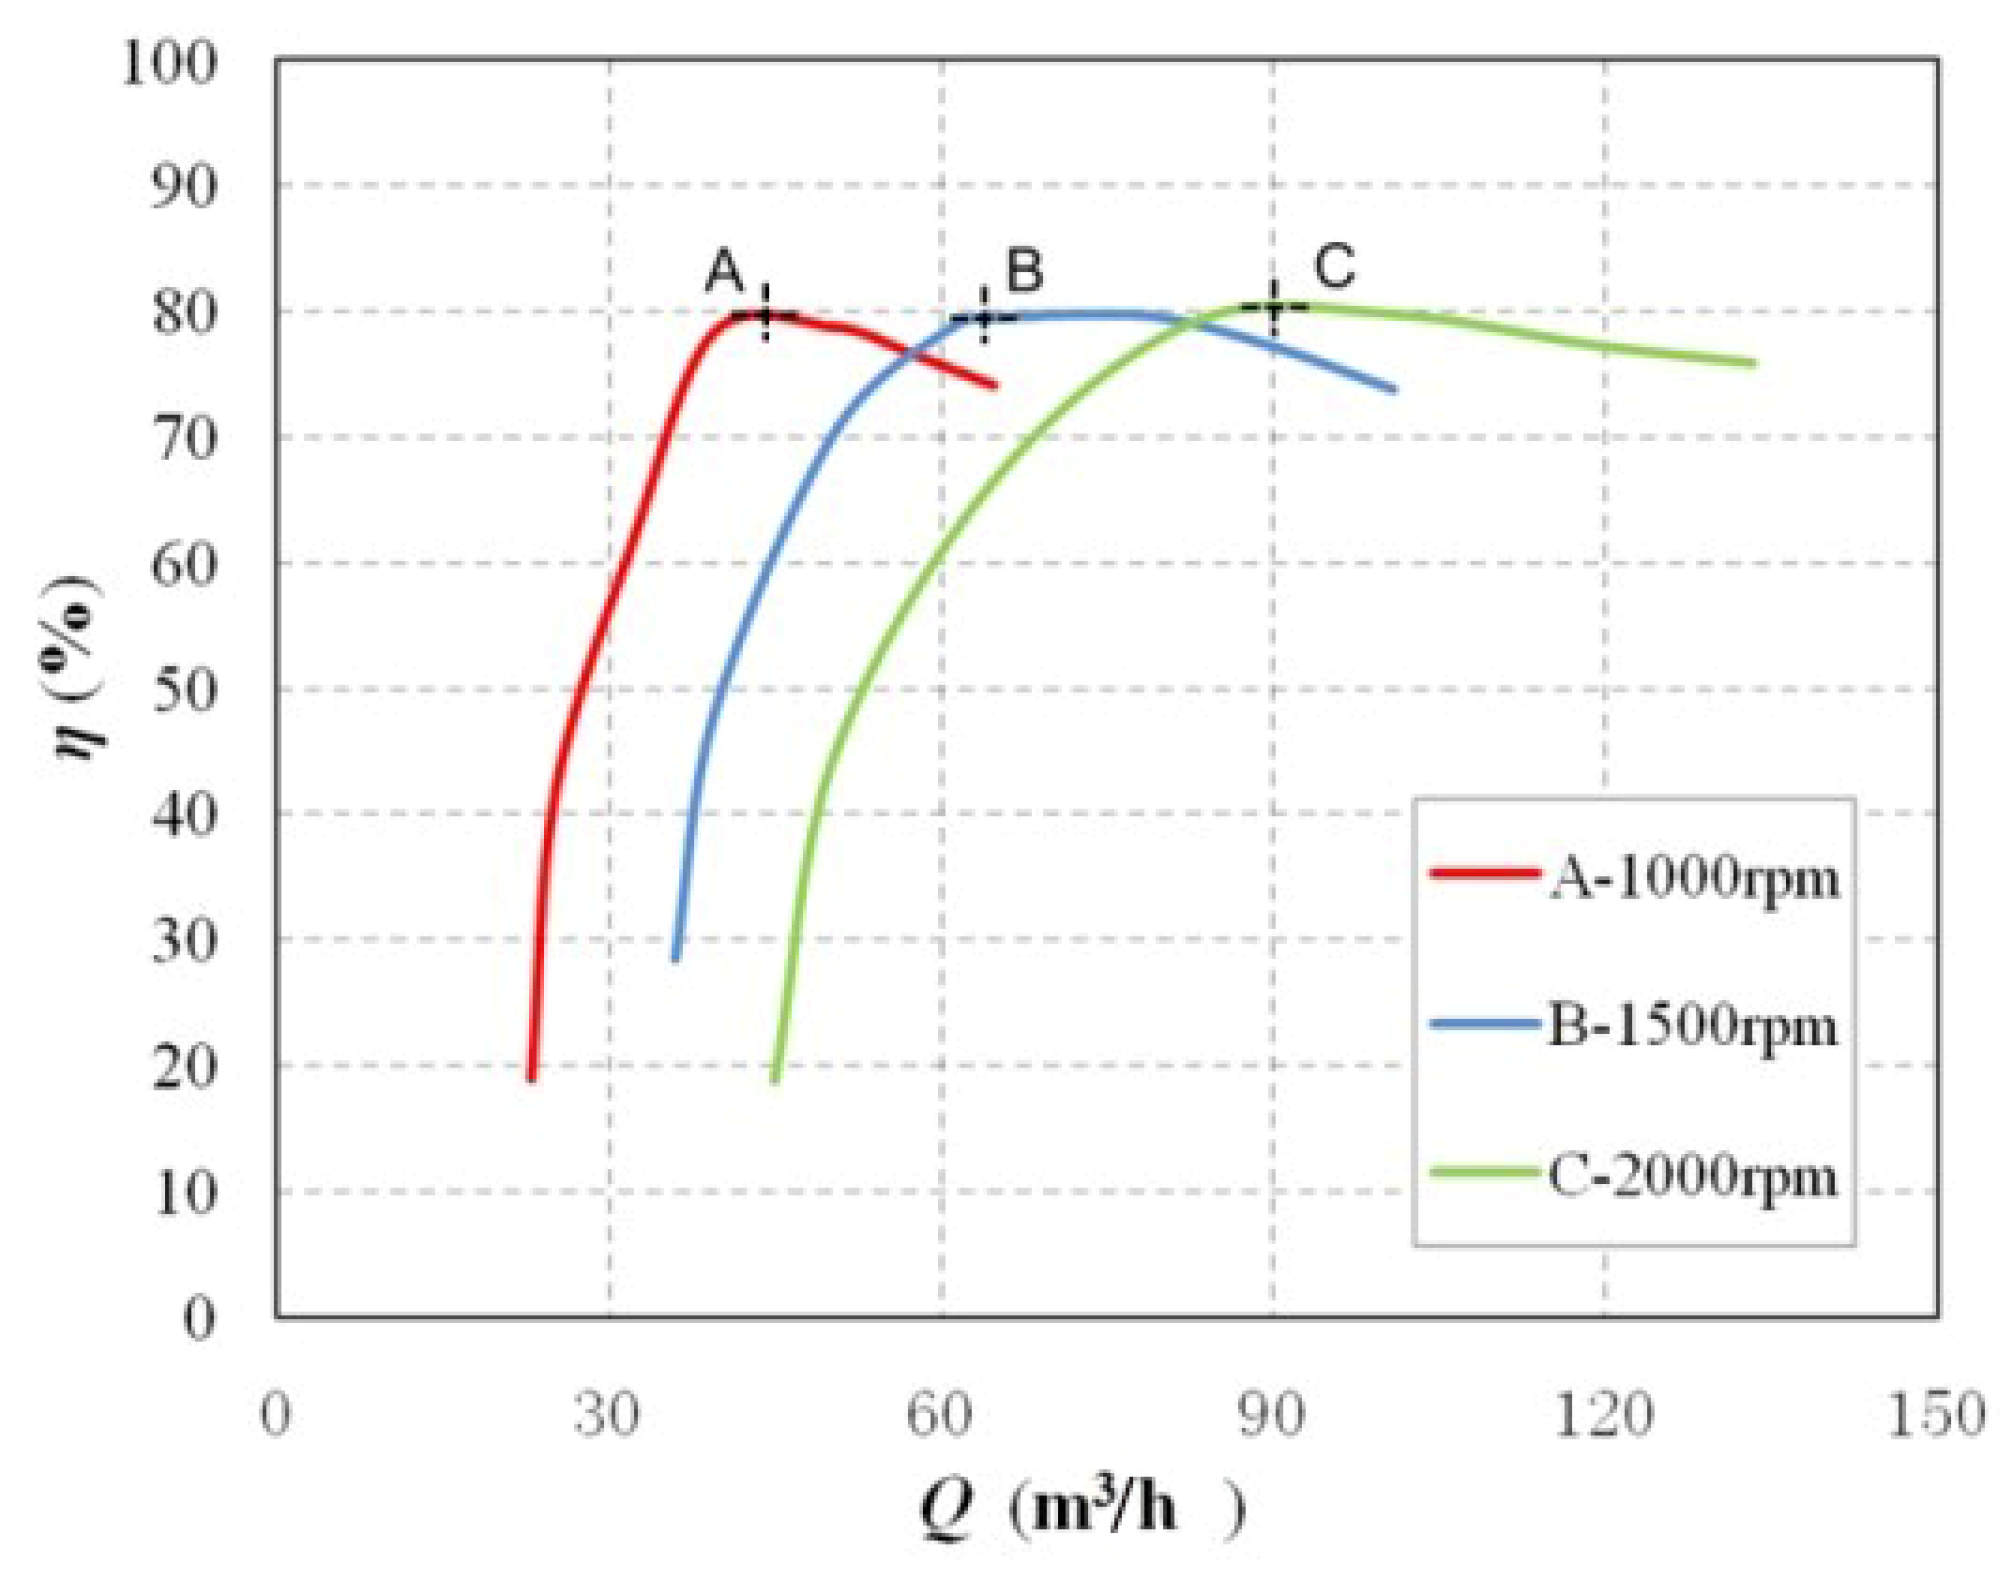
4. Result and Discussion
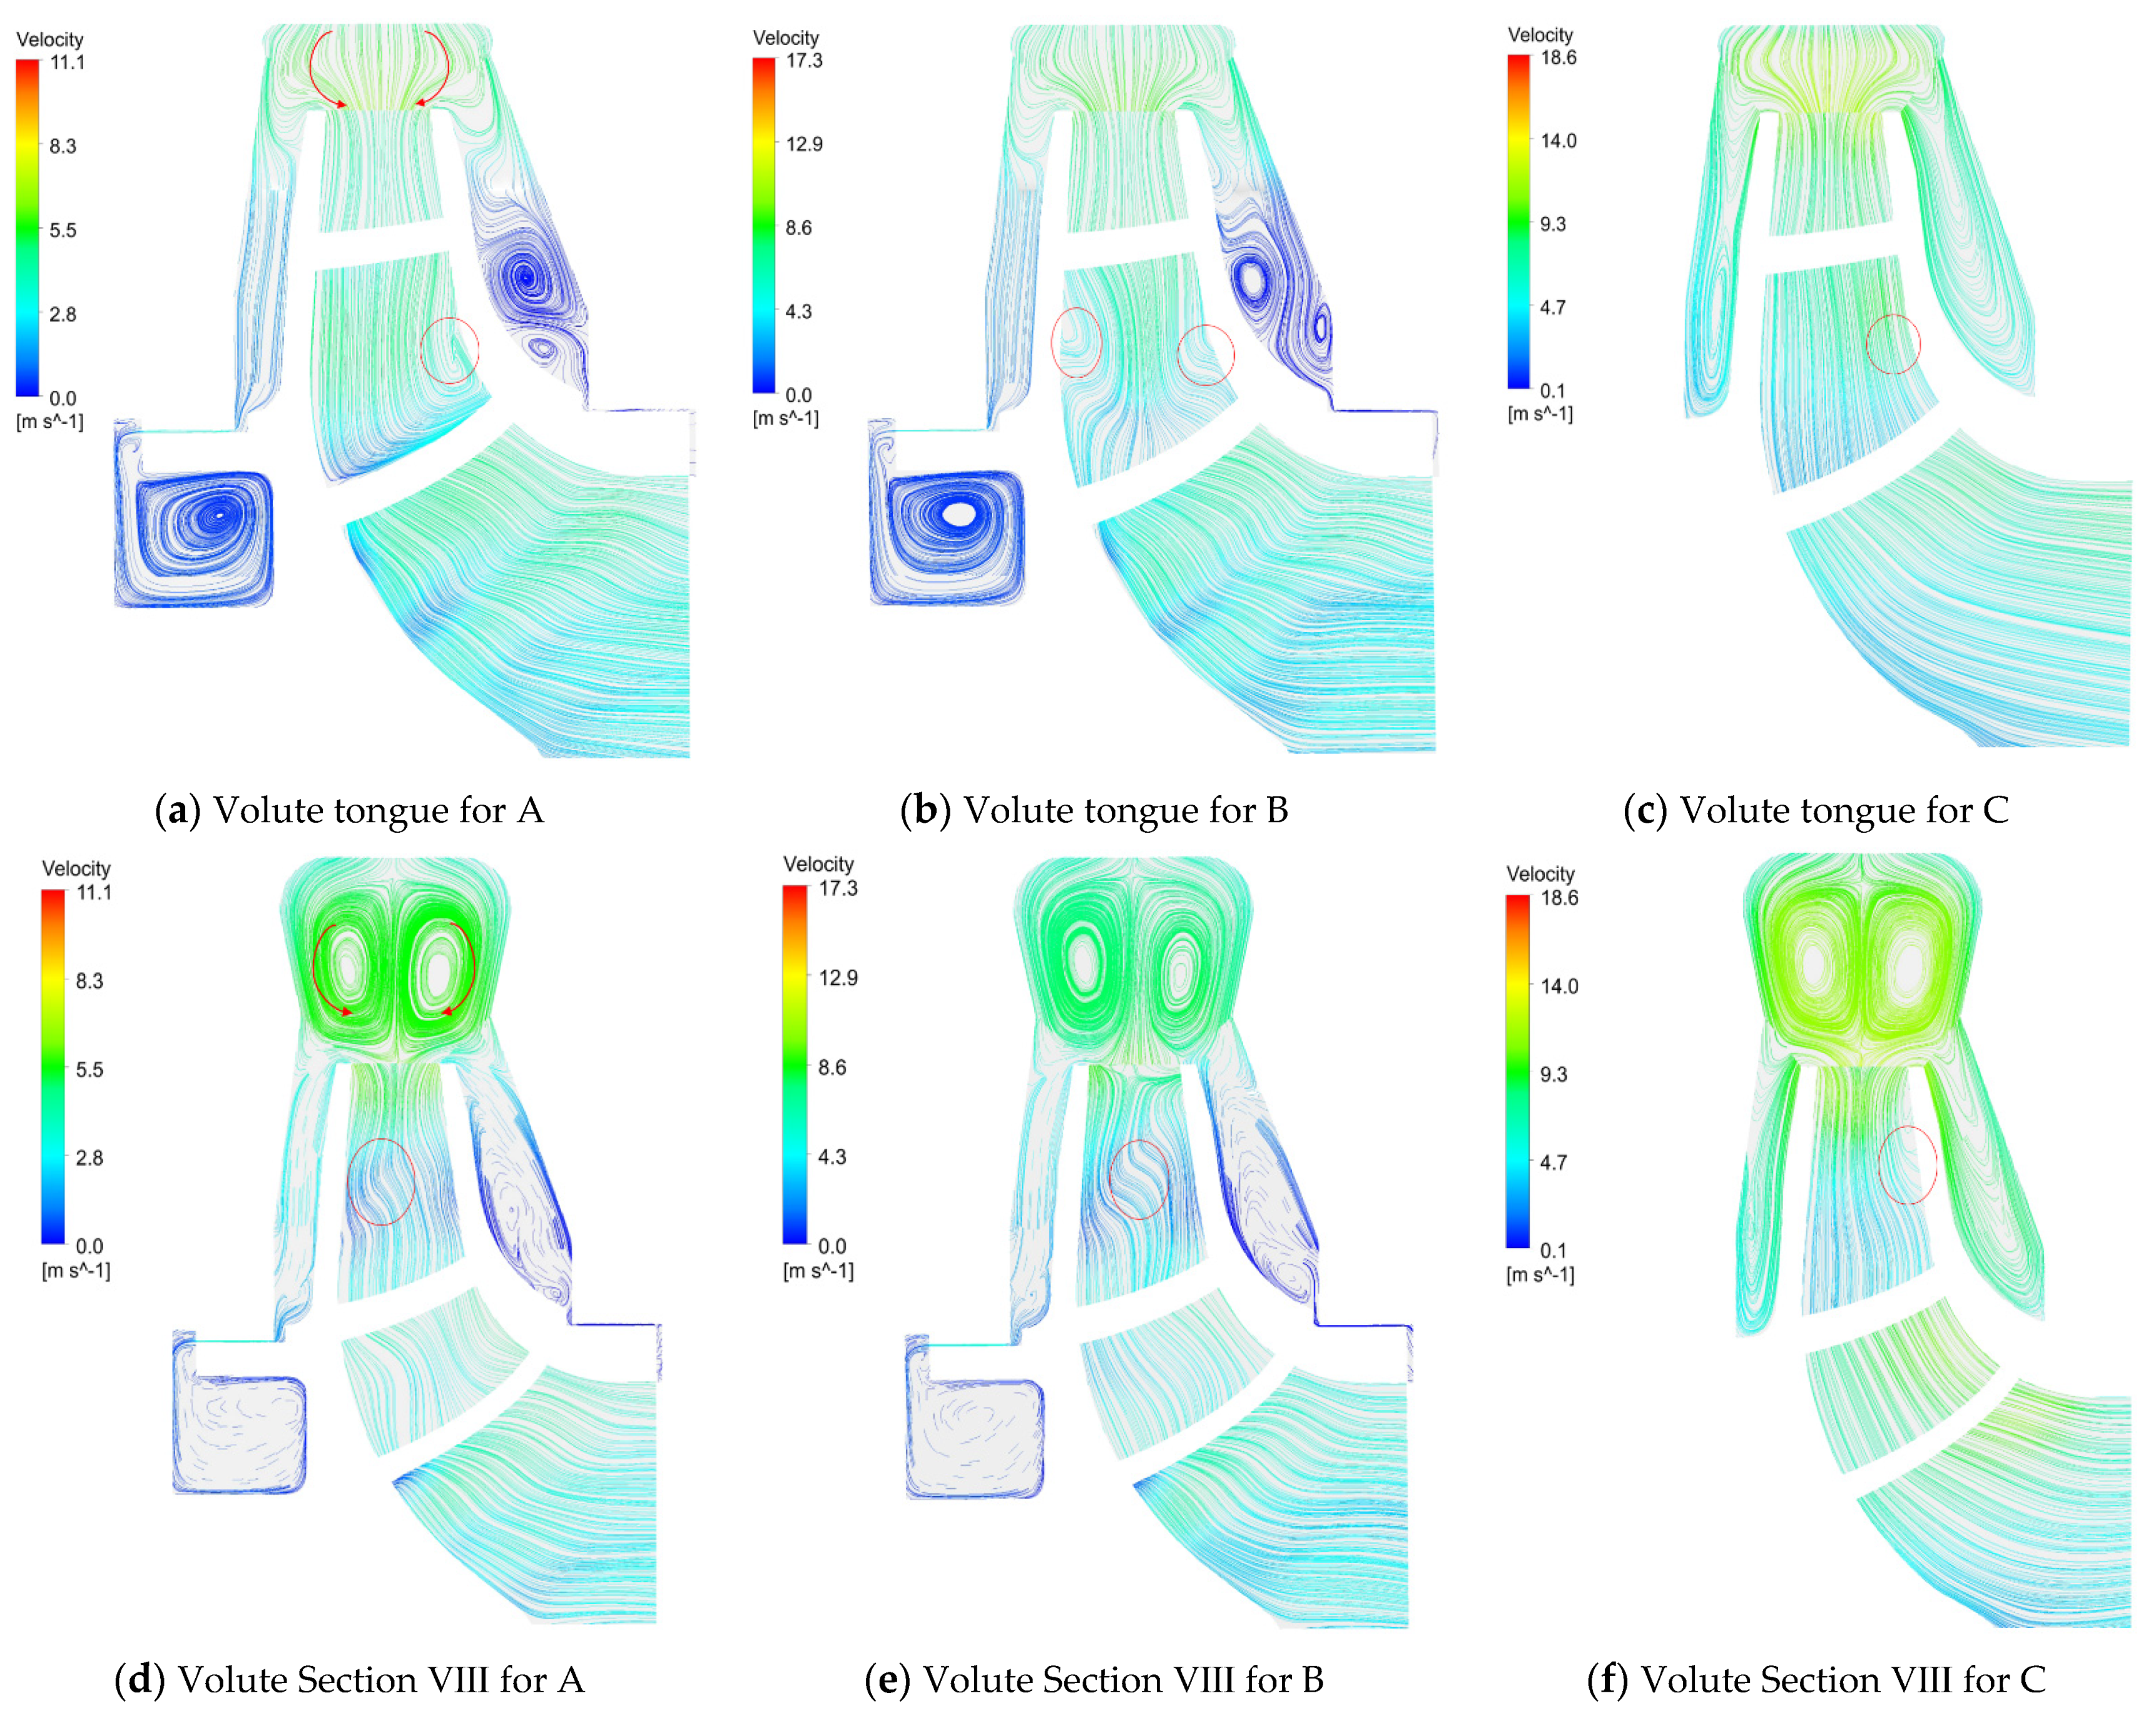
4.1. Velocity Distribution in Rotor and Volute
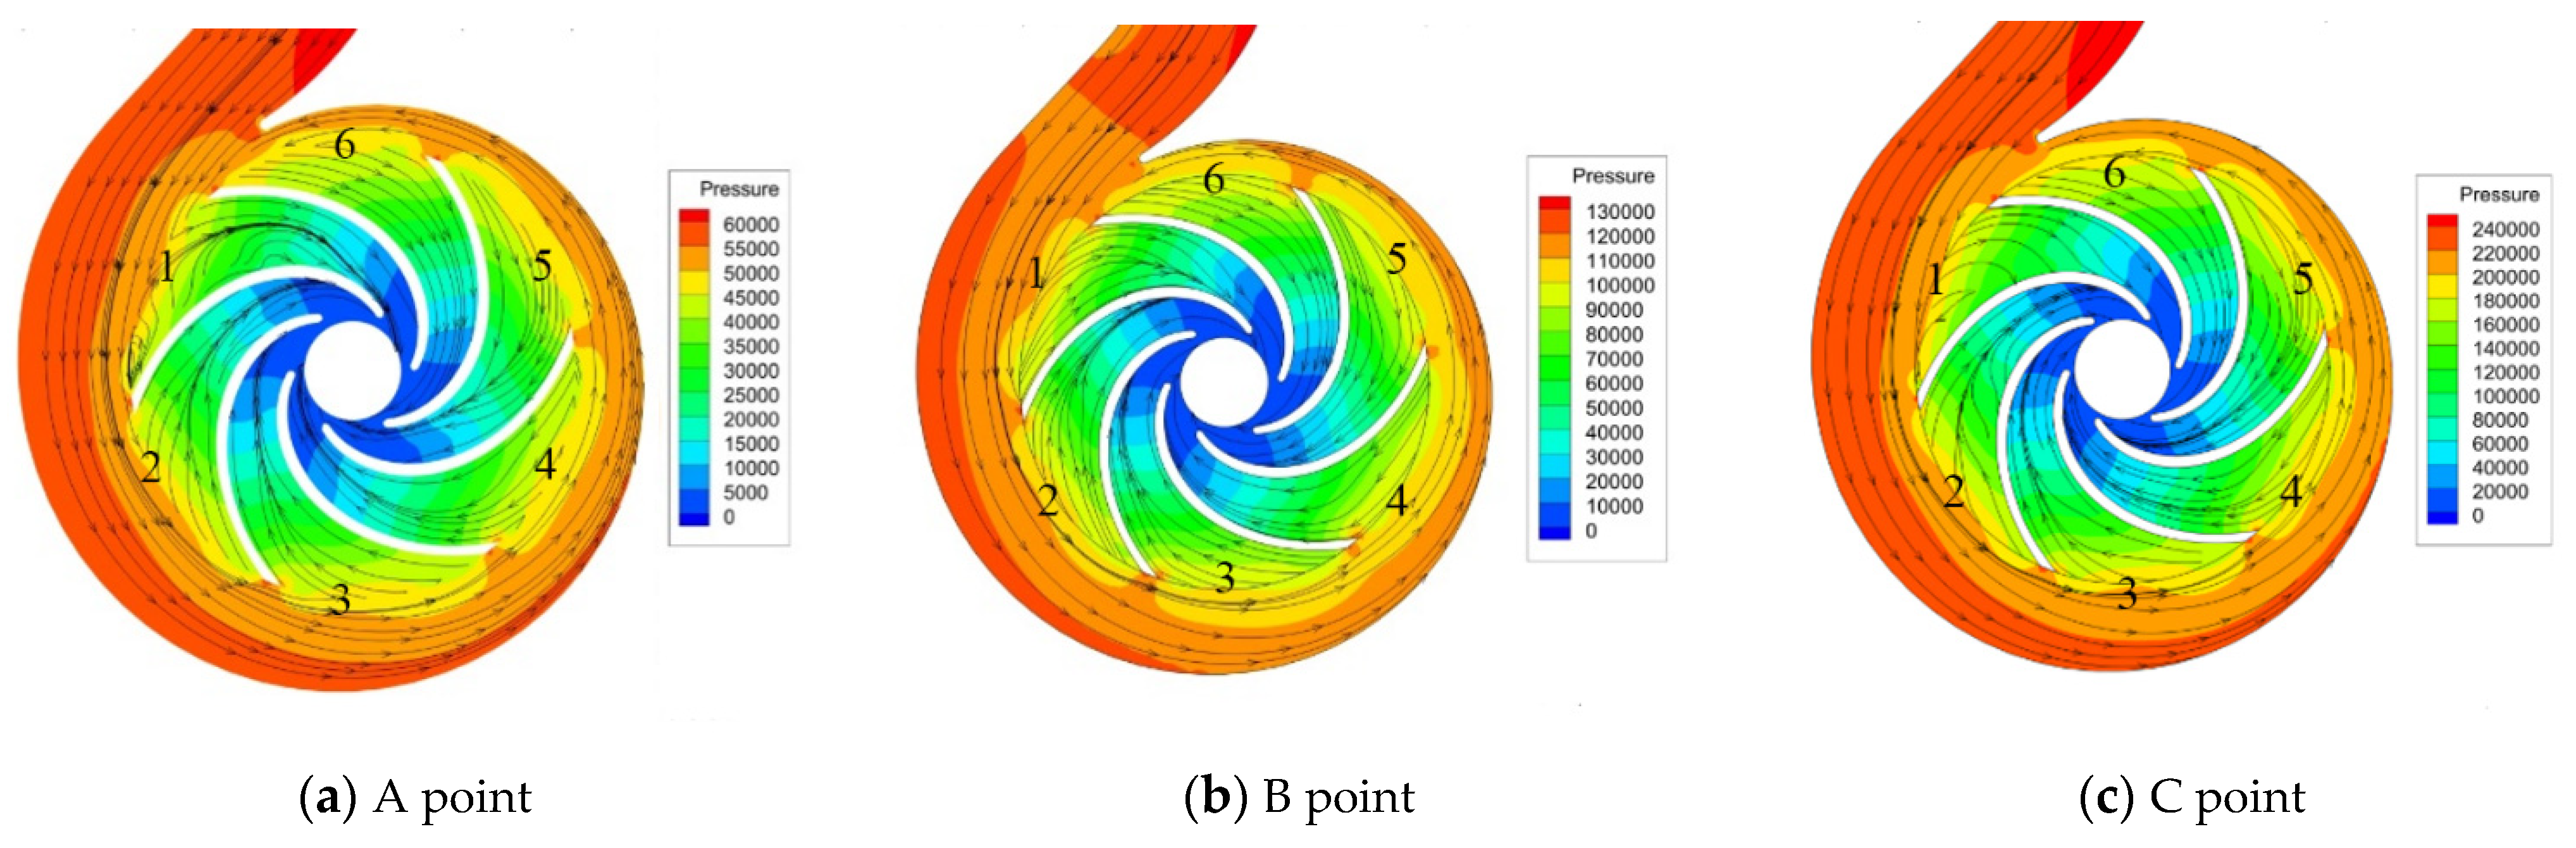
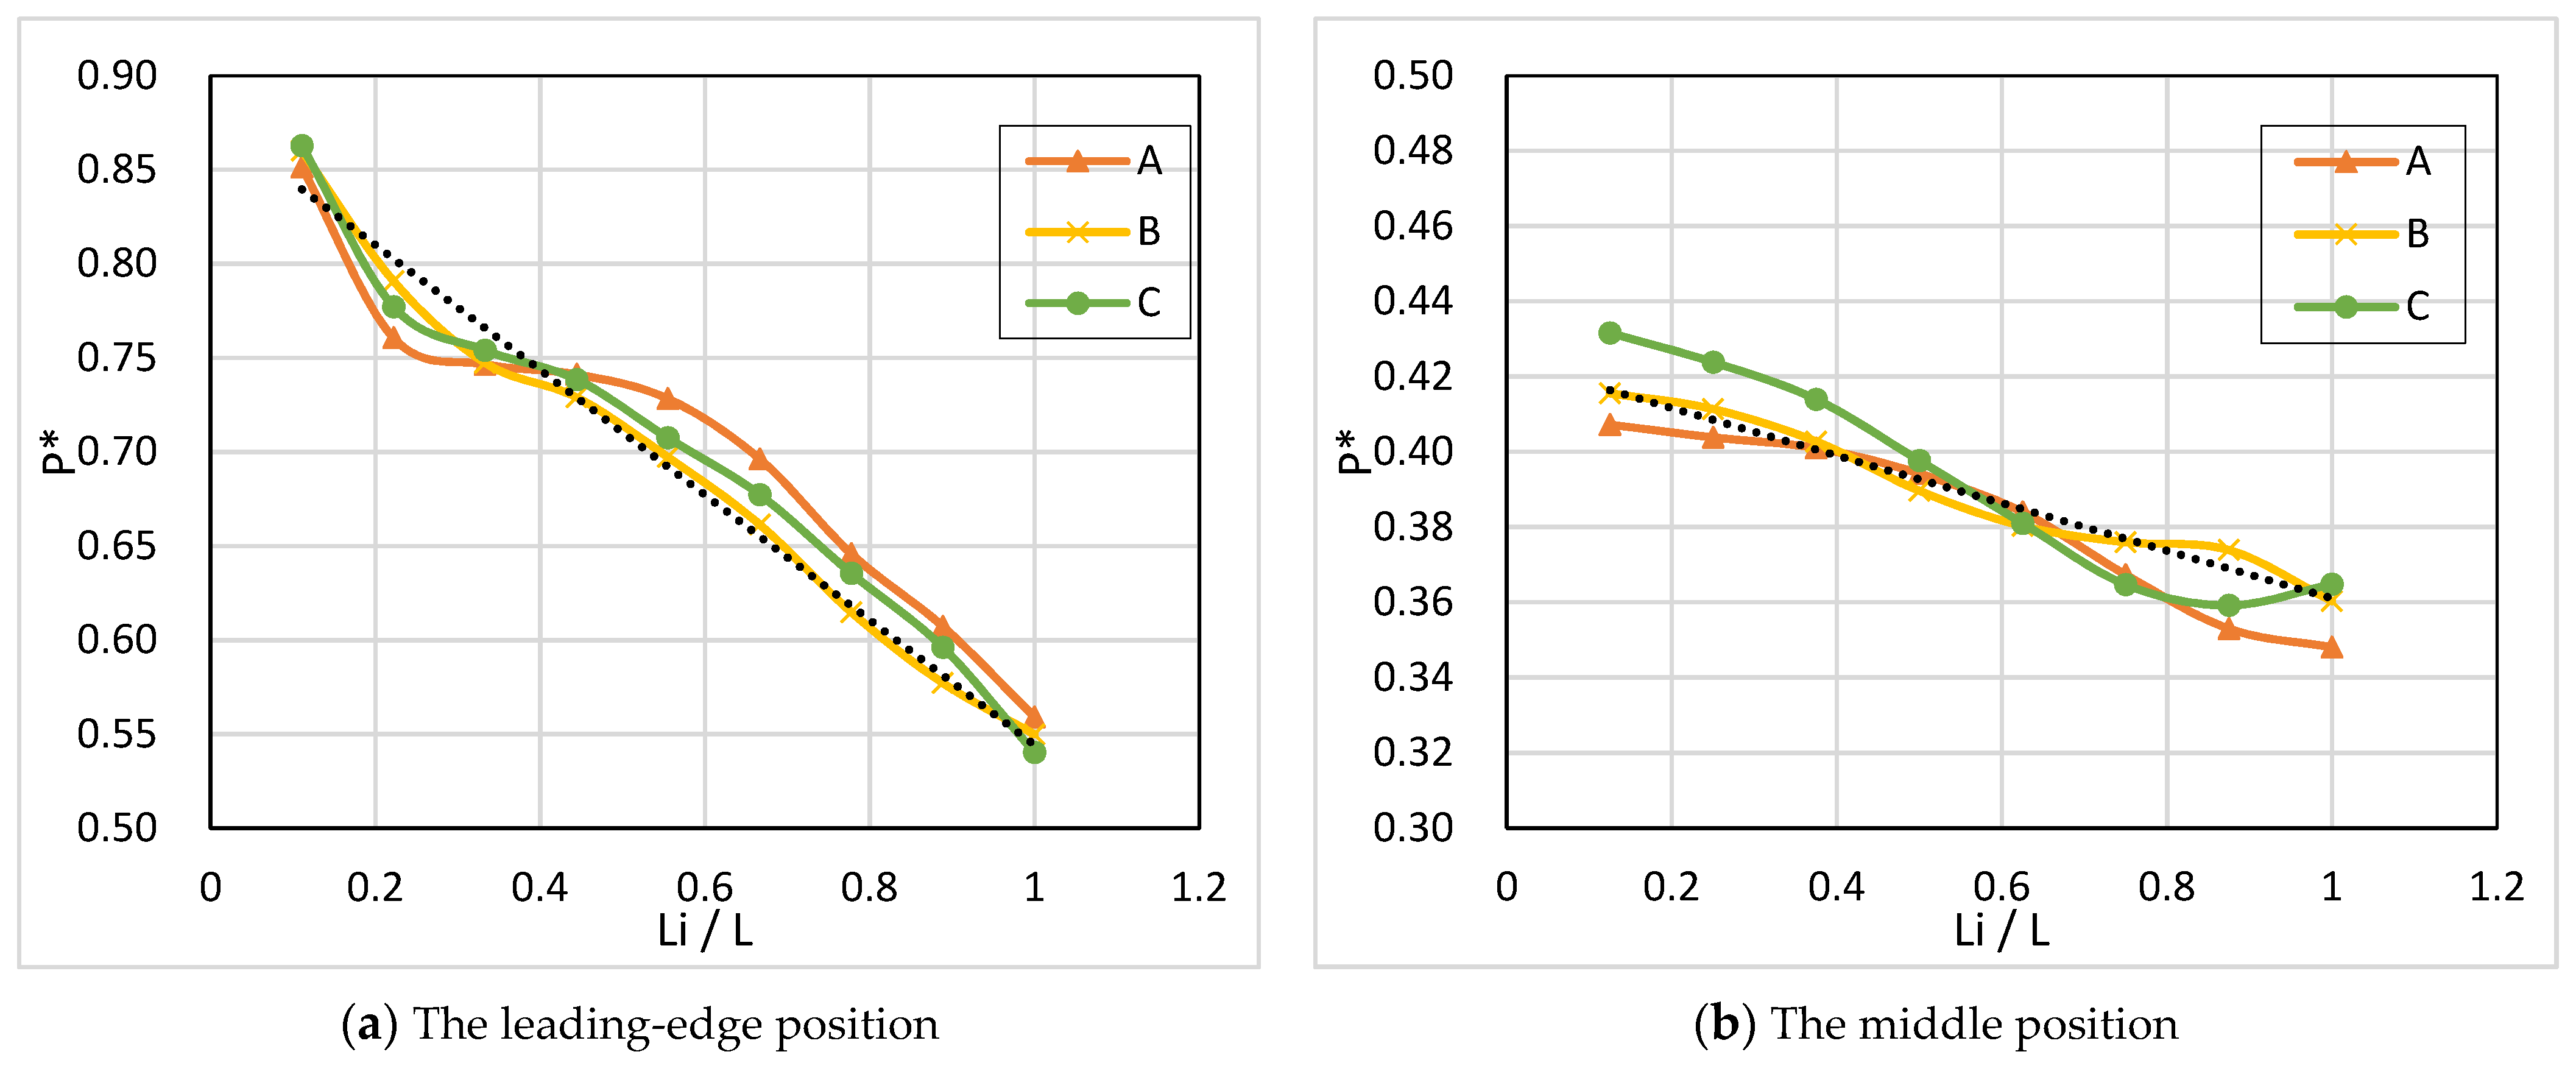
4.2. Pressure and Hydraulic Load in Rotors
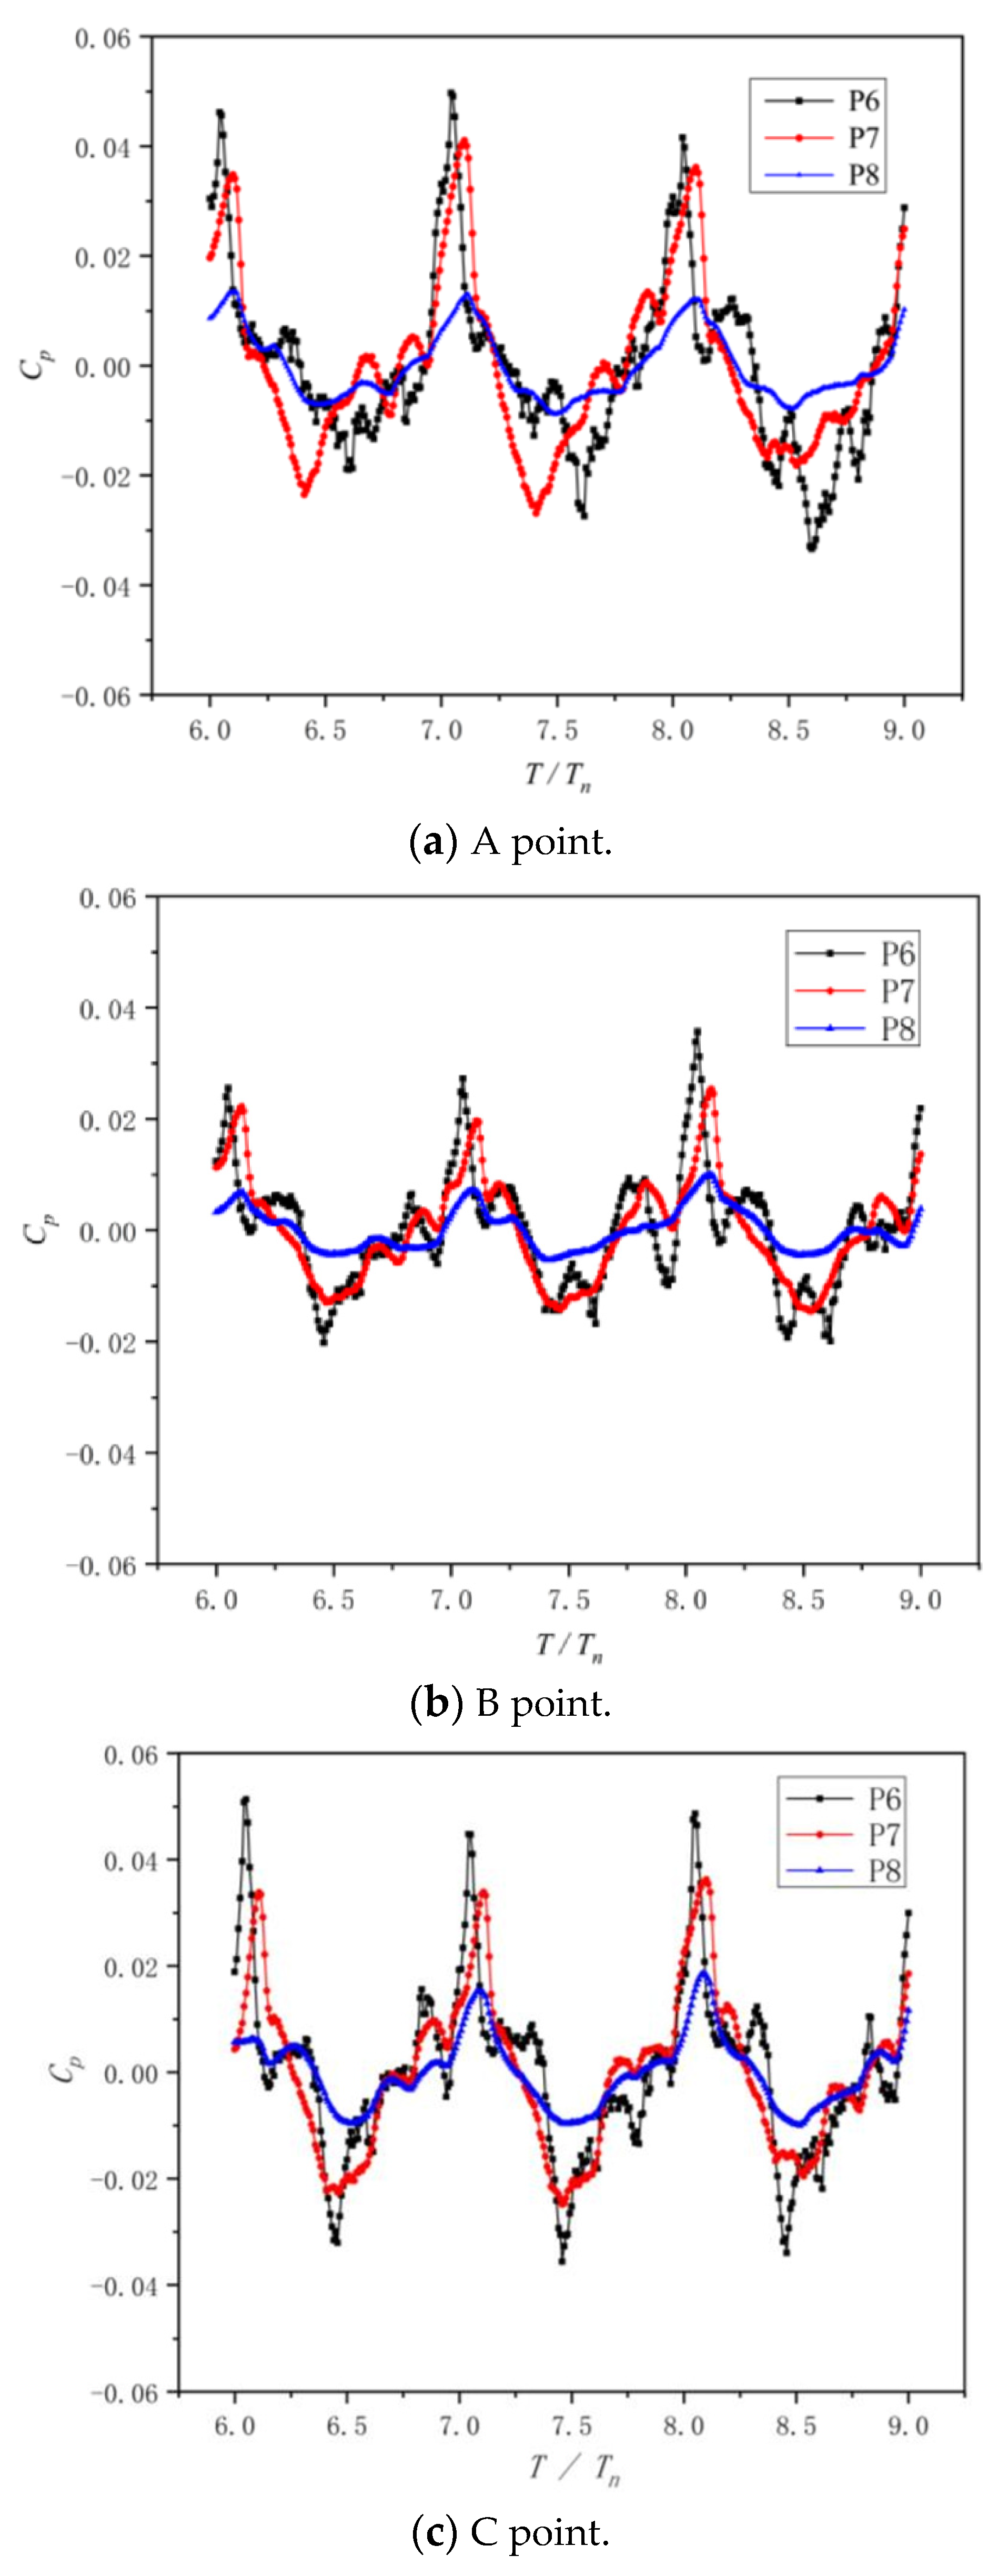
4.3. Pressure Fluctuation in Volute and Impeller
5. Experimental Setup and Validation
6. Conclusions
Author Contributions
Funding
Institutional Review Board Statement
Informed Consent Statement
Data Availability Statement
Conflicts of Interest
Nomenclature
| BEP | best efficiency point |
| LES | large eddy simulation |
| D1 | rotor inlet diameter, mm |
| D2 | rotor outlet diameter, mm |
| D3 | volute base circle diameter, mm |
| D4 | volute outlet diameter, mm |
| Dh | rotor hub diameter, mm |
| Fn | rotor passing frequency, Hz |
| Fx,y,z | rotor thrust of x, y, z direction, N |
| H | head, m |
| M | turbine torque output, W |
| P | turbine power, W; pressure, Pa |
| Q | flowrate, kg/s, m3/s |
| Tn | rotor revolution period, s (=60/n) |
| B | rotor inlet width, mm |
| d2 | rotor diameter, mm |
| n | rotating speed, rpm |
| v | fluid velocity, m/s |
| y+ | y plus |
| z | blade number |
| σ | slip factor |
| Greek symbols | |
| blade inlet angle, ° | |
| blade outlet angle, ° | |
| blade wrap angel, ° | |
| rotation angle, rad/s | |
| turbine efficiency | |
| Subscripts | |
| f | friction loss |
| l | leakage |
| r.m.s | root-mean-square |
| t | theoretical |
| v | volumetric |
| s | suction side |
| p | pressure side |
References
- Nouni, M.R.; Mullick, S.C.; Kandpal, T.C. Providing electricity access to remote areas in India: Niche areas for decentralized electricity supply. Renew. Energy 2009, 34, 430–434. [Google Scholar] [CrossRef]
- Bhattacharya, S.C.; Jana, C. Renewable energy in India: Historical developments and prospects. Energy 2009, 34, 981–991. Available online: https://www.sciencedirect.com/science/article/pii/S0360544208002855 (accessed on 20 January 2020). [CrossRef]
- Engeda, A.; Strate, P.; Rautenberg, M. Auswahl von Kreiselpumpen als Turbinen. Pumpentagung Karlsruhe 1988, 88, 12–19. [Google Scholar]
- Sharma, R.L. Pumps as turbines for small hydro. Indian J. Power River Val. Dev. 1999, 49, 44–48. [Google Scholar]
- Isbăşoiu, E.C.; Bucur, D.M.; Ghergu, C.M.; Dunca, G. Using standard pumps as turbines. In Proceedings of the CEEX 2007 Conference at Brasov; 2007; pp. 1–5. Available online: https://www.researchgate.net/publication/281645536_USING_STANDARD_PUMPS_AS_TURBINES (accessed on 1 January 2007).
- Van Antwerpen, H.J.; Greyvenstein, G.P. Use of turbines for simultaneous pressure regulation and recovery in secondary cooling water systems in deep mines. Energy Convers. Manag. 2005, 46, 563–575. [Google Scholar] [CrossRef]
- Bohl, W. Strömungsmaschinen 1–Aufbau und Wirkungsweise. Aufl. Würzbg. 1994, 77, 131–132. Available online: https://www.researchgate.net/publication/37406102_Stromungsmaschinen_1_Aufbau_und_Wirkungsweise (accessed on 5 February 2021).
- Avellan, F. Introduction to cavitation in hydraulic machinery. In Proceedings of the International Conference on Hydraulic Machinery and Hydrodynamics, Timisoara, Romania, 21–22 October 2004; pp. 11–22. [Google Scholar]
- Escaler, X.; Egusquiza, E.; Farhat, M.; Avellan, F.; Coussirat, M. Detectionof cavitation in hydraulic turbines. Mech. Syst. Signal. Process. 2006, 20, 983–1007. [Google Scholar] [CrossRef] [Green Version]
- Gantar, M. Propeller pump running as turbines. Conference on Hydraulic Machinery. 1988, pp. 237–248. Available online: https://www.researchgate.net/publication/304998834_Propeller_pump_running_as_turbines (accessed on 1 January 1988).
- Barrio, R.; Fernandez, J.; Parrondo, J.; Blanco, E. Performance prediction for a centrifugal pump working in direct and reverse mode using computational fluid dynamics. Renew. Energies Power Qual. J. 2010, 1, 1429–1433. [Google Scholar] [CrossRef]
- Yang, S.S.; Liu, H.L.; Kong, F.Y.; Xia, B.; Tan, L.W. Effects of the Radial Gap Between Impeller Tips and Volute Tongue Influencing the Performance and Pressure Pulsations of Pump as Turbine. J. Fluids Eng. 2014, 136. [Google Scholar] [CrossRef]
- Su, X.; Huang, S.; Zhang, X.; Yang, S. Numerical Research on Unsteady Flow Rate Characteristics of Pump as Turbine. Renew. Energy 2016, 94, 488–495. [Google Scholar] [CrossRef]
- Kaupert, K.A.; Staubli, T. The unsteady pressure field in a high specific speed centrifugal pump impeller—part I: Influence of the volute. J. Fluids Eng. Trans. ASME 1999, 3, 621–626. [Google Scholar] [CrossRef] [Green Version]
- Spence, R.; Purdom, T. Numerical prediction of transient loadings on multistage pump impellers. In Advances of CFD in Fluid Machinery Design; IMechE: London, UK, 2003. [Google Scholar]
- Stanmore, L.K. Field problems relating to high-energy centrifugal pumps operating at part-load. IMechE Conference C 1988, 88, 343. [Google Scholar]
- Zuo, Z.; Liu, S.; Sun, Y. Pressure fluctuations in the vaneless space of High-head pump-turbines—A review. Renew. Sustain. Energy Rev. 2015, 41, 965–974. [Google Scholar] [CrossRef]
- Barrio, R.; Fernandez, J.; Blanco, E.; Parrondo, J. Estimation of radial load in centrifugal pumps using computational fluid dy namics. Eur. J. Mech. B Fluids 2011, 30, 316–324. [Google Scholar] [CrossRef]
- Gülich, J.F. Centrifugal Pumps; Springer: Berlin/Heidelberg, Germany, 2008. [Google Scholar]
- Jiang, Y.Y.; Yoshimura, S.; Imai, R.; Katsura, H.; Yoshida, T.; Kato, C. Quantitative evaluation of flow-induced structural vibra tion and noise in turbomachinery by full-scale weakly coupled simulation. J. Fluids Struct. 2007, 23, 531–544. [Google Scholar] [CrossRef]
- Su, X.; Huang, S.; Li, Y.; Zhu, Z.; Li, Z. Numerical and Experimental Research on Multi-Stage Pump as Turbine System. Int. J. Green Energy 2017, 14, 996–1004. [Google Scholar] [CrossRef]
- Gülich, J.F. Turbine operation, general characteristics. In Centrifugal Pumps; Gülich, J.F., Ed.; Springer: Berlin/Heidelberg, Germany, 2010; pp. 715–740. [Google Scholar] [CrossRef]


| Parameter | Value |
|---|---|
| D1 (mm) | 203 |
| D2 (mm) | 90 |
| D3 (mm) | 220 |
| D4 (mm) | 65 |
| Dh (mm) | 30 |
| b2 (mm) | 16 |
| z | 6 |
| (°) | 35 |
| (°) | 15 |
| (°) | 130 |
| Item | Inlet | Outlet | Rotation |
|---|---|---|---|
| A | Q = 12.5 kg/s | P = 1 atm | 1000 rpm |
| B | Q = 17.5 kg/s | P = 1 atm | 1500 rpm |
| C | Q = 25.0 kg/s | P = 1 atm | 2000 rpm |
| Item | n (rpm) | Q (m3/h) | H (m) | P (kW) | η (%) |
|---|---|---|---|---|---|
| A-Test | 1000 | 44.6 | 7.0 | 0.68 | 79.5 |
| A-CFD | 1000 | 45.0 | 7.2 | 0.73 | 82.8 |
| B-Test | 1500 | 63.4 | 14.1 | 1.94 | 79.8 |
| B-CFD | 1500 | 63.0 | 14.8 | 2.10 | 82.5 |
| C-Test | 2000 | 89.8 | 27.1 | 5.32 | 80.3 |
| C-CFD | 2000 | 90.0 | 28.0 | 5.70 | 83.1 |
| Item | Displacement (μm) | Intensity (mm/s) | Acceleration (mm/s2) |
|---|---|---|---|
| A-M1 | 12 | 1.4 | 4.1 |
| A-M2 | 10 | 0.8 | 1.6 |
| A-M3 | 21 | 2.5 | 5.0 |
| B-M1 | 11 | 1.1 | 3.8 |
| B-M2 | 10 | 0.7 | 1.5 |
| B-M3 | 17 | 2.3 | 4.4 |
| C-M1 | 14 | 1.8 | 4.5 |
| C-M2 | 11 | 0.9 | 2.2 |
| C-M3 | 23 | 2.9 | 5.1 |
Publisher’s Note: MDPI stays neutral with regard to jurisdictional claims in published maps and institutional affiliations. |
© 2021 by the authors. Licensee MDPI, Basel, Switzerland. This article is an open access article distributed under the terms and conditions of the Creative Commons Attribution (CC BY) license (http://creativecommons.org/licenses/by/4.0/).
Share and Cite
Su, X.; Cao, Z.; Li, Y.; Jin, Y.; Tang, Z. Research on Flow Stability and Vibration of an Industrial Hydraulic Turbine. Processes 2021, 9, 311. https://doi.org/10.3390/pr9020311
Su X, Cao Z, Li Y, Jin Y, Tang Z. Research on Flow Stability and Vibration of an Industrial Hydraulic Turbine. Processes. 2021; 9(2):311. https://doi.org/10.3390/pr9020311
Chicago/Turabian StyleSu, Xianghui, Zixian Cao, Yi Li, Yuzhen Jin, and Zhenji Tang. 2021. "Research on Flow Stability and Vibration of an Industrial Hydraulic Turbine" Processes 9, no. 2: 311. https://doi.org/10.3390/pr9020311