Abstract
The mixed free-surface-pressurized flow in the tailrace tunnel of a hydropower station has a great impact on the pressure, velocity, and operation stability of the power station. In the present work, a characteristic implicit method based on the upwind differencing and implicit finite difference scheme is used to solve the mixed free-surface-pressurized flow. The results of the characteristic implicit method agree well with the experimental results, which validates the accuracy of the method. Four factors that influence the amplitude of pressure fluctuation are analyzed and optimized, and the results show that the relative roughness can influence the maximum pressure in the tailrace tunnel. Additionally, the maximum pressure decreases with the increase of the tunnel’s relative roughness. When the surface relative roughness increases from 0.010 to 0.018, the maximum pressure can decrease by 4.33%. The maximum pressure in the tailrace tunnel can be effectively restrained by setting vent holes in the flat-topped tunnel section (tunnel (4)) and a vent hole at 81.25%L (L is the length of tunnel (4)), which can reduce the maximum pressure by 56.72%. Increasing the vent hole number can also reduce the maximum pressure of the mixed free-surface-pressurized flow in the tailrace tunnel. An optimal set of two ventilation holes 10 m in diameter at 93.75%L and 56.25%L is proposed, which can reduce the maximum pressure by 15.30% in comparison with the single vent case.
1. Introduction
Energy is one of the most important basic elements of economic and social development, and the utilization of energy can greatly improve the living quality of humans. After hundreds of years of exploitation and utilization, traditional fossil energy is decreasing day by day. As a consequence, the development of renewable energy has become an important development direction for global energy. Every country takes the development of renewable energy, such as hydropower, wind energy, and solar energy, as an important means to meet the challenges of energy security and climate change [1,2,3,4]. Among them, hydropower, with its low power generation cost and high power generation efficiency, has become a great alternative in recent years [5,6,7,8,9,10].
With the development of the national economy and hydropower, many large-scale water conservancy and hydropower projects have been built in China, such as the Three Gorges power station, Baise Underground power station, Xiangjiaba power station, and Xiluodu power station. To ensure the safe operation of hydropower stations, sufficient hydraulic analysis and hydraulic calculation must be carried out for the hydraulic transition process. The purpose of the transition process calculation is to reveal the dynamic hydro-mechanical characteristics of the water transmission and power generation system of a hydropower station in various transitional processes. To improve the reliability, stability, flexibility, and overall economy of hydropower station operation, reasonable control methods and technical measures are necessary. The hydraulic transition process of the hydropower station is complex and involves many theoretical and computational problems. In the tailrace tunnel of the hydropower station, the free surface flow and the pressurized flow may appear alternately in the transition process, which is called the mixed free-surface-pressurized flow. When the mixed free-surface-pressurized flow occurs, the wave velocity and pressure at the interface will change rapidly.
This complicated flow phenomenon will have an important impact on the stability of the whole system’s operation and will cause great pressure fluctuation in the transition process, especially for the tailwater systems of hydropower stations. Therefore, it is necessary to establish a reasonable, feasible, and identical model for calculation. At present, the main calculation methods are the virtual slit method [11,12,13], the shock wave fitting method [14,15], and the rigid water body method [16]. The virtual slit method was proposed by Preissmann [17], which assumes that there is a very narrow gap at the top of the closed tunnel and the gap does not increase the cross-section of the pressure water pipe and the hydraulic radius. When the pipeline is full of water, it can be regarded as an open channel with a very small water surface, and then the unified St. Venant equation can be used to solve free surface flow and pressurized flow. This model has been successfully used by Chaudhry and Kao [18] to analyze the mixed free-surface-pressurized flow in the tailwater system of the Shrum hydropower station in Canada. Ji [13] also used this model to calculate the mixed free-surface-pressurized flow in a rainwater drainage pipe. Trajkovic et al. [19] used the Maccormack scheme to simulate the mixed free-surface-pressurized flow in a circular cross-section pipeline, and the numerical results were in good agreement with the experimental results. Ferreri et al. [20] analyzed the steady pressurized flow in a sewer by using the virtual slit method. Maranzoni et al. [21] applied the virtual slit method to the two-dimensional transient mixed flow.
However, the setting of the virtual slit method is not consistent with actual situations under some conditions. Firstly, the criterion to determine the open channel flow and the pressurized flow is that the water pressure is lower or higher than the pipe’s top. If there is a large bubble, even if the pressure is higher than the pipe’s top, the open channel flow will not become the pressurized flow. Secondly, the equation of unsteady flow in an open channel is only applicable to the gradual change flow. Guo and Song [22] found that when the sudden change flow was formed and the surge wavefront was steep, the calculation of the virtual slit method would be unstable or not convergent when they studied the mixed free-surface-pressurized flow in the joint underground drainage system in Chicago.
When bubbles and negative pressure appear in the mixed free-surface-pressurized flow, the shock wave fitting method is proposed, which regards the free surface flow and pressurized flow as two flow states and calculates the velocity and position of the moving interface. Wiggert [23] introduced a moving interface between the free surface flow and pressurized flow to modify the Pressimann slit method, and the free surface flow was solved by the characteristic line method. Miyashiro and Yoda [15] used the characteristic line method to solve the Venant equation for free surface flow in a study of the mixed free-surface-pressurized flow in the underground drainage system. Song [24] used a shock wave moving equation and interface characteristic line equation to calculate the free surface flow and pressurized flow for the transition process of the pipeline.
However, some calculation results showed that the shock wave fitting method was not stable enough. When the surge wavefront is steep, it will lead to numerical divergence. Because the wave velocities of the free surface flow and the pressurized flow are quite different, special mesh generation technology should be adopted to meet the requirements of calculation accuracy and stability. When the moving interface passes through boundary conditions such as bifurcation pipes and surge chambers, it will become very difficult to deal with the shock wave. In particular, the shock wave fitting method considers that the interface of the mixed free-surface-pressurized flow and positive surge wave is consistent, which is not suitable for some cases, such as a positive surge wave in a tailrace tunnel with a variable top height. Hamam and McCorquodale [25,26] proposed the rigid water body method to solve the mixed free-surface-pressurized flow, which assumes that water is incompressible and the flow velocity is uniform. Rigid water body theory is adopted for the liquid phase, and compressible flow theory is adopted for the gas phase. Li and Alex [16] developed the rigid water body method to calculate the bubble motion. However, the algorithm of the rigid water body method is complex, and there are many discrepancies with physical reality. Therefore, this method is rarely used to simulate the mixed free-surface-pressurized flow.
The existing work outlined above shows that the three calculation methods to solve the mixed free-surface-pressurized flow have their limits. Therefore, it is vital to propose a stable calculation format for the mixed free-surface-pressurized flow which can smoothly calculate and obtain results consistent with the actual situation, even when the water surface fluctuates greatly and the pressure fluctuates violently.
The basic structure of the present work is as follows. Firstly, the characteristic implicit scheme method [27] is used to solve the mixed free-surface-pressurized flow, and the experimental validation is carried out. Then, the influence of the relative roughness of the tailrace tunnel on the maximum pressure in the tunnel is analyzed. The restraining effect of setting single vent holes at different positions in the flat-topped tunnel section on the maximum pressure in the tunnel is discussed. The influence of ventilation holes with different diameters on the maximum pressure in the tunnel is calculated. The influence of setting multiple vent holes in the flat-topped tunnel section on suppressing the pressure fluctuation in the tunnel is also studied.
2. Research Object and Mathematical Model
2.1. Research Object
Figure 1 shows the layout of the water conveyance system of a hydropower station. The downstream is a tailwater tunnel that starts at the altitude of 548.70 m and ends at the altitude of 577.00 m. As shown in Table 1 and Table 2, the total length of tunnels (1), (2), (3), and (4) is 1541.10 m, where the mixed free-surface-pressurized flow may occur. The shape of tunnel (4) is rectangular with an arch crown; its width is 18 m, and its height is 20 m. The operating conditions are 825 m at the upstream and 597 m at the downstream, respectively, which means that the downstream water level is equal to the top of tunnel (4).

Figure 1.
The layout of the water conveyance system of a hydropower station.

Table 1.
Tunnel parameters.

Table 2.
Description of the tunnel shape.
2.2. Mathematical Model
In recent work, the virtual slit method was mainly used to calculate the alternating full flow. According to the Preissmann model [17], a virtual slot on the top of the pipe or tunnel is assumed, and the slot will slightly influence the tunnel cross-section area A. The wave velocity of the free surface flow c is determined by , where B is the surface width and g is gravity. Then, the wave velocity of the pressurized flow a can be chosen as a = c. This is a way to simulate the pressurized flow by modifying the free surface wave velocity. Then, the free surface flow and the pressurized flow can be described by the same partial equations [28] as follows:
where h is the flow depth, v is the flow velocity, i is the tunnel slope, and Jf is the slope of the energy grade line.
2.3. Characteristic Implicit Method
With the rapid increase of the wave velocity c, the numerical calculation would be difficult to converge when the interface of the free surface flow and the pressurized flow passes the computational nodes. In the present work, the characteristic implicit method provides a differencing scheme with good stability and high accuracy to solve the mixed free-surface-pressurized flow. Since the system made up of the continuity and momentum equations is a hyperbolic system, upwind differencing can avoid nonphysical oscillations, and the implicit scheme is used for stability and accuracy.
To transform Equations (1) and (2) into the norm forms of the hyperbolic system and to replace v with Q/A, where Q is the volume flow, Equations (3) and (4) are derived as follows:
where , , , and R is the hydraulic diameter. Equations (3) and (4) are differenced at the point of (m, n) by using the differencing scheme as follows. The forward differencing in time is found by
For the upwind differencing in space, Equation (3) is differenced along the line:
Equation (4) is differenced along the line:
The substitution of Equations (5) and (6) into Equation (3), as well as the substitution of Equations (5) and (7) into Equation (4), lead to the system in Equation (8):
where , , , and . Additionally,
Equation (8) is constituted by a set of two nonlinear algebraic equations with six independent unknowns, two of which are the same in any two neighboring nodes, and a similar pair of equations are written for each of the M-2 internal points in the tunnel. Thus, there are two M-2 equations in 2 M unknowns. Equation (8) can provide one equation for each boundary point. The boundary condition at the end of the tunnel can provide two additional equations, so a unique solution can be obtained. In this paper, the new method is named the characteristic implicit method with first-order accuracy. By using the friction term and gravity term of the n + 1 time step, the computation precision and stability can be improved.
2.4. Experimental Validation
The purpose of this experiment was to verify the correctness of the characteristic implicit method for solving the mixed free-surface-pressurized flow. In this experimental model, the diversion system and tailwater system adopted the diversion mode that one tunnel distributed one machine. The tailrace adopted the four-in-one arrangement scheme, in which four branch tunnels converged to one main tunnel. Figure 2 shows the diagram and experimental rig of the tailrace tunnel.

Figure 2.
The diagram (a) and experimental rig (b) of the tailrace tunnel.
The experimental tunnel was a model with a proportion scale λL = 30, according to the gravity similarity principle [29]. The prototype of the tailrace runner was the concrete surface, and its relative roughness was 0.014. According to the scale of relative roughness, the relative roughness of the model material was 0.0079, while the relative roughness of the plexiglass pipe was also 0.0079, so the tailrace channel model was made of plexiglass could meet the requirement.
The model structure and schematic diagram of the monitoring points on the main tailrace tunnel are shown in Figure 2a, in which the tailrace of the power station was connected with a large tailwater pond. The reason for this was that the tailrace of the prototype power station flowed into the natural river channel, and the tailrace water level of the power station was determined by the discharge flow of the discharge structure and the discharge flow of the power station. The discharge flow of the power station was relatively low, and the tailrace water level of the power station was relatively stable in the transient process. In the present experiment, the discharge flow was only from the power station, so it was necessary to manually adjust the actual tailrace level. In the unsteady experiment, a relatively stable boundary condition of downstream tailrace could be obtained by connecting a large pool with the model tailrace and adopting a wide weir at the pool end.
In the present experiment, the flow rate was measured by the rectangular, thin-walled weir, and the zero reading of the thin-walled weir was calibrated before the experiment. The water depth at each point of the main tunnel was measured by the pulsating pressure sensor. The pulsating pressure sensor was connected with the computer through a DJ800 multifunctional monitor to form a data acquisition and processing system. The system was used to measure the fluctuation of the water depth at various points in the tailrace system. To observe the obvious mixed free-surface-pressurized flow in the main tailrace tunnel, the downstream water level was set to 0.807 m. Under this condition, the first half of the tailrace was the pressurized flow, and the second half of the tailrace was the free surface flow. The discharge was calculated to be 0.066279 m3/s, according to the Rehbock weir formula [30]. When the butterfly valves at the inlets of four branch tunnels were suddenly closed, the phenomenon of mixed free-surface-pressurized flow in the main tailrace tunnel could be observed.
The flow rate condition was given at the upstream, and the flow rate of the four adits was assumed to be the same at 0.016570 m3/s. When the butterfly valve quickly closed, the flow rate became zero in a short time, and the variation of the flow rate was recorded. Although the downstream was a large pool, there were still small fluctuations in the water level, which were recorded and input into the calculation. Figure 3a–h shows the comparison curves of the water depth in the experiment and calculations. The results show that the water levels of the time domain agreed well between the experiment and calculations. The frequency results of the experiment and calculations also coincided well, and the dominant frequencies were both 0.1 Hz. It can be seen that the calculation results and the experimental results were consistent, and the change period of the water depth was nearly the same. The water level at point 1 exceeded the tunnel’s top, so the flow in the transient process was pressurized. The water level at point 4 was below the tunnel top, so the flow in the transient process was a free surface flow. In the transient process, the water level at the second and third points would be below or exceed the tunnel’s top, so the mixed free-surface-pressurized flow would occur. This is consistent with the experimental results that the separation interface between pressurized flow and free surface flow appeared near point 3 under the initial water level of 0.807 m.
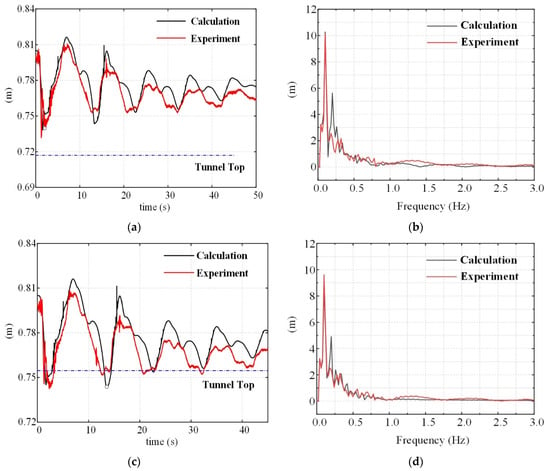
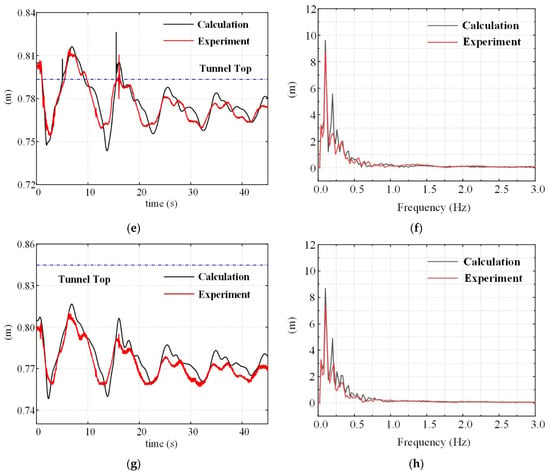
Figure 3.
The curve of the stage (pressure) in the tailrace tunnel, shown for (a) the time domain of point 1, (b) frequency domain of point 1, (c) time domain of point 2, (d) frequency domain of point 2, (e) time domain of point 3, (f) frequency domain of point 3, (g) time domain of point 4, and (h) frequency domain of point 4.
Figure 3e shows that when the water surface reached the tunnel’s top at point 3, the free surface flow became the pressurized flow. The curve of the experimental results shows a large pressure fluctuation at this time, which agrees well with the calculated results. Due to the pressure fluctuation at measuring point 3, the pressure fluctuation also appeared at points 1 and 2. Therefore, the calculation model could accurately predict the interface of the free surface flow and the pressurized flow.
3. Analysis of Influencing Factors for the Mixed Free-Surface-Pressurized Flow
Many factors can affect the occurrence and development of mixed free-surface-pressurized flow, which are important for the construction design of hydraulic engineering and the operation of hydraulic machinery.
3.1. Influence of the Tunnel Relative Roughness
When the mixed free-surface-pressurized flow occurs in the tailrace tunnel, the wave velocity at the interface between the free surface flow and the pressurized flow will change suddenly and cause great pressure fluctuation. According to Equations (3) and (4), the surface relative roughness of the tunnel wall will affect the amplitude of the pressure fluctuation.
Tunnels with the relative roughness of 0.010/0.012/0.014/0.016/0.018 were selected to calculate the influence of the tunnel surface relative roughness on the mixed free-surface-pressurized flow. The maximum pressure in the tunnel with different relative roughnesses was calculated and shown in Table 3, and the results show that the maximum pressure in the tunnel decreased with the increase of the tunnel’s relative roughness. This means that increasing the relative roughness of the tunnel surface could suppress the maximum pressure in the tunnel. The reason for this is that the increasing relative roughness will increase the hydraulic loss, which makes the maximum pressure lower. When the surface relative roughness increased from 0.010 to 0.018, the maximum pressure of the tunnel could decrease by 4.33%. However, increasing the relative roughness of the tunnel surface would reduce the power generation efficiency of the hydropower station. Therefore, a relative roughness of 0.014 is recommended upon consideration of the balance of economy and construction.

Table 3.
Maximum pressure in the tailrace tunnel with different relative roughnesses.
3.2. Influence of Vent Position
The vent can greatly discharge pressure when the mixed free-surface-pressurized flow appears. To study the effect of vent holes at different positions on the maximum pressure in the tunnel, the water level of the tailrace tunnel under the mixed free-surface-pressurized flow was calculated, as is shown in Figure 4. The diameter of the vent hole was set as D = 10 m in the calculation. In Figure 4, the red line represents the water level in the tunnel when the mixed free-surface-pressurized flow occurred, the blue line represents the tunnel’s top, and the black line represents the tunnel’s bottom.
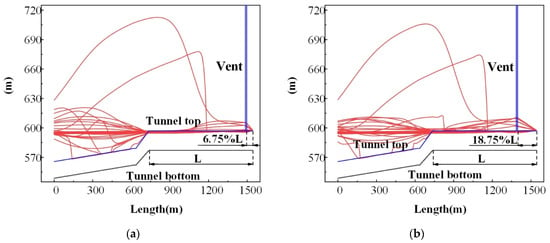
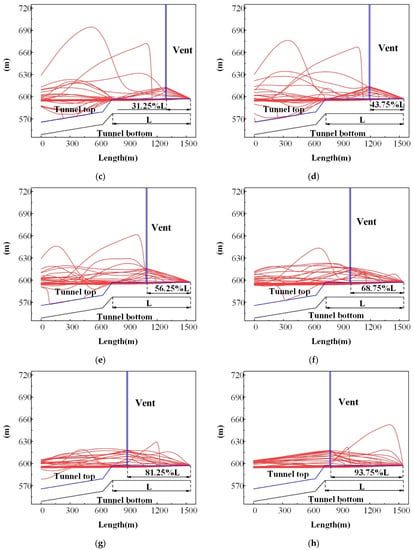
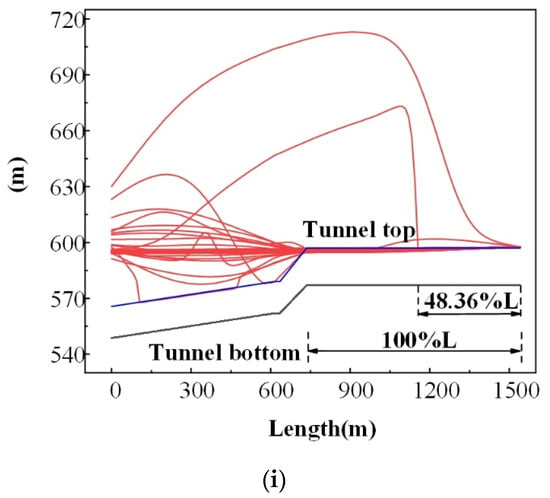
Figure 4.
Water level with a vent at different positions: (a) 6.25%L, (b) 18.75%L, (c) 31.25%L, (d) 43.75%L, (e) 56.25%L, (f) 68.75%L, (g) 81.25%L, (h) 93.75%L, and (i) no vent.
For the no vent scenario, the maximum value of the pressure in the tunnel was 152.785 mH2O. For the different vent positions of 6.25%L, 18.75%L, 31.25%L, 43.75%L, 56.25%L, 68.75%L, 81.25%L, and 93.75%L, the maximum values of the pressure in tunnel were 151.493 mH2O, 144.734 mH2O, 134.734 mH2O, 120.974 mH2O, 104.851 mH2O, 86.844 mH2O, 66.124 mH2O, and 77.665 mH2O, respectively. It can be seen that the vent at 81.25%L had the best suppression effect on the maximum pressure in the tunnel, and the corresponding maximum pressure was 66.124 mH2O with a decrease of 56.72%. When the free surface flow turned into the pressurized flow, the wave velocity increased instantaneously, which caused a rapid increase of the pressure fluctuation in the tunnel. On the one hand, according to the design manual of the hydropower station, the wave velocity of the tailwater tunnel of the prototype power station was 1160 m/s under the pressurized flow. On the other hand, the vents in the tunnel could be thought of as small open channels, and the wave velocity in the vent could be calculated to be about 19 m/s by the wave velocity formula. Therefore, the maximum values of the pressure in tunnel 4 could be greatly reduced by setting proper vent positions. This method can be an alternative with the surge shafts to guarantee the stable operation of the hydropower station.
3.3. Influence of the Vent Diameter
According to the formula of the wave velocity for the open channel, the wave velocity decreased with the increase of the vent diameter. It can be inferred that the diameter of the ventilation holes affected the maximum pressure inside the tunnel. Vent holes with different diameters were set at 81.25%L, and the maximum pressure when the mixed free-surface-pressurized flow occurred in the tunnel was calculated, as is shown in Figure 5.
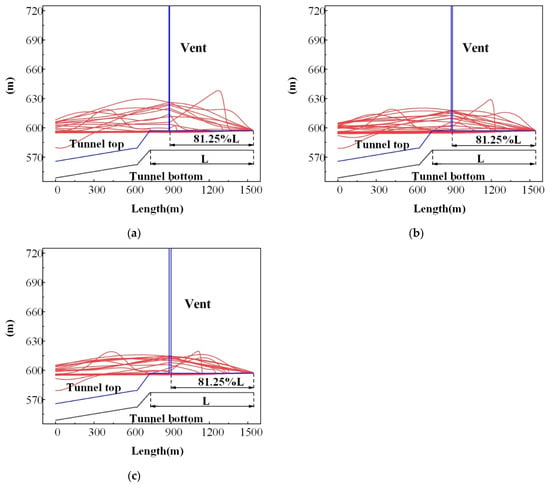
Figure 5.
Water level with different vent diameters: (a) vent diameter of 5 m, (b) vent diameter of 10 m, and (c) vent diameter of 15 m.
Three vent diameters of 5 m, 10 m, and 15 m were set to investigate the influence of the vent diameter on the suppression effect on the maximum pressure in the tunnel. The results show that the maximum pressure in the tunnel decreased with the increase of the vent diameter. When the diameter of the vent hole increased from 5 m to 10 m and 15 m, the maximum values of the pressure in the tunnel were 68.541 mH2O, 66.124 mH2O, and 66.026 mH2O, with a decrease of 3.53% and 3.67%, respectively. Therefore, further increasing the diameter had a slight effect on the maximum pressure suppression.
3.4. Influence of the Vent Number
A vent can effectively reduce the maximum pressure in the tunnel, so the influence of the vent number should be further investigated. Because the vent position at 93.75%L could effectively suppress the maximum pressure at the upstream of the tunnel, the first vent position was set at 93.75%L. Then, the second or third vent was set at different positions, and five cases with different vent numbers and corresponding positions were determined, as is shown in Table 4.

Table 4.
Maximum pressure in the tailrace tunnel with different numbers of vents.
Figure 6 shows the maximum pressure of the mixed free-surface-pressurized flow in the tunnel with vents. The results show that the maximum pressure in the tunnel was 56.006 mH2O for vent positions at 93.75%L and 56.25%L, which was reduced by 15.30% in comparison with the single-vent case. For the three vent positions at 93.75%L, 68.75%L, and 43.75%L, the maximum pressure in the tunnel was 55.398 mH2O, which was reduced by 16.22% in comparison with the single-vent case. It can be concluded that increasing the vent number can strengthen the suppression effect on the maximum pressure; however, more vents may influence the safety of the tunnel structure.
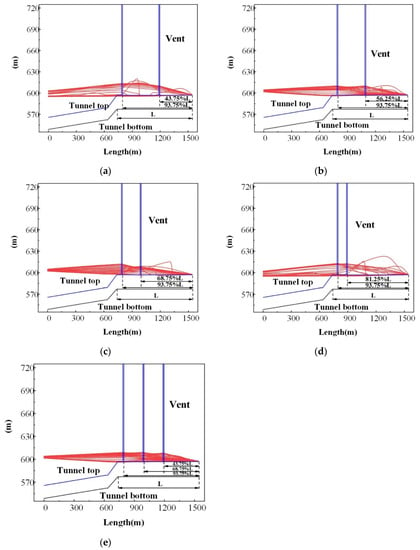
Figure 6.
Water level with different numbers of vents: (a) 93.75%L/43.75%L, (b) 93.75%L/56.25%L, (c) 93.75%L/68.75%L, (d) 93.75%L/81.25%L, and (e) 93.75%L/68.75%L/43.75%L.
4. Conclusions
In the present work, the characteristic implicit method was used to investigate the mixed free-surface-pressurized flow in the tailrace tunnels of a hydropower station, and the main conclusions are as follows:
- Based on the upwind differencing and implicit finite difference scheme, the characteristic implicit method can detect and simulate the mixed free-surface-pressurized flow, which has good calculation stability. The experiment agreed well with the calculated results and validated the accuracy of the characteristic implicit method;
- The relative roughness of the tailrace tunnel influences the maximum pressure in the tailrace tunnel, and the maximum pressure decreases with the increase of the tunnel’s relative roughness when the mixed free-surface-pressurized flow occurs;
- Setting vent holes in the flat-topped tunnel section can restrain the maximum pressure caused by the mixed free-surface-pressurized flow in the tunnel, and a vent hole at 81.25%L can reduce the maximum pressure by 56.72%;
- When the diameter of the vent hole is in the range of 5~15 m, the maximum pressure in the tunnel decreases with the increase of the ventilation hole diameter;
- By increasing the number of ventilation holes in the flat-topped tunnel section, the maximum pressure in the tunnel can be reduced when the mixed free-surface-pressurized flow occurs. An optimal set of two ventilation holes at 93.75%L and 56.25%L was proposed, which could reduce the maximum pressure by 15.30%. Meanwhile, when considering the suppression effect and tunnel safety, an optimal hole diameter of 10 m is recommended.
Author Contributions
Conceptualization, H.F., B.L.; methodology, H.F., B.L.; software, X.W.; validation, H.F. and X.W.; formal analysis, H.F. and X.W.; investigation, B.L.; resources, B.L.; data curation, X.W.; writing—original draft preparation, X.W.; writing—review and editing, H.F. and B.L.; visualization, B.L.; supervision, H.F.; project administration, H.F.; funding acquisition, H.F. All authors have read and agreed to the published version of the manuscript.
Funding
This work has been funded by the National Key R&D Program of China, grant number [2016YFC0401905], the National Natural Science Foundation of China, grant number [51879140], the Tsinghua-Foshan Innovation Special Fund, grant number (TFISF)[2020THFS0107], and the Creative Seed Fund of the Shanxi Research Institute for Clean Energy.
Acknowledgments
This work has been supported by the National Key R&D Program of China [2016YFC0401905], the National Natural Science Foundation of China [51879140], the Tsinghua-Foshan Innovation Special Fund (TFISF) [2020THFS0107], and the Creative Seed Fund of the Shanxi Research Institute for Clean Energy.
Conflicts of Interest
The authors declare no conflict of interest.
References
- Zhang, D.; Wang, J.; Lin, Y.; Si, Y.; Huang, C.; Yang, J.; Huang, B.; Li, W. Present situation and future prospect of renewable energy in China. Renew. Sustain. Energy Rev. 2017, 76, 865–871. [Google Scholar] [CrossRef]
- Zhang, N.; Lior, N.; Jin, H. The energy situation and its sustainable development strategy in China. Energy 2011, 36, 3639–3649. [Google Scholar] [CrossRef]
- Liu, W.; Lund, H.; Mathiesen, B.V.; Zhang, X. Potential of renewable energy systems in China. Appl. Energy 2011, 88, 518–525. [Google Scholar] [CrossRef]
- Chai, Q.; Zhang, X. Technologies and policies for the transition to a sustainable energy system in China. Energy 2010, 35, 3995–4002. [Google Scholar] [CrossRef]
- Mathiesen, B.V.; Lund, H.; Karlsson, K. 100% renewable energy systems, climate mitigation and economic growth. Appl. Energy 2011, 88, 488–501. [Google Scholar] [CrossRef]
- Huang, H.; Yan, Z. Present situation and future prospect of hydropower in China. Renew. Sustain. Energy Rev. 2009, 13, 1652–1656. [Google Scholar] [CrossRef]
- Chang, X.; Liu, X.; Zhou, W. Hydropower in China at present and its further development. Energy 2010, 35, 4400–4406. [Google Scholar] [CrossRef]
- Lu, Y.-m. The exploitation and sustainable development of hydropower in China. Water Resour. Hydropower Eng. 2004, 36, 1–4. [Google Scholar]
- Kong, Y.; Wang, J.; Kong, Z.; Song, F.; Liu, Z.; Wei, C. Small hydropower in China: The survey and sustainable future. Renew. Sustain. Energy Rev. 2015, 48, 425–433. [Google Scholar] [CrossRef]
- Liu, J.; Zhao, D.; Gerbens-Leenes, P.W.; Guan, D. China’s rising hydropower demand challenges water sector. Sci. Rep. 2015, 5, 11446. [Google Scholar] [CrossRef]
- Chaudhry, M.H. Applied Hydraulic Transients, 3rd ed.; Springer: Berlin, Germany, 2014. [Google Scholar]
- De Almeida, A.B.; Koelle, E. Fluid Transients in Pipe Networks; Computational Mechanics Publications: Southampton, UK; Elsevier Applied Science: London, UK, 1992. [Google Scholar]
- Ji, Z. General hydrodynamic model for sewer/channel network systems. J. Hydraul. Eng. 1998, 124, 307–315. [Google Scholar] [CrossRef]
- Guo, Q.; Song, C.C. Surging in urban storm drainage systems. J. Hydraul. Eng. 1990, 116, 1523–1537. [Google Scholar] [CrossRef]
- Miyashiro, H.; Yoda, H. An Analysis of Hydraulic Transients in Tunnels with Concurrent Open-Channel and Pressurized Flow; ASME, Fluids Engineering Division: New York, NY, USA, 1983. [Google Scholar]
- Li, J.; McCorquodale, A. Modeling mixed flow in storm sewers. J. Hydraul. Eng. 1999, 125, 1170–1180. [Google Scholar] [CrossRef]
- Priessmann, A.; Cunge, J.A. Calcul des intumeseences sur machines electronique. In Proceedings of the 9th Congress of International Association for Hydraulic Research, Belgrade, Yugoslavia, 3–7 September 1961. [Google Scholar]
- Chaudhry, M.H.; Kao, K.H. Shrum Generating Station: Tailrace Surges and Operating Guidelines During High Tailwater Levels; British Columbia Hydro and Power Authority: Vancouver, BC, Canada, 1976. [Google Scholar]
- Trajkovic, B.; Ivetic, M.; Calomino, F.; D’Ippolito, A. Investigation of transition from free surface to pressurized flow in a circular pipe. Water Sci. Technol. 1999, 39, 105–112. [Google Scholar] [CrossRef]
- Ferreri, G.B.; Freni, G.; Tomaselli, P. Ability of Preissmann slot scheme to simulate smooth pressurisation transient in sewers. Water Sci. Technol. 2010, 62, 1848–1858. [Google Scholar] [CrossRef]
- Maranzoni, A.; Dazzi, S.; Aureli, F.; Mignosa, P. Extension and application of the Preissmann slot model to 2D transient mixed flows. Adv. Water Resour. 2015, 82, 70–82. [Google Scholar] [CrossRef]
- Guo, Q.; Song, C.C. Dropshaft hydrodynamics under transient conditions. J. Hydraul. Eng. 1991, 117, 1042–1055. [Google Scholar] [CrossRef]
- Wiggert, D.C. Transient flow in free-surface, pressurized systems. J. Hydraul. Div. 1972, 98, 11–27. [Google Scholar] [CrossRef]
- Song, C.C.; Cardie, J.A.; Leung, K.S. Transient mixed-flow models for storm sewers. J. Hydraul. Eng. 1983, 109, 1487–1504. [Google Scholar] [CrossRef]
- Hamam, M.A.; McCorquodale, J.A. Transient conditions in the transition from gravity to surcharged sewer flow. Can. J. Civ. Eng. 1982, 9, 189–196. [Google Scholar] [CrossRef]
- McCorquodale, J.A.; Hamam, M.A. Modeling surcharged flow in sewers. In Proceedings of the International Symposium on Urban Hydrology, Hydraulics and Sediment Control, University of Kentucky, Lexington, KY, USA, 25–28 July 1983. [Google Scholar]
- Afshar, M.H.; Rohani, M. Water hammer simulation by implicit method of characteristic. Int. J. Press. Vessel. Pip. 2008, 85, 851–859. [Google Scholar] [CrossRef]
- Chunge, J.A. Numerical integration of Barre de Saint-Venant’s flow equations by means of an implicit scheme of finite differences. La Houille Blanche 1964, 1, 33–39. [Google Scholar]
- Liu, M.; Li, G.; Guala, M.; Sun, D. Experimental research on hydraulics of flood discharge tunnel and improving schemes for choking. La Houille Blanche 2017, 1, 24–32. [Google Scholar] [CrossRef]
- Aydin, I.; Altan-Sakarya, A.B.; Sisman, C. Discharge formula for rectangular sharp-crested weirs. Flow Meas. Instrum. 2011, 22, 144–151. [Google Scholar] [CrossRef]
Publisher’s Note: MDPI stays neutral with regard to jurisdictional claims in published maps and institutional affiliations. |
© 2021 by the authors. Licensee MDPI, Basel, Switzerland. This article is an open access article distributed under the terms and conditions of the Creative Commons Attribution (CC BY) license (http://creativecommons.org/licenses/by/4.0/).