
Change in Mixing Power of a Two-PBT Impeller When Emptying a Tank


Abstract
:1. Introduction
1.1. Single-Pitched-Blade Turbine (PBT) Systems
1.2. Multiple PBT Systems
1.3. Emptying Vessels
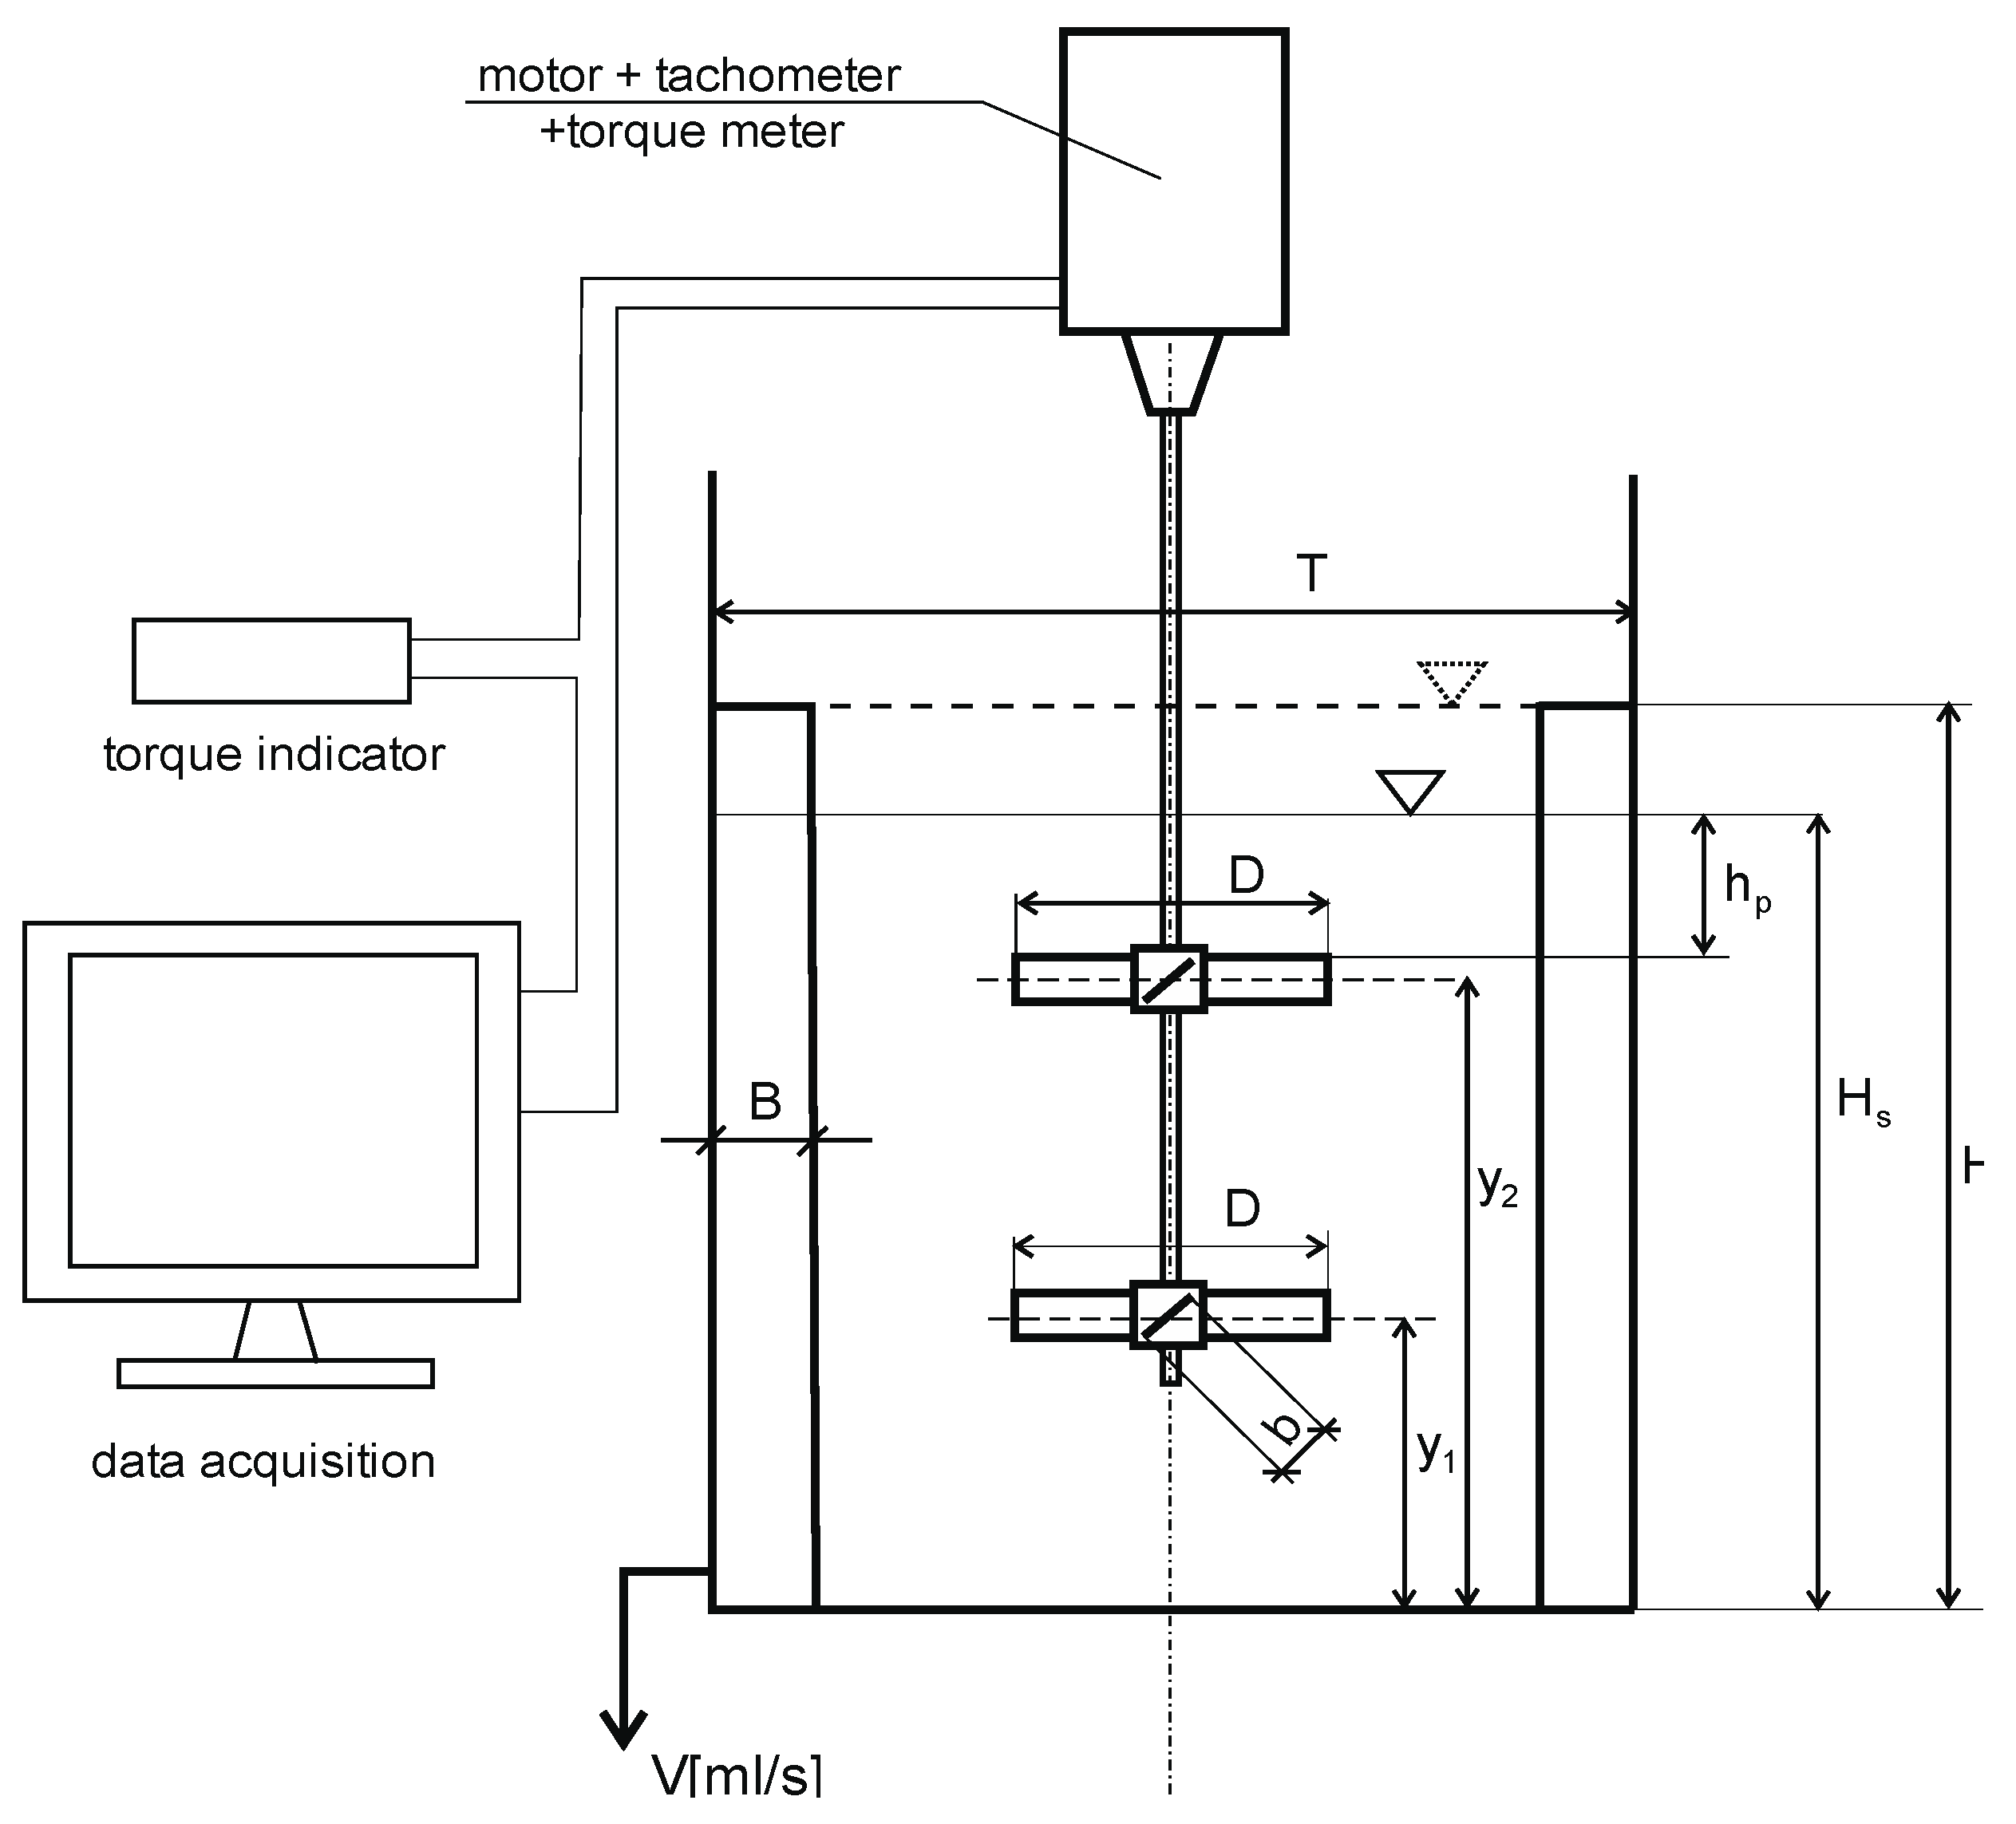
2. Materials and Methods
3. Results and Discussion
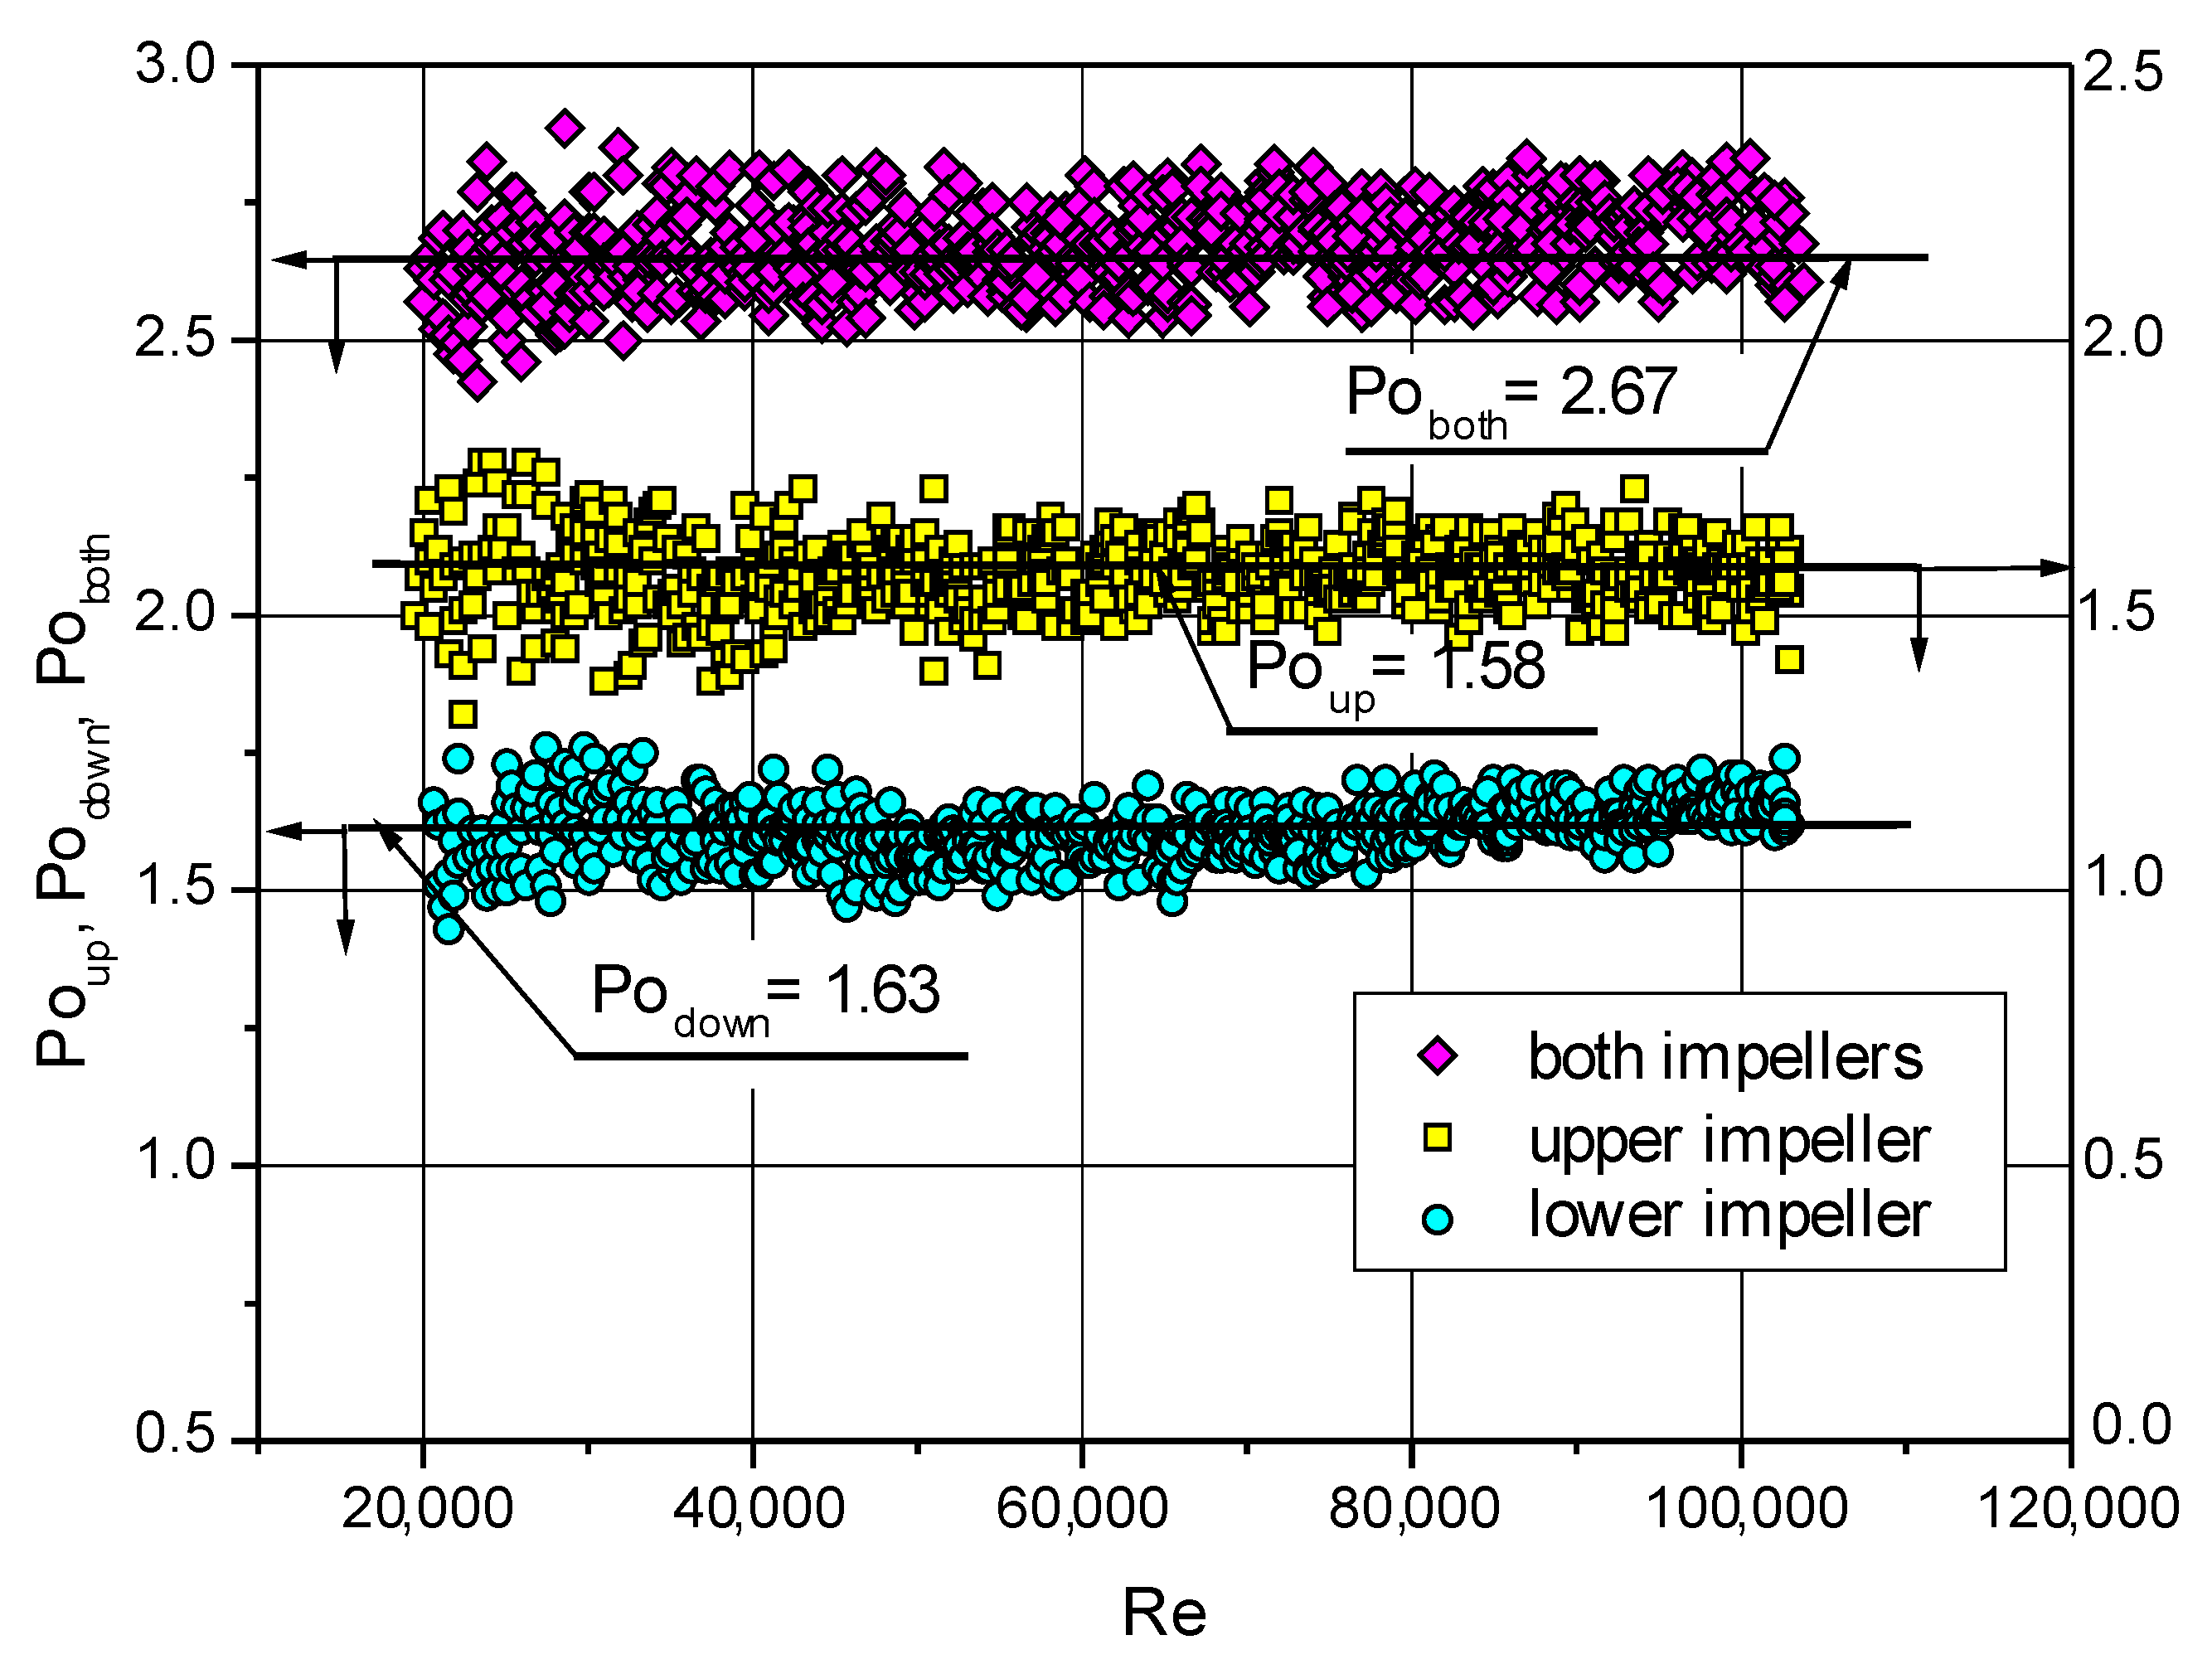
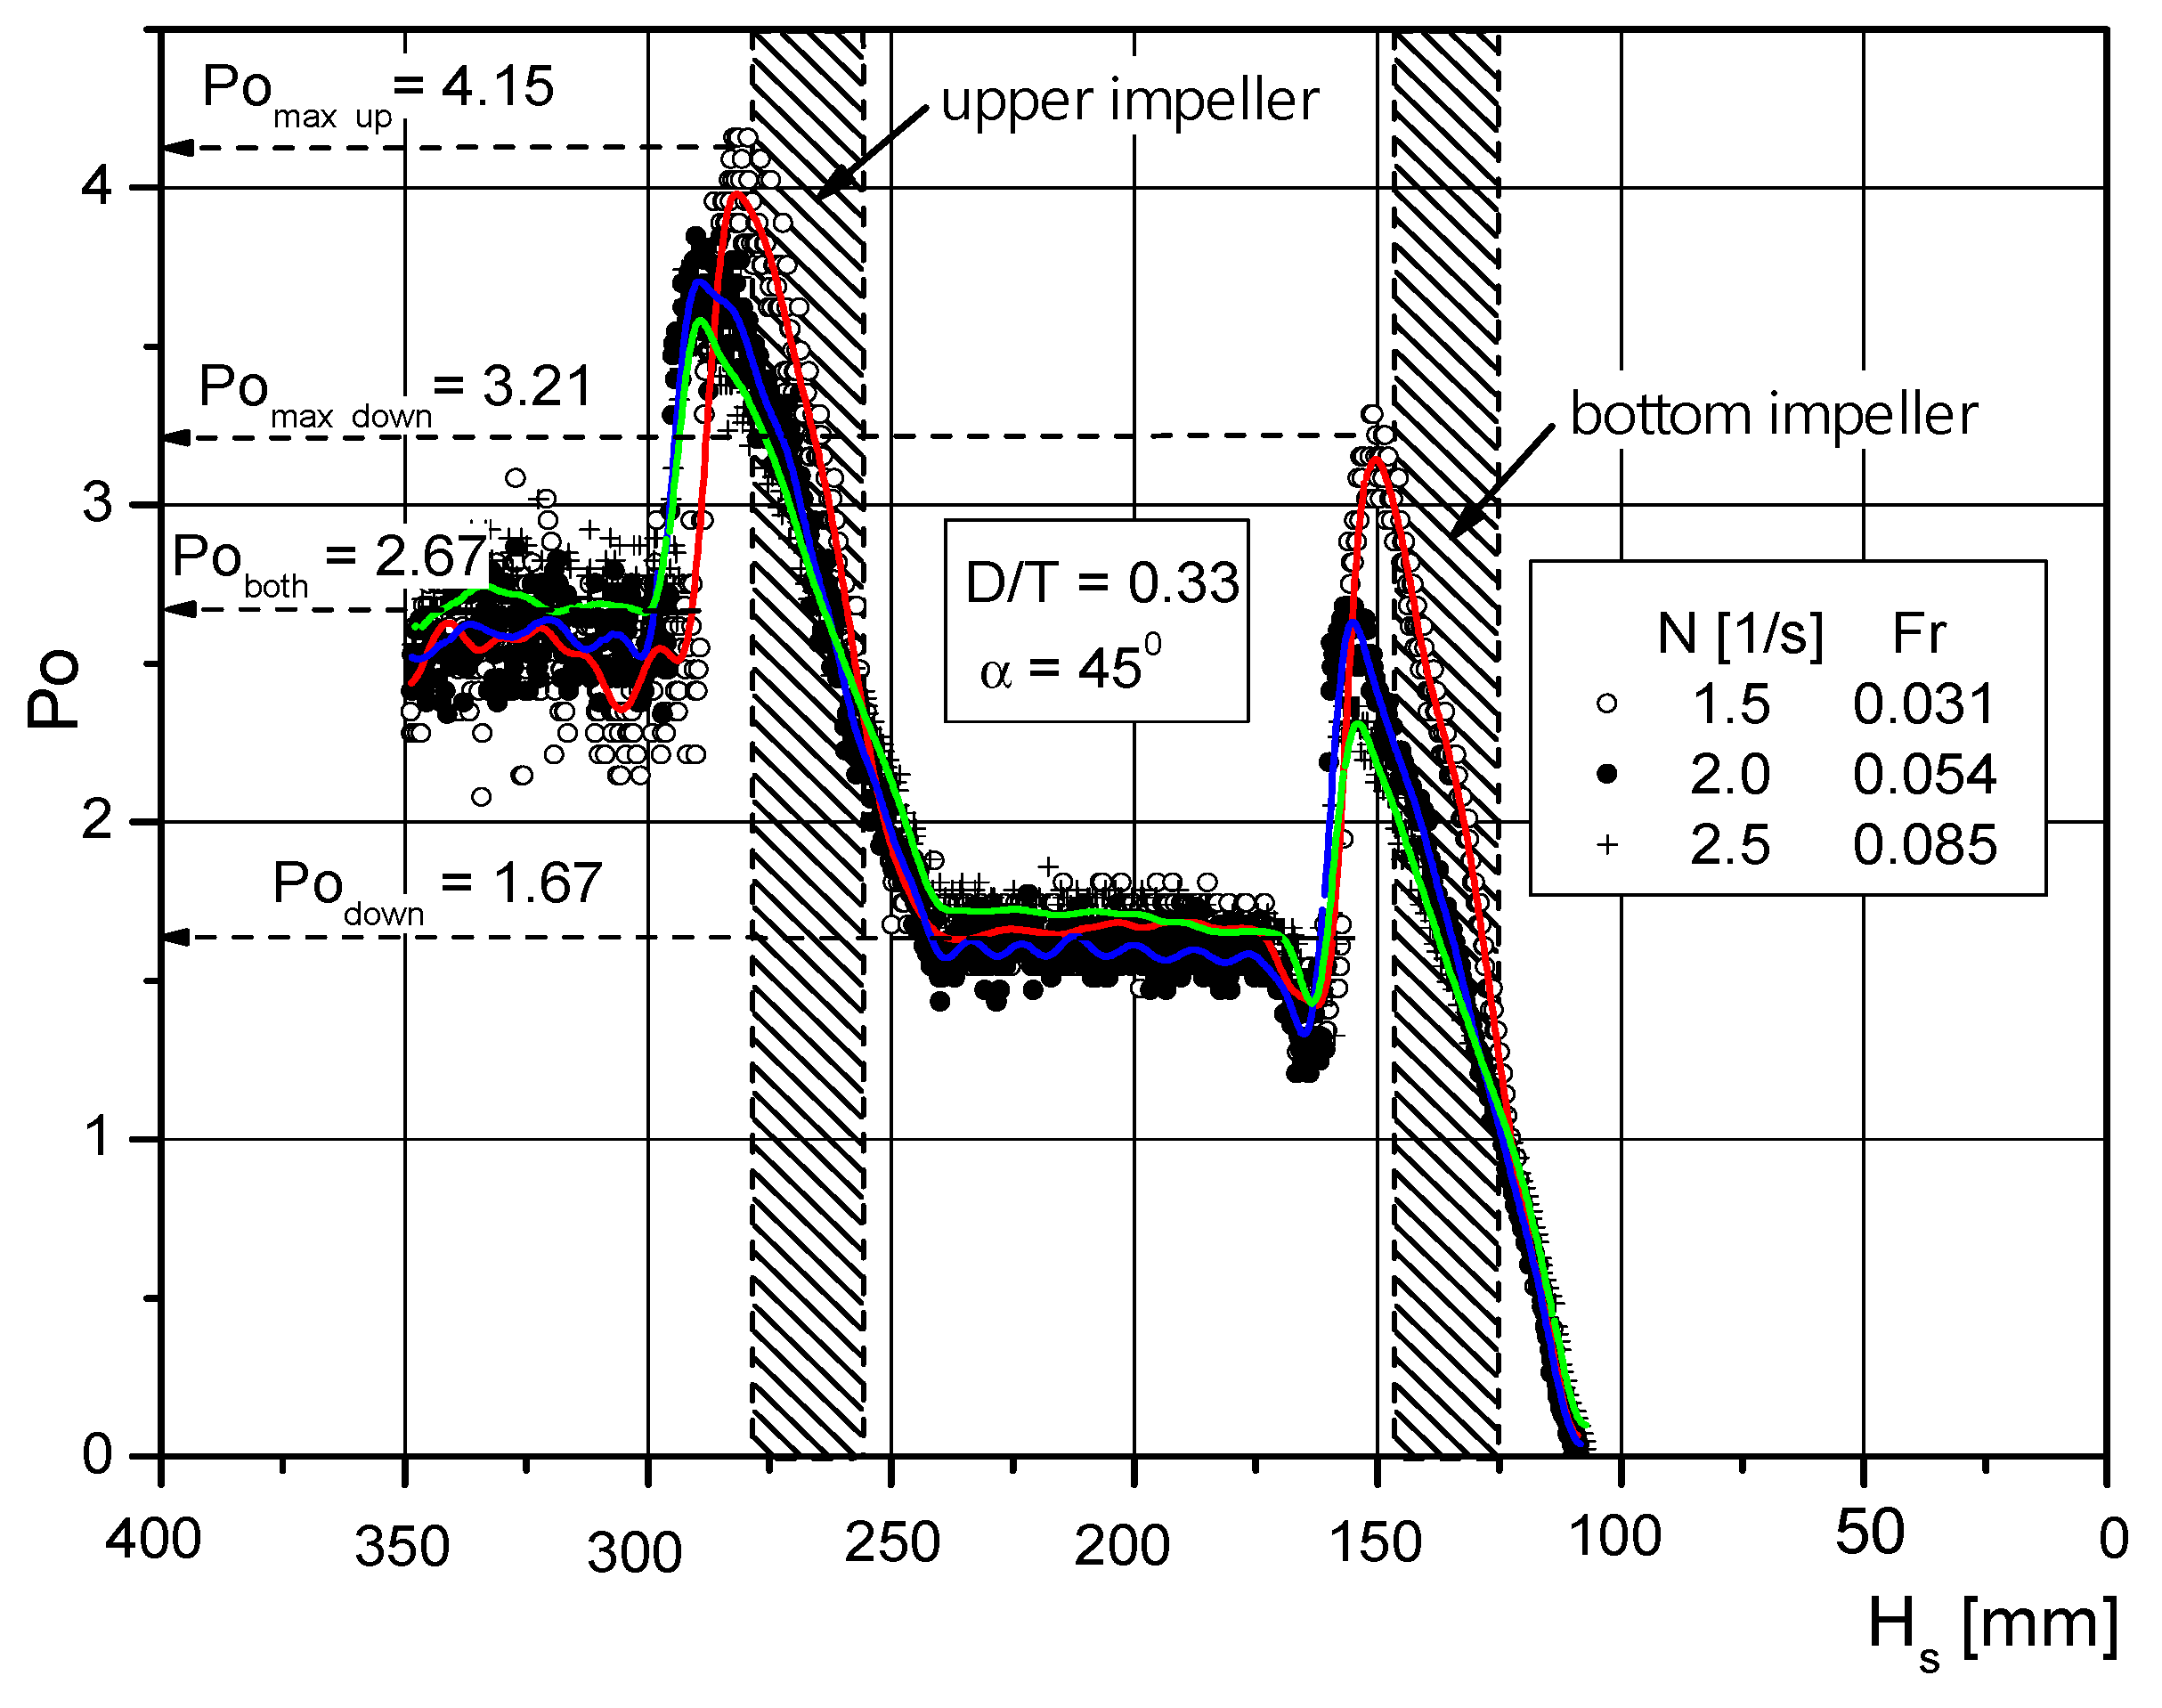
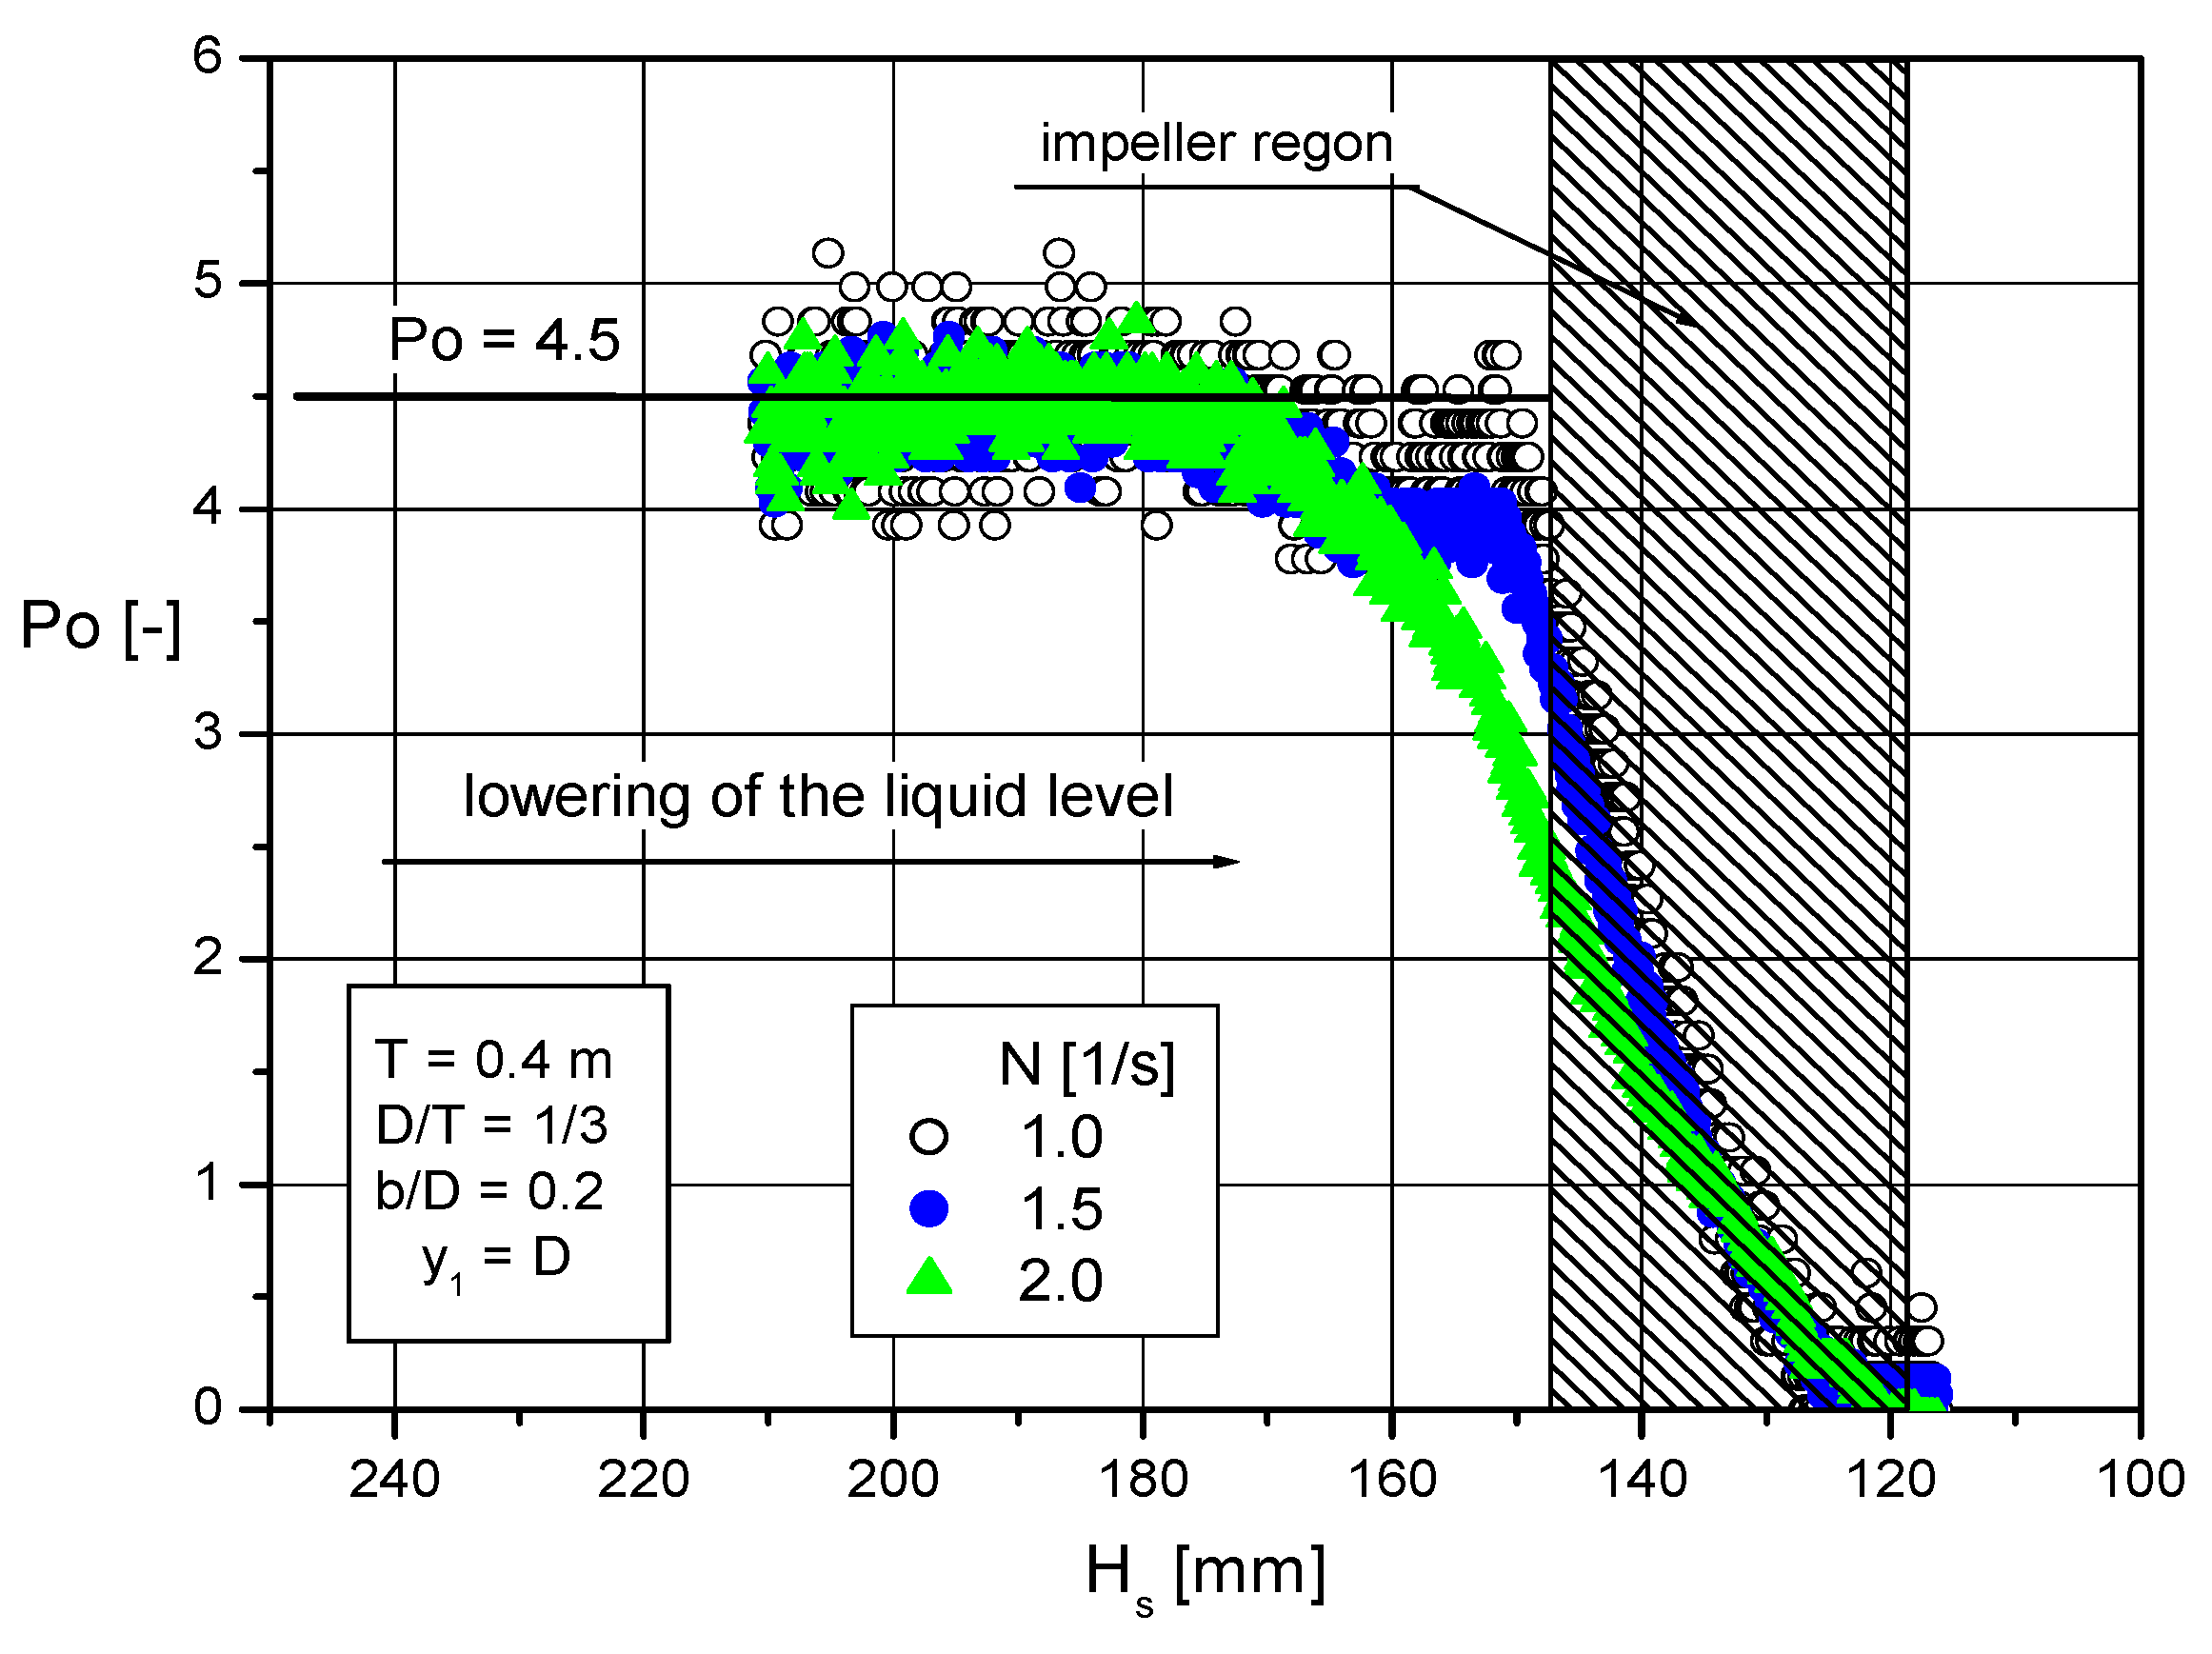
3.1. Mixing Power
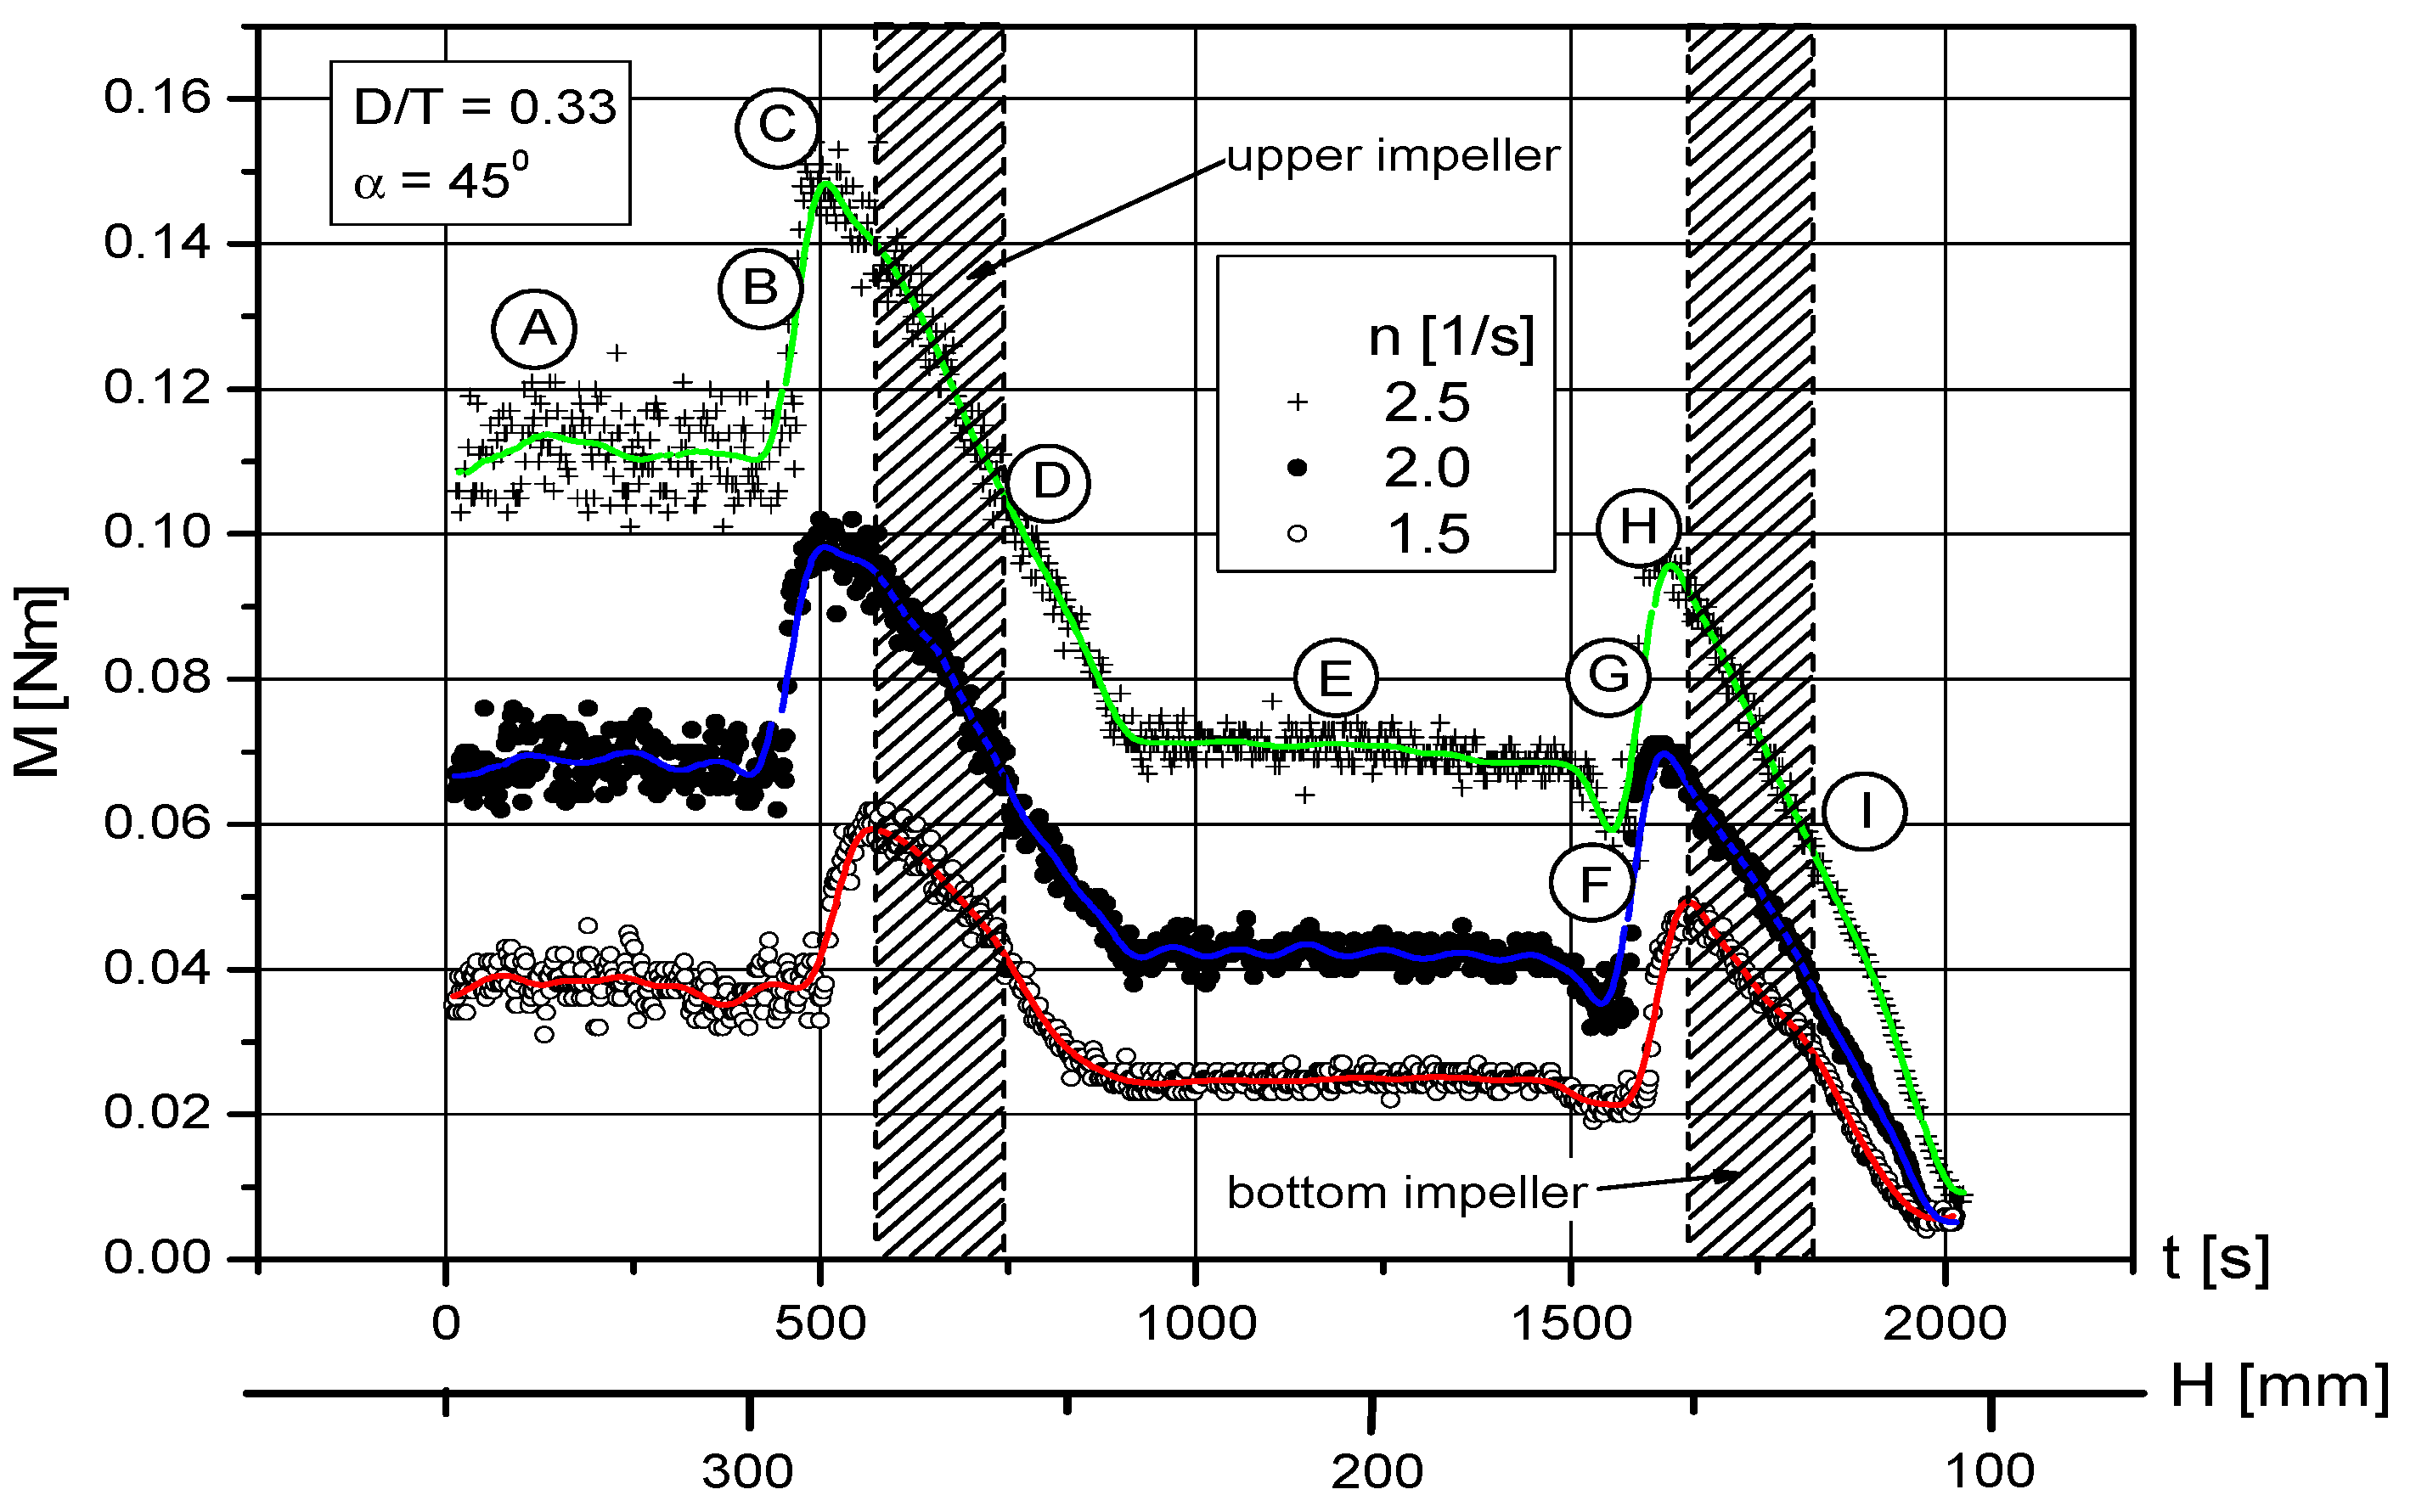
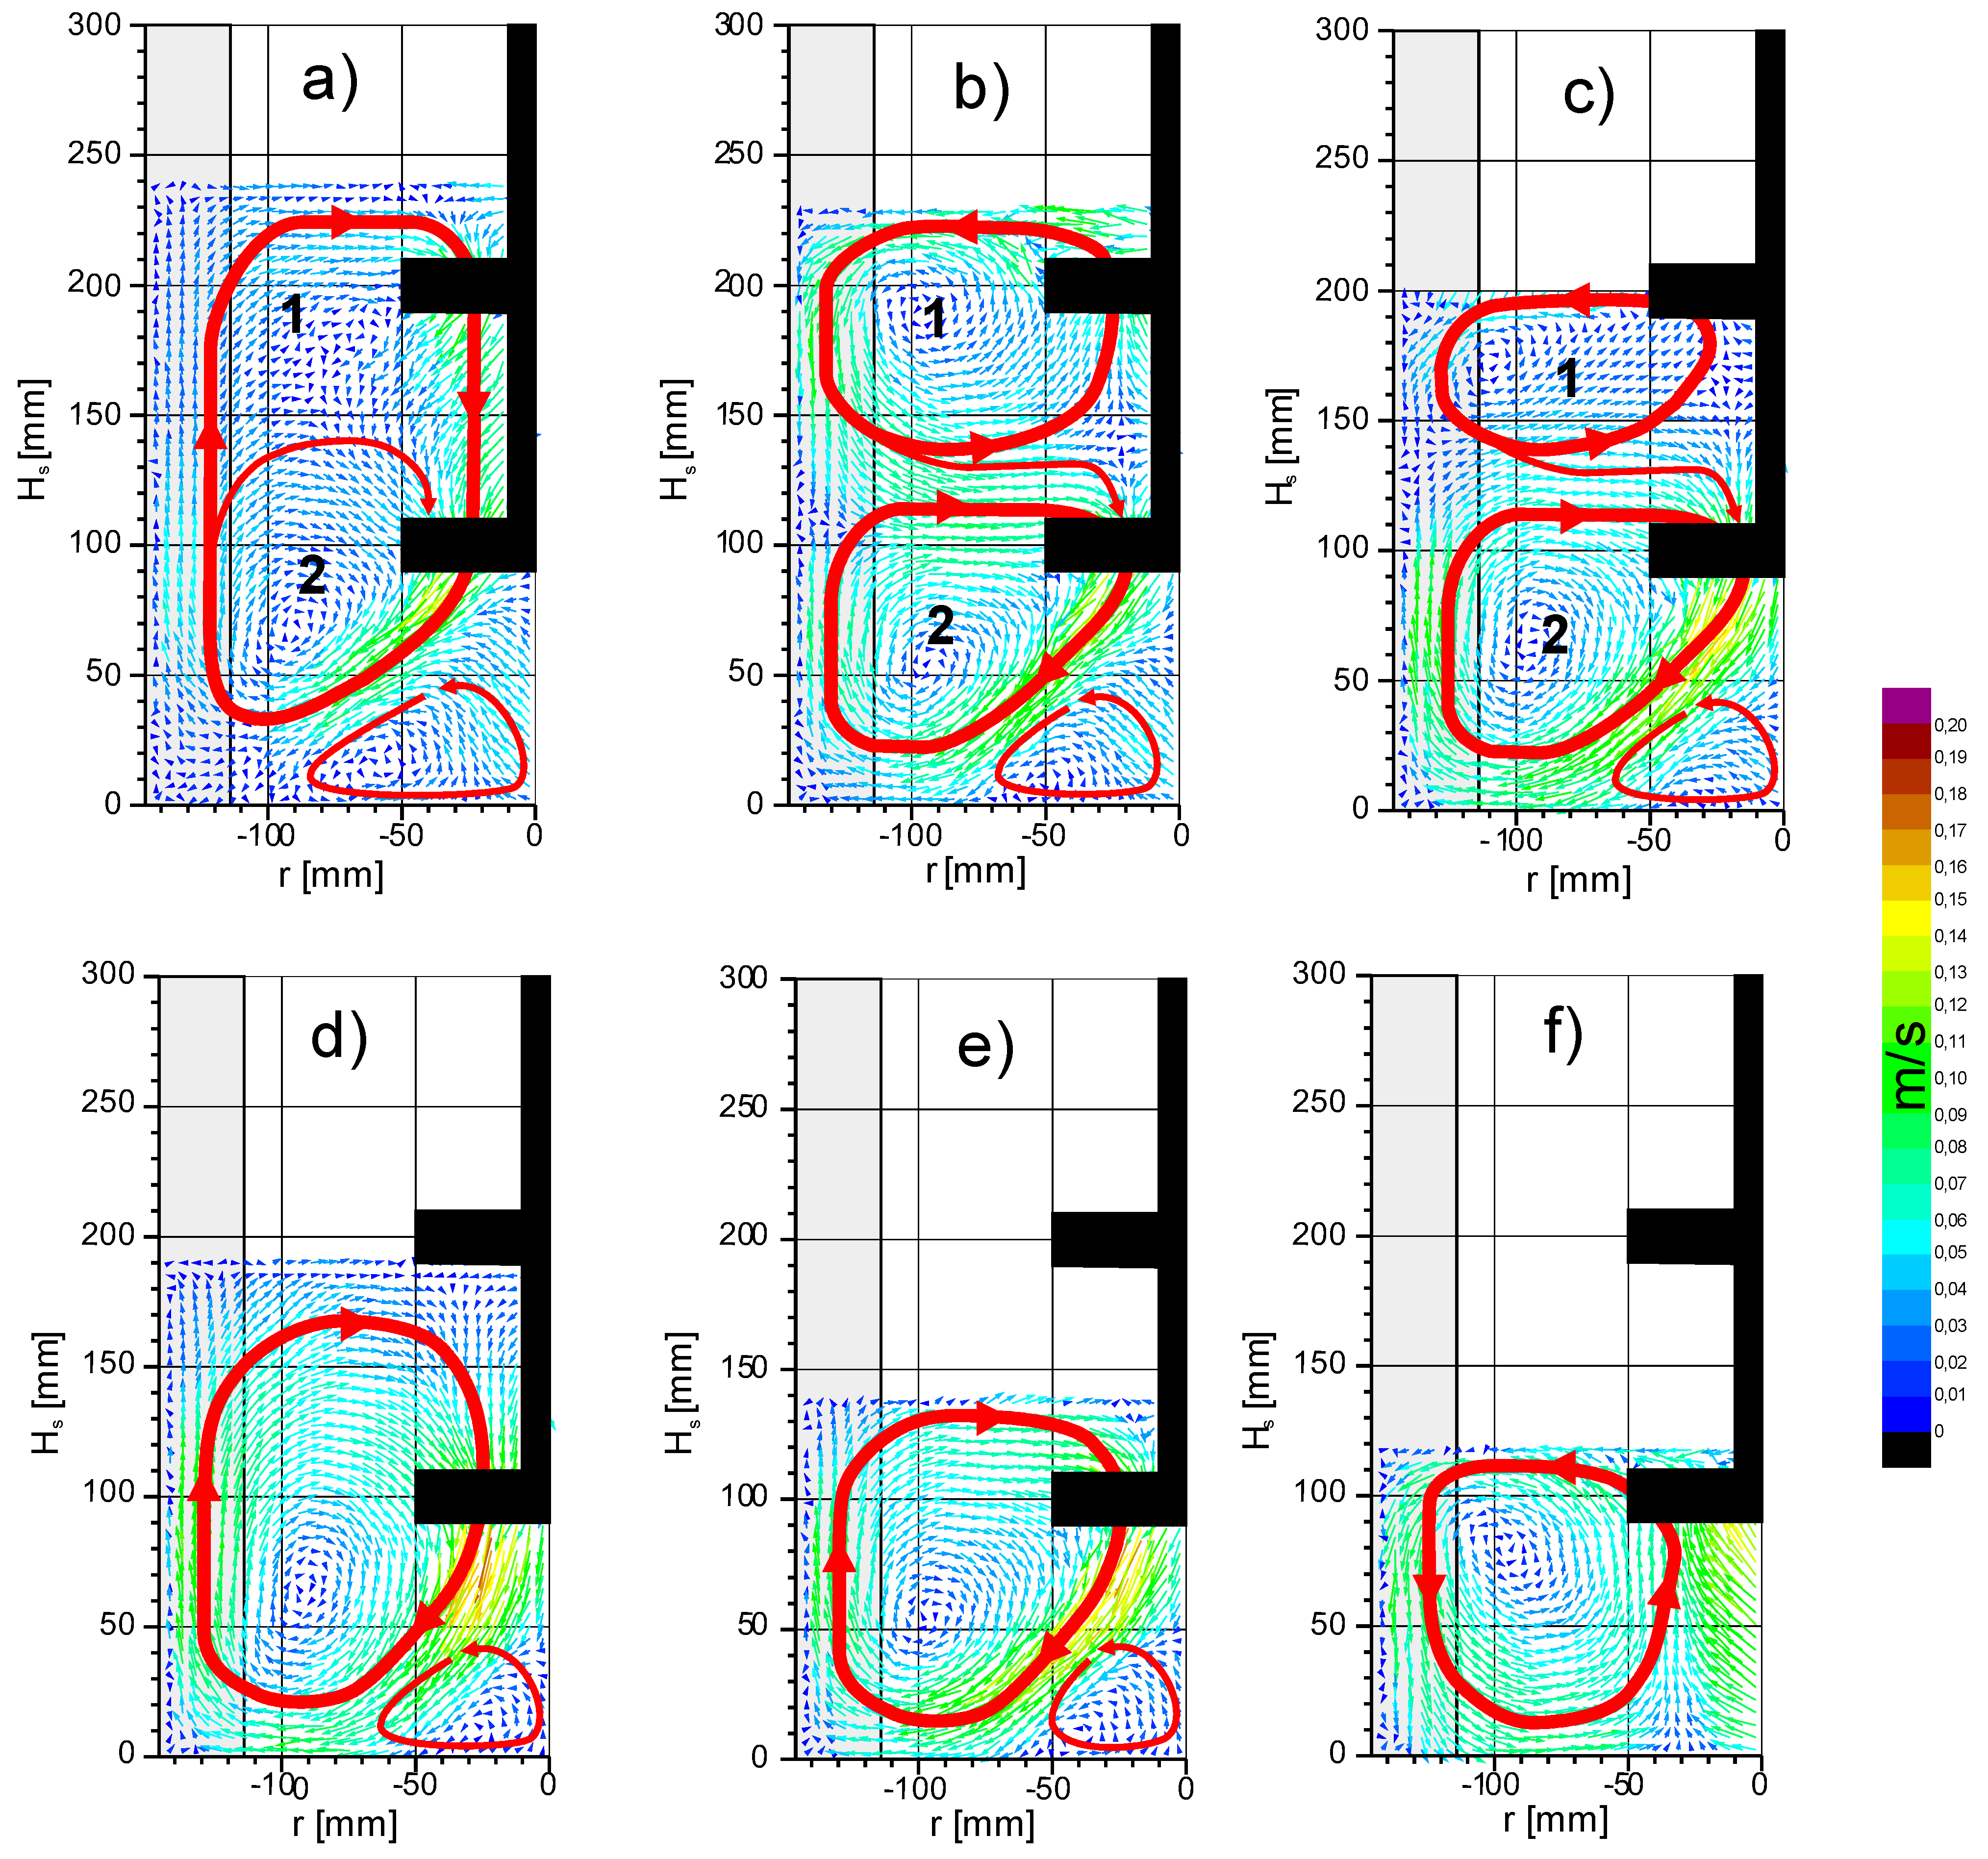
3.2. Pumping to the Bottom of the Mixing Tank
3.2.1. Area A—The Liquid Level in the Impeller Is Well Above the Edge of the Upper Impeller
3.2.2. Area B—The Liquid Level Approaches the Top of the Upper Impeller
3.2.3. Area C—The Liquid Level Is Just Above the Top Impeller
3.2.4. Area D—The Liquid Level Is in the Impeller Zone
3.2.5. Area E—The Liquid Level Is Below the Upper Impeller
3.2.6. Area F—The Liquid Level Is Near the Top of the Bottom Impeller
3.2.7. G and H Areas
3.2.8. Area I
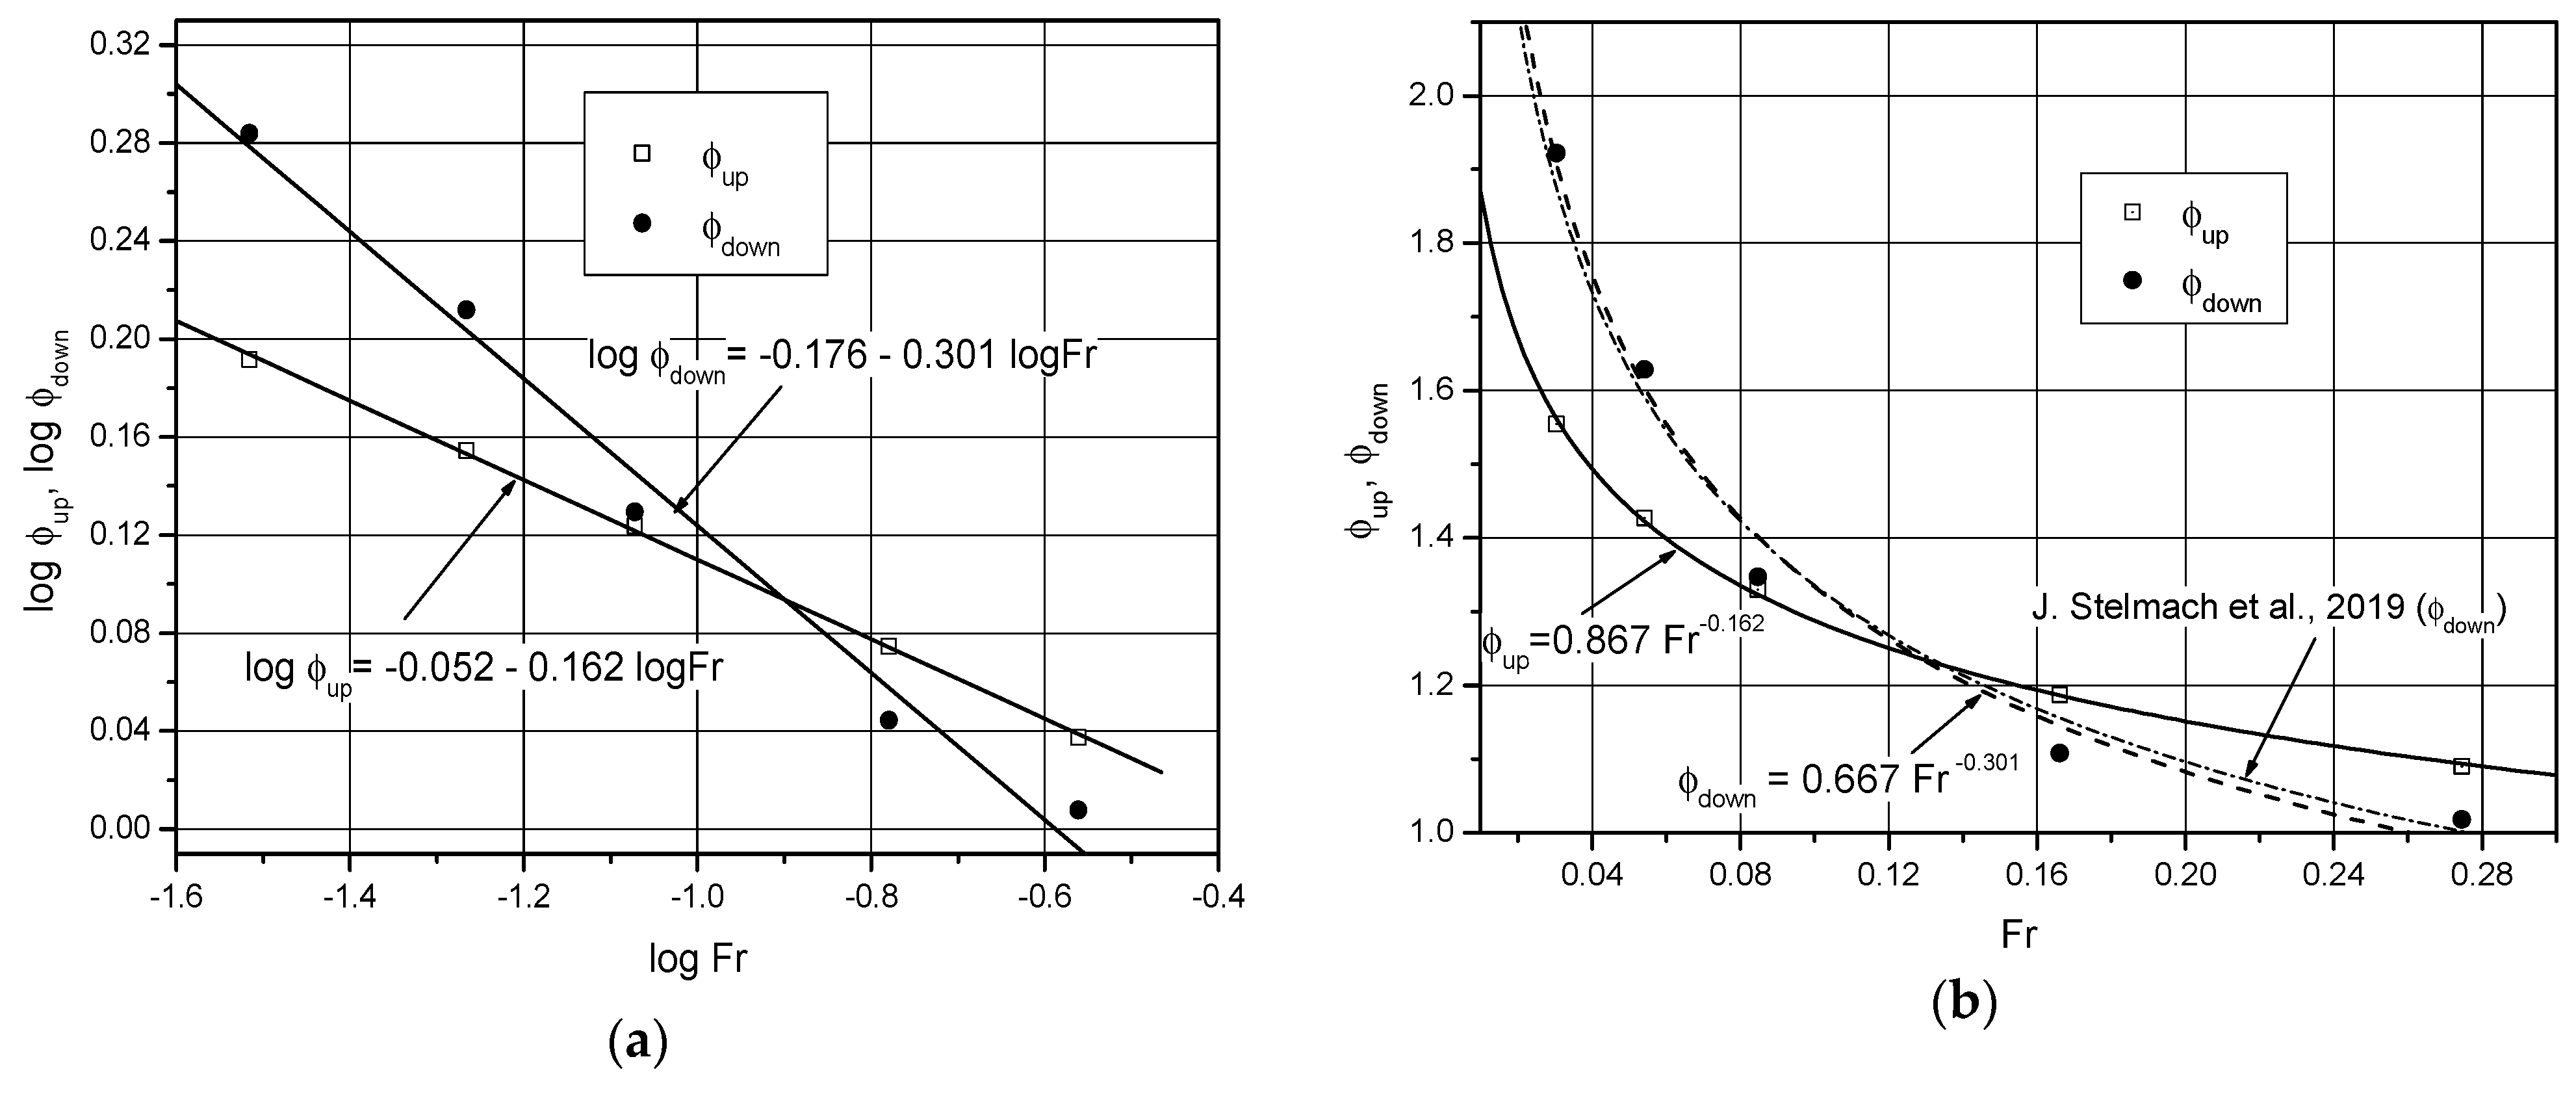
3.3. Determination of the Value of the Mixing Power Increase Factors
3.4. Radial Impellers
4. Conclusions
- The phenomenon of the increase in mixing power when emptying the tanks with the impeller working occurs only in the case of impellers with axial action.
- The instantaneous increase in the mixing power for two working impellers placed on a common shaft and pumping the liquid toward the bottom of the mixer may be even more than 50% greater in relation to the calculated power. This could damage the engine.
- The increase in mixing power takes place when the direction of rotation of the vortices of the radial-axial circulation changes i.e., when the free surface of the liquid approaches the upper surface of the impeller blades.
- The smaller the rotational frequency of the impeller (i.e., the lower the Froude number), the greater the relative increase in mixing power when emptying the tank.
- Further research should be conducted toward the dependence of the mixing power increase factor on the value of the secondary circulation in the mixer, not on the type of the impeller. It will also be advisable to carry out appropriate numerical simulations.
Author Contributions
Funding
Institutional Review Board Statement
Informed Consent Statement
Data Availability Statement
Acknowledgments
Conflicts of Interest
Symbols
| D | the diameter of the impeller, m |
| H | tank height, m |
| Hs | the current height of the liquid in the tank, m |
| M | torque, Nm |
| N | rotational frequency, s−1 |
| P | power, W |
| R | radius, m |
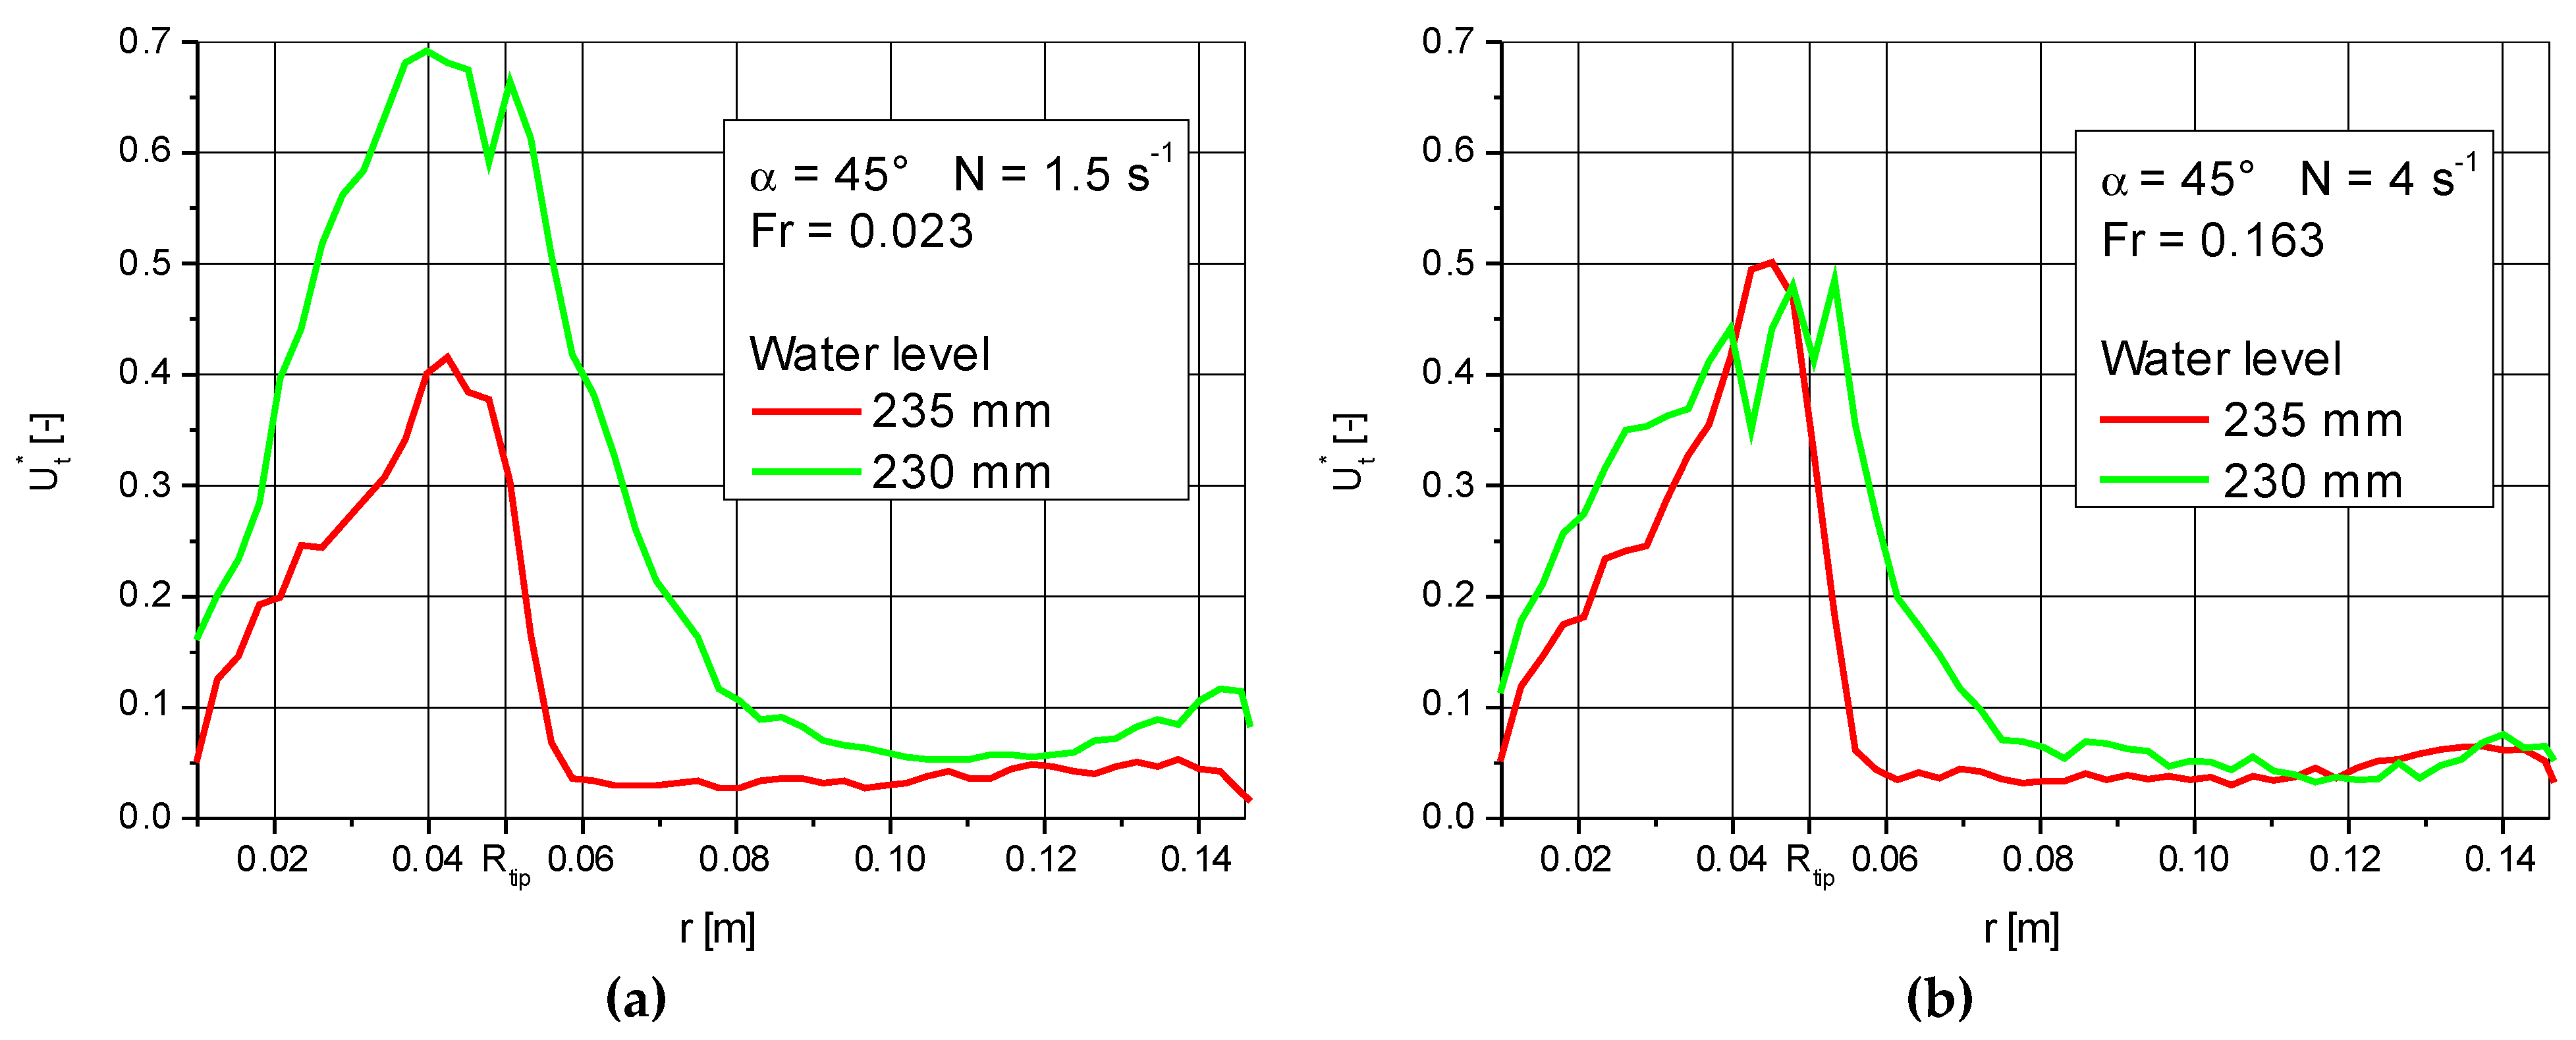
| Ut | peripheral velocity, m/s |
| dimensionless peripheral speed | |
| T | tank diameter, m |
| V | volume flow rate, m3/s |
| b | the width of the blade, m |
| g | acceleration due to gravity, m/s2 |
| hp | distance from the liquid level to the upper edge of the impeller blade, m |
| n | number of impeller blades |
| r | radial coordinate, m |
| y | the height of the impeller suspension above the tank bottom, m |
| y1 | distance of the center of the lower impeller from the tank bottom, m |
| y2 | distance from the center of the upper impeller to the tank bottom, m |
| z | axial coordinate, m |
| α | the angle of inclination of the blades in relation to the horizontal plane, rad |
| η | viscosity, Pas |
| φ | mixing power increase factor |
| ρ | density, kg/m3 |
| Subscripts | |
| up | refers to the top impeller |
| down | refers to the bottom impeller |
| both | applies to both impellers |
| Criterial numbers | |
| Reynolds number for mixing process | |
| Froude number for mixing process | |
| Power number | |
References
- Fitschen, J.; Maly, M.; Rosseburg, A.; Wutz, J.; Wucherpfennig, T.; Schlüter, M. Influence of Spacing of Multiple Impellers on Power Input in an Industrial-Scale Aerated Stirred Tank Reactor. Chem. Ing. Technol. 2019, 91, 1794–1801. [Google Scholar] [CrossRef] [Green Version]
- Li, Z.; Hu, M.; Bao, Y.; Gao, Z. Particle image velocimetry experiments and large eddy simulations of merging flow characteristics in dual Rushton turbine stirred tanks. Ind. Eng. Chem. Res. 2012, 51, 2438–2450. [Google Scholar] [CrossRef]
- Khopkar, A.R.; Tanguy, P.A. CFD simulation of gas-liquid flows in stirred vessel equipped with dual Rushton turbines: Influence of parallel, merging and diverging flow configurations. Chem. Eng. Sci. 2008, 63, 3810–3820. [Google Scholar] [CrossRef]
- Min, J.; Bao, Y.; Chen, L.; Gao, Z.; Smith, J.M. Numerical simulation of gas dispersion in an aerated stirred reactor with multiple impellers. Ind. Eng. Chem. Res. 2008, 47, 7112–7117. [Google Scholar] [CrossRef]
- Bao, Y.; Yang, J.; Chen, L.; Gao, Z. Influence of the top impeller diameter on the gas dispersion in a sparged multi-impeller stirred tank. Ind. Eng. Chem. Res. 2012, 51, 12411–12420. [Google Scholar] [CrossRef]
- Pan, C.; Min, J.; Liu, X.; Gao, Z. Investigation of fluid flow in a dual rushton impeller stirred tank using particle image velocimetry. Chin. J. Chem. Eng. 2008, 16, 693–699. [Google Scholar] [CrossRef]
- Wang, T.; Yu, G.; Yong, Y.; Yang, C.; Mao, Z.-S. Hydrodynamic characteristics of dual-impeller configurations in a multiple-phase stirred tank. Ind. Eng. Chem. Res. 2009, 49, 1001–1009. [Google Scholar] [CrossRef]
- Lehn, M.C.; Myers, K.J.; Barker, A. Impeller design for solids suspension under gassed conditions. Can. J. Chem. Eng. 1999, 77, 1065–1071. [Google Scholar] [CrossRef]
- Vrabel, P.; van der Lans, R.G.J.M.; Luyben, K.C.H.A.M.; Boon, L.; Nienow, A.W. Mixing in large-scale vessels stirred with multiple radial or radial and axial up-pumping impellers: Modelling and measurements. Chem. Eng. Sci. 2000, 55, 5881–5896. [Google Scholar] [CrossRef]
- Shewale, S.D.; Pandit, A.B. Studies in multiple impeller agitated gas-liquid contactors. Chem. Eng. Sci. 2006, 61, 489–504. [Google Scholar] [CrossRef]
- Pinelli, D. Hold-up in low viscosity gas-liquid systems stirred with multiple impellers. Comparison of different impeller types and sets. Inst. Chem. Eng. Symp. Ser. 1994, 136, 81–88. [Google Scholar]
- Gogate, P.R.; Beenackers, A.A.C.M.; Pandit, A.B. Multiple-impeller systems with a special emphasis on bioreactors: A critical review. Biochem. Eng. J. 2000, 6, 109–144. [Google Scholar] [CrossRef]
- Tiam You, S.; Raman, A.A.; Shah, R.S.; Nor, M.I. Multiple-impeller stirred vessel studies. Chem. Eng. 2014, 30, 323–336. [Google Scholar]
- Puthli, M.S.; Rathod, V.K.; Pandit, A.B. Gas-liquid mass transfer studies with triple impeller system on a laboratory scale bioreactor. Biochem. Eng. J. 2005, 23, 25–30. [Google Scholar] [CrossRef]
- Montante, G.; Laurenzi, F.; Paglianti, A.; Magelli, F. Two-phase flow and bubble size distribution in air sparged and surface-aerated vessels stirred by a dual impeller. Ind. Eng. Chem. Res. 2010, 49, 2613–2623. [Google Scholar] [CrossRef]
- Fujasová, M.; Linek, V.; Moucha, T.; Prokopová, E. Energy demands of different impeller types in gas-liquid dispersions. Sep. Purif. Technol. 2004, 39, 123–131. [Google Scholar] [CrossRef]
- Shukla, V.B.; Veera, U.P.; Kulkarni, P.R.; Pandit, A.B. Scale-up of biotransformation process in stirred tank reactor using dual impeller bioreactor. Biochem. Eng. J. 2001, 8, 19–29. [Google Scholar] [CrossRef]
- Vogel, H.C.; Todaro, C.M. Fermentation and Biochemical Handbook, 2nd ed.; William Andrew: Waltham, MA, USA, 1996. [Google Scholar]
- O’Kane, K. The Effect of Geometric Parameters on the Power Consumption of Turbine Impellers Operating in Nonviscous Fluids. In Proceedings of the 1st European Conference on Mixing and Centrifugal Separation, Cambridge, UK, 9–11 September 1974; BHRA Fluid Engineering: Cranfeld, UK, 1974. Paper A3. pp. 23–31. [Google Scholar]
- Shiue, S.J.; Wong, C.W. Studies on Homogenization Efficiency of Various Impellers in Liquid Blending. Can. J. Chem. Eng. 1984, 62, 602–609. [Google Scholar] [CrossRef]
- Chudacek, M.W. Impeller Power Numbers and Impeller Flow Numbers in Profiled Bottom Tanks. Ind. Eng. Chem. Process Des. Dev. 1985, 24, 858–867. [Google Scholar] [CrossRef]
- Machon, V.; McFarlane, C.M.; Nienow, A.W. Power Input and Gas Hold Up in Gas Liquid Dispersions Agitated by Axial Flow Impellers. In Proceedings of the 7th European Conference on Mixing, Brugge, Belgium, 18–20 September 1991; KVCV, Royal Flemish Society of Engineers: Leuven, Belgium, 1991; pp. 243–249. [Google Scholar]
- Rewatkar, V.B.; Raghava Rao, K.S.M.S.; Joshi, J.B. Power Consumption in Mechanically Agitated Contactors Using Pitched Bladed Turbine Impeller. Chem. Eng. Commun. 1990, 88, 69–90. [Google Scholar] [CrossRef]
- Bates, R.L.; Fondy, P.L.; Corpstein, R.R. An Examination of Some Geometric Parameters of Impeller Power. Ind. Eng. Chem. Process Des. Dev. 1963, 2, 310–314. [Google Scholar] [CrossRef]
- Armenante, P.M.; Uehara Nagamine, E. Solid Suspension and Power Dissipation in Stirred Tanks Agitated by One or Two Impellers at Low Off-Bottom Impeller Clearances. In Proceedings of the 9th European Conference on Mixing, Paris, France, 18−21 March 1997; Groupe Français de Génie des Procédés: Nancy, France, 1997; pp. 73–80. [Google Scholar]
- Armenante, P.M.; Mazzarotta, B.; Chang, G.-M. Power consumption in stirred tanks provided with multiple pitched-blade turbines. Ind. Eng. Chem. Res. 1999, 38, 2809–2816. [Google Scholar] [CrossRef]
- Armenante, P.M.; Huang, Y.-T.; Li, T. Determination of the minimum agitation speed to attain the just dispersed state in solid-liquid and liquid-liquid reactors provided with multiple impellers. Chem. Eng. Sci. 1992, 47, 2865–2870. [Google Scholar] [CrossRef]
- Paul, E.L.; Atiemo-Obeng, V.A.; Kresta, S.M. Handbook of Industrial Mixing; John Wiley & Sons: Hoboken, NJ, USA, 2004. [Google Scholar]
- Mazoch, J.; Rieger, F.; Jirout, T. Report TH 01020879; TECHMIX: Brno, Czech Republic, 2016. (In Czech) [Google Scholar]
- Zlokarnik, M. Stirring. Theory and Practice; Wiley-VCH: Weinheim, Germany, 2001; pp. 76–96. [Google Scholar]
- Nagata, S. Mixing: Principles and Applications; JohnWiley & Sons: New York, NY, USA, 1975; pp. 62–65. [Google Scholar]
- Regier, F.; Jirout, T.; Moravec, J.; Stelmach, J.; Kuncewicz, C. The phenomenon of icreasised mixing power consumption during tank empying. Przem. Chem. 2019, 98, 962–966. (In Polish) [Google Scholar]
- Stelmach, J.; Kuncewicz, C.; Rieger, F.; Moravec, J.; Jirout, T. Increase of mixing power during emptying of tanks with turbine-blade impellers. Przem. Chem. 2020, 99, 239–243. (In Polish) [Google Scholar]
- Stelmach, J.; Kuncewicz, C.; Szufa, S.; Jirout, T.; Rieger, F. The Influence of Hydrodynamic Changes in a System with a Pitched Blade Turbine on Mixing Power. Processes 2021, 9, 68. [Google Scholar] [CrossRef]
- Heim, A.; Gluba, T.; Obraniak, A. The effect of the wetting droplets size on power consumption during drum granulation. Granul. Matter 2004, 6, 137–143. [Google Scholar] [CrossRef]
- Heim, A.; Kaźmierczak, R.; Obraniak, A. Model of granular bed dynamics in the disk granulator: Model dynamiki złoża ziarnistego w granulatorze talerzowym. Chem. Proc. Eng. 2004, 25, 993–998. (In Polish) [Google Scholar]
- Obraniak, A.; Gluba, T. Model of energy consumption in the range of nucleation and granule growth in drum granulation bentonite. Physicochem. Probl. Miner. Process. 2012, 48, 121–128. [Google Scholar]
- Heim, A.; Stelmach, J. The comparison of velocities at the self-aspirating disk impeller level. Przem. Chem. 2011, 90, 1642–1646. (In Polish) [Google Scholar]
- Rao, K.R.; Joshi, J.B. Liquid Phase Mixing in Mechanically Agitated Vessels. Chem. Eng. Commun. 1988, 74, 1–25. [Google Scholar]
- Rushton, J.H.; Costich, E.W.; Everett, H.J. Power Characteristics of Mixing Impellers. Chem. Eng. Prog. 1950, 46(Part I), 395–402. [Google Scholar]
- Stręk, F. Mieszanie i Mieszalniki; WNT: Warszawa, Poland, 1981. (In Polish) [Google Scholar]
- Adrian, Ł.; Piersa, P.; Szufa, S.; Romanowska-Duda, Z.; Grzesik, M.; Cebula, A.; Kowalczyk, S.; Ratajczyk-Szufa, J. Experimental research and thermographic analysis of heat transfer processes in a heat pipe heat exchanger utilizing as a working fluid R134A. In Renewable Energy Sources: Engineering, Technology, Innovation; Springer: Berlin/Heidelberg, Germany, 2018; pp. 413–421. ISBN 978-3-319-72370-9. [Google Scholar] [CrossRef]
- Kryszak, D.; Bartoszewicz, A.; Szufa, S.; Piersa, P.; Obraniak, A.; Olejnik, T.P. Modeling of Transport of Loose Products with the Use of the Non-Grid Method of Discrete Elements (DEM). Processes 2020, 8, 1489. [Google Scholar] [CrossRef]
- Szufa, S.; Piersa, P.; Adrian, Ł.; Sielski, J.; Grzesik, M.; Romanowska-Duda, Z.; Piotrowski, K.; Lewandowska, W. Acquisition of Torrefied Biomass from Jerusalem Artichoke Grown in a Closed Circular System Using Biogas Plant Waste. Molecules 2020, 25, 3862. [Google Scholar] [CrossRef]
- Dzikuć, M.; Kuryło, P.; Dudziak, R.; Szufa, S.; Dzikuć, M.; Godzisz, K. Selected Aspects of Combustion Optimization of Coal in Power Plants. Energies 2020, 13, 2208. [Google Scholar] [CrossRef]
- Dzikuć, M.; Piwowar, P.; Szufa, S.; Adamczyk, J.; Dzikuć, M. Potential and scenarios of variants of thermo-modernization of single-family houses: An example of the Lubuskie Voivodeship. Energies 2021, 14, 191. [Google Scholar] [CrossRef]
- Dzikuć, M.; Dzikuć, M. Ekonomiczne determinanty ograniczenia emisji benzo[a]pirenu na obszarze Środkowego Nadodrza. Przemysł Chem. 2019, 98, 600–603. [Google Scholar] [CrossRef]
- Szufa, S. Use of superheated steam in the process of biomass torrefaction. Przemysł Chem. 2020, 99, 1797–1801. (In Polish) [Google Scholar] [CrossRef]


| Author | Po | Comments | Our Work |
|---|---|---|---|
| Machon et al., 1991 [22] | 1.72 | D/T = 0.5 | 1.63 |
| Rewatkar et al., 1990 [23] | 1.64 | Equation (1) | |
| Raghava Rao and Joshi, 1988 [39] | 1.61 | ||
| Chudacek et.al., 1985 [21] | 1.63 | ||
| Shiue and Wong, 1984 [20] | 1.74 | 4-PBT45°, b/D = 0.23 | |
| O’Kane, 1974 [19] | 1.52 | ||
| Rushton et al., 1950 [40] | 1.42 | H/T = 0.92 |
| N [s−1] | Re | Fr | Pomax up | Pomax down | φup | φdown |
|---|---|---|---|---|---|---|
| 1.5 | 26,500 | 0.0305 | 4.15 | 3.21 | 1.55 | 1.97 |
| 2.0 | 35,400 | 0.0542 | 3.81 | 2.72 | 1.43 | 1.63 |
| 2.5 | 44,200 | 0.0847 | 3.55 | 2.25 | 1.33 | 1.35 |
| 3.5 | 61,900 | 0.1660 | 3.17 | 1.79 | 1.19 | 1.07 |
| 4.5 | 79,600 | 0.2740 | 2.97 | 1.67 | 1.11 | 1.00 |
Publisher’s Note: MDPI stays neutral with regard to jurisdictional claims in published maps and institutional affiliations. |
© 2021 by the authors. Licensee MDPI, Basel, Switzerland. This article is an open access article distributed under the terms and conditions of the Creative Commons Attribution (CC BY) license (http://creativecommons.org/licenses/by/4.0/).
Share and Cite
Stelmach, J.; Kuncewicz, C.; Adrian, Ł.; Jirout, T.; Rieger, F. Change in Mixing Power of a Two-PBT Impeller When Emptying a Tank. Processes 2021, 9, 341. https://doi.org/10.3390/pr9020341
Stelmach J, Kuncewicz C, Adrian Ł, Jirout T, Rieger F. Change in Mixing Power of a Two-PBT Impeller When Emptying a Tank. Processes. 2021; 9(2):341. https://doi.org/10.3390/pr9020341
Chicago/Turabian StyleStelmach, Jacek, Czesław Kuncewicz, Łukasz Adrian, Tomaš Jirout, and Frantisek Rieger. 2021. "Change in Mixing Power of a Two-PBT Impeller When Emptying a Tank" Processes 9, no. 2: 341. https://doi.org/10.3390/pr9020341
APA StyleStelmach, J., Kuncewicz, C., Adrian, Ł., Jirout, T., & Rieger, F. (2021). Change in Mixing Power of a Two-PBT Impeller When Emptying a Tank. Processes, 9(2), 341. https://doi.org/10.3390/pr9020341