Abstract
Reliable electrical and thermal energy supplies are basic requirements for modern societies and their food supply. Stand-alone stationary power generators based on solid oxide fuel cells (SOFC) represent an attractive solution to the problems of providing the energy required in both rural communities and in rurally-based industries such as those of the agricultural industry. The great advantages of SOFC-based systems are high efficiency and high fuel flexibility. A wide range of commercially available fuels can be used with no or low-effort pre-treatment. In this study, a design process for stand-alone system consisting of a reformer unit and an SOFC-based power generator is presented and tested. An adequate agreement between the measured and simulated values for the gas compositions after a reformer unit is observed with a maximum error of 3 vol% (volume percent). Theoretical degradation free operation conditions determined by employing equilibrium calculations are identified to be steam to carbon ratio (H2O/C) higher 0.6 for auto-thermal reformation and H2O/C higher 1 for internal reforming. The produced gas mixtures are used to fuel large planar electrolyte supported cells (ESC). Current densities up to 500 mA/cm2 at 0.75 V are reached under internal reforming conditions without degradation of the cells anode during the more than 500 h long-term test run. More detailed electrochemical analysis of SOFCs fed with different fuel mixtures showed that major losses are caused by gas diffusion processes.
1. Introduction
Reducing greenhouse gas emissions to minimize the impact of global warming is one of the main objectives set by society today. To take a step towards this goal, reliable, efficient and green energy supply systems must be established. A reliable energy supply is especially needed within the agro industry which emits more than 10% of all greenhouse gases within the EU [1]. Solid oxide fuel cells (SOFC) offer an attractive possibility to generate sustainable and reliable thermal and electric energy in a very efficient manner. This technology does not depend on weather conditions or other environmental influences and can therefore be used in stand-alone applications, as shown in [2,3]. This is especially useful in rural and isolated areas as well as for critical processes. One of the major energy consumers in rural areas are greenhouses and the agricultural industry in total.
The major advantage of SOFC compared to conventional technologies such as internal combustion engines (ICE) are their high electrical efficiency aiming up to 70–80% in electric power plants as stated by [4]. This is caused by the direct conversion of chemical- to electrical energy instead of converting chemically bound energy to thermal energy as an intermediate step. Further, high temperature SOFCs are able to use a wide variety of fuels such as biogas, H, NH and biodiesel [5,6,7,8]. The efficiency of SOFCs seems not to be influenced by the kind of fuel used, if the spare fuel is neglected but by specific operating parameters such as the fuel use [9] or the SOFC operating temperature. Taking this into consideration, the system design has a great influence on the overall efficiency [8,10]. A favourable kind of fuel for stand-alone applications should have a high volume-related energy density due to storage purposes and an easy accessibility. However, most fuels which meet these requirements require a pre-treatment (desulphurisation, reforming, dechlorination) if they are used for SOFC. Otherwise, these fuels lead to a fast degradation of the fuel cells which results in a short lifetime.
This is especially the case if hydrocarbons or a mixture of carbonaceous species are used, as shown in [11,12]. The fuel pre-treatment is often realised using reforming reactors. Recent approaches of reforming reactions for carbonaceous fuels are: (i) auto-thermal reforming (ATR), which is described by reaction 1. It was conducted for different hydrocarbons in [13,14]
(iii) and partial oxidation was conducted for different hydrocarbons as well [17,18]. This reformation is described by reaction 3.
Nevertheless, SOFCs offer a great possibility of internal reforming of short-chained hydrocarbon-based fuels. This process is studied in more detail in [19,20]. The mentioned reforming processes are needed because long-chained hydrocarbons or other complex fuels cannot be used at the cell. They have first to be reformed into direct oxidizable species (H2, CO, etc.) which are then oxidized at the triple phase boundary (TPB) (Boundary between the gas phase, electron-conducting phase and ion-conducting phase) of the anode. Internal reforming has the advantage that no reformer and catalyst is needed but there are some disadvantages as well. Internal reforming needs steam to be added to the fuel. An unbalanced ratio of steam and fuel can lead to degradation of the fuel cell. SOFCs are also more sensitive to microstructural changes than the reformer catalysts that are used [21,22] and degradation of the SOFC leads to a defect of the main component in terms of functionality and costs of the system. Whereas degraded catalysts are easily exchangeable and cheaper. Degradation of the SOFC anode can have several reasons: (i) solid carbon deposition, which is one major challenge when using carbonaceous fuels as shown in [23,24,25,26,27,28,29], (ii) oxidation of the anode material, especially nickel, (iii) agglomeration of the nickel grains and (iv) poisoning by sulphur and chlorine, which is examined within [30,31]. The likelihood of degradation due to carbon deposition and nickel oxidation can be estimated by the C-H-O (Carbon-Hydrogen-Oxygen) ratio of the fuel gas composition as shown in [32,33,34]. However, locally different fuel gas compositions and operating currents have a significant impact on the degradation process and change of the nickel grains as shown in [24,35,36,37]. Nickel agglomeration is mainly caused by grain growth due to high temperatures as explained in [38]. Anode poisoning is caused by impurities within the fuel used or the gas pipes. Khan et al. [39] made a review about the mentioned and other degradation mechanisms of Ni-YSZ (Yttrium Stabilized Zirconium) SOFC. Internal reforming of hydrocarbons mainly results in two degradation mechanisms, carbon deposition and nickel oxidation. These problems are caused by cracking of hydrocarbons which is described in reaction 4 for methane, the Boudouard reaction 5 and differences in the local gas compositions along the surface of the cell. If fuel pre-treatment is used, cracking and the Boudouard reaction are pronounced along the catalyst instead.
Nonetheless, even if fuel reforming reactors are used, degradation processes of the SOFC can occur. This leads to the necessity to monitor the SOFC performance and identify degradation processes at their early stage. For this purpose, application of online monitoring tools is necessary. When applying online monitoring tools, the application of performance alternating can be obtained within very short time, thus enabling identification of degradation mechanisms at an early stage [19,24,40,41,42,43]. Applying this knowledge, the operating point can be shifted to minor or degradation free conditions.
The goal of this work is to define and test a design process for stand-alone SOFC systems. For this purpose, a step by step testing of essential system components is presented and the combination of theoretical and experimental approaches including online monitoring based on the distribution of relaxation times (DRT) method is applied. This is done as a first step in the AGRO-SOFC project, which has the goal to develop a stand-alone SOFC-system to supply a greenhouse with heat and electric energy. Furthermore, the state of health of the SOFC-system should be monitored during the operation. In addition, the influence of the oxidizer for the reforming process is investigated and two different fuel pre-treatments are compared in terms of cell performance and degradation.
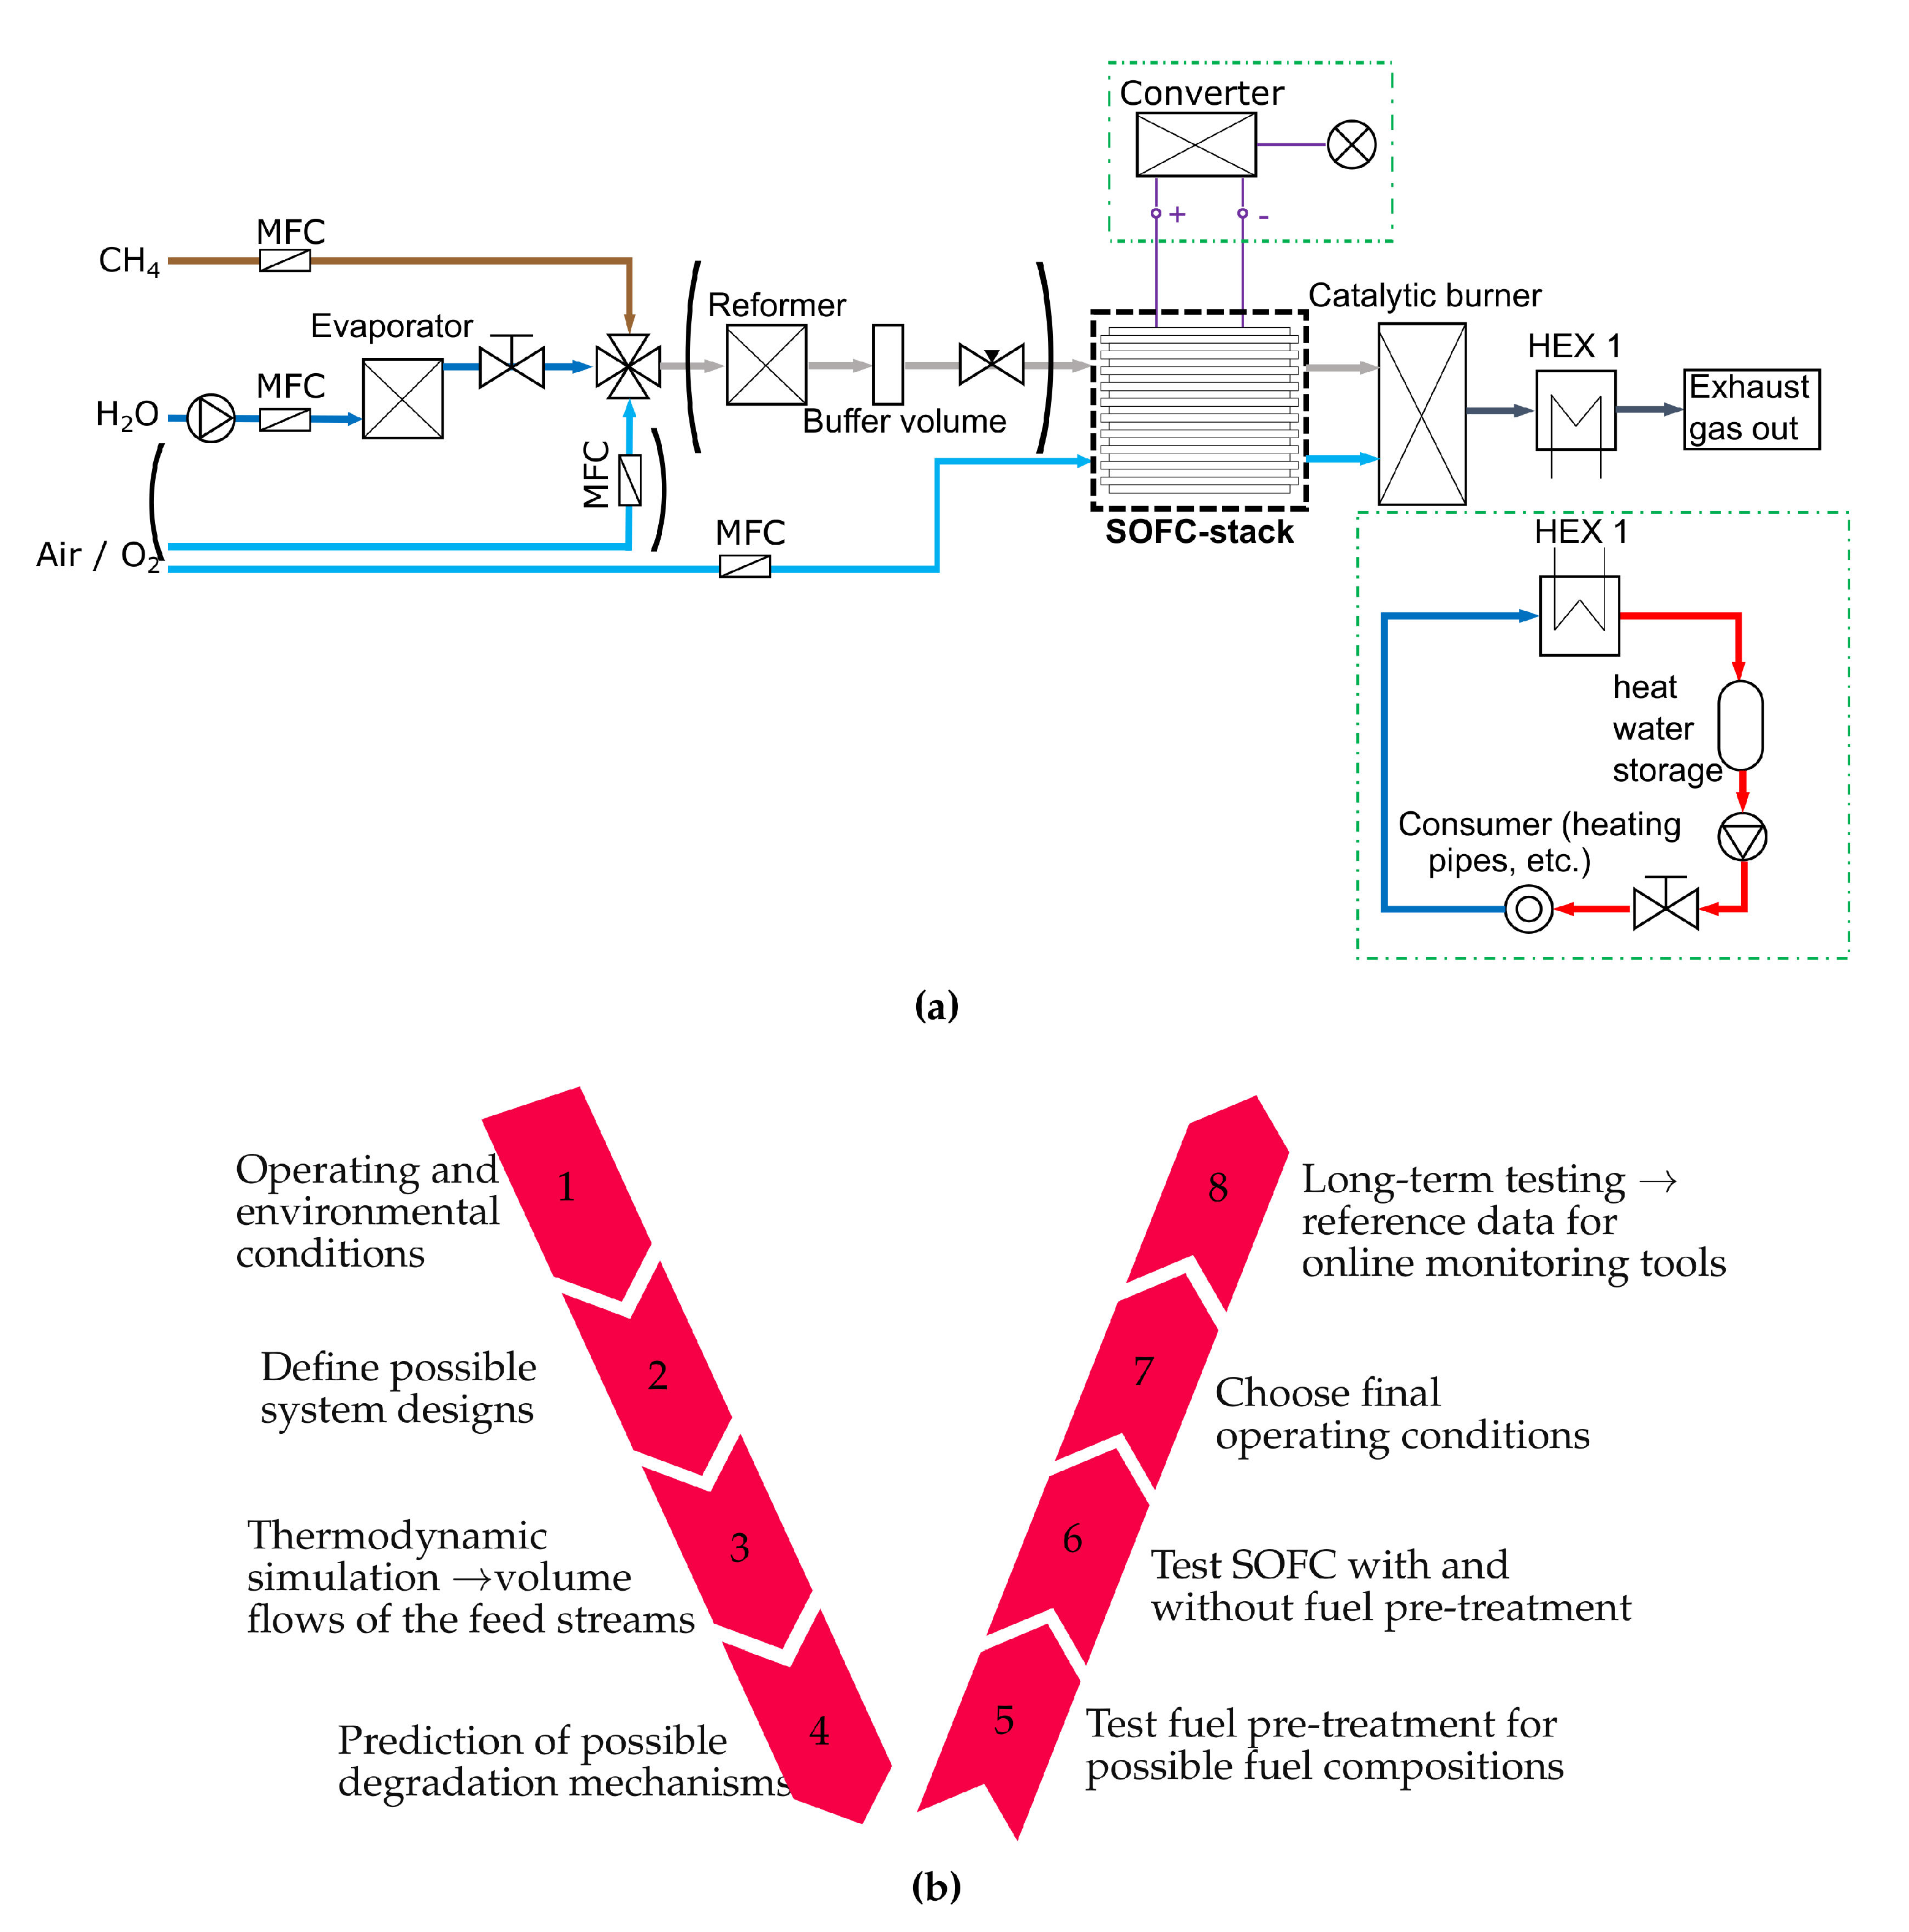
The approach of this work follows the design process shown in Figure 1b. First, the operating conditions of the system are defined. In this work a SOFC-system is proposed that is intended to supply a greenhouse with heat and electric energy. Methane is defined as fuel and only an oxidation medium and water are available to run the system. Methane is chosen because it is widely available as natural gas and it is the main component of biogas [44]. Second, a system design with internal reforming and with auto-thermal reforming is shown in Figure 1a. If internal reforming is used, only methane and steam have to be supplied to the anode side of the SOFC. Otherwise, methane, steam and air have to be supplied to a reformer and the off gas from it is then fed to the fuel cells anode. In the third step, a thermodynamic simulation is done. The system provided in Figure 1a is modelled in EBSILON®Professional [45] and the simulation is done as described in Section 2.1. Section 2.2 shows a methodology to predict degradation mechanisms without a complex fuel cell simulation model. The used methodology, based on equilibrium calculations, is investigated in several studies and shows a good agreement with measurement data [21,46,47,48]. Nevertheless, an experimental validation is essential. In the fifth step, the fuel pre-treatment is investigated, which is done in Section 3.1. After the auto-thermal reformer, the SOFC is tested under different conditions. Polarization curves, electrochemical impedance spectroscopy (EIS) measurements and the DRT method are used to characterize behaviour of the SOFCs employed. The most appropriate operating conditions for stand-alone SOFC systems are established by evaluating the cell characterization under varying conditions. These operating conditions are further tested in long term test runs, as described in Section 4.2.
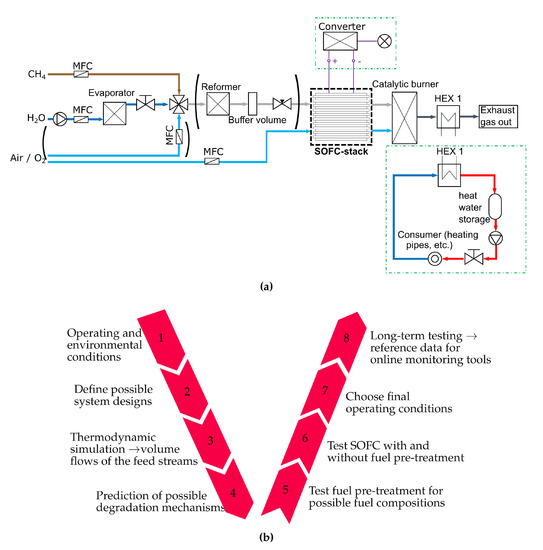
Figure 1.
(a) Design scheme of the SOFC stand-alone system (HEX 1 is a gas-water heat exchanger) (b) V- model of the SOFC-system design process.
2. Simulation
The simulation and equilibrium calculations are used to determine essential design parameters of the SOFC system. The most important of these are the H2O/C and O/C which are both molar ratios of HO or O to C, respectively. An additional outcome is the prediction of possible degradation mechanisms. The simulation environment of EBSILON®Professional is used to build up a compact model of the defined stand-alone SOFC-reformer system by using modules which are already available within the software library. Chemical calculations, especially equilibrium calculations are done using the software package HSC Chemistry® [49].
2.1. Reformer Modelling
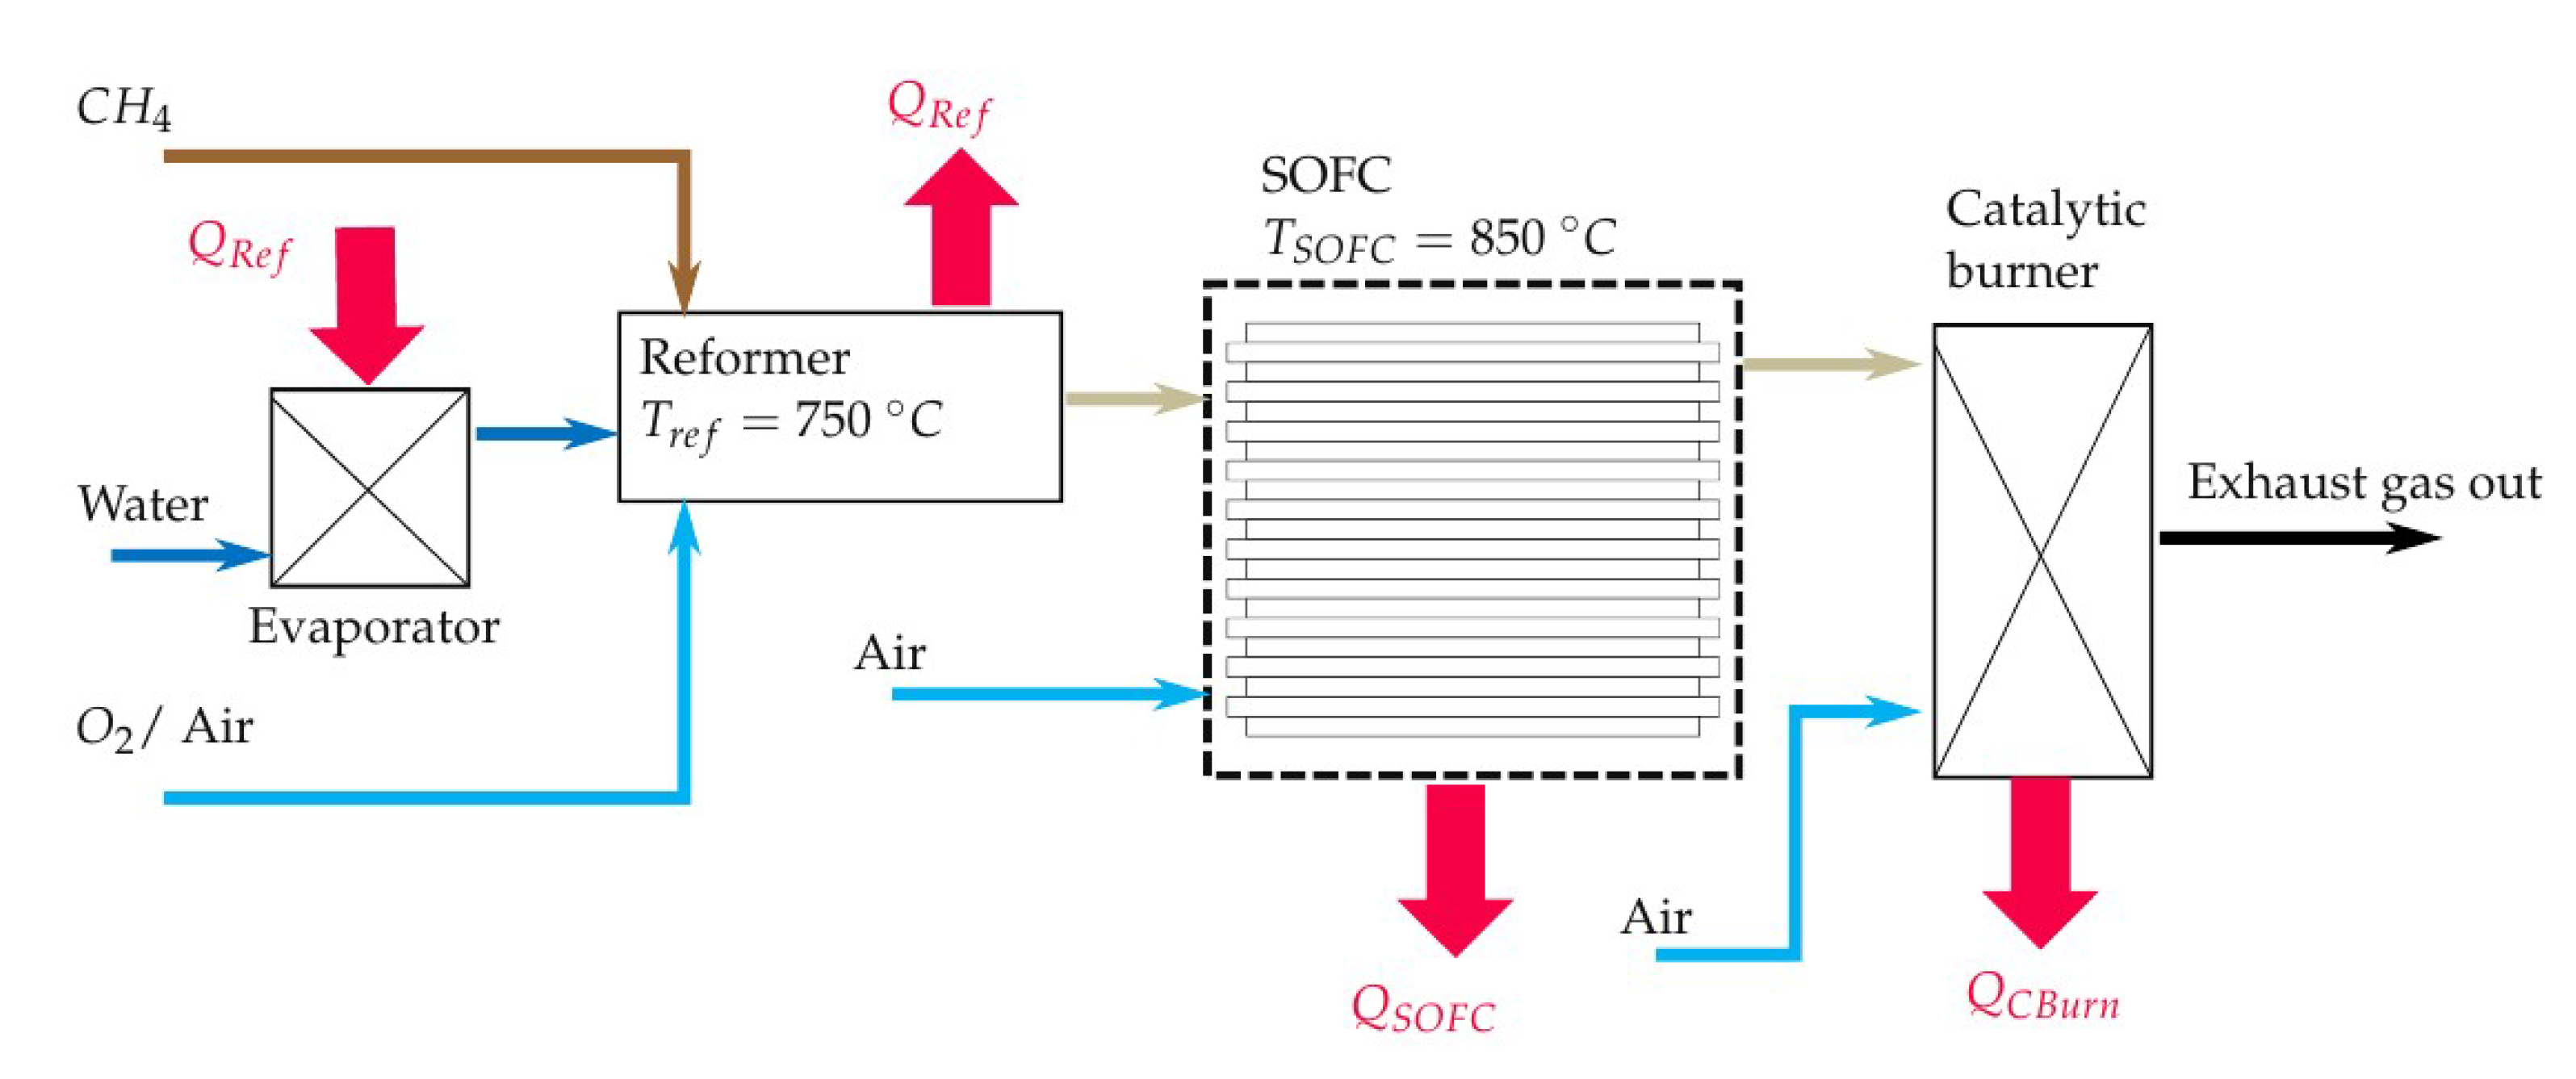
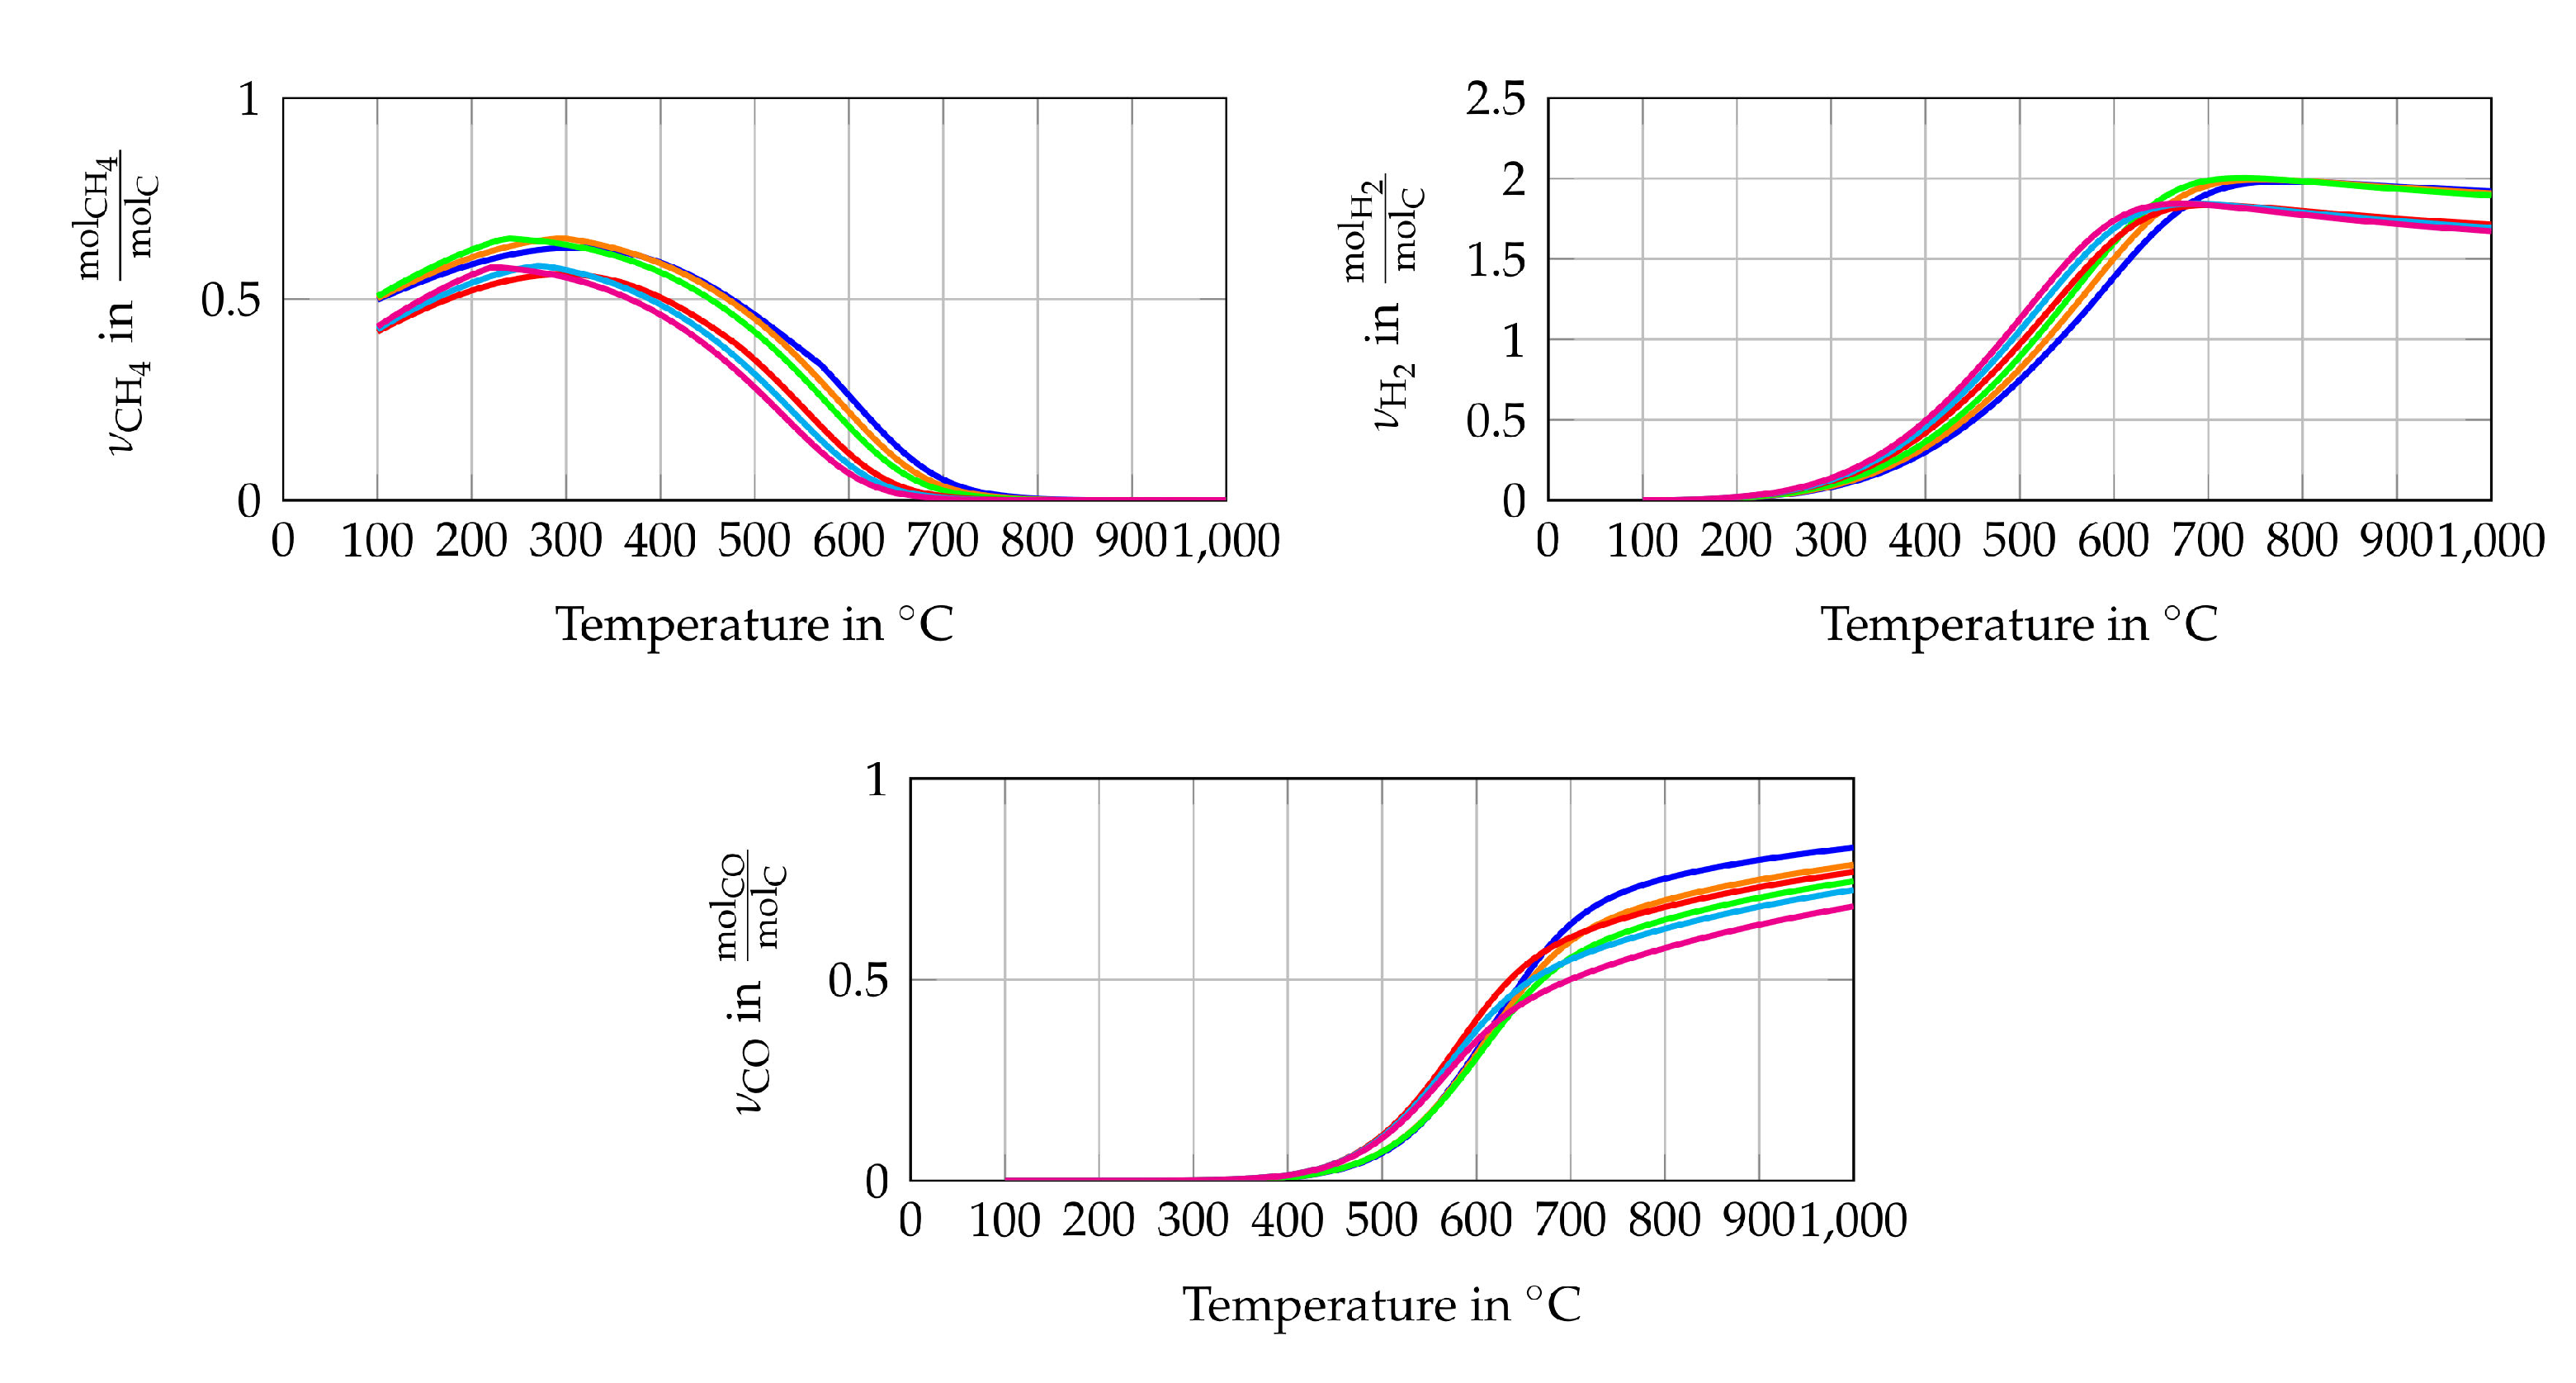
The simulation model of the entire system is modelled in EBSILON®Professional (STEAG Energy Services, Essen, Germany). This software creates a set of equations for each module (e.g., pipes, evaporator, Gibbs reactor) based on conservation of energy and mass. When starting the simulation, the set of non-linear equations is solved for the entire system iterative. The maximum number of iterations is 999, while the iteration process ends if the difference between the actual and the last iteration step is smaller than . The simulation has the main purpose of determining the initial volume flows of fuel (CH), water (HO) and air or pure oxygen. To this goal, a steady state simulation is performed and the scheme of the simulation model is shown in Figure 2. The fuel (CH), water and oxidant streams enter the simulation model with a temperature of 25 C and ambient pressure (1 bar). The water stream is evaporated using the heat of the reforming process (). All three streams are mixed inside the reformer, which is modelled as a Gibbs reactor. The Gibbs reactor is equal to a 0 D thermodynamic equilibrium calculation based on the Gibbs free energy minimization including not only ideal gases but also condensed species such as solid carbon [50]. The validity of this assumption is shown in several previously published studies [16,47,51]. It should be mentioned here that high gas hourly space velocities (GHSV) can lead to a gas composition at the reformer outlet, which is not close to the chemical equilibrium. The simulated reforming temperature is set to 750 C since a low CH yield is preferable. The CH yield of the studied gas compositions, see Table 1, does not decrease significantly if the temperature is higher than 750 C, as shown in Figure 3. It is also shown that the CH conversion rate at a specific temperature is higher if the H2O/C and the O/C rises. The highest H yields of the equilibrium gas compositions are between 650 C and 790 C depending on the gas inlet composition of the reformer. The CO yield does not peak at a certain temperature within the observed temperature range but the increase of the CO yield slows down significantly between 600 C and 750 C depending on the gas inlet composition of the reformer. High H2 and CO yields seem to be preferable to operate SOFCs but due to catalytic effect of the SOFCs anode and the limitation that only CH, HO and O or air is used as initial input, no conclusions, regarding the power output or degradation of the cell, can be drawn from H2 and CO yields only [9]. All species of the studied gas composition must be considered to find the optimal operating conditions in terms of power output and degradation.
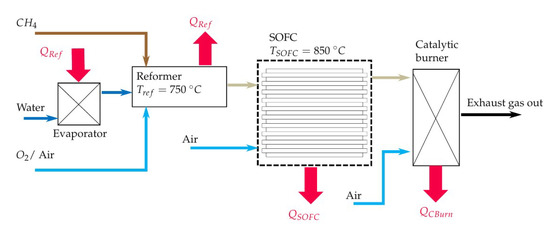
Figure 2.
Scheme of the simulation model of the SOFC-reformer system.

Table 1.
Initial gas compositions for auto-thermal reforming of methane.
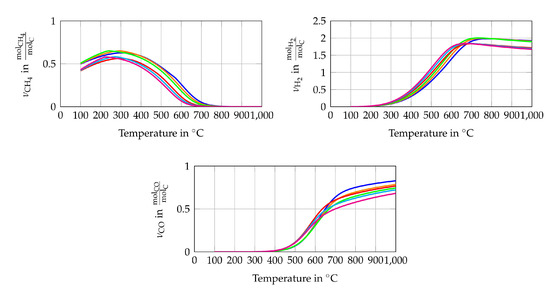
Figure 3.
Chemical equilibrium composition in amount of mole (a) CH4 (b) H2 and (c) CO per mole carbon for gas composition 1  , gas composition 2
  , gas composition 3
  , gas composition 4
  , gas composition 5
  , gas composition 6
  .
.
 , gas composition 2
  , gas composition 3
  , gas composition 4
  , gas composition 5
  , gas composition 6
  .
.
However, the SOFC and the catalytic burner are also modelled to serve as Gibbs reactors. This is done to be able to evaluate the needed airflows for a stoichiometric combustion for different fuel use rates of the SOFC. In addition, anode off gas recycling (AOGR) can be simulated. The reason for this is that several studies have shown that AOGR can increase the overall efficiency of the system [51,52,53,54].
The oxygen to carbon ratio at the reformer inlet, needed for reformer tests, is determined from this simulation model. The O2/C is determined by the needed heat to obtain a reformer temperature of 750 C, see Table 1 and Figure 2. The heat losses along the reformer and gas/ steam pipes are neglected. For the simulation of the SOFC stack, another air stream and the reformed gas mixture are used. The air is heated up in the SOFC and the oxygen is fed to the equilibrium reactor which models the chemical reactions of the SOFC. The temperature of the SOFC is set to 850 C since it is the suggested working temperature of the tested Electrolyte Supported Cell (ESC). The gas outlet temperature of the SOFC is set equal to its working temperature (850 C) resulting in a heat flux (). The heat flux of the catalytic burner () is caused by oxidation reactions and cooling the exhaust gas to a temperature of (100 C). The heat flux at the reformer () is determined in the same way as the other heat fluxes (, ) by considering the enthalpy differences of the inlet and outlet gas compositions of the respective module. The reformer heat flux is, however, entirely used to evaporate HO upstream of the reformer.
2.2. Equilibrium Calculations
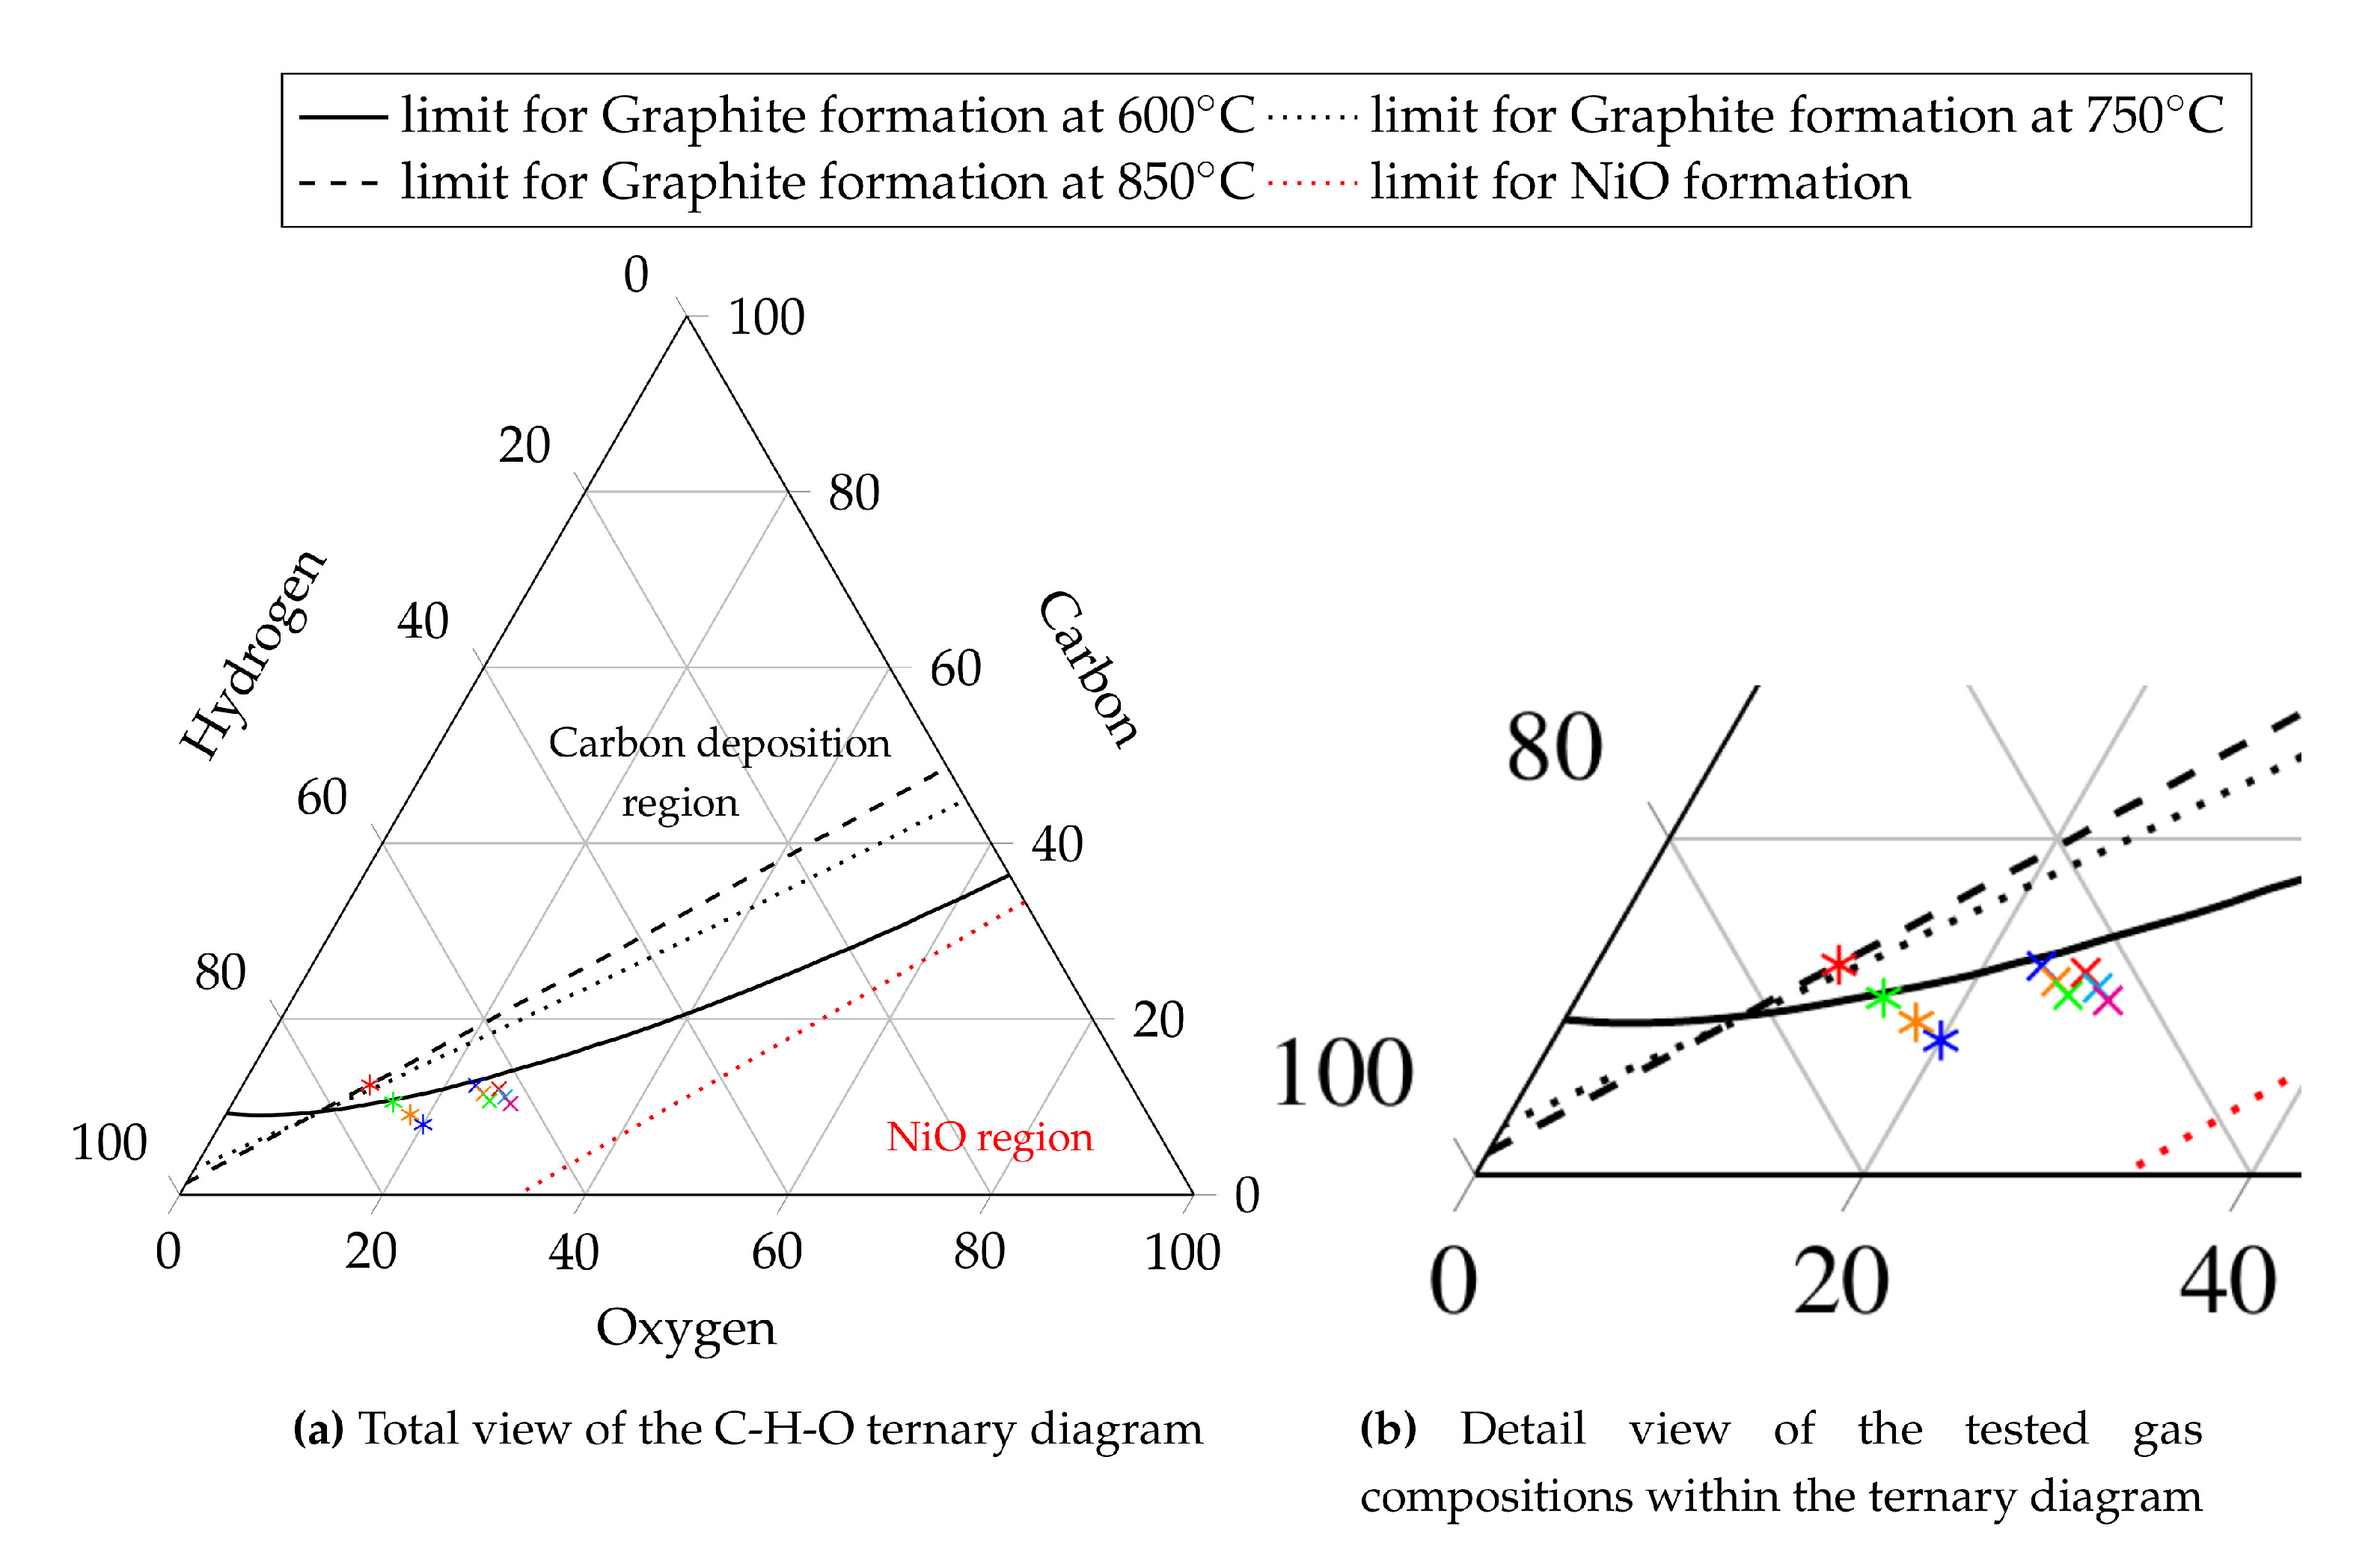
Equilibrium calculations are done for each gas composition derived from the reformer simulation model. If a gas composition tends to cause carbon deposition or nickel oxidation, the initial H2O/C must be adapted and a new O/C has to be calculated with the model described in Section 2.1. As an alternative to calculate the chemical equilibrium for every new gas composition, pre-calculated chemical equilibria compositions of different carbon, hydrogen and oxygen compositions are used. The compositions cover C-H-O ratios from C = 0–100%, H = 0–100% and O = 0–100% including all combinations. The equilibrium calculations are made for all the temperatures and total pressures which are of interest. Based on this the probability for solid carbon formation can be determined as a function of the temperature, total pressure and the C-H-O ratio. This limit is drawn within a C-H-O ternary diagram as shown in Figure 4 for 600 C (solid black line), 750 C (dotted black line) and 850 C (dashed black line). All limits are calculated for a total pressure of 1bar. Solid carbon formation, however, is not the only degradation mechanism which is predicted by chemical equilibrium calculations. NiO is also predictable. Its formation occurs, if the oxygen yield is higher than needed for a stoichiometric combustion of the fuel gas (air ratio ) [34]. The limit for nickel oxidation is therefore independent of the temperature and total pressure, but it depends on the C-H-O ratio. Consequently, the limit for NiO formation is drawn in Figure 4 as the red dotted line. To obtain information about possible carbon deposition or nickel oxidation, the C-H-O ratio of the gas can be drawn in the C-H-O diagram as a point. The location of the point states if and which degradation mechanism are likely to occur. The validity of the described computation method for the limits of solid carbon formation and nickel oxidation is shown in [32,33]. It is stated that the limit of carbon formation is the same for all combinations of carbon, hydrogen and oxygen species independent of the appearing molecules as long as the gas reaches chemical equilibrium. Figure 4 shows 10 gas compositions. However, only gas Compositions 1–6 are simulated using the model explained in Section 2.1, whereby the remaining Compositions 7–10 are used for internal reforming. Investigation of internal reforming excludes the necessity of a reformer component in the system, thus offering no benefit to be gained by simulating this process with the described model. Plotting the gas compositions from Table 2 (gas compositions for auto-thermal reforming are marked as crosses and gas compositions for internal reforming are marked as asterisks) in the C-H-O ternary diagram, see Figure 4, shows that higher H2O/C leads to safe operating conditions at lower temperatures which is also reported in [55]. The compositions which are supplied to an auto-thermal reformer are located in the degradation free region for temperatures above 600 C. This temperature is chosen due to the fact that auto-thermal reformers have a strongly non uniform temperature profile along their reaction zone [14,56,57]. The gas compositions for internal reforming are located in the degradation free region for temperatures above 850 C. This temperature is chosen since it is the suggested operating temperature of the tested fuel cell. Hence, the fuel gas is preheated to a similar temperature since high temperature differences would cause thermal stresses at the cell and this must be avoided.
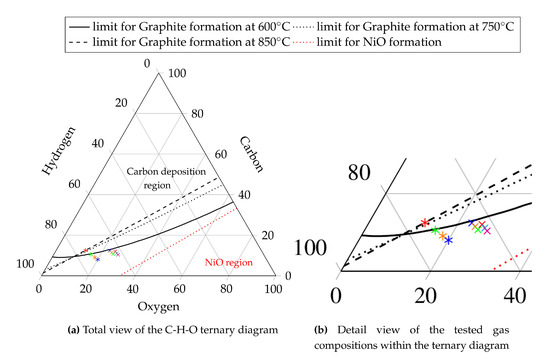
Figure 4.
C-H-O ternary diagram; Operating point - gas composition 1  , gas composition 2
  , gas composition 3
  , gas composition 4
  , gas composition 5
  , gas composition 6
  , gas composition 7
  , gas composition 8
  , gas composition 9
  , gas composition 10
  .
.
 , gas composition 2
  , gas composition 3
  , gas composition 4
  , gas composition 5
  , gas composition 6
  , gas composition 7
  , gas composition 8
  , gas composition 9
  , gas composition 10
  .
.

Table 2.
Initial gas compositions for auto-thermal reforming and internal reforming of methane.
3. Experimental Setup
In this section, the experimental part of this study will be explained in detail. It presents the testing methodology, the test rigs and tested components. In the first part, the auto-thermal reformer is tested to validate the simulation results. In the second part, the SOFC tests conducted to compare the performance when employing previously auto-thermal reformed methane and internal methane reforming. The SOFC is characterized in terms of performance and degradation by measuring polarization curves, electrochemical impedances and calculating the DRT spectra. A long-term test run of 500 h with EIS measurements every 4 h is also performed.
3.1. Methane Reforming
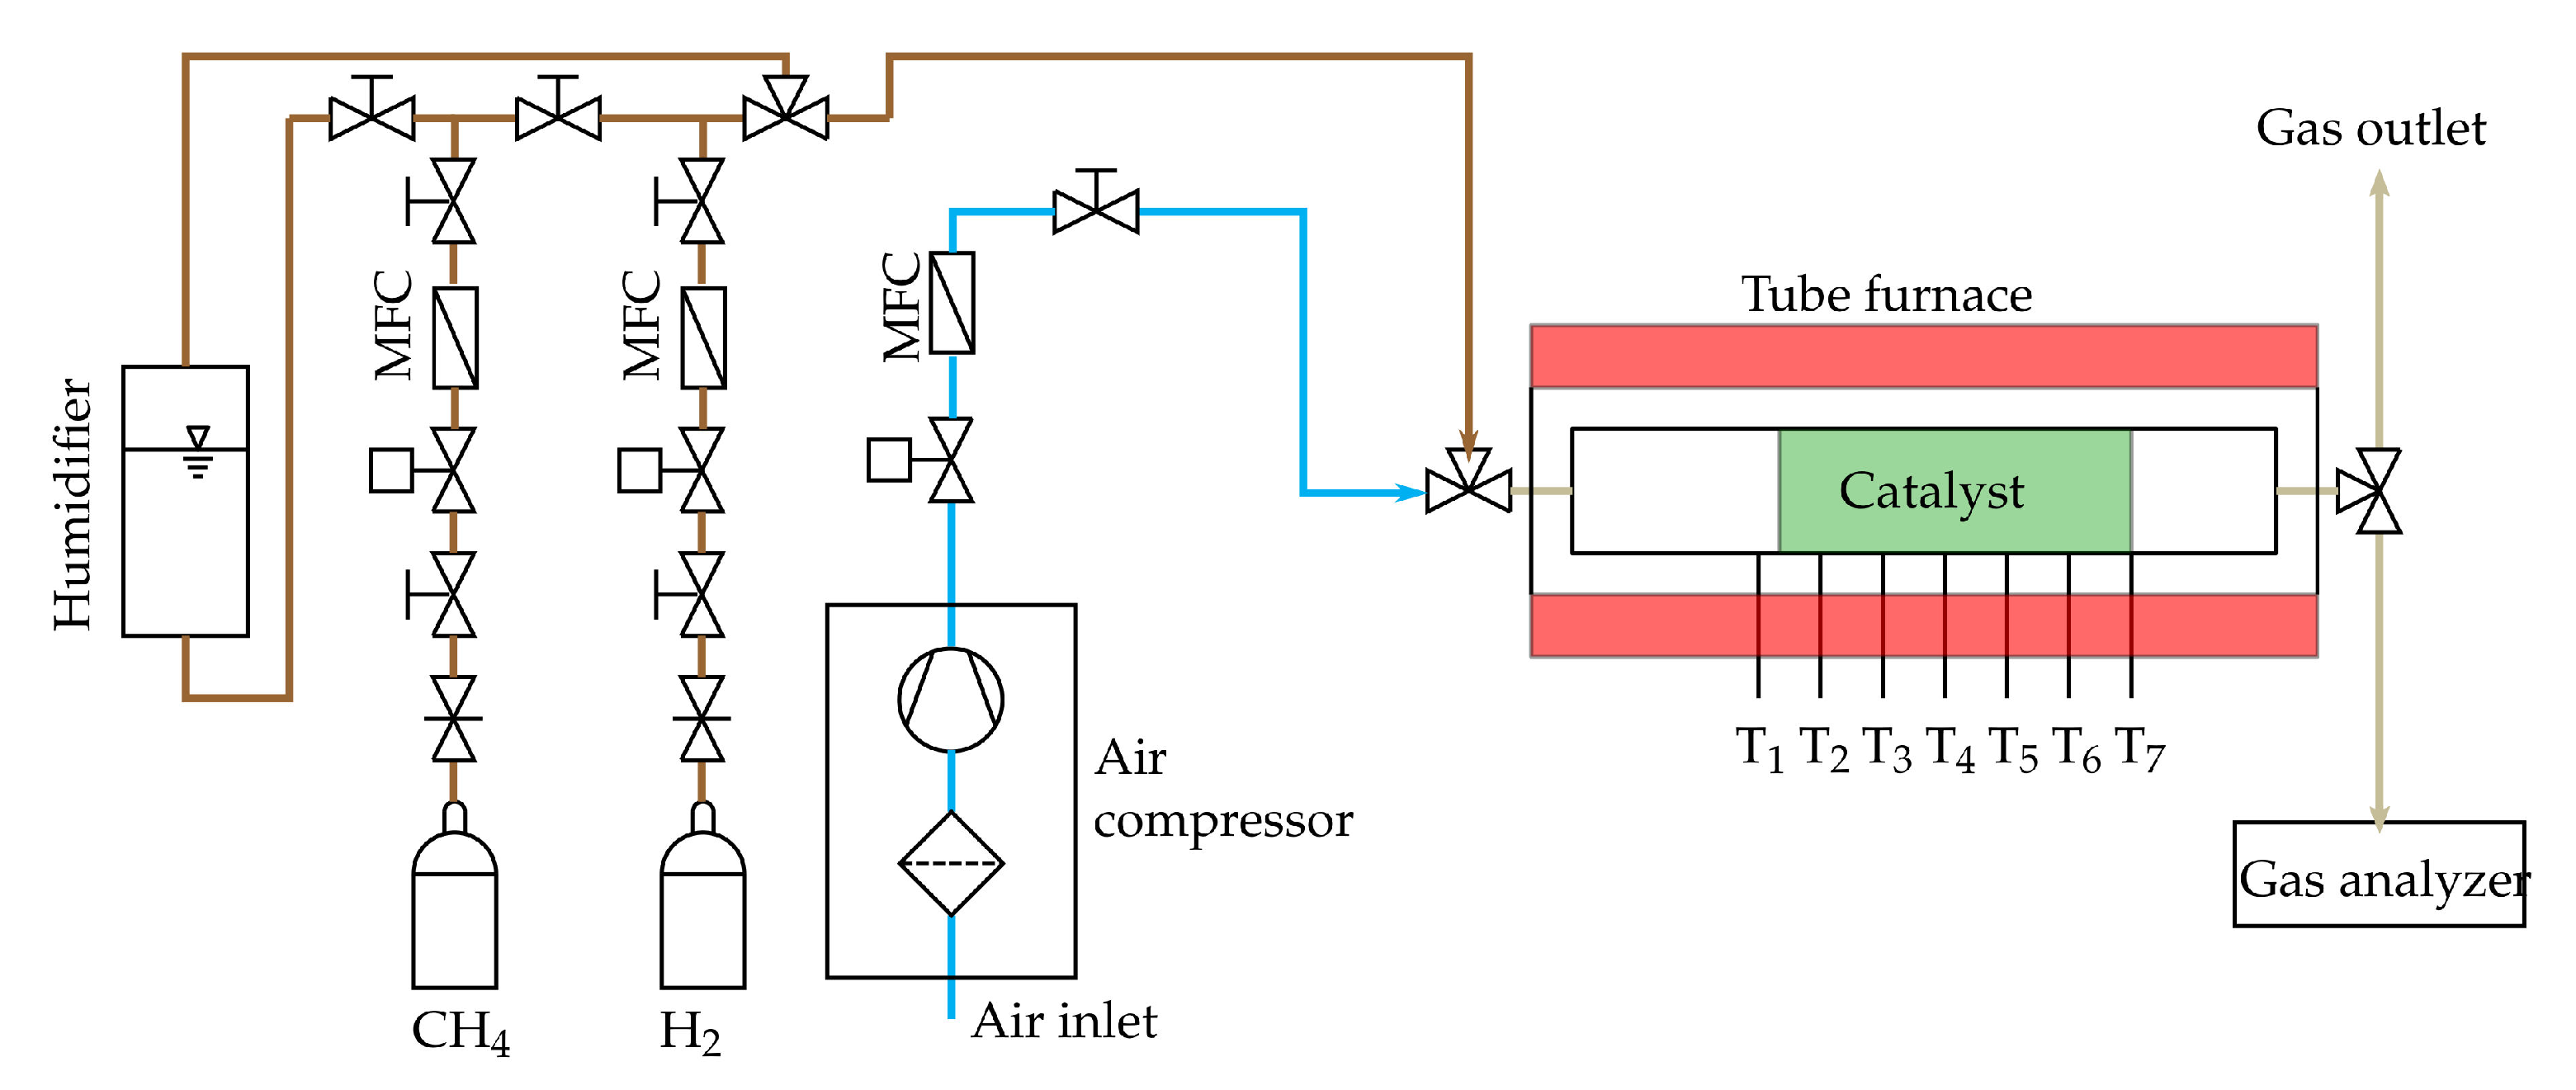
A single tubular reactor is used as an auto-thermal reformer. The used catalyst is based on Ni with a Calcium-Aluminate support and is purchased from C&CS GmbH© (Zorneding, Germany) (ReforMax® 210 LDP) [58]. The temperature distribution along the catalyst bed is measured at seven positions with thermocouples type N, see Figure 5. The first temperature is measured upstream the catalyst at the position T1, the other thermocouples (T2–T7) measure the temperature of the catalyst pellets. A volume flow of 0.8 slpm (standard litre per minute) methane is used. This results in GHSV between 2800 h and 7500 h. Applying the H2O/C and O/C from Table 1, the respective volume flow can be determined. The volume flow of each gas except steam is set by mass flow controller (MFC) purchased from Voegtlin Instruments GmbH© (Muttenz, Switzerland) (type red-y smart series) [59]. Steam is added by a bubbler system which uses methane as carrier gas. To start the auto-thermal reforming tests, the catalyst is heated up with reforming gas and NiO is reduced to Ni by using hydrogen. As can be seen in Figure 5, a tube furnace from Carbolite Gero GmbH & Co. KG© (Neuhausen, Germany) (Carbolite Gero CTF 12/75/700) [60] is used to initially heat up the catalyst during the reduction procedure and to start the auto-thermal reaction. The furnace is switched off after the reaction has started and is only used for the purpose of thermal insulation. Starting with gas composition 1, every gas composition of Table 1 is tested. The reformer off-gas composition is continuously monitored with a gas analyser. The gas analyser unit was purchased from ABB© (Wiener Neudorf, Austria) and contains of a sample gas cooling unit (SCC-C) [61], a sample gas feed unit (SCC-F) [62] and the AO2020 gas analyser module [63]. It analyses the dry gas mixture composed of H, CH, O, CO and CO. N is calculated as the remaining share to 100%. The reformer off-gas composition is measured when the steady state is reached for each gas composition. The steady state is reached if the measured off-gas composition remains constant during the course of several minutes.
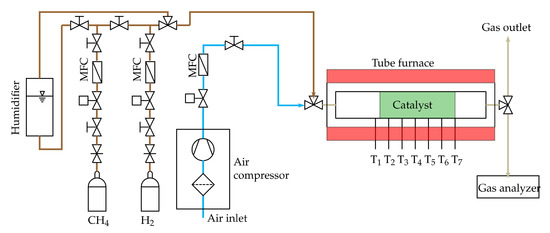
Figure 5.
Scheme of the reformer test rig.
3.2. Single Cell Tests
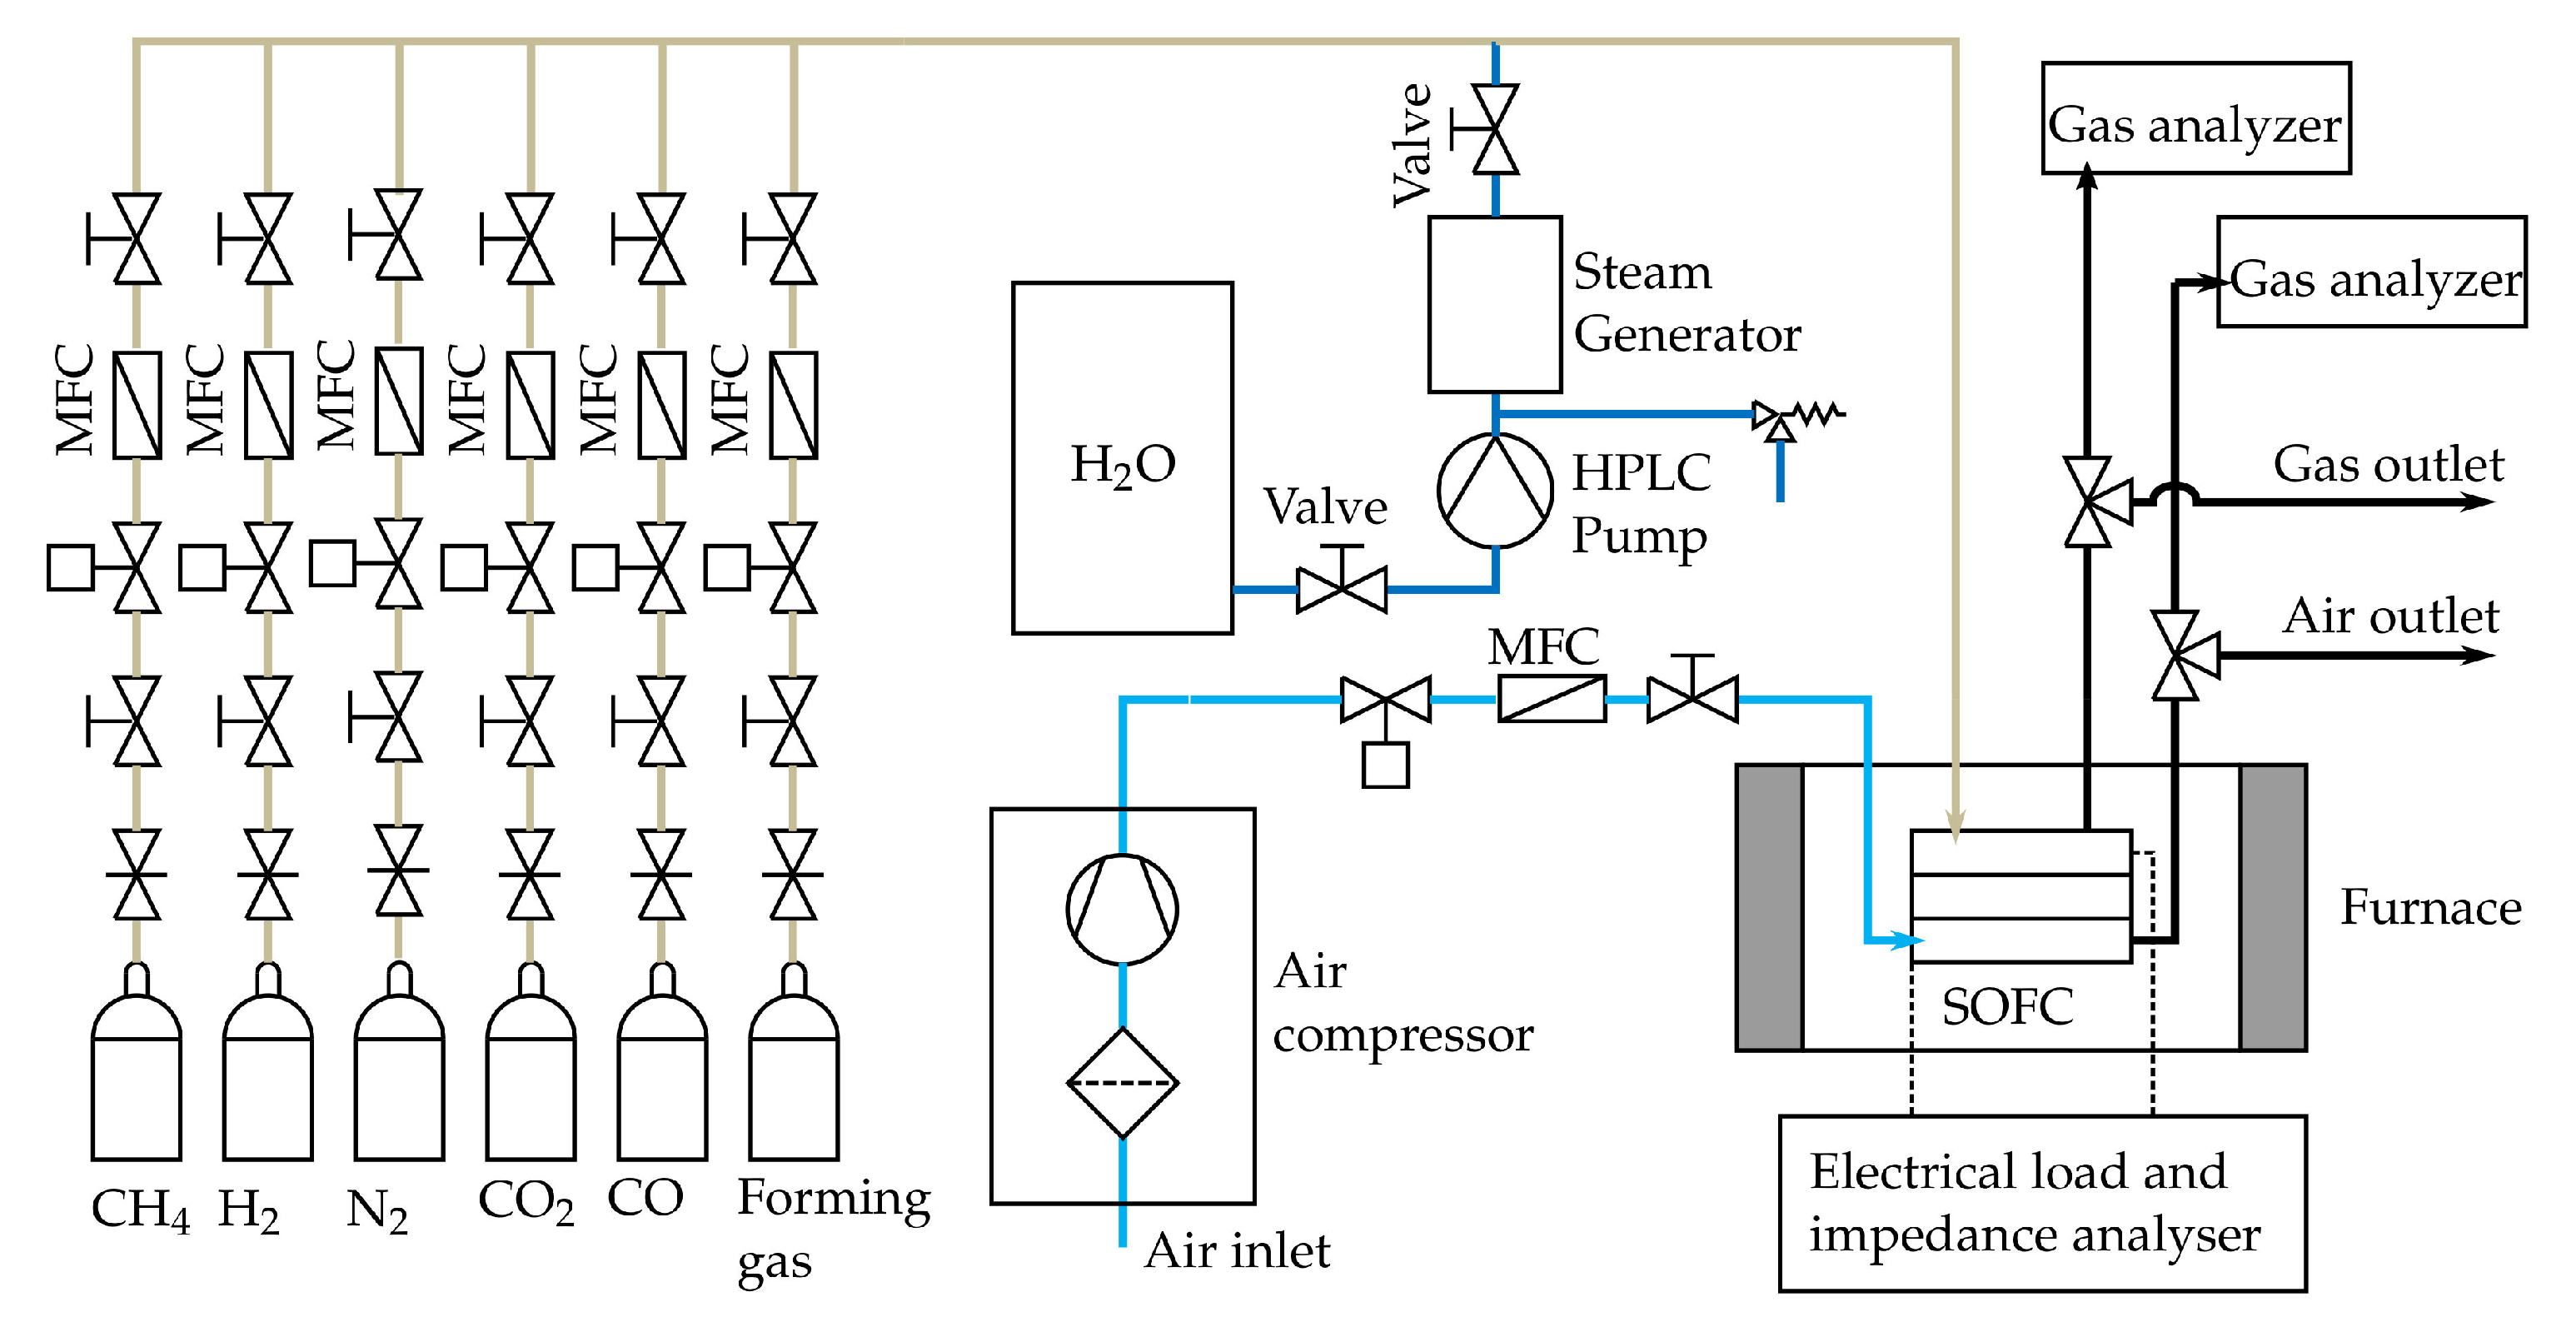
The SOFC tests are conducted by using a large planar single cell with a total area of cm and an anode (active) area of cm. A commercial available electrolyte supported cell (ESC) from Kerafol Keramische Folien GmbH & Co. KG© (Eschenbach i.d.OPf., Germany) with a Ni/GDC anode, a scandia-stabilized zirconium (ScSZ) electrolyte and a lanthanum strontium cobalt ferrite (LSCF) cathode is used for all the tests [64]. The SOFC was embedded in a ceramic cell housing and several thermocouples type N were installed along the anode and cathode flow field to continuously monitor the temperature along the cell. A sketch of the ceramic housing can be found in [25]. As shown in Figure 6, the cell and the ceramic housing are placed inside a temperature controlled furnace (PID-controller coupled with a solid state relay). In addition it is shown that CH, H, N, CO and CO can be synthetically mixed to form different fuels at the anode side, while the cathode side is supplied with compressed air. All Gases are purchased from Air Liquide© (Schwechat, Austria) with a purity of 99.5% for CH4, 99.999% for H2, 99.999% for N2, 100% for CO (DIN EN ISO 14175-C1-C) and 99.97% for CO [65]. The compressed air is filtered with a three stage filtration system from Alup Kompressoren©, Reutlingen, Germany (MF 60, SF 60, AF 60) [66]. All gaseous media, except steam, are controlled by MFC purchased from Voegtlin Instruments GmbH© (type red-y smart series) [59] (Muttenz, Switzerland). Steam is controlled by a high-pressure liquid chromatography (HPLC) pump and a steam generator. The HPLC pump (AZURA P 2.1S) was purchased from KNAUER Wissenschaftliche Geräte GmbH© [67] (Berlin, Germany). The latter consists of a heating cartridge and a buffer volume with a needle valve to adjust the pressure within the steam generator. The heating cartridge is controlled by a PID controller coupled with a solid state relay. The flow direction for the anode and cathode side is set to co-flow. Next, gas analysers are used to continuously measure the dry gas compositions of the anode (the same model as described in Section 3.1) and cathode off-gas. The cathode off-gas is analysed with a MAGNOS 206 OXYGEN ANALYZER from ABB© [68] and the sample gas is conditioned by a sample gas feed unit from ABB© (SCC-S, Wiener Neudorf, Austria) [69]. The characterization and testing of the cell is done by applying an electrical load and conducting impedance measurements. This is done with the electrical load and impedance analyser, as shown in Figure 6. This unit mainly consists of an electrical load from RIGOL Technologies Inc.©(Gilching, Germany) (RIGOL DL3031A) [70] and a power supply from ITECH Electronic CO. LTD.© (New Taipei City, Taiwan) (IT6512) [71]. Electrochemical impedance measurements are conducted in a galvanostatic mode with an AC amplitude of 4% of the DC level. For calculating the valid DRT spectra, the quality of the EIS data measured is verified by the Kramers-Kronig (KK) test. This test uses the KK relations between the real and imaginary part of the impedance to check if certain criteria such as linearity, causality and stability of are fulfilled for the studied system. Only data points with an error of less than 5% are further used to calculate the DRT spectra. Both the Kramers Kronig test and the DRT method are described in more detail by Subotic et al. [72]. However, the single cell tests are carried out by supplying the cell with the gas compositions 1a to 10 b from Table 3 at the anode side and the same volume flow () of air at the cathode side. The reference composition is applied at the beginning and between some gas compositions to see if the cell is degraded. Two different volume flows are measured for every gas composition to obtain insights into the dependencies of the volume flows and the cell characteristics. To be able to compare the results from the different compositions, the molar flux of carbon () is held constant for compositions “a” and compositions “b”. Consequently, the initial (pre-reformed) amount of methane and therefore the available energy for the SOFC-reformer system is constant for each molar flux of carbon. Each gas composition from Table 3 is preheated close to the SOFC operating temperature and no additional pressure apart from the pressure drop along the SOFC and the tubing is applied by using special parts, such as needle valves, after the SOFC.
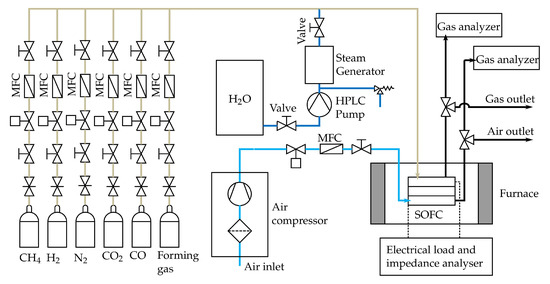
Figure 6.
Scheme of the SOFC test rig.

Table 3.
Inlet gas compositions for the single cell tests.
4. Results and Discussion
In the following sections, the measurements results of the reformer and single cell tests are shown. The simulation model of the auto-thermal reformer is validated and the single cell is characterized by means of electrochemical investigation and gas analysis. The characterization is done by measuring polarization curves, electrochemical impedance spectra and using the DRT method. In addition, a long term test run of 500 h is conducted to gain knowledge about the long time operating behaviour and therefore the system suitability for real applications. No degradation is detected during the 500 h operation with auto-thermal reformed methane (Comp. 4a).
4.1. Reformer Model Validation
4.1.1. Temperature Profile Validation
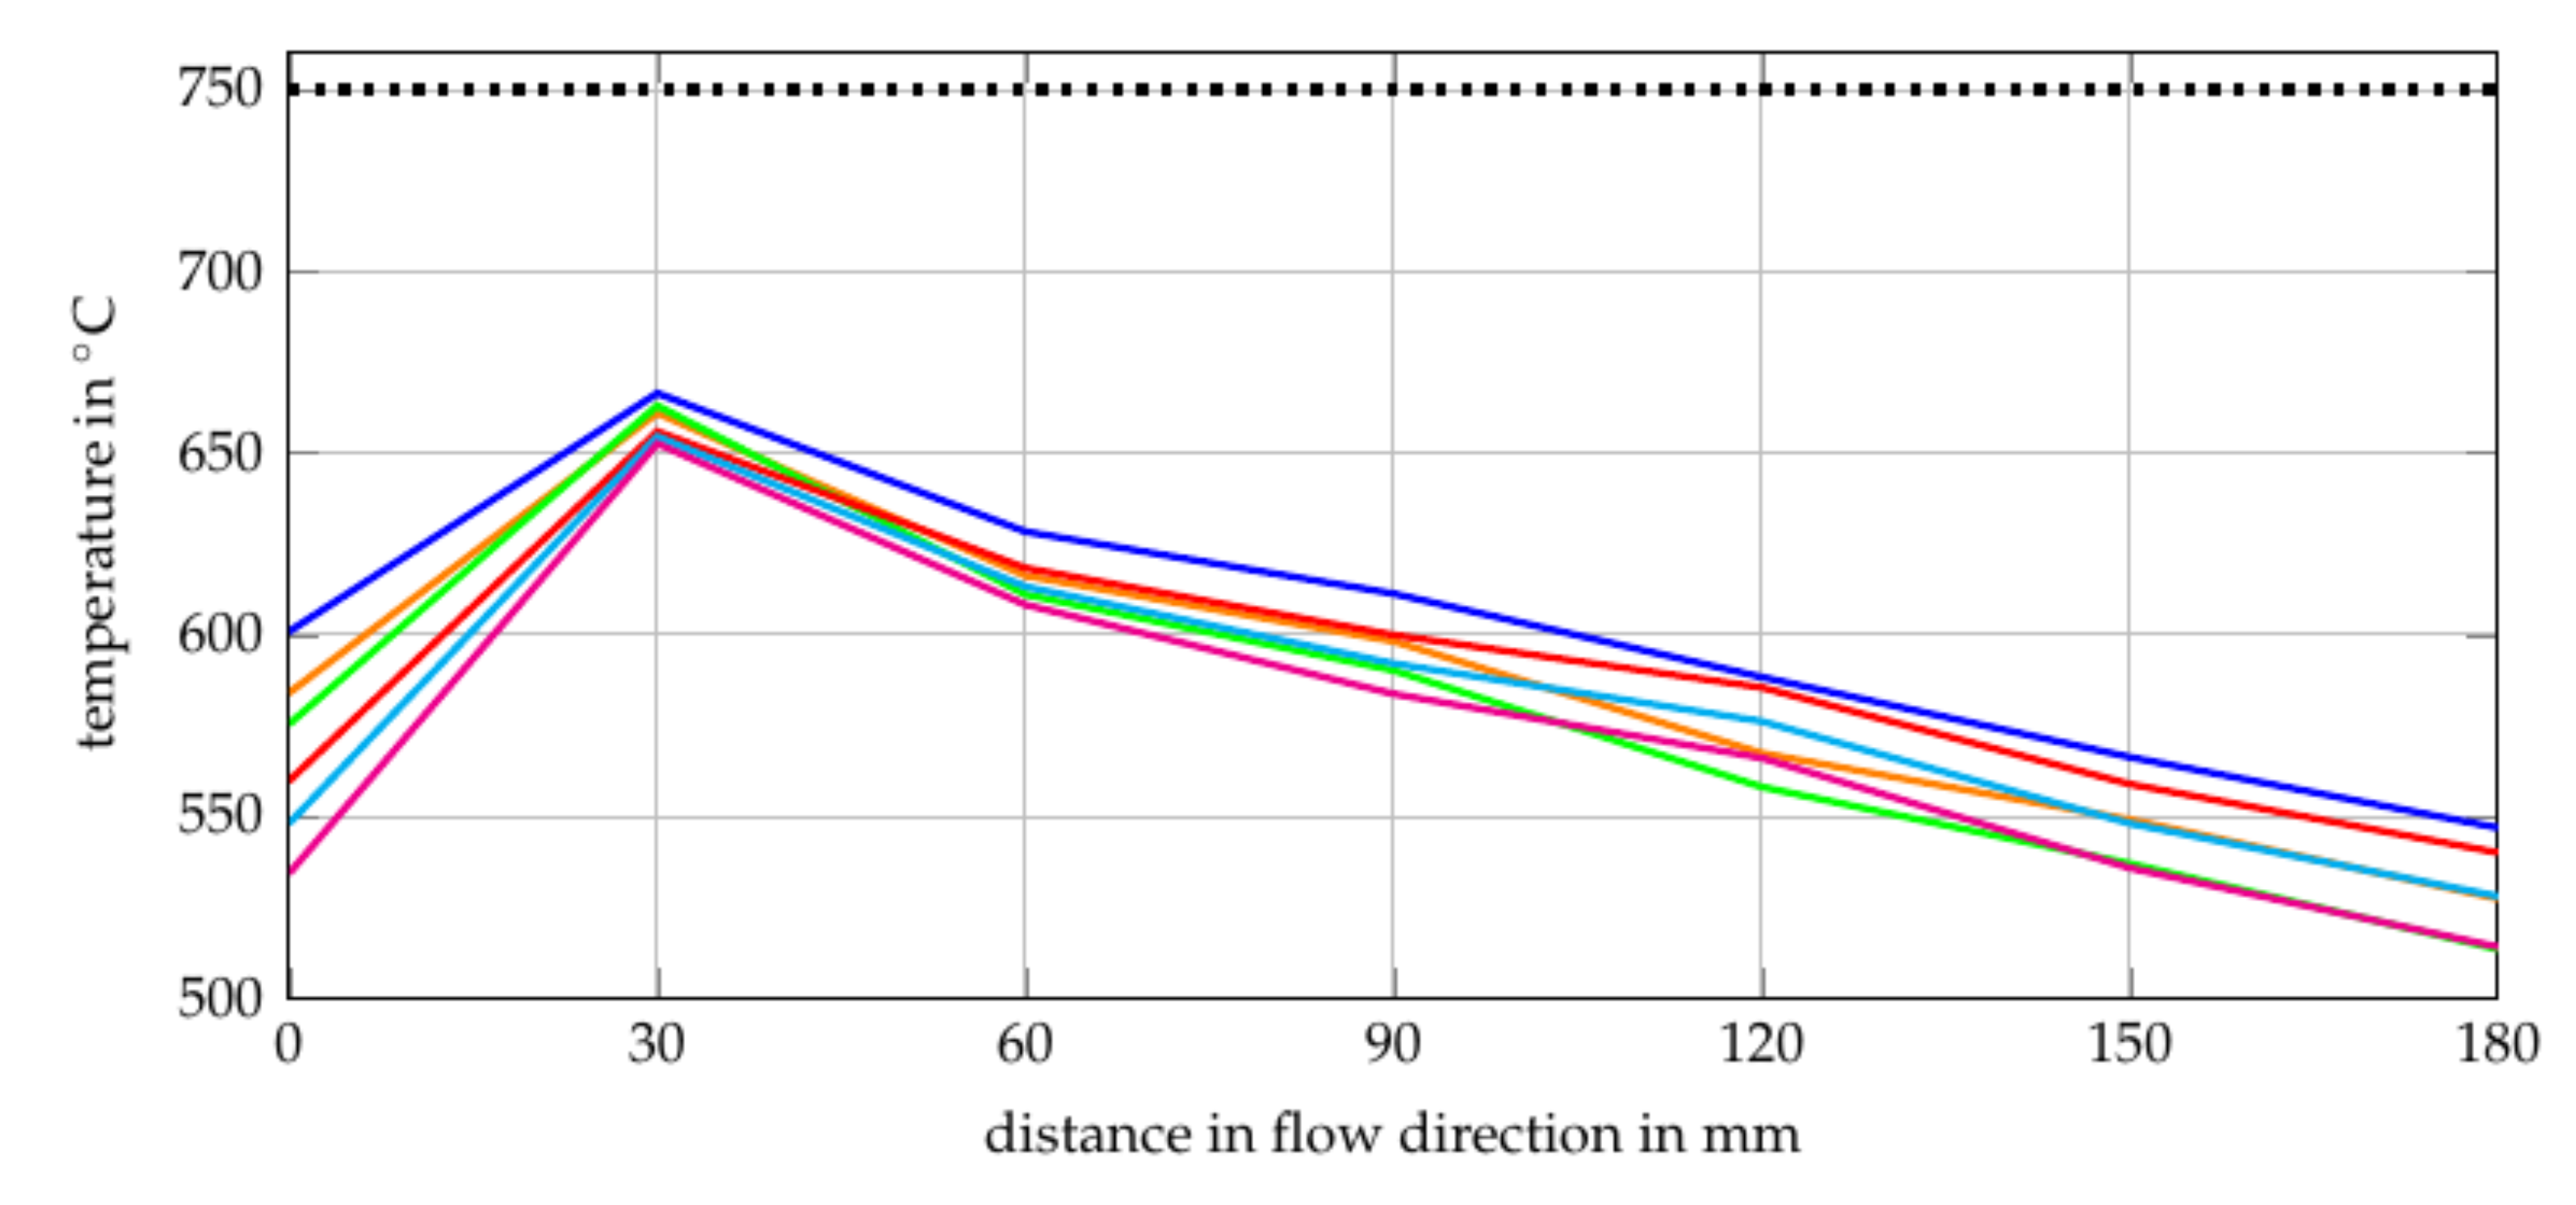
The O2/C and H2O/C ratios for the gas compositions of the reformer inlet are calculated by using the simulation model described in Section 2.1. In the model, the temperature of ATR is set to a constant value of 750 C, since it is modelled as a Gibbs reactor in EBSILON®Professional (0 D thermodynamic equilibrium calculation). In contrast to this, the experiment investigated showed a varying temperature along the reformer catalyst, as shown in Figure 7. The cause of the measured inconstant temperature profiles are the different reaction zones caused by different reaction times. Starting with the first reaction zone (from T1 = 0 mm to T2 = 30 mm), two phenomena can be observed. First, temperature increases achieving a maximum of K. However, this value varies as a function of the gas composition. The strong increase of temperature is a result of exothermal and fast reactions, which leads to the conclusion that partial oxidation (6) takes place mainly within this zone. The different gradients for different gas compositions can be explained by different O/C and volume flows, see Table 1.
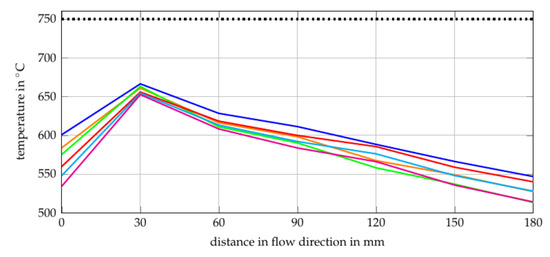
Figure 7.
Temperature profile along the reaction zone of the reformer for gas composition 1  , gas composition 2
  , gas composition 3
  , gas composition 4
  , gas composition 5
  , gas composition 6
  , reformer simulation
  .
.
 , gas composition 2
  , gas composition 3
  , gas composition 4
  , gas composition 5
  , gas composition 6
  , reformer simulation
  .
.
Second, the gas inlet temperature decreases with increasing O/C. As shown in Table 1, the H2O/C increases from Comp. 1 to Comp. 3 and from Comp. 4 to Comp. 6. In addition, the volume flow increases from gas composition 1 to gas composition 6. This could be an explanation for the decreasing inlet temperature since the first thermocouple (T1 = 0 mm) is influenced by the heat radiation of the catalyst and the fluid temperature. It would appear that a rising volume flow and H2O/C reduces the influence of the heat radiation of the catalyst on the first thermocouple. Oxidation upstream of the catalyst does not seem to be the reason for this phenomenon since the temperature at the first thermocouple decreases with increasing O/C. In the second reaction zone (T2 = 30 mm and T3 = 60 mm), a strong decrease of the temperature can be observed. Hence, endothermal reactions take place downstream of the first thermocouple. One endothermal reaction that takes place is the steam reforming reaction (7).
This reaction has a higher output of hydrogen and is therefore preferable to produce syngas for SOFC. However, it is also an endothermal reaction and the heat required reduces the performance of the studied SOFC-reformer system since it is designed as a stand-alone system. The temperature gradients after the second thermocouple (T2 = 30 mm) are nearly the same for all gas compositions. Although different methane and steam quantities are available in this section. This leads to the assumption that the endothermal steam reforming reaction is limited by the available heat instead of the available reactants. The heat losses are a result of the non-ideal insulation of the tube furnace, based on which the difference between the simulated and the real temperature can be explained. The main endothermal reaction after the third thermocouple (T3 = 60 mm) is the steam reforming reaction but the main chemical reaction which is expected in this section is the water gas shift (WGS) reaction (8) as stated in [73].
As can be seen in reaction 8, it is a slightly exothermal reaction which does not explain the observed temperature decrease. It would appear that the WGS reaction does not have such a strong impact on the temperature profile as the steam reforming reaction and the non ideal insulation.
4.1.2. Equilibrium Composition Validation
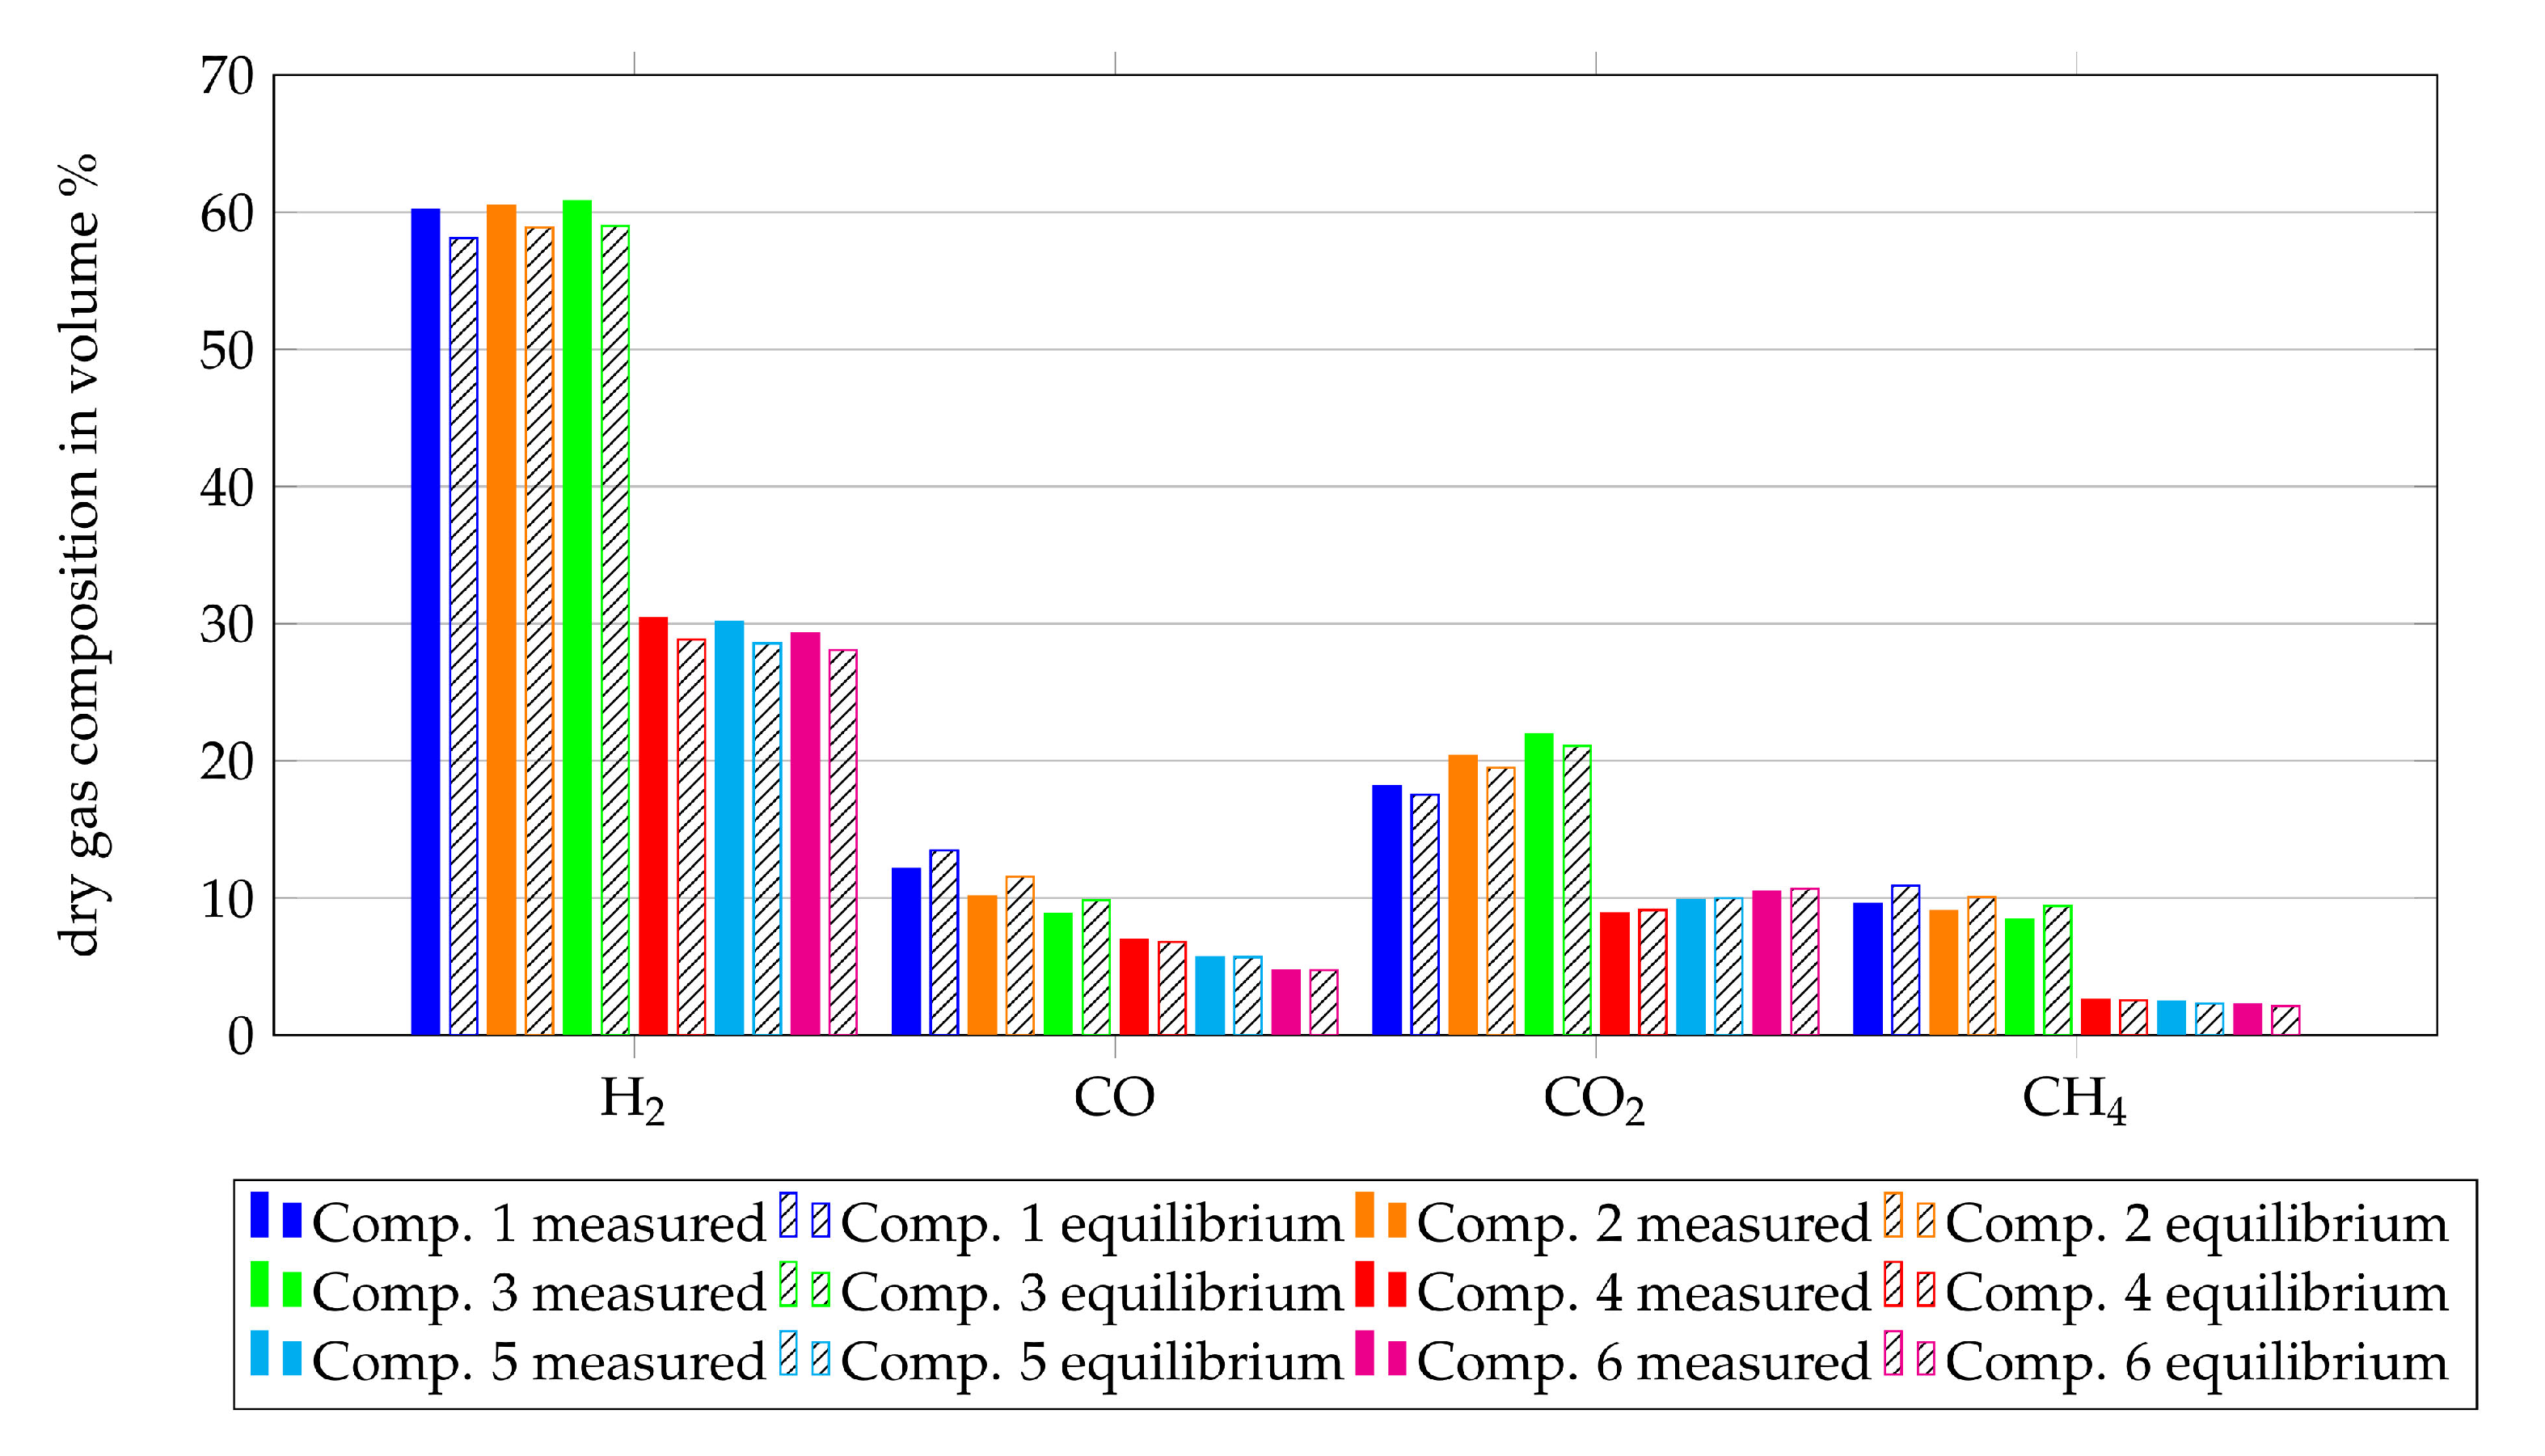
The reformer installed upstream the SOFC-unit is modelled as a Gibbs reactor, as described in Section 2.1. To validate this assumption, the off-gas composition of the reformer is compared with the equilibrium composition at the median temperature of the reformer instead of the simulated temperature. The median temperature is used since only the assumption that a reformer can be modelled as an equilibrium reactor is validated. The measured and equilibrium gas compositions downstream from the reformer are shown in Figure 8 for all gas compositions from Table 1. Within this figure, the percentage of H2, CO, CO2 and CH4 of the dry gas composition are shown since these fuel components are actually measured by the gas analyser. The filled bars show the measurement results and the hatched bars show the results of the equilibrium calculations. Although the reforming process took place at around 600 C, the measured results and the equilibrium calculations show good agreement with observed deviations in the range of 0 vol% to 3 vol%. This validates the assumption for reformers at 750 C, since higher temperatures lead to faster reaction processes.
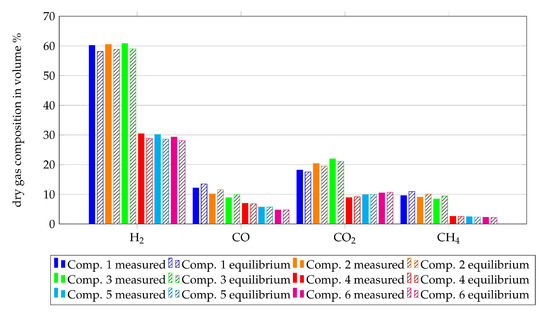
Figure 8.
Comparison of the dry gas compositions after the reformer with the equilibrium gas compositions at the average temperature of the reaction zone.
Summing up, the assumption to model the reformer as a Gibbs reactor shows a good agreement between equilibrium calculations and experimental results. Nevertheless, the heat losses from the experimental setup have to be considered within the simulation in order to get a simulated temperature which is closer to the median temperature of the experiment.
4.2. Cell Performance and Characterization
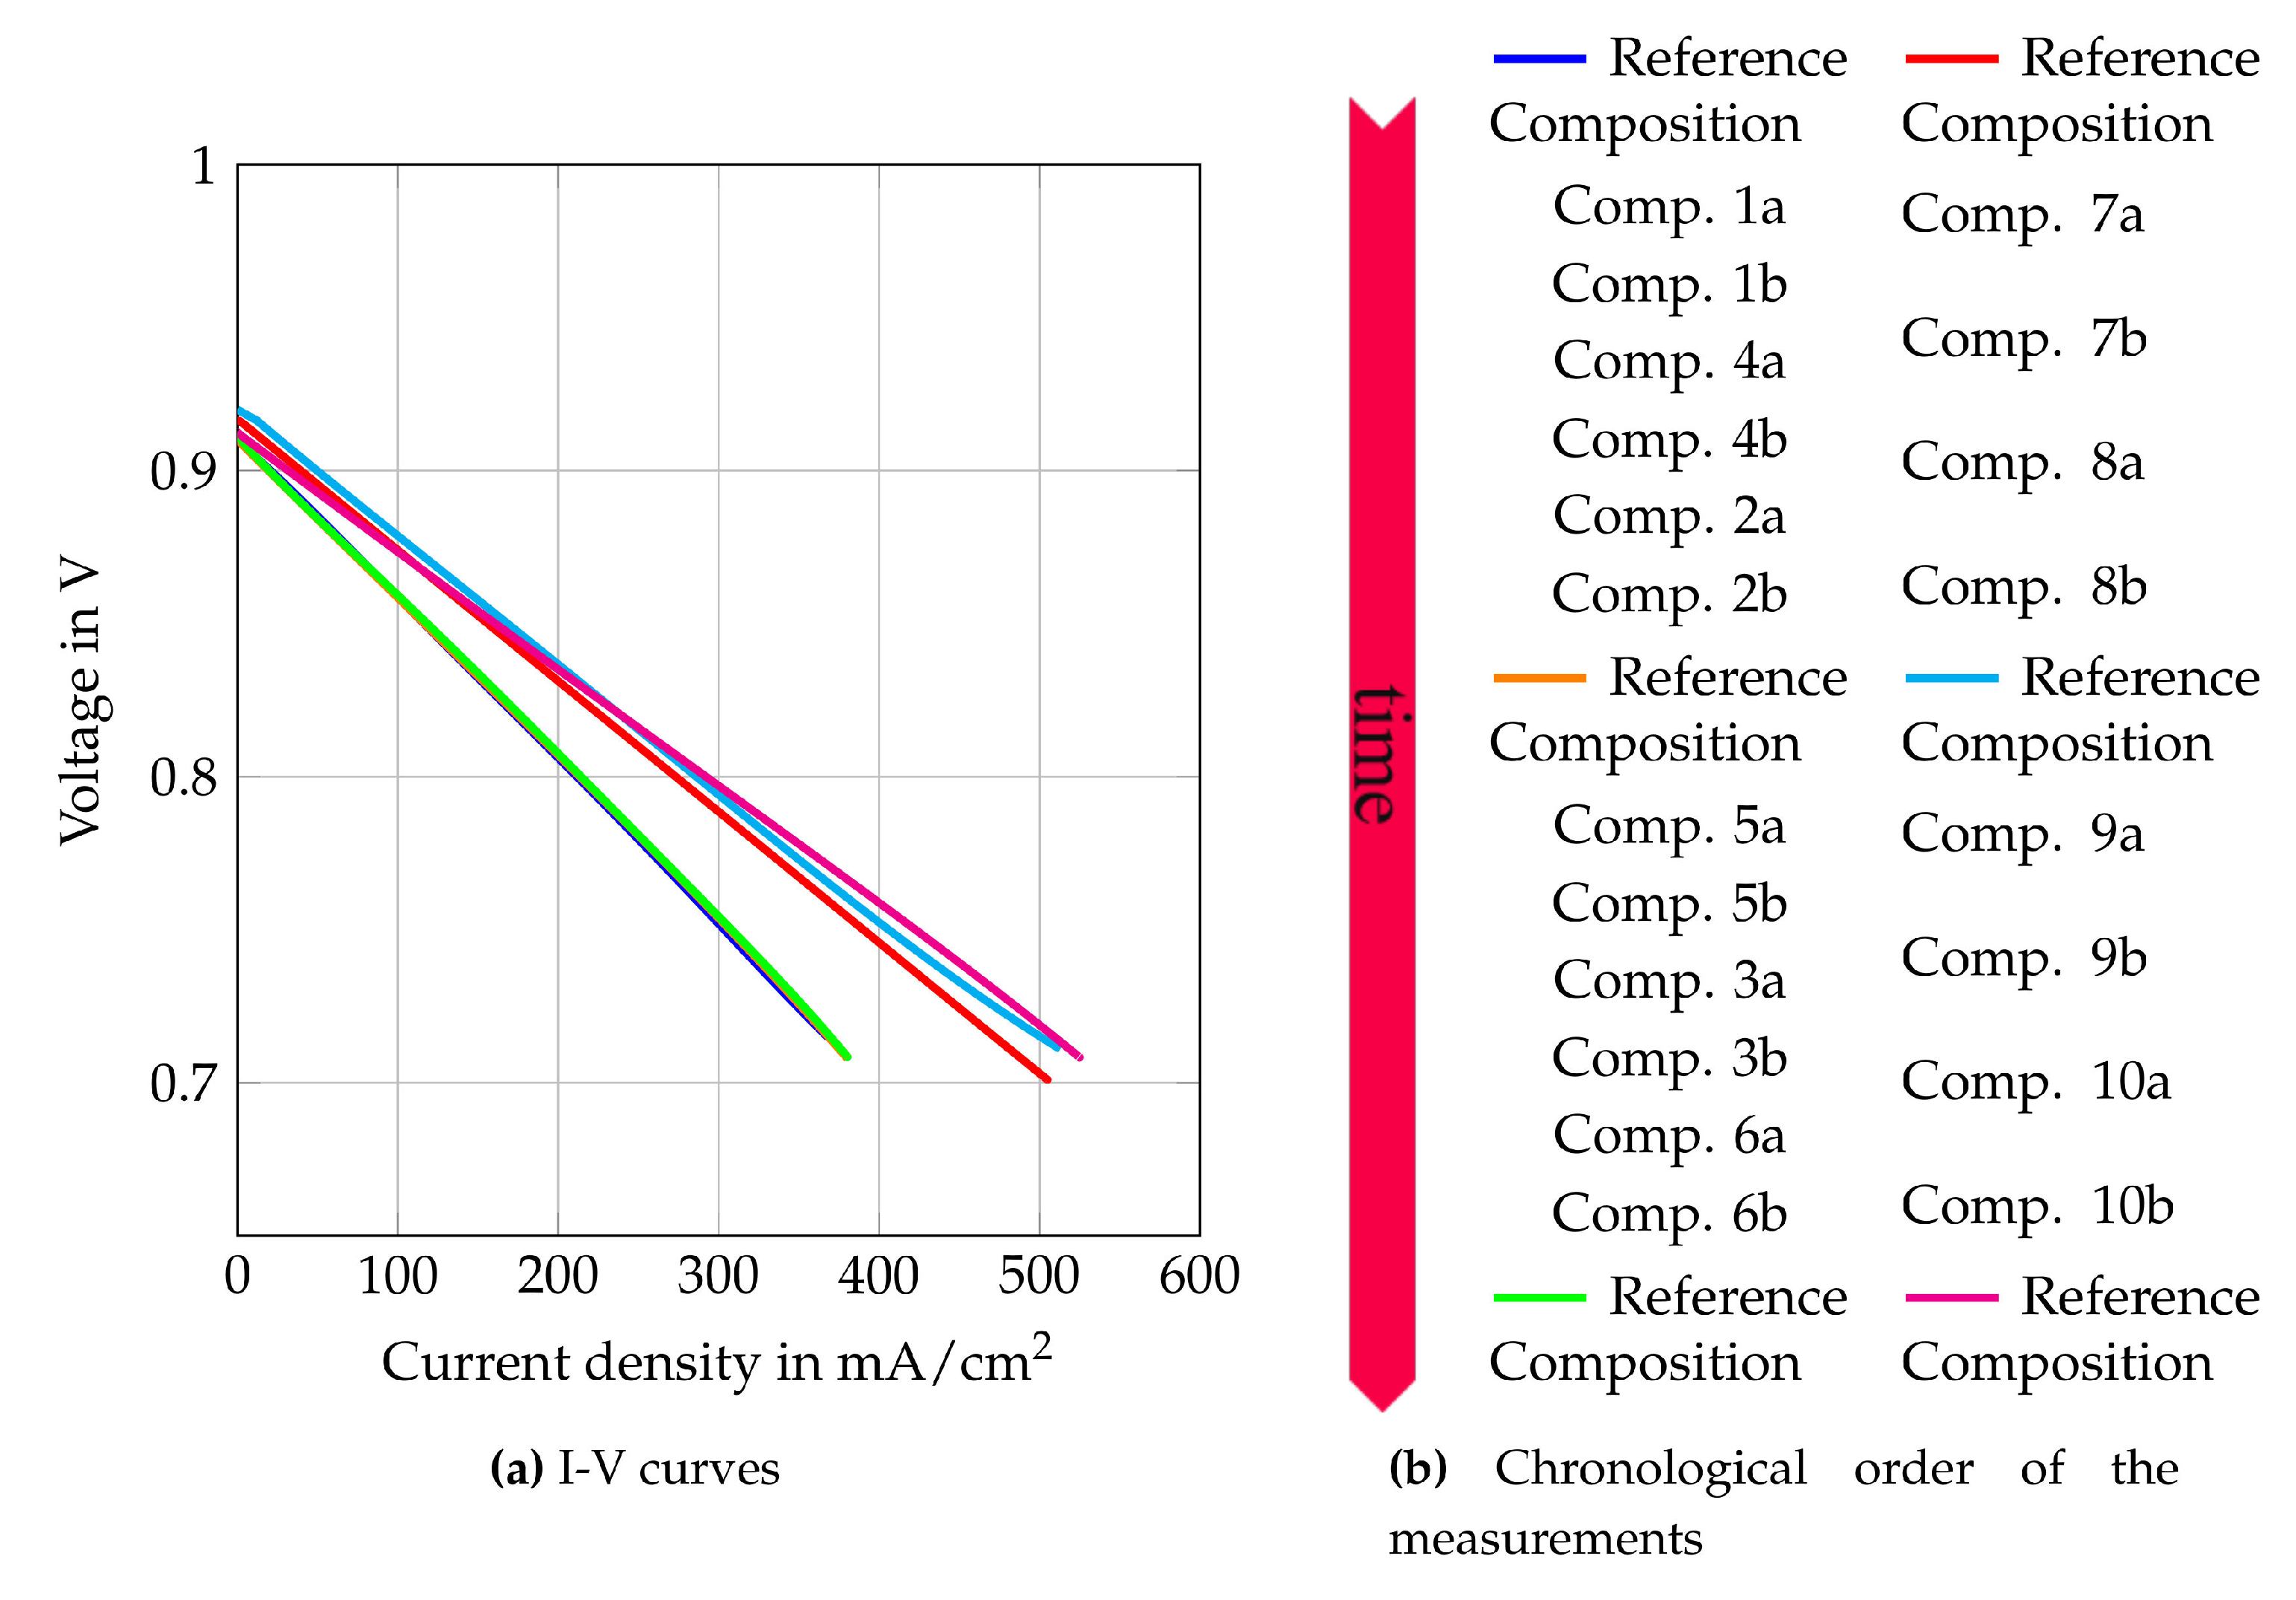
Two tests are conducted to characterize the ESC. Within the first test, the cell is fuelled with auto-thermal reformed methane (Comp. 1–6). For the second test, the cell is fuelled directly with methane for the purpose of internal reforming (Comp. 7–10). Two cells are used to examine their long-term stability and impact of different methane reforming types on the cell degradation. Slight differences in the experimental setup during the experiment preparations occurred, which can also influence the cell performance. Different anode plates are used and consequently, nickel meshes with different thicknesses are used to contact the SOFC anode. The anode plate in the first tests is made of a solid alumina plate with an integrated sunken flow field. The flow field is sunken in a way that the nickel mesh, the anode side of the ESC and the electrolyte of the ESC fill it up. The anode plate of the second tests also has a flow field but it is flat at the top of the plate. Hence, an additional anode frame made from alumina has to be laid on top to create the same effect of a sunken flow field. This results in different power outputs of the used cells for the same gas compositions and temperatures. Hence, only tendencies and no absolute values are compared with each other. To obtain information about the difference in the cell performance and the degradation processes that occur as a function of the operating time, the cells that were fed with a reference gas composition are measured at the initial and final phase of the experiment as well as before changing the fuel. Three of the polarisation curves measured are shown in Figure 9 for each tested cell. They show higher power outputs for the cell where Comp. 7–10 is used but no degradation along the operating time of each cell. Consequently, no influences from degradation mechanisms have to be taken into account when the characterization measurements of each cell are compared among each other, since characterization measurements are carried out in a short time range within which degradation is not occurring.
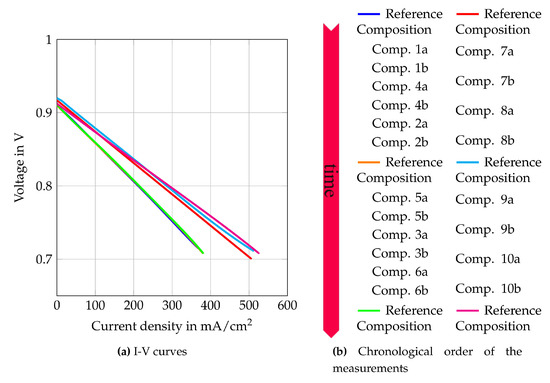
Figure 9.
I–V curves of the reference composition at the beginning of tests with auto-thermal reformed methane  , in the middle of the test series
  and after the test series
  . At the beginning of the internal reforming test series
  , in the middle of the test series
  and after the test series
  .
.
 , in the middle of the test series
  and after the test series
  . At the beginning of the internal reforming test series
  , in the middle of the test series
  and after the test series
  .
.
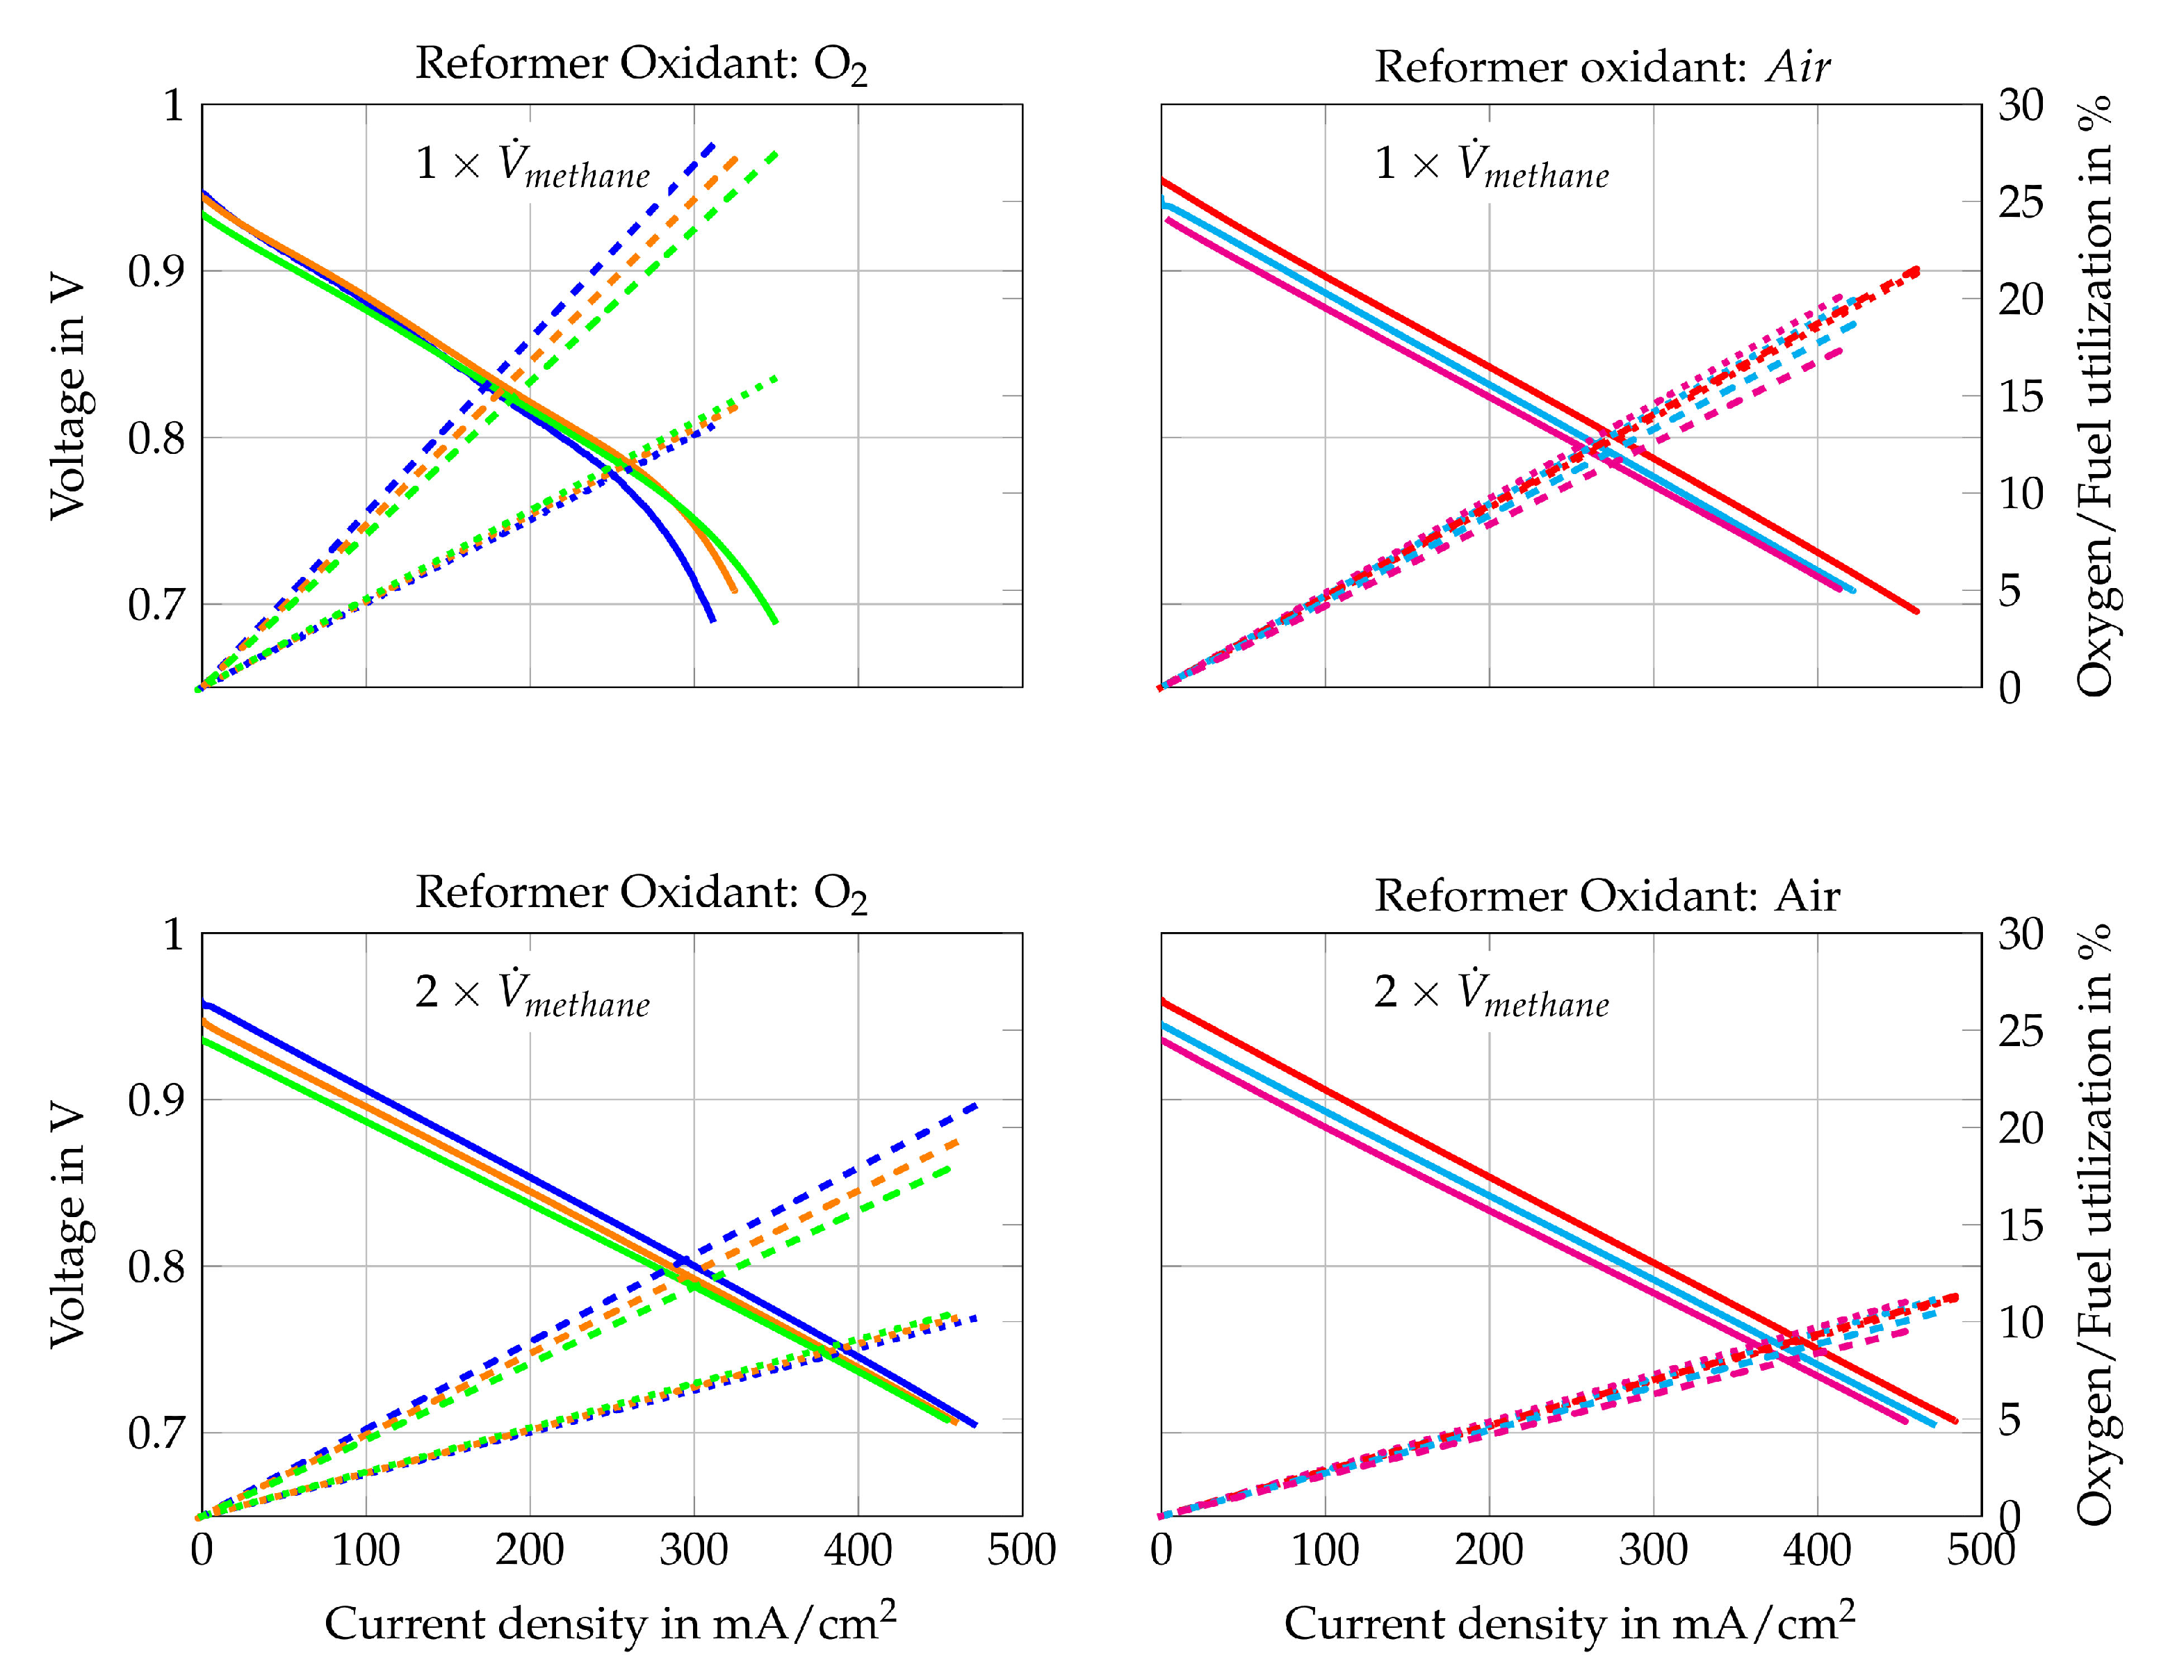
By comparing the cell characteristics for gas composition 1 to 6, the influence of different H2O/C upstream of the reformer, absolute volume flows at the cathode and anode side and the reformer oxidation medium are shown. Figure 10 shows the polarization curves, oxygen- and fuel use rates of Comp. 1a–6b from Table 3. The fuel use () is defined as its oxidation rate and is calculated by
with F as Faraday’s constant. The fuel use is a function of the current (I), the fuel inlet composition (, , , ) and the molar flow of the fuel gas (). A similar equation is used in [74]. The oxygen use is defined as the percentage of available oxygen which is conducted through the cell. This is written as
with the oxygen use rate as a function of the current (I) and the molar oxygen flux () at the cathode side.
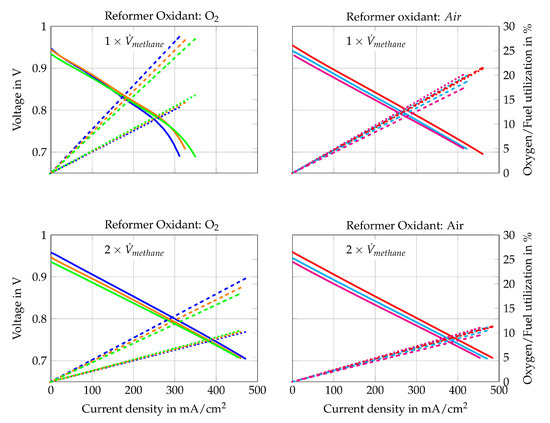
Figure 10.
I–V curve (solid line) of Comp. 1  , 2
, 2  , 3
, 3  , 4
, 4  , 5
, 5  , 6
, 6  , fuel use (dotted line) of Comp. 1
  , 2
, 2  , 3
, 3  , 4
, 4  , 5
, 5  , 6
, 6  and oxygen use (dashed line) of Comp. 1
  , 2
, 2  , 3
, 3  , 4
, 4  , 5
, 5  , 6
, 6  for (gas compositions “a”) and (gas compositions “b”).
 , 2
, 2  , 3
, 3  , 4
, 4  , 5
, 5  , 6
, 6  , fuel use (dotted line) of Comp. 1
  , 2
, 2  , 3
, 3  , 4
, 4  , 5
, 5  , 6
, 6  and oxygen use (dashed line) of Comp. 1
  , 2
, 2  , 3
, 3  , 4
, 4  , 5
, 5  , 6
, 6  for (gas compositions “a”) and (gas compositions “b”).
The polarization curves in Figure 10 show that higher H2O/C ratios upstream of the reformer lead to lower current densities at certain voltages. Only Figure 10a shows an opposite trend for current densities higher than 150 mA/cm2. This might be caused by concentration losses since a slight air leakage was observed at the cathode side during the removal of the cell. This leakage leads to more distinct concentration losses for Comp. 1a, 2a and 3a because they have the lowest air volume flows and the highest theoretical oxygen utilization rates. The other gas compositions do not show such strong concentration losses. Nevertheless, comparing Comp. 4a, 5a and 6a () with Comp. 4b, 5b and 6b () respectively, shows lower power outputs for lower total volume flows. Hence, concentration losses seem to have slight impact on the performance. Activation losses cannot be seen in any polarization curve, which is explained by the presence of educts and products of the oxidation reactions within the fuel gas mixture.
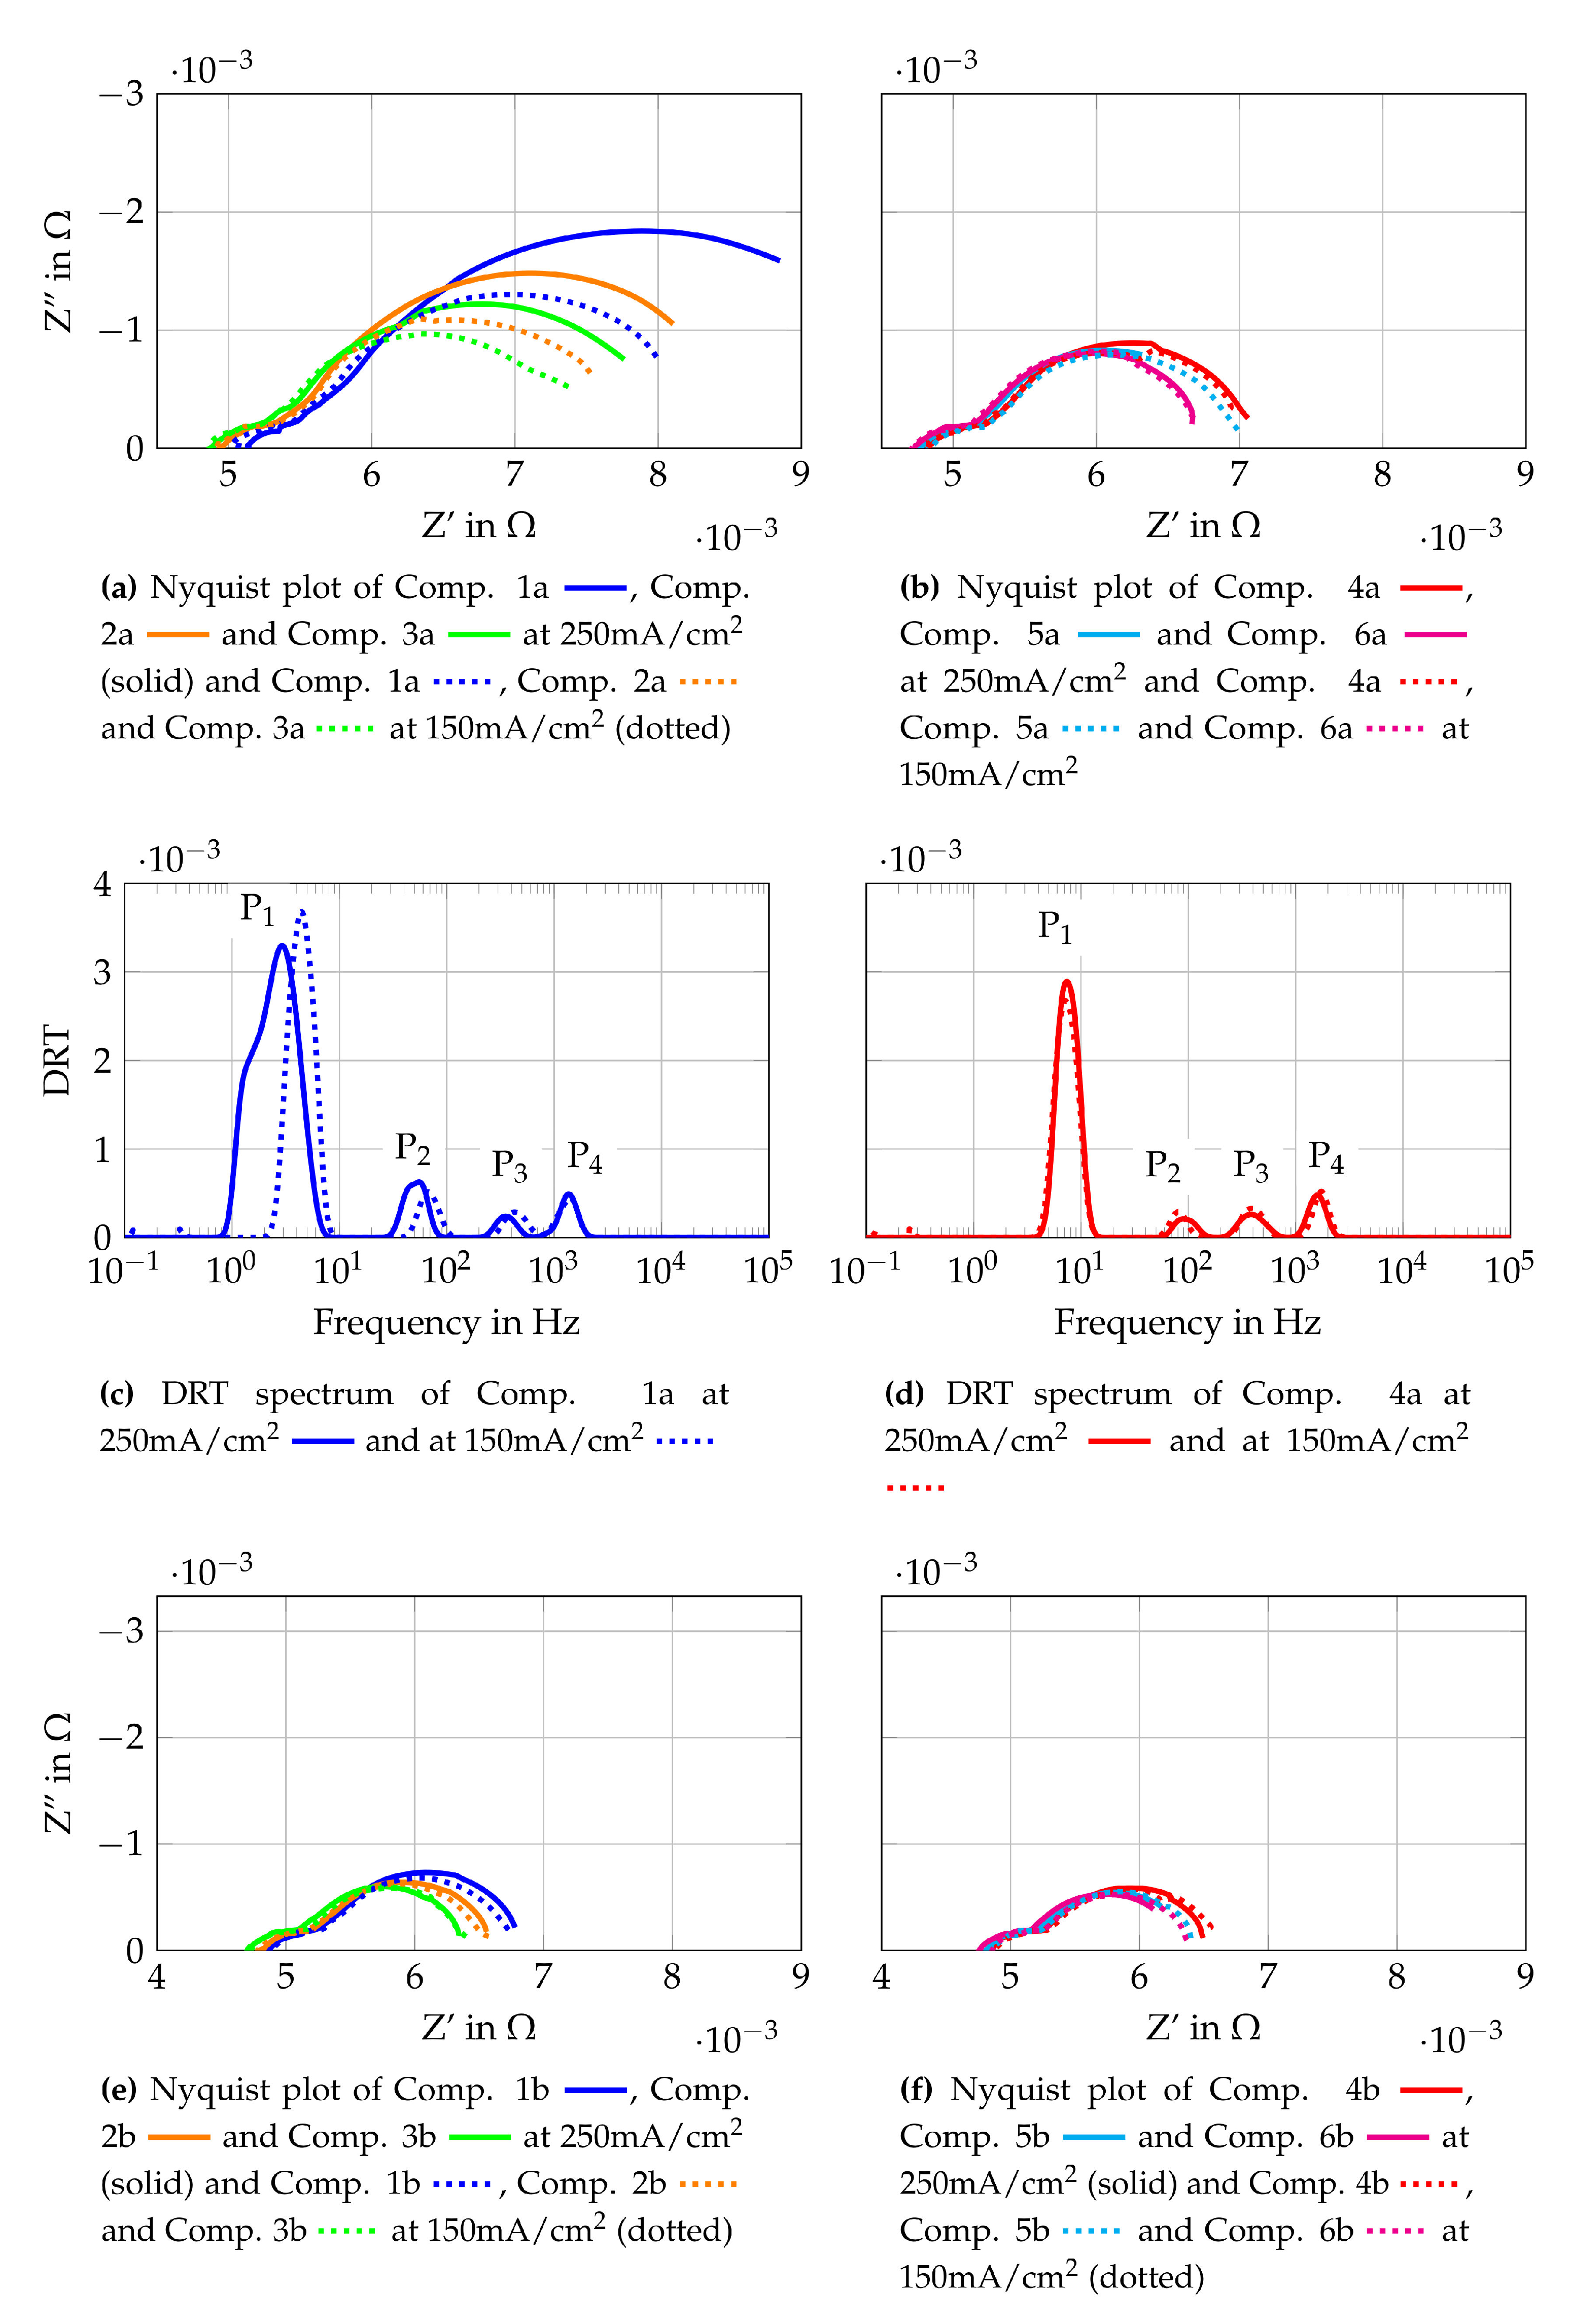
To gain further insights into the origin of the losses observed, EIS measurements are conducted and the results are shown in Figure 11. Figure 11 shows the Nyquist plots at 250 mA/cm2 and 150 mA/cm2 for gas Comp. 1a–6b. In addition, the DRT spectra of Comp 1a and 4a are shown as representative curves for the other gas compositions. The Nyquist plots are generated using the raw measurement data and the DRT spectra use fitted data from the KK-test, as described in Section 3.2. All Nyquist plots in Figure 11 show that increasing current densities lead to increasing polarization resistances at similar ohmic resistances. Comparing the Nyquist plots for each gas composition with lower initial methane flow (Figure 11a,b) shows the highest polarization resistant for Comp. 1a and the lowest resistance for Comp. 6a. Nyquist plots of the higher total volume flows (Figure 11e,f) do not show such a clear tendency. Whereas gas compositions with higher total volume flow (compositions “b”) show distinct lower polarization resistances than the respective gas compositions with a lower total volume flow (compositions “a”). Hence it is assumed that the volume flow and therefore, the oxygen and fuel use rates have an impact on these losses. Nevertheless, it should be considered that the effect of slight leakages has more influence on lower volume flows resulting in possible higher losses for compositions “a” compared to compositions “b”. To gain further knowledge of the losses, the DRT spectra of Comp. 1a (Figure 11c) and Comp. 4a (Figure 11d) are evaluated. They show four peaks each, with differences between the low frequency peak (P1 = 1 Hz–10 Hz) and the lower medium frequency peak (P1 = 10 Hz–200 Hz). The studies [43,75,76,77,78,79,80,81] based on application of anode supported cells (ASC) but with similar materials are used for discussions presented below. According to these, the low frequency peak P1 is linked to gas diffusion within the anode or the flow channels of the flow field. Peak P2 is assigned to processes at the LSCF cathode such as oxygen surface exchange kinetics and diffusion of oxygen ions within the LSCF bulk. These studies fit well to the observed changes of P1 and P2, since the assigned losses are lower at higher volume flows and lower current densities. The higher medium frequency peak (P3 = 200 Hz–800 Hz) and the high frequency peak (P4 = 800 Hz–3 kHz) are assigned to charge transfer, electrochemical reactions at the triple phase boundary and ionic conduction processes. These two peaks shift to higher frequencies if Comp. 4a is compared to Comp. 1a. This shift might be a result of different volume flows, as shown in [72]. The mean temperature of the cell is 2 K lower when Comp. 4a is used than if Comp. 1a is used. This could lead to higher frequencies of the DRT peaks by using Comp. 1 due to higher average cell temperatures. Taking into account the EIS and DRT evaluation performed, the major influence of the losses observed in the polarisation curves are assigned to gas diffusion at the anode and cathode.
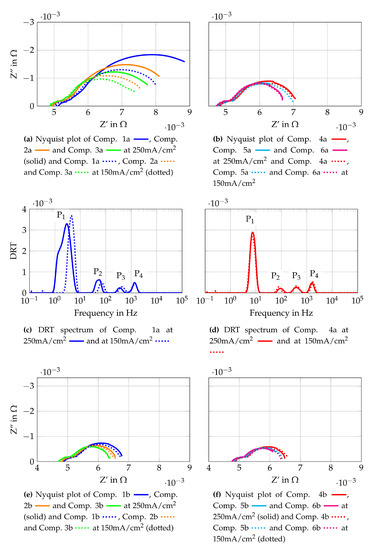
Figure 11.
Cell characterization with gas mixtures obtained from auto-thermal reformed methane.
The best ratio of performance and fuel use, however, is achieved with Comp. 4a. Its maximum power output is close to the power outputs of Comp. 1b, 2b, 3b, 4b, 5b and 6b and the maximum fuel use rate is nearly twice as high, as shown in Figure 10. In addition, Comp. 4a is gained by reforming methane with air as oxidizer, which is preferable for stand-alone applications. Consequently, Comp. 4a is chosen for the 500 h long-term test run of the auto-thermal reformed methane compositions (Comp. 1–6) as it is the preferred gas composition to run the stand-alone SOFC-reformer system. The long-term test run is described in detail in Section 4.3.
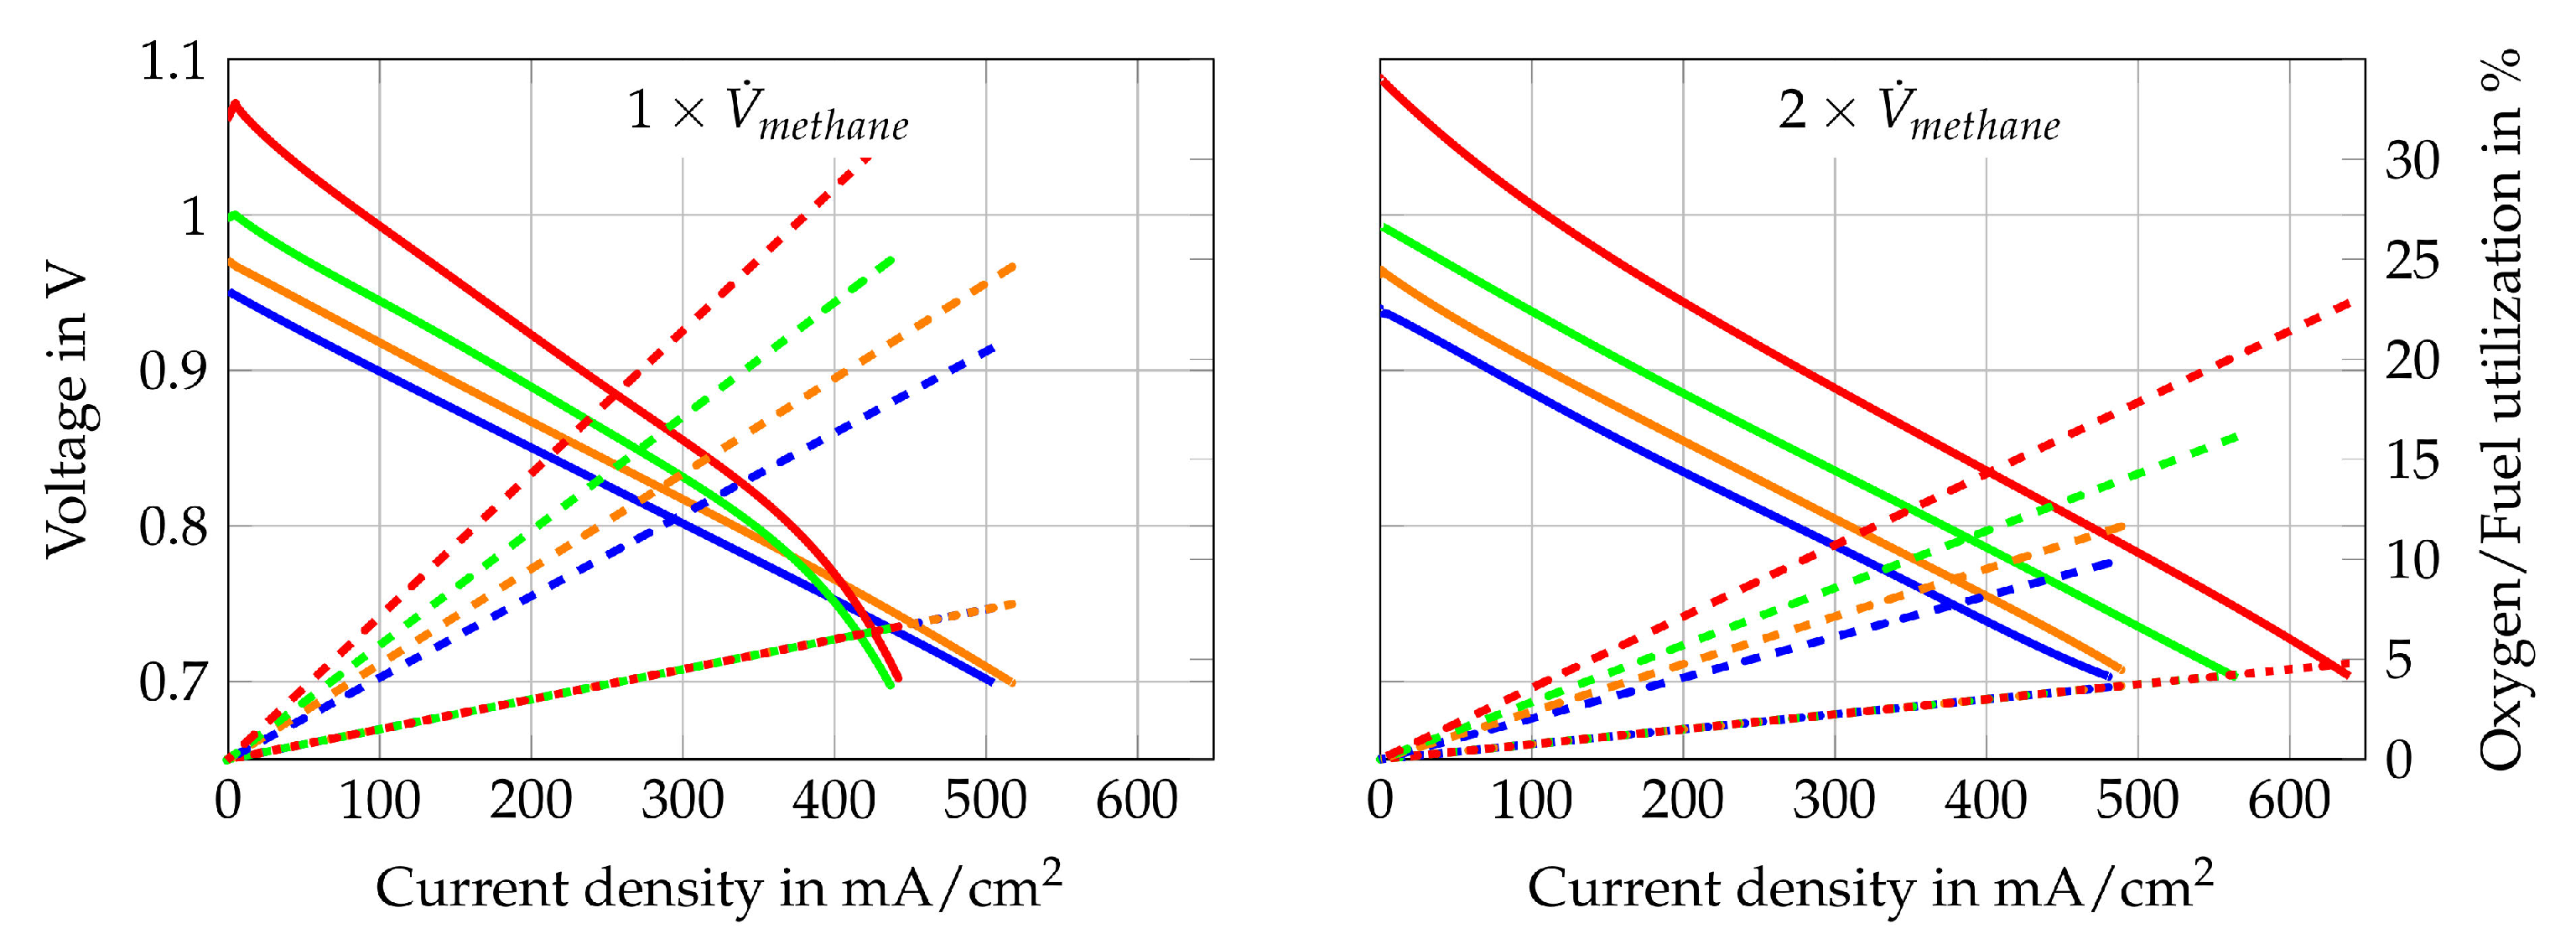
The second single cell is tested with Comp. 7–10 from Table 3. These supply gas compositions consist of steam and pure methane with different H2O/C. To characterize the cell operated under internal reforming conditions, the same measurements are conducted as for Comp. 1–6. The polarization curves, fuel- and oxygen uses that are obtained are shown in Figure 12. It is also shown that the gas compositions with the two lowest volume flows (Comp. 9a and Comp. 10a) show again the highest concentration losses. The other gas compositions do not show such distinct concentration losses. The activation losses can be observed and they are clearly visible for Comp. 10a and 10b. The reason they are visible under these operating points might be due to a low partial pressure ratio of steam to methane and very low partial pressures of the carbon oxidation products in the gas mixture at the cell inlet. Although very low partial pressures of CO and CO2 within the inlet gas mixture do not seem to be responsible for the visible activation losses on their own since higher H2O/C lead to no visible activation losses. Impedance measurements and the DRT method are implemented to check where these losses originate. The results are shown in Figure 13.
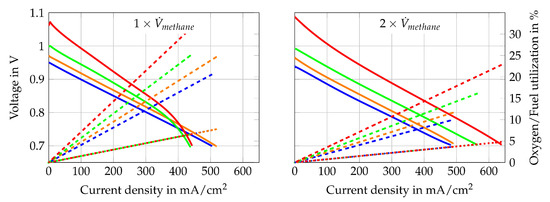
Figure 12.
I–V curve (solid line) of Comp. 7  , 8
, 8  , 9
, 9  , 10
, 10  , fuel use (dotted line) of Comp. 7
  , 8
, 8  , 9
, 9  , 10
, 10  and oxygen use (dashed line) of Comp. 7
  , 8
, 8  , 9
, 9  , 10
, 10  for (Compositions “a”) and (Compositions “b”).
 , 8
, 8  , 9
, 9  , 10
, 10  , fuel use (dotted line) of Comp. 7
  , 8
, 8  , 9
, 9  , 10
, 10  and oxygen use (dashed line) of Comp. 7
  , 8
, 8  , 9
, 9  , 10
, 10  for (Compositions “a”) and (Compositions “b”).
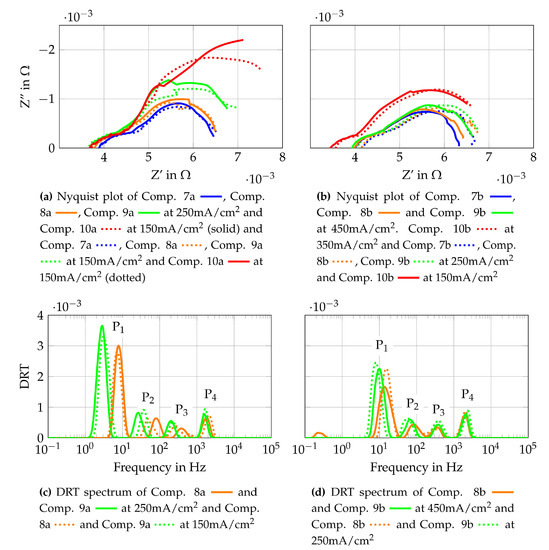
Figure 13.
Cell characterization with gas mixtures for internal reforming of methane.
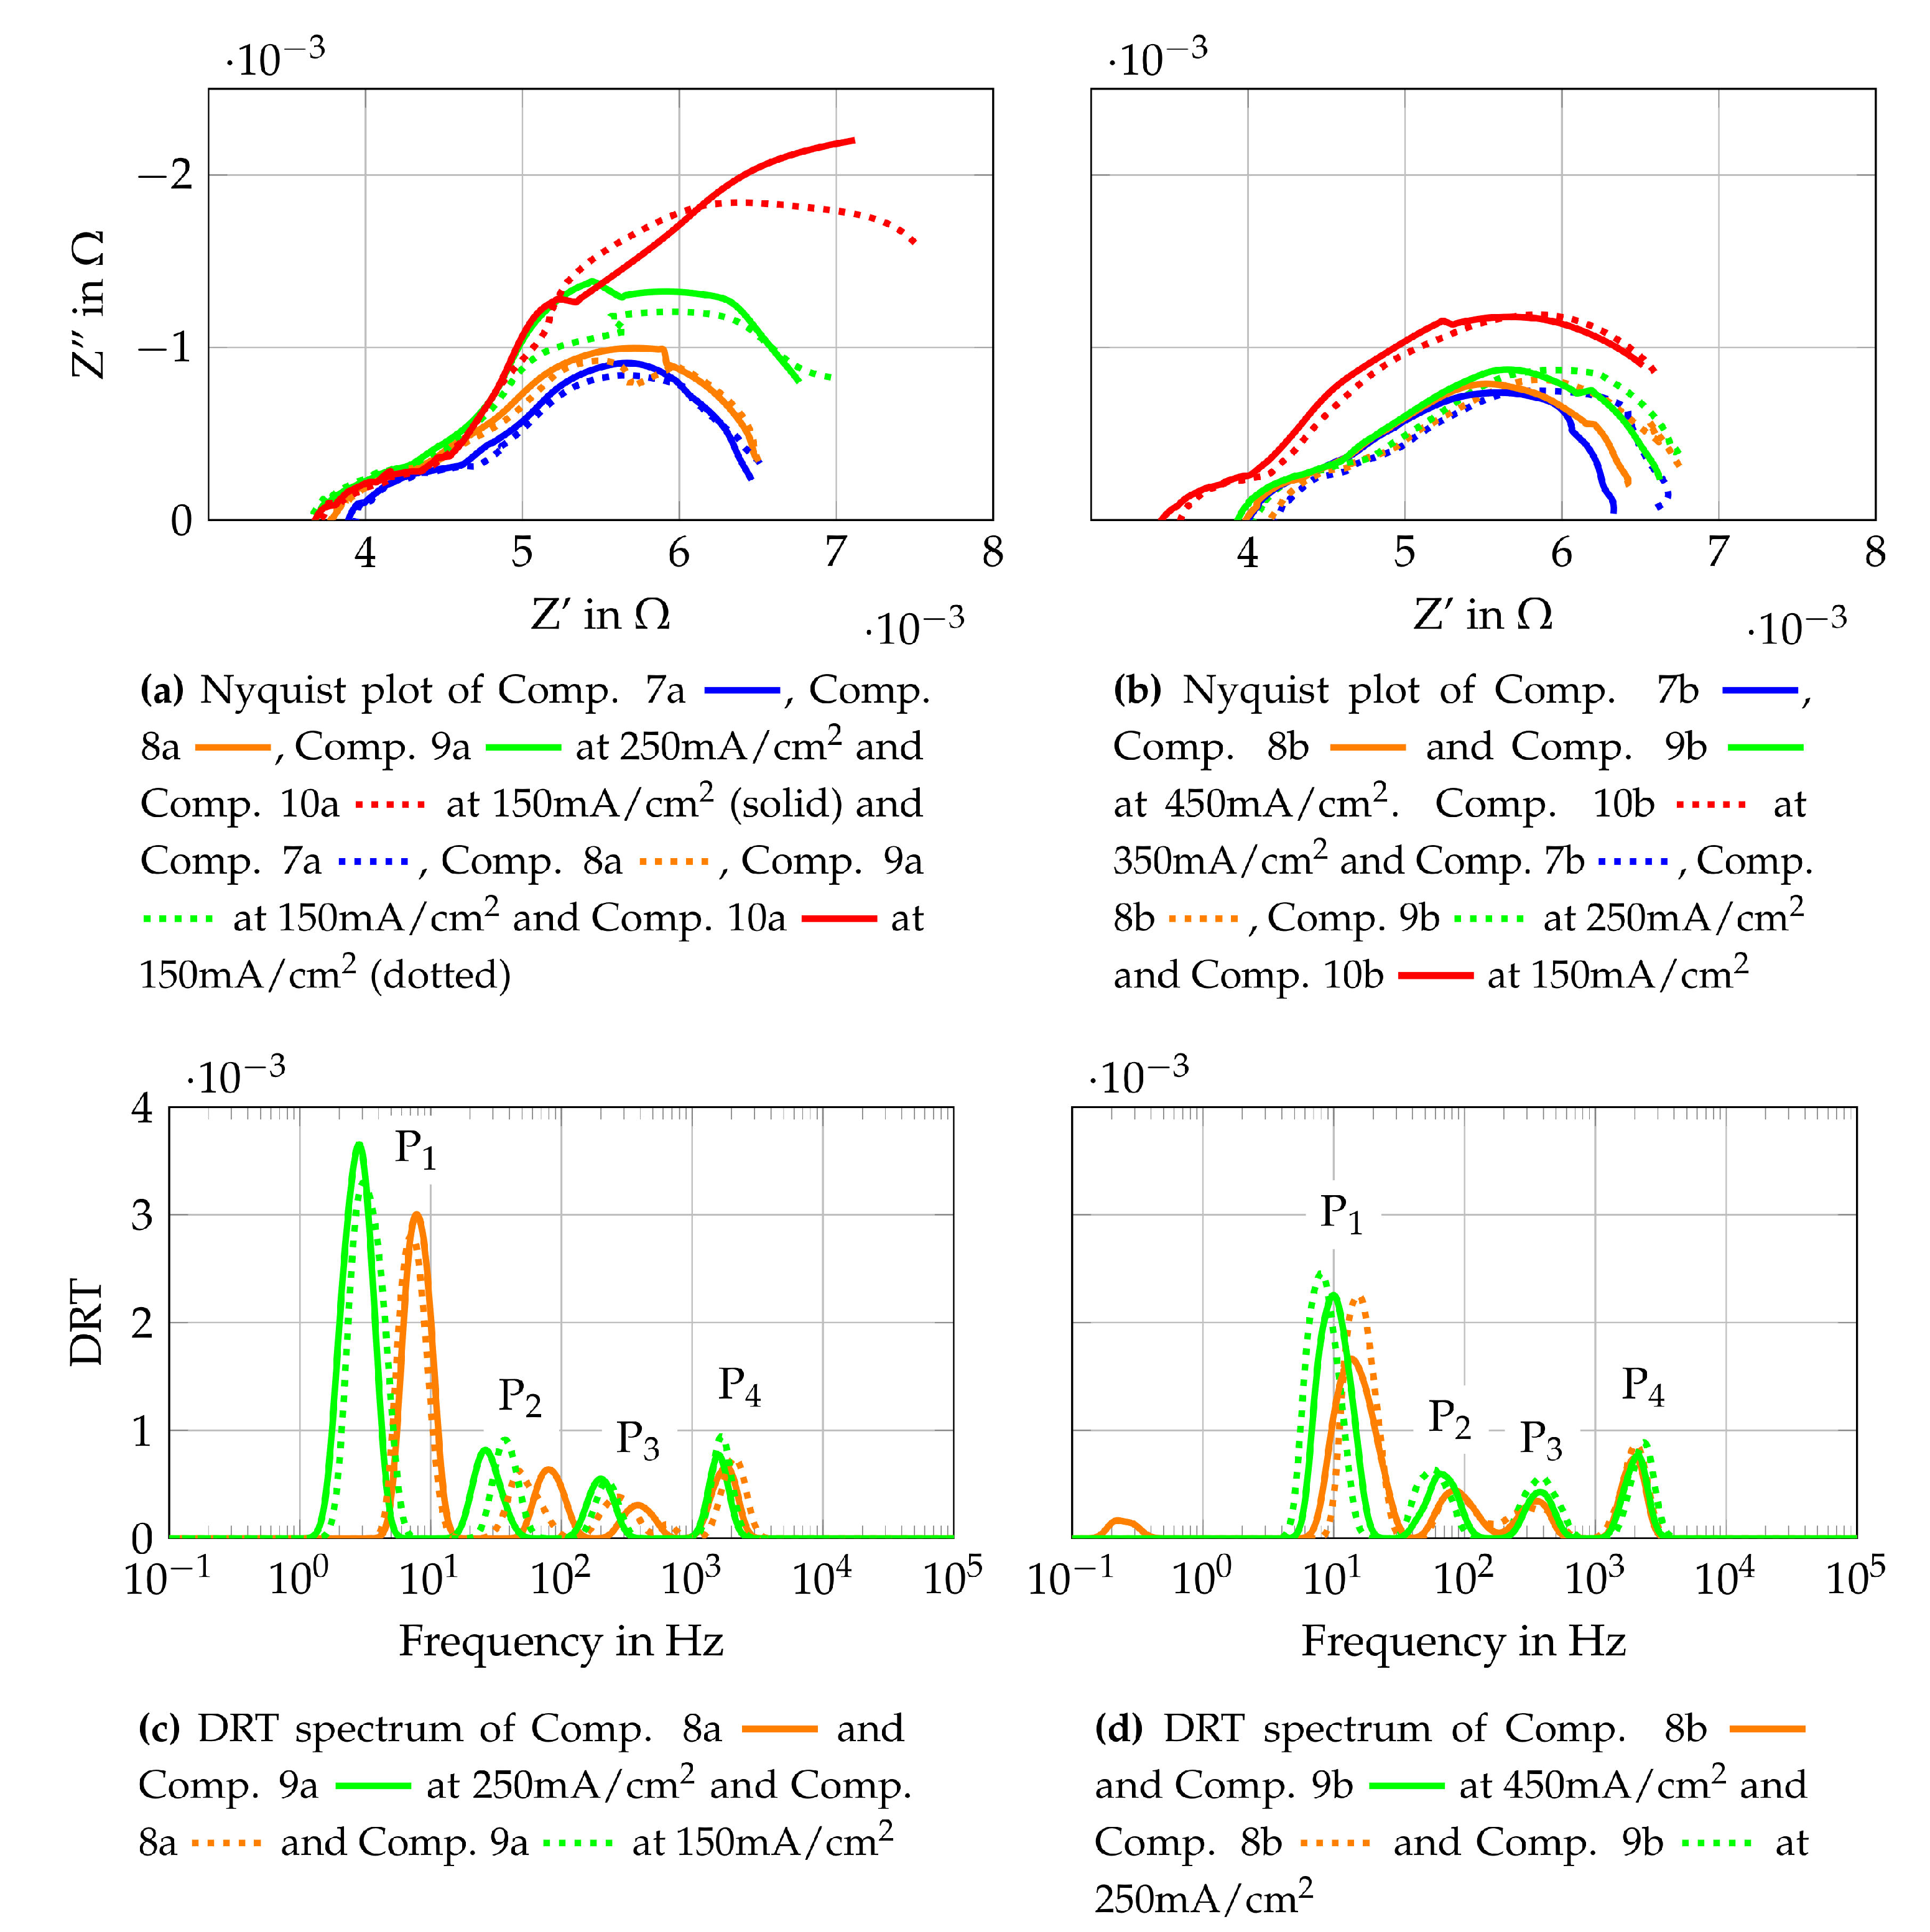
Nyquist plots are shown for Comp. 7 to Comp. 10 and DRT spectra are shown for Comp. 8a, 9a, 8b and 9b. The Nyquist plots, which are gained from the raw data, need to be interpreted carefully since a slight oscillating pressure within the steam generator (amplitude < 50 mbar) lead to an oscillating steam partial pressure at the cell. The slight oscillating steam partial pressure results in a slight voltage oscillation. The same pressure oscillation within the steam generator is observed by testing Comp. 1–6 but does not result in an oscillating cell voltage. The higher percentage of steam in Comp. 7–10 compared to Comp. 1–6 and the additional more pronounced steam reforming reaction at the fuel cells anode might be the reason for a stronger dependency of the steam partial pressure oscillation and the cell voltage for Comp. 7–10. The Nyquist plots in Figure 13a,b show higher polarization resistances for same H2O/C and lower total volume flows, whereas changes of the ohmic and polarization resistances for different current densities are only clearly visible for Comp. 7b, 8b and 10a. Comparing different H2O/C with the same methane volume flow, higher polarization resistances and lower ohmic resistances for lower H2O/C are observed. It would appear that concentration losses have a big impact on the performance of the SOFC, as already shown for Comp. 1 to 6. In addition, activation losses seem to have a larger impact for Comp. 7 to 10 as for Comp. 1–6. To further investigate the losses, DRT spectra are shown in Figure 13c,d. Comparing the DRTs from Comp. 8a and 8b to Comp. 9a and 9b, a frequency shift of peak P1, P2 and P3 towards lower frequencies is observed. This shift is also present when Comp. 8b and 9b are compared to Comp. 8a and 9a respectively. The mean temperature of the cell at Comp. 8b and 9b is 5 K to 6 K lower than for Comp. 8a and 9a. This does not explain the shift to lower frequencies but it is shown in [72] that DRT peaks below 1kHz shift to higher frequencies with increasing volume flows at constant current densities. This effect explains the observed frequency shift which does not correlate to the temperature distribution of the cell. The temperature difference between Comp. 8a and 9a is less than 1K. The same is true for the temperature difference between Comp. 8b and 9b. This means that the frequency shift between them is also a result of the changing gas composition and volume flow. In conclusion, the losses related to peak P1 and P2 mostly alternate, which means that gas diffusion on anode and cathode side are the most pronounced influencing parameters for the operating conditions used in this study.
To find the most suitable gas composition for the stand-alone system, however, different parameters such as high fuel use rates, power outputs and stable voltages must be taken into account in parallel. Consequently, Comp. 9 and Comp. 10 are not further investigated since slightly oscillating voltages are observed. Taking this in consideration, Comp. 8a has the best ratio of fuel use to electrical power output and operation at stable voltages is possible. It is, therefore, used for the second long-term test run, which is described in Section 4.3.
4.3. Investigation of SOFC Degradation
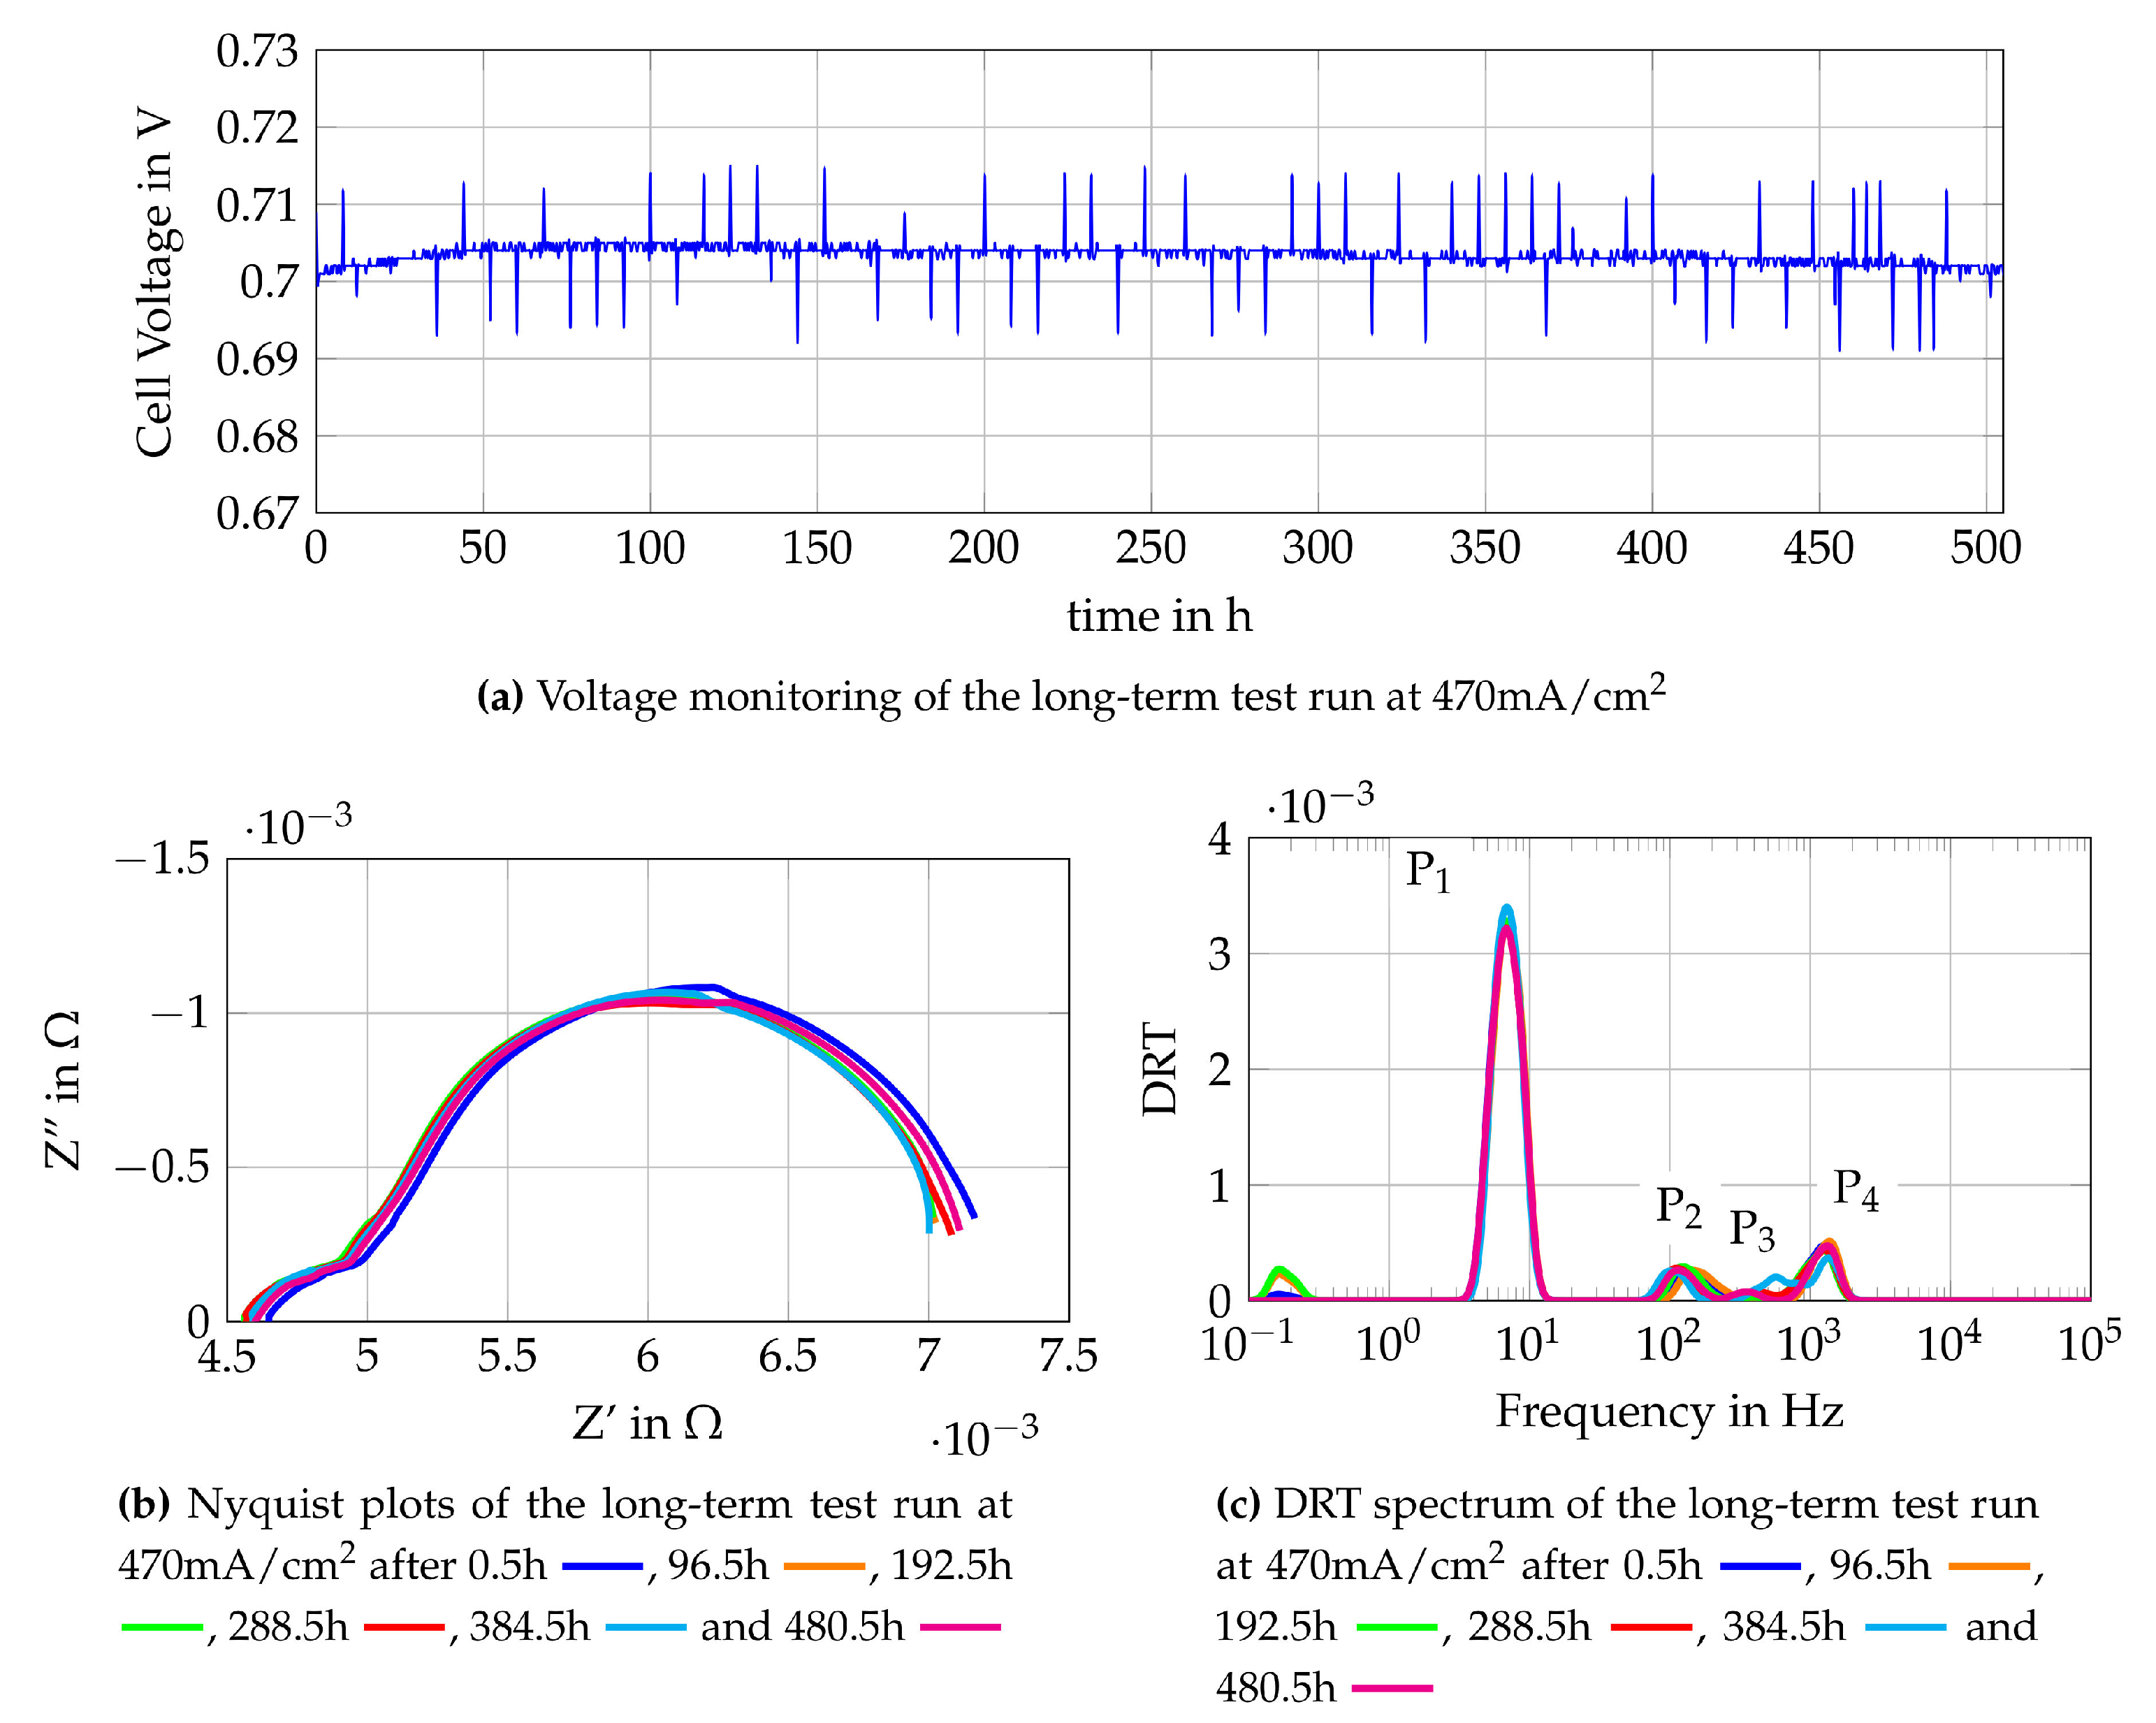
The single cell characterization is used to define the most suitable gas compositions for operation of the stand-alone SOFC-system. One gas composition used is obtained from auto-thermal reforming of methane in a reformer (Comp. 4a) and the other is a mixture of methane and steam which is directly fuelled to the SOFC (Comp. 8a). These two gas mixtures are further tested in long-term test runs to gain knowledge about possible degradation mechanisms and to collect reference data for the online monitoring tool. The long-term test run is conducted by loading the cell with 470 mA/cm2 at around 0.7 V for Comp. 4a and 500 mA/cm2 at slightly above 0.7V for Comp. 8a and measuring impedance spectra every four hours. Impedance measurements are chosen as a method for online monitoring since it has nearly no influence on the operation and gives detailed insights to losses occurring during the operation of SOFC. The monitoring of the test run with Comp. 4a is shown in Figure 14. Figure 14a shows the voltage monitoring which appears to be constant along the 500 operating hours. The visible peaks are the oscillations of the voltage caused by the impedance measurements. The Nyquist plots of the impedance measurements are shown in Figure 14b, where only the plots after 0.5 h and 384.5 h of operation show changes. The plot observed after 0.5 h has a higher polarization resistance and a higher ohmic resistance. This is explained by lower temperatures since the time required to reach the equilibrium state is not elapsed. The DRT plot at 384.5 h of operation shows a difference in the high medium frequency peak at 200 Hz–1 kHz. It might be caused by a measurement error or temporary effects. The remaining EIS and DRT plots show a steady behaviour of the cell which indicates no significant degradation. Since steady results are obtained from the online monitoring, the chosen operating conditions seem to be sufficient for application in SOFC-reformer stand-alone systems. To further prove that no degradation mechanisms such as formation of solid carbon deposition occurred, scanning electron microscopy (SEM) and energy dispersive X-ray spectroscopy (EDX) are conducted.
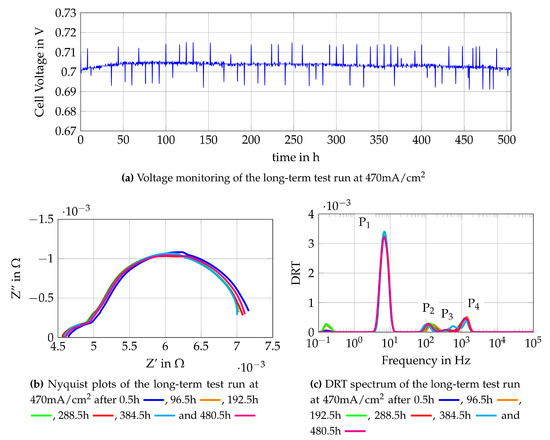
Figure 14.
Monitoring data of the single cell fuelled with Comp. 8a at 470 mA/cm2.
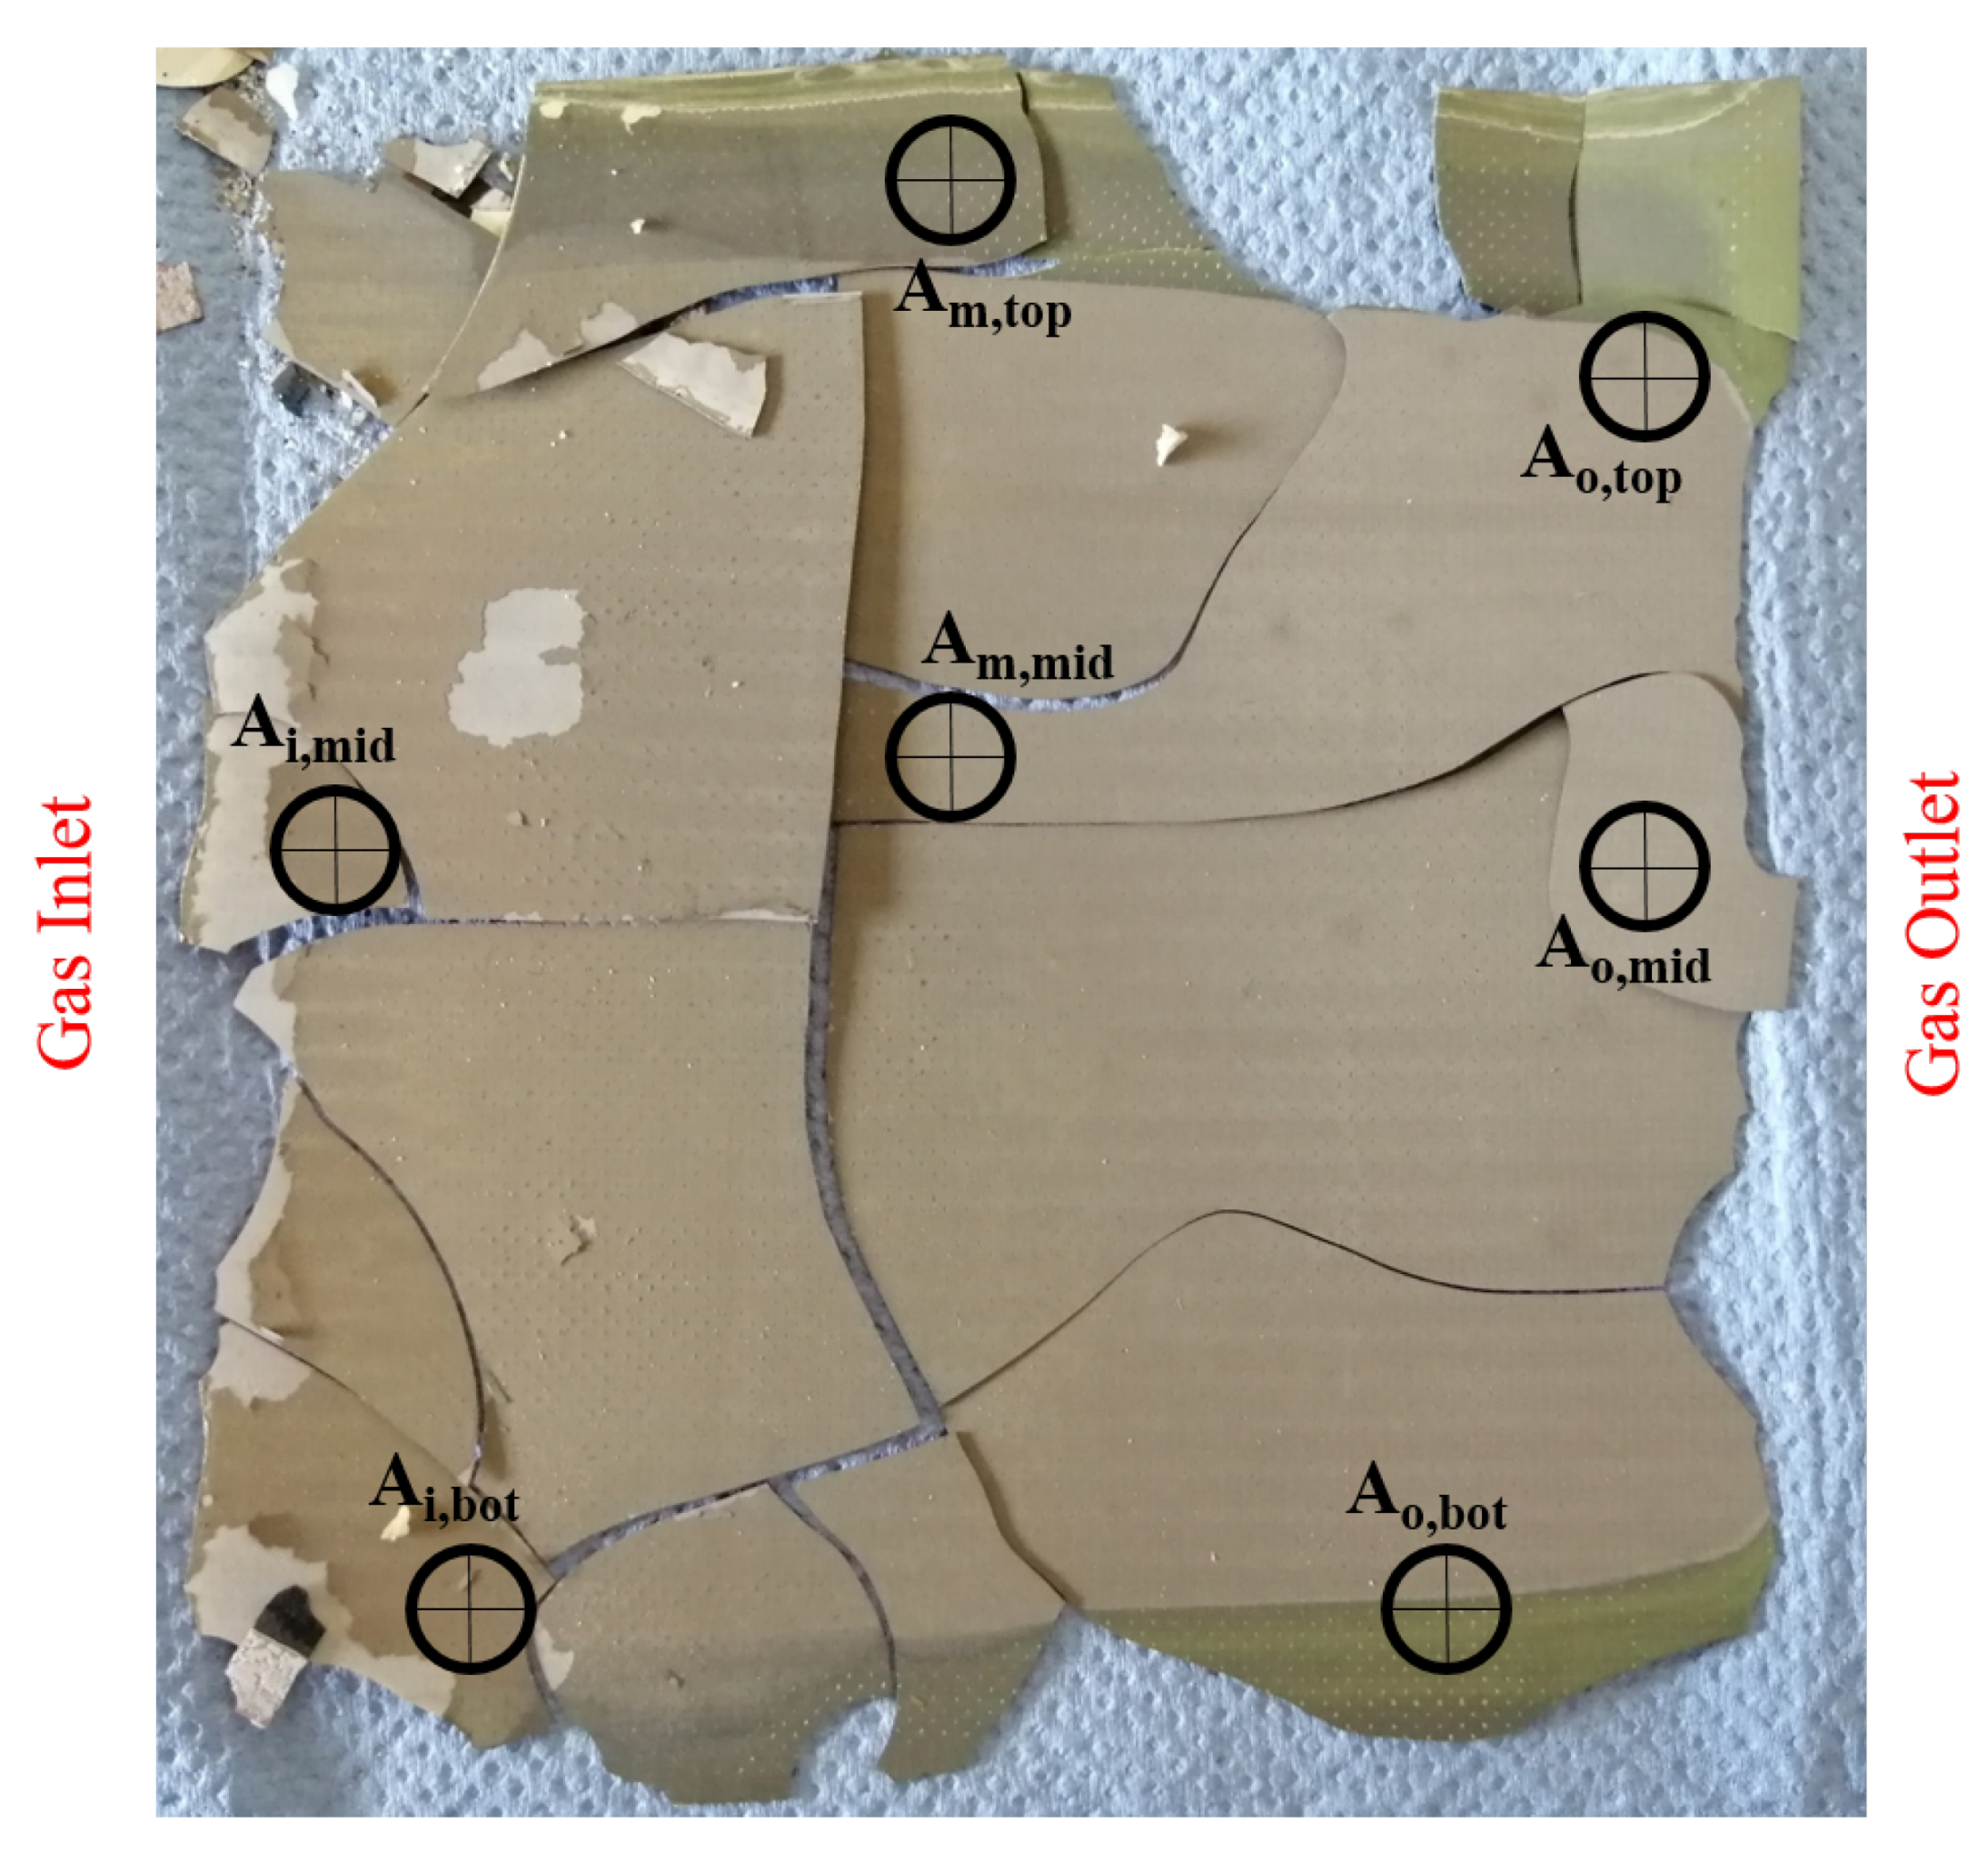
Figure 15 shows a picture of the cell after the 500 h long-term test run with Comp. 4a. Seven points along the cell are chosen to investigate possible degradation mechanisms by using SEM and EDX. As seen in the photograph, the edges of the cell are oxidized, which is most likely caused by leakages in the glass sealing. These leakages occurred because the glass sealing ruptured as a result of cooling the cell to room temperature. The EDX of the marked points, however, shows only small amounts of carbon along the cell. Additionally, the distribution of carbon has no local peak and SEM showed no major solid carbon formation as well but some organic particles are found on the cells surface. The low carbon quantities match with the results from Section 2.2. By contrast, large quantities of oxygen are observed along the cell. SEM in combination with EDX analysis showed that oxygen is mainly bound in nickel oxide. This occurred not only at the edges of the cell but in the middle of the inlet area (Ai,mid), the centre of the cell (Am,mid) and the middle of the outlet area (Ao,mid) as well. Nickel oxidation could be caused by the broken glass ceiling from the cooling process, since no degradation of the cell has been determined by in situ monitoring tools or by decreasing cell voltage. Elements which are observed in addition to carbon, nickel and oxygen are cerium, gadolinium and silicon. The latter element is also part of the glass sealing but the analysed points do not show a clear tendency in the silicon distribution.
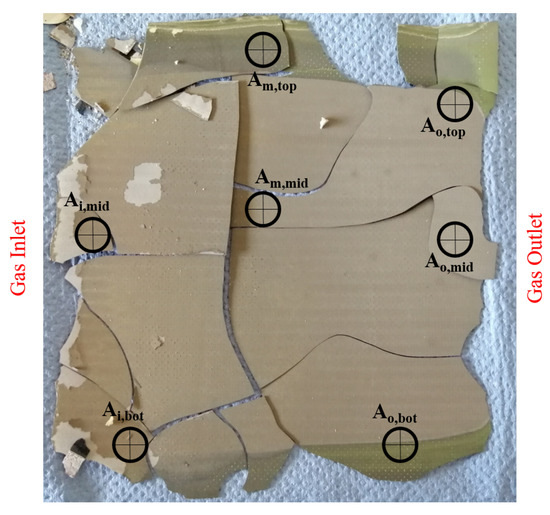
Figure 15.
Anode side of the single cell operated for 500 h with Comp. 4a.
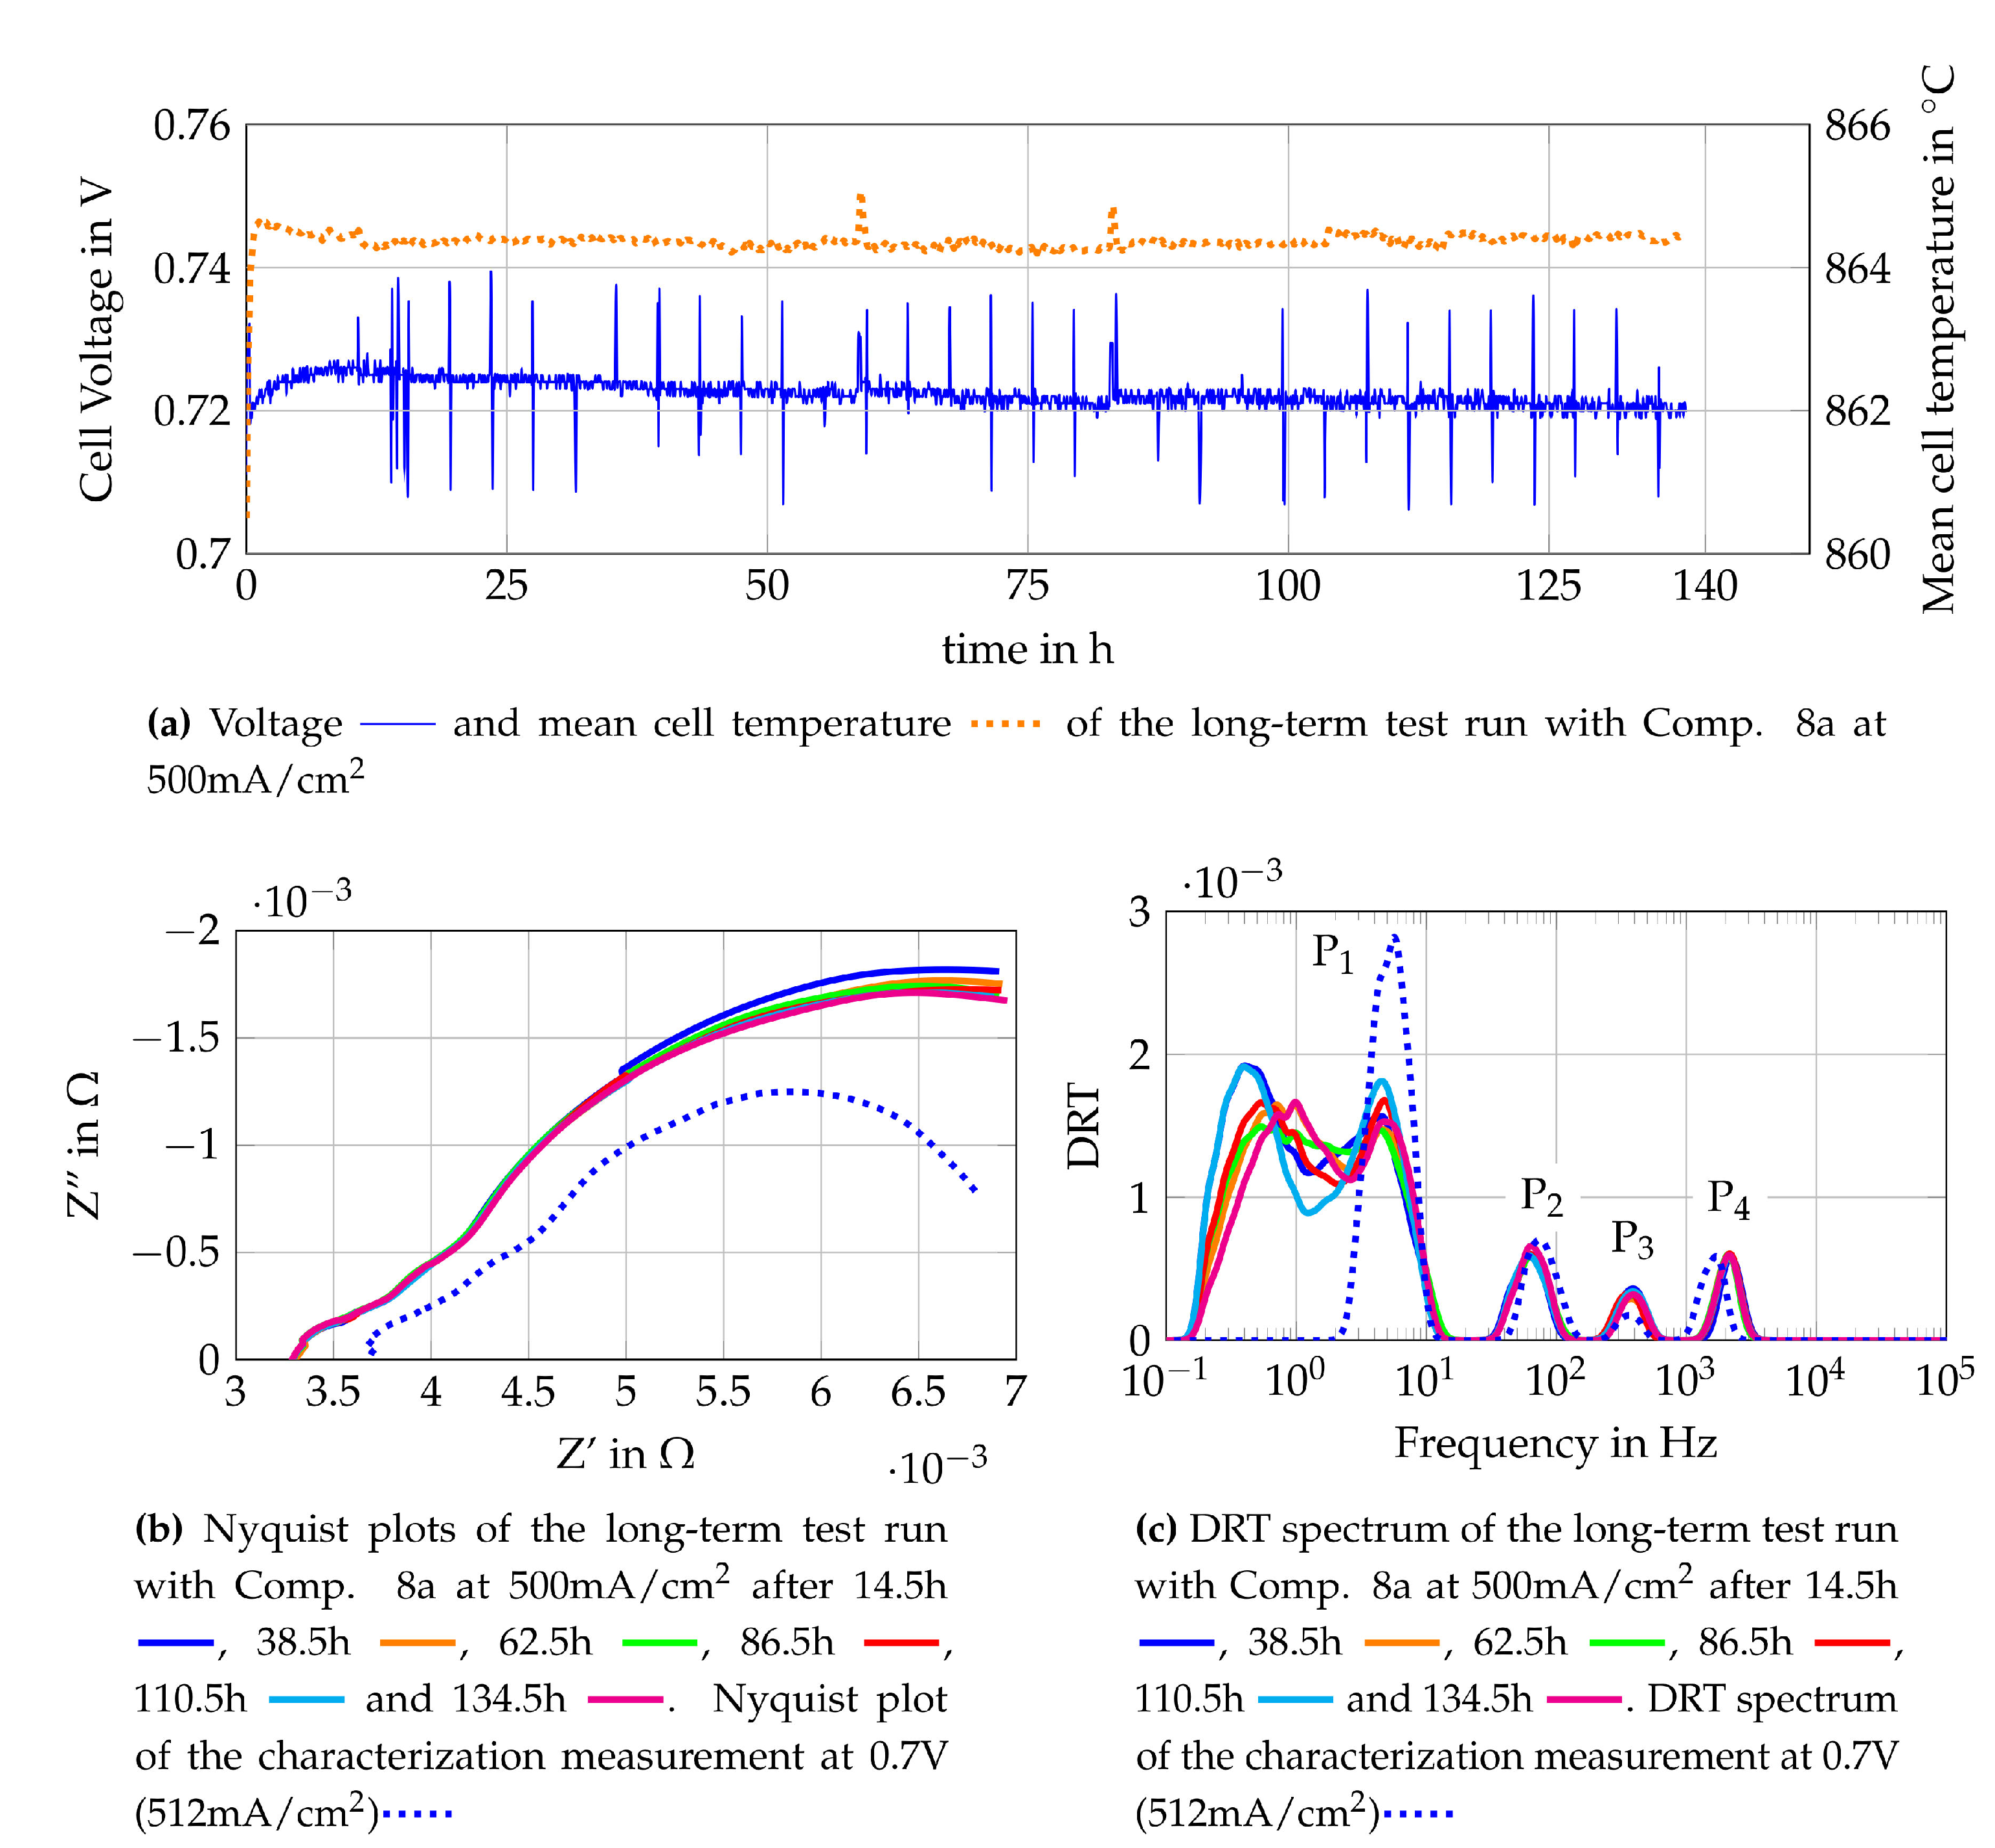
The long term test run of the second single cell is performed fuelling the cell with Comp. 8a. The voltage monitoring and EIS- measurements every four hours are performed in the same way as for the long term test for the cell fuelled with Comp. 4a. The cell voltage monitoring as well as Nyquist plots and DRT spectra gained from the EIS measurements are shown in Figure 16. The voltage monitoring of the single cell is shown together with the mean temperature of the cell in Figure 16a. Shortly after the current density of 500 mA/cm2 is reached, the cell voltage increases without a rise in the temperature or a change in the current density. The highest voltage increase is observed within the first few minutes but the voltage increase slows down, reaching a peak voltage after around 10 h. The evaluation of the temperature distribution shows that the cell has reached a condition of equilibrium after approximately 10 h of operation under constant conditions. When the steady state was reached (after 10 h), a nearly constant voltage decrease is observed. Nyquist plots and DRT spectra are used to identify the cause of the voltage decrease. In Figure 16b, several Nyquist plots of the long-term test run and the Nyquist plot of the cell characterization measurement are shown. The Nyquist plot of the cell characterization measurement is obtained from an EIS measurement, which is carried out 20 min after reaching the operation point at 0.7 V and 512 mA/cm2. The cell characterization measurement shows a higher ohmic resistance and a lower polarization resistance than the Nyquist plot obtained from the long-term test run. The difference in the ohmic resistance is caused by the temperature difference of the cell, whereas the distinct difference of the polarization resistances might be a result of the transient response of the cell within the first operating hours. The DRT spectra of the respective Nyquist plots reveal a massive change in the losses related to gas diffusion, the relation between the losses and the DRT peaks is described in Section 4.2. The decreasing oxygen quantity at the cathode outlet leads to the assumption that oxygen starvation was observed. To avoid further damage of the cell due to oxygen starvation, the operating conditions are adapted by increasing the air flow at the cathode side. Since the outcome of the test is the suitability of the used fuel gas composition (anode side), this change is valid.
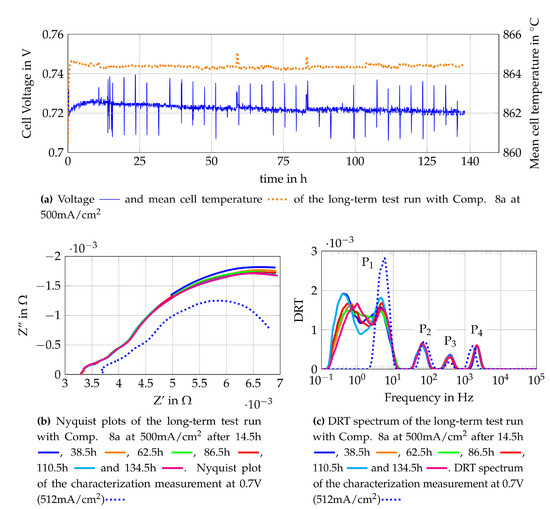
Figure 16.
Monitoring data of the single cell fuelled with Comp. 8a at 500 mA/cm2.
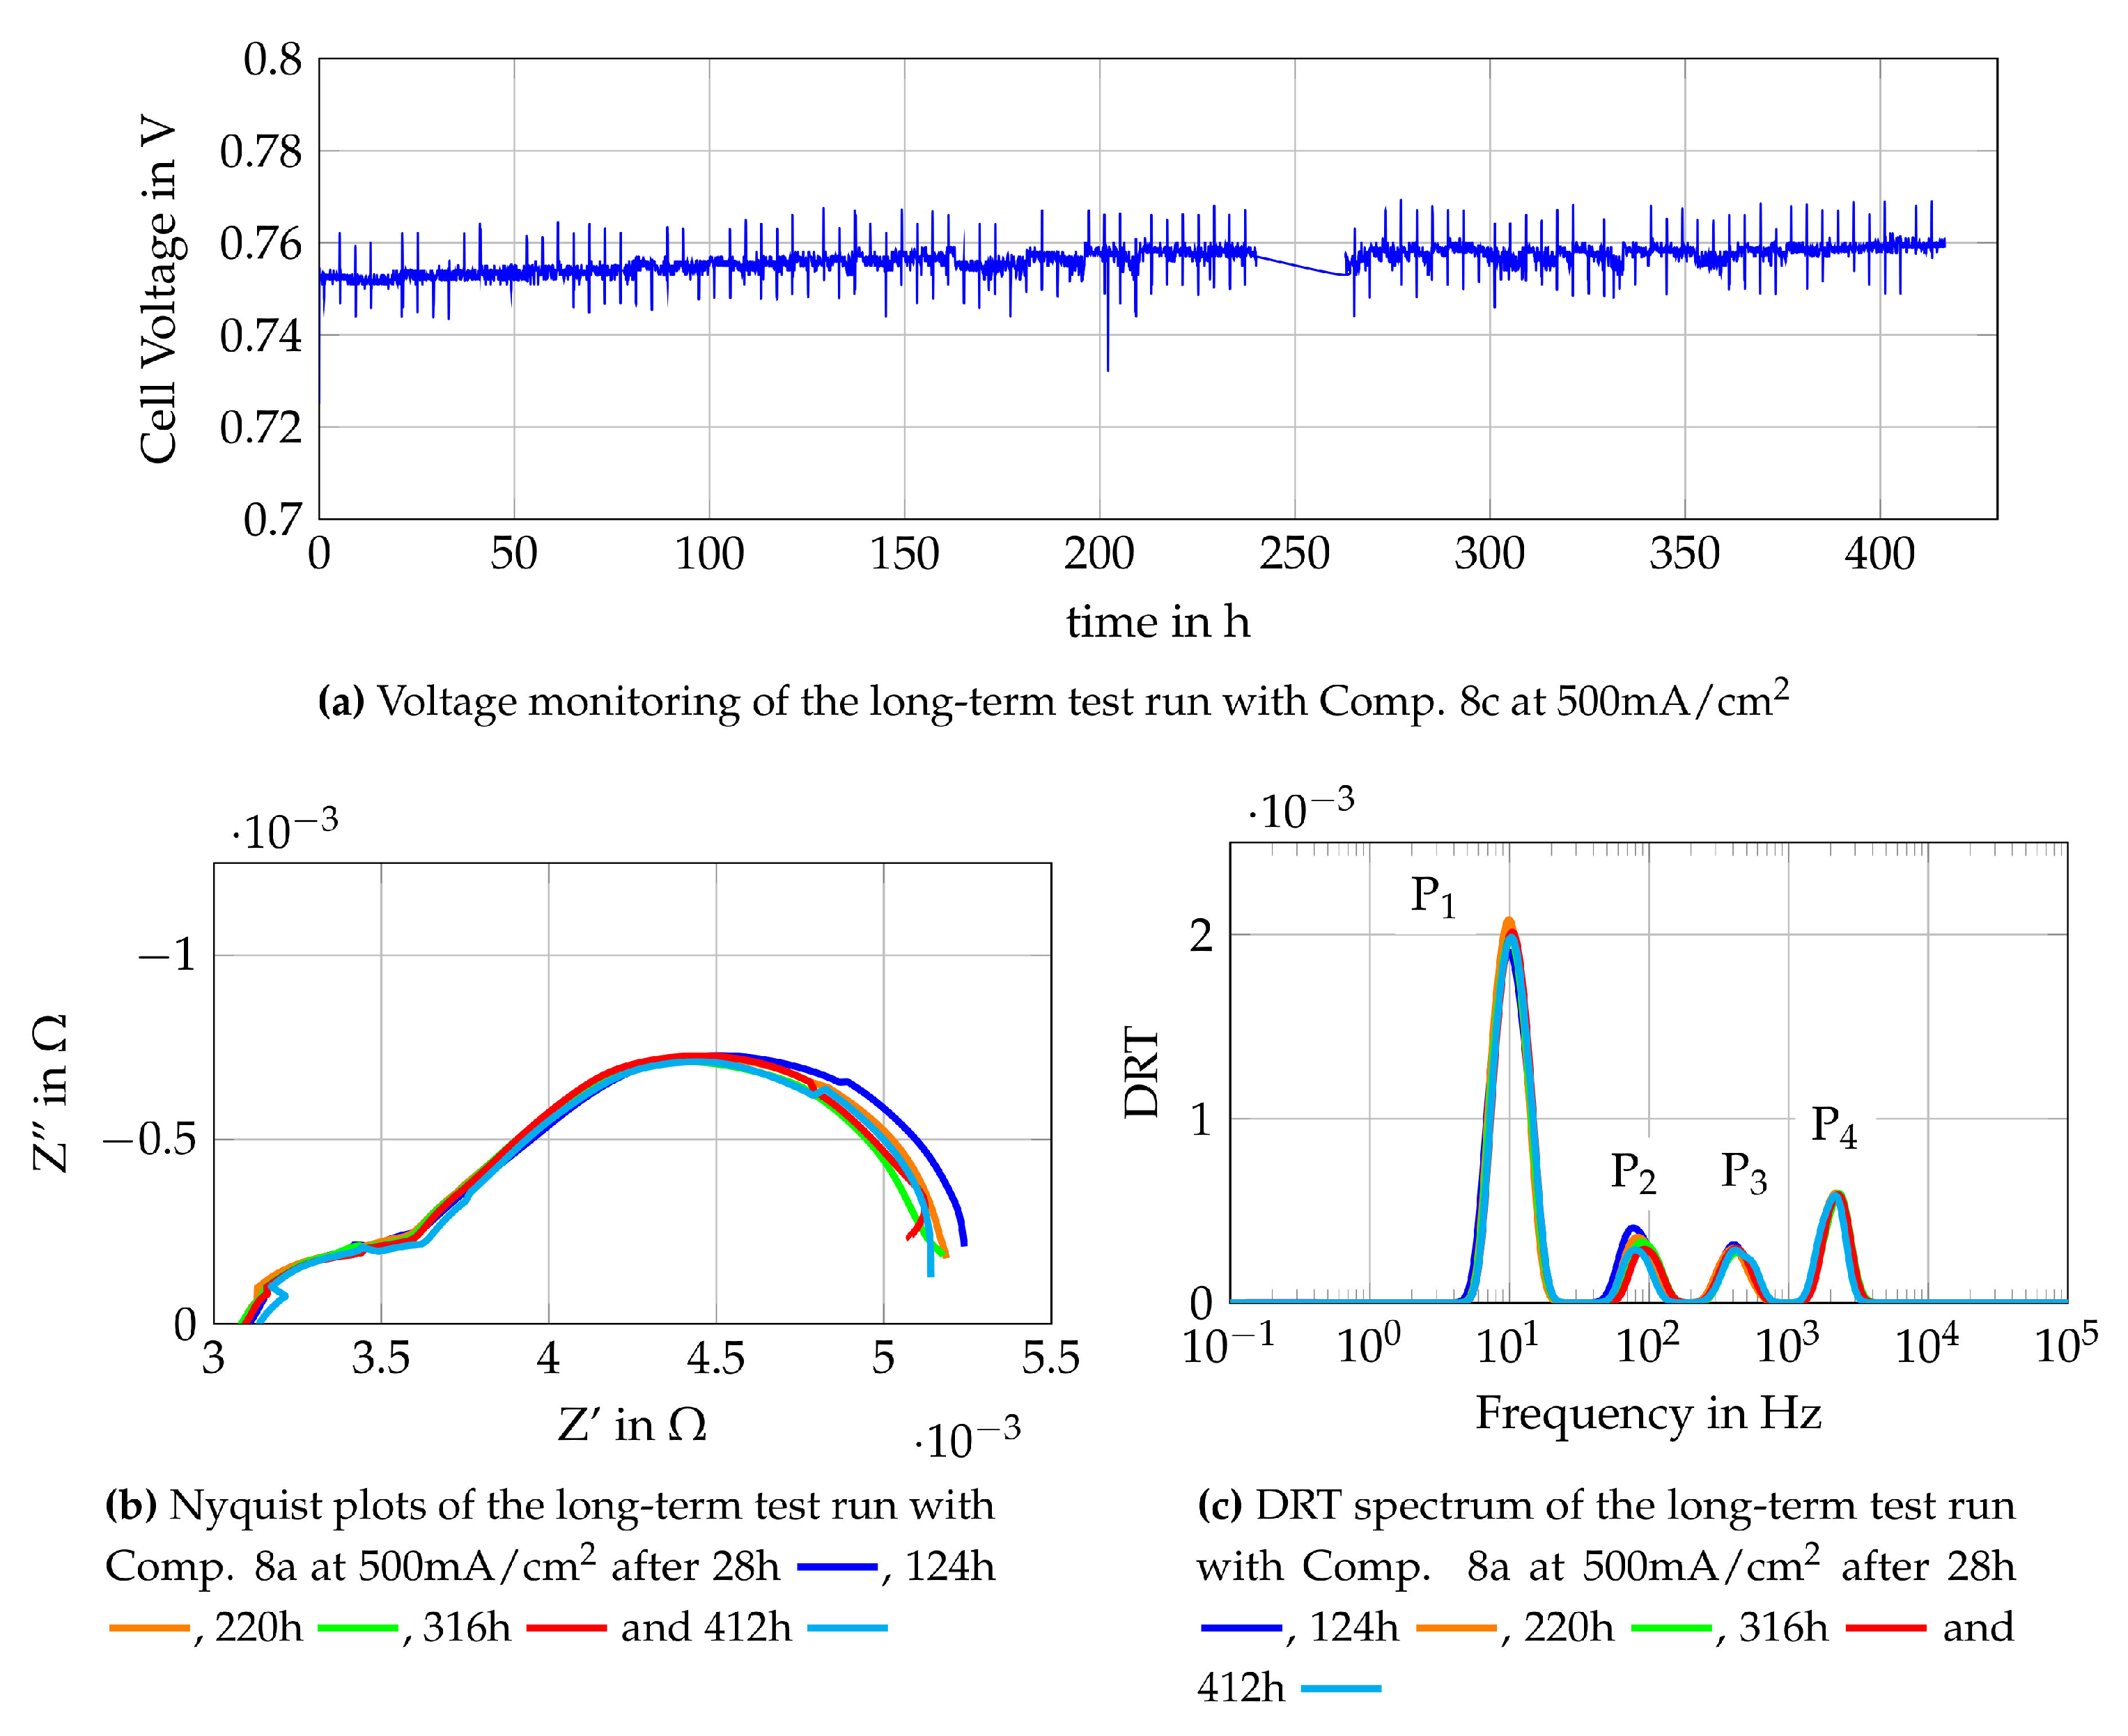
The new operating point (Comp. 8c) is shown in Table 4. As it can be seen, the only difference to Comp. 8a is the volume flow of air at the cathode side of the cell. The change from Comp. 8a to Comp. 8c is done without interrupting the test run or changing the current density. As an immediate reaction of the increased air flow, the cell voltage increases from about 0.72 V to around 0.75 V, as shown in Figure 17a. The monitoring of the cell voltage shows a further increase of the cell voltage while operating the cell with Comp. 8c. This might be caused by regeneration taking place at the cathode side of the cell, but further insights are again given by Nyquist plots and DRT spectra, as shown in Figure 17b,c. The Nyquist plots show a higher polarization resistance for the measurement after 28 h than for other EIS measurements. The measurement after 28 h follows a trend which is clearly visible within the first 40 h of the test with Comp 8c. This trend shows a decreasing polarization resistance along the operating time. Later EIS measurements do not show a clear tendency of a decreasing polarization resistance. The DRT spectra show the main influence in the lower medium frequency peak (P2 = 400 Hz–2000 Hz), which is related to processes at the LSCF cathode, as shown in Section 4.2. This leads to the assumption that regeneration processes of the LSCF cathode occur during the first 40 h of the test with Comp 8c. Later peaks of the DRT spectra do not show any changes along the operation time which indicates that the equilibrium state is reached and no LSCF-deactivation is observed at the fuel cell anode. Concluding, Comp. 8a is not suitable to operate the single as it is tested here due to the effect of oxygen starvation and therefore possible LSCF-degradation of the cathode. By adapting the air flow (Comp. 8c), a regeneration of the cathode side is observed and internal reforming can be used under described circumstances without strong degradation of the fuel cells anode.

Table 4.
Inlet gas compositions for the second long-term single cell tests.
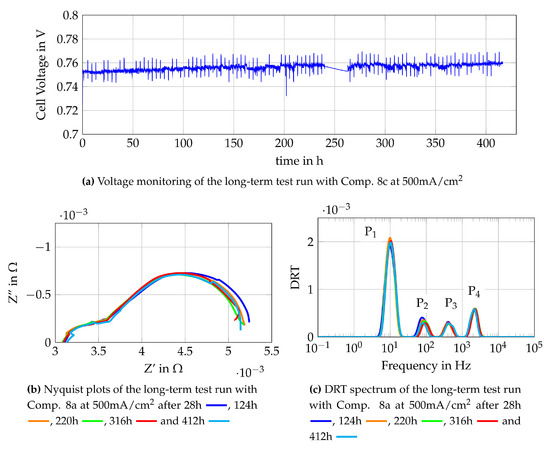
Figure 17.
Monitoring data of the single cell fuelled with Comp. 8c at 500 mA/cm2.
5. Conclusions and Outlook
A new design process for SOFC stand-alone systems is presented and tested in this paper. A system design with a focus on the fuel pre-treatment system is simulated in a thermodynamic point of view. The obtained gas compositions from the simulation are used to test auto-thermal reforming of methane. Furthermore, equilibrium calculations are conducted for fuel gas compositions obtained by the simulation. These are for use in studying the degradation mechanisms of the SOFC anode, such as solid carbon formation and nickel oxidation. Theoretical safe operating conditions are found for H2O/C of 0.6 for auto-thermal reformed methane and H2O/C above 1 for internally reformed methane. The auto-thermal reforming process is tested at a reformer test rig and several aspects of the simulation model such as the assumption of chemical equilibrium gas composition after the reformer are validated since test and calculation results are within a range of less than 3 vol%. The ESCs are characterized with six different gas compositions and two different methane flow rates obtained from auto-thermal reformed methane. Additionally, the cells are tested under internal reforming conditions with H2O/C = 1.0, 1.5, 2.0 and 2.5 and two different methane flow rates for each H2O/C. High current densities, up to 620 mA/cm2 are reached under internal reforming conditions. Two gas compositions (4a and 8c) are chosen to operate the single cell in a long term test run at 470 mA/cm2 and 500 mA/cm2. Within these two long-term test runs, no degradation or destructive mechanisms are observed and voltages of around 0.7 V and 0.75 V are held constant. In addition, the possibility of using impedance measurements for online monitoring was successfully tested, since no major measurement errors had occurred during the more than 100 measurements of each long-term test run. Furthermore, reference data for future online monitoring tools is gained for ESC operated with auto-thermal and internally reformed methane.
In our future work, the presented design process will be tested with different fuels and not only single cells but also with stacks. In addition, the design process will be further extended with combined testing of the reformer and SOFC and measured load profiles from greenhouses will be used.
Author Contributions
Conceptualization, M.H. and V.S.; methodology, M.H. and V.S.; software, B.K., G.N. and P.B.; formal analysis, M.H.; investigation, M.H., B.K., P.W. and G.N.; resources, V.S.; data curation, M.H.; writing—original draft preparation, M.H.; writing—review and editing, M.H. and V.S.; visualization, M.H.; supervision, C.H. and V.S.; project administration, C.H. and V.S.; funding acquisition, C.H. and V.S. All authors have read and agreed to the published version of the manuscript.
Funding
The authors gratefully acknowledge the funding of this project entitled “AGRO-SOFC” (Grant No. 872299) by The Austrian Research Promotion Agency (FFG).
Informed Consent Statement
Not applicable.
Data Availability Statement
Data available on request due to restrictions eg privacy or ethical The data presented in this study are available on request from the corresponding author. The data are not publicly available due to interests of the project AGRO-SOFC.
Acknowledgments
This project has been funded by partners of the ERA-Net SES 2018 joint call RegSys (www.eranet-smartenergysystems.eu) - a network of 30 national and regional RTD funding agencies of 23 European countries. As such, this project has received funding from the European Union’s Horizon 2020 research and innovation programme under grant agreement no. 775970.
Conflicts of Interest
The authors declare no conflict of interest.
Abbreviations
The following abbreviations are used in this manuscript:
| AC | Alternating current |
| AOGR | Anode off gas recycling |
| ATR | Auto-thermal reforming |
| Comp. | Composition |
| DC | Direct current |
| DRT | Distribution of relaxation times |
| EDX | Energy dispersive X-ray spectroscopy |
| EIS | Electrochemical impedance spectroscopy |
| ESC | Electrolyte supported cell |
| EU | European Union |
| GHSV | Gas hourly space velocity |
| H2O/C | Steam to carbon ratio |
| HPLC | high pressure liquid chromatography |
| ICE | Internal combustion engine |
| KK | Kramers-Kronig |
| LSCF | Lanthanum strontium cobalt ferrite |
| MFC | Mass flow controller |
| O2/C | Oxygen to carbon ratio |
| ScSZ | Scandia stabilized zirconium |
| SEM | Scanning electron microscopy |
| SOFC | Solid oxide fuel cell |
| TPB | Triple phase boundary |
| WGS | Water gas shift |
| YSZ | Yttrium stabilized zirconium |
References
- Eurostat. Technical report 2018. Available online: http://ec.europa.eu/eurostat/statisticsexplained/ (accessed on 25 November 2020).
- Göll, S.; Samsun, R.; Peters, R. Analysis and optimization of solid oxide fuel cell-based auxiliary power units using a generic zero-dimensional fuel cell model. J. Power Sources 2011, 196, 9500–9509. [Google Scholar] [CrossRef]
- Dong, S.; Yun, B.; Lee, D. Design and numerical study for l kW tubular SOFC APU system. ECS Trans. 2008, 12, 701–706. [Google Scholar] [CrossRef]
- Song, C. Fuel processing for low-temperature and high-temperature fuel cells: Challenges, and opportunities for sustainable development in the 21st century. Catal. Today 2002, 77, 17–49. [Google Scholar] [CrossRef]
- Stoeckl, B.; Subotić, V.; Preininger, M.; Schwaiger, M.; Evic, N.; Schroettner, H.; Hochenauer, C. Characterization and performance evaluation of ammonia as fuel for solid oxide fuel cells with Ni/YSZ anodes. Electrochim. Acta 2019, 298, 874–883. [Google Scholar] [CrossRef]
- Stoeckl, B.; Subotić, V.; Preininger, M.; Schroettner, H.; Hochenauer, C. SOFC operation with carbon oxides: Experimental analysis of performance and degradation. Electrochim. Acta 2018, 275, 256–264. [Google Scholar] [CrossRef]
- Schluckner, C.; Subotić, V.; Lawlor, V.; Hochenauer, C. Three-dimensional numerical and experimental investigation of an industrial-sized SOFC fueled by diesel reformat—Part I: Creation of a base model for further carbon deposition modeling. Int. J. Hydrog. Energy 2014, 39, 19102–19118. [Google Scholar] [CrossRef]
- Subotić, V.; Baldinelli, A.; Barelli, L.; Scharler, R.; Pongratz, G.; Hochenauer, C.; Anca-Couce, A. Applicability of the SOFC technology for coupling with biomass-gasifier systems: Short- and long-term experimental study on SOFC performance and degradation behaviour. Appl. Energy 2019, 256, 113904. [Google Scholar] [CrossRef]
- Pongratz, G.; Subotić, V.; Schroettner, H.; Stoeckl, B.; Hochenauer, C.; Anca-Couce, A.; Scharler, R. Investigation of solid oxide fuel cell operation with synthetic biomass gasification product gases as a basis for enhancing its performance. Biomass Convers. Biorefinery 2020. [Google Scholar] [CrossRef]
- Abdelkareem, M.A.; Tanveer, W.H.; Sayed, E.T.; Assad, M.E.H.; Allagui, A.; Cha, S.W. On the technical challenges affecting the performance of direct internal reforming biogas solid oxide fuel cells. Renew. Sustain. Energy Rev. 2019. [Google Scholar] [CrossRef]
- Subotić, V.; Schluckner, C.; Hochenauer, C. An experimental and numerical study of performance of large planar ESC-SOFCs and experimental investigation of carbon depositions. J. Energy Inst. 2016, 89, 121–137. [Google Scholar] [CrossRef]
- Hänggi, S.; Elbert, P.; Bütler, T.; Cabalzar, U.; Teske, S.; Bach, C.; Onder, C. A review of synthetic fuels for passenger vehicles. Energy Rep. 2019, 5, 555–569. [Google Scholar] [CrossRef]
- Pasel, J.; Samsun, R.C.; Meißner, J.; Tschauder, A.; Peters, R. Recent advances in diesel autothermal reformer design. Int. J. Hydrog. Energy 2019. [Google Scholar] [CrossRef]
- Yoon, S.; Lee, S.; Bae, J. Development of a self-sustaining kWe-class integrated diesel fuel processing system for solid oxide fuel cells. Int. J. Hydrog. Energy 2011, 36, 10302–10310. [Google Scholar] [CrossRef]
- Boon, J.; Van Dijk, E.; De Munck, S.; Van Den Brink, R. Steam reforming of commercial ultra-low sulphur diesel. J. Power Sources 2011. [Google Scholar] [CrossRef]
- Souza, A.E.; MacIel, L.J.; Cavalcanti-Filho, V.O.; Filho, N.M.; Abreu, C.A. Kinetic-operational mechanism to autothermal reforming of methane. Ind. Eng. Chem. Res. 2011, 50, 2585–2599. [Google Scholar] [CrossRef]
- Badmaev, S.; Akhmetov, N.; Belyaev, V.; Kulikov, A.; Pechenkin, A.; Potemkin, D.; Konishcheva, M.; Rogozhnikov, V.; Snytnikov, P.; Sobyanin, V. Syngas production via partial oxidation of dimethyl ether over Rh/Ce0.75Zr0.25O2 catalyst and its application for SOFC feeding. Int. J. Hydrog. Energy 2020. [Google Scholar] [CrossRef]
- Loukou, A.; Mendes, M.A.; Frenzel, I.; Pereira, J.M.; Ray, S.; Pereira, J.C.; Trimis, D. Experimental and numerical investigation of methane thermal partial oxidation in a small-scale porous media reformer. Int. J. Hydrog. Energy 2017, 42, 652–663. [Google Scholar] [CrossRef]
- Subotić, V.; Pofahl, S.; Lawlor, V.; Menzler, N.; Thaller, T.; Hochenauer, C. Online monitoring tools for SoH diagnostic and prognostic of remaining lifetime of reversible solid oxide cell (rSOC) systems. Energy Procedia 2019, 158, 2329–2334. [Google Scholar] [CrossRef]
- Zhang, H.; Liu, W.; Wang, Y.; Wang, J.; Yang, J.; Liang, T.; Yin, C.; Chi, B.; Jia, L.; Guan, W. Performance and long-term durability of direct-methane flat-tube solid oxide fuel cells with symmetric double-sided cathodes. Int. J. Hydrog. Energy 2019, 44, 28947–28957. [Google Scholar] [CrossRef]
- Trabold, T.; Lylak, J.; Walluk, M.; Lin, J.; Troiani, D. Measurement and analysis of carbon formation during diesel reforming for solid oxide fuel cells. Int. J. Hydrog. Energy 2012, 37, 5190–5201. [Google Scholar] [CrossRef]
- Kupecki, J.; Wierzbicki, M.; Jagielski, S.; Kluczowski, R.; Motylinski, K.; Skrzypkiewicz, M. Preliminary Long-Term Experimental Characterization of a Solid Oxide Fuel Cell Operated in DIR-SOFC Mode. ECS Trans. 2019, 91, 471–477. [Google Scholar] [CrossRef]
- Watanabe, H.; Okino, R.; Hanamura, K. Structural evolution of carbon deposition on a Ni/YSZ cermet of a SOFC analyzed by soft x-ray XANES spectroscopy. Int. J. Hydrog. Energy 2019, 44, 24028–24035. [Google Scholar] [CrossRef]
- Subotić, V.; Menzler, N.H.; Lawlor, V.; Fang, Q.; Pofahl, S.; Harter, P.; Schroettner, H.; Hochenauer, C. On the origin of degradation in fuel cells and its fast identification by applying unconventional online-monitoring tools. Appl. Energy 2020, 277, 115603. [Google Scholar] [CrossRef]
- Stoeckl, B.; Subotić, V.; Reichholf, D.; Schroettner, H.; Hochenauer, C. Extensive analysis of large planar SOFC: Operation with humidified methane and carbon monoxide to examine carbon deposition based degradation. Electrochim. Acta 2017, 256, 325–336. [Google Scholar] [CrossRef]
- Subotic, V.; Stoeckl, B.; Schluckner, C.; Pofahl, S.; Lawlor, V.; Schroettner, H.; Hochenauer, C. Development of cell-protecting methods for carbon-removal from porous Ni-YSZ anodes and regeneration of the cell performance. ECS Trans. 2017, 78, 2441–2449. [Google Scholar] [CrossRef]
- Girona, K.; Laurencin, J.; Fouletier, J.; Lefebvre-Joud, F. Carbon deposition in CH4/CO2 operated SOFC: Simulation and experimentation studies. J. Power Sources 2012, 210, 381–391. [Google Scholar] [CrossRef]
- Lee, Y.; Hanna, J.; Ghoniem, A.F. On the Predictions of Carbon Deposition on the Nickel Anode of a SOFC and Its Impact on Open-Circuit Conditions. J. Electrochem. Soc. 2013, 160, 94–105. [Google Scholar] [CrossRef]
- Subotić, V.; Harter, P.; Stoeckl, B.; Preininger, M.; Kusnezoff, M.; Lawlor, V.; Pofahl, S.; Napporn, T.; Megel, S.; Schroettner, H.; et al. Fast fuel variation and identification of SOFC system changes using online health monitoring tools and fault diagnosis. ECS Trans. 2019, 91, 753–759. [Google Scholar] [CrossRef]
- Haga, K.; Adachi, S.; Shiratori, Y.; Itoh, K.; Sasaki, K. Poisoning of SOFC anodes by various fuel impurities. Solid State Ionics 2008, 179, 1427–1431. [Google Scholar] [CrossRef]
- Sasaki, K.; Haga, K.; Yoshizumi, T.; Minematsu, D.; Yuki, E.; Liu, R.; Uryu, C.; Oshima, T.; Ogura, T.; Shiratori, Y.; et al. Chemical durability of Solid Oxide Fuel Cells: Influence of impurities on long-term performance. J. Power Sources 2011. [Google Scholar] [CrossRef]
- Sasaki, K.; Teraoka, Y. Equilibria in fuel cell gases. I. Equilibrium compositions and reforming conditions. J. Electrochem. Soc. 2003, 150. [Google Scholar] [CrossRef]
- Sasaki, K.; Teraoka, Y. Equilibria in Fuel Cell Gases II. The C-H-O Ternary Diagrams. J. Electrochem. Soc. 2003. [Google Scholar] [CrossRef]
- Liu, M.; Lanzini, A.; Halliop, W.; Cobas, V.R.; Verkooijen, A.H.; Aravind, P.V. Anode recirculation behavior of a solid oxide fuel cell system: A safety analysis and a performance optimization. Int. J. Hydrog. Energy 2013. [Google Scholar] [CrossRef]
- Neidhardt, J.; Henke, M.; Bessler, W.G. Kinetic Modeling of Nickel Oxidation in SOFC Anodes. ECS Trans. 2011, 35, 1621–1629. [Google Scholar] [CrossRef]
- Neidhardt, J.; Kee, R.; Bessler, W. Electrode reoxidation in solid-oxide cells: Detailed modeling of nickel oxide film growth. ECS Trans. 2013, 57, 2573–2582. [Google Scholar] [CrossRef]
- Neidhardt, J.P.; Bessler, W.G. Microkinetic Modeling of Nickel Oxidation in Solid Oxide Cells: Prediction of Safe Operating Conditions. Chemie-Ingenieur-Technik 2019, 91, 843–855. [Google Scholar] [CrossRef]
- Vaßen, R.; Simwonis, D.; Stöver, D. Modelling of the agglomeration of Ni-particles in anodes of solid oxide fuel cells. J. Mater. Sci. 2001, 36, 147–151. [Google Scholar] [CrossRef]
- Khan, M.S.; Lee, S.B.; Song, R.H.; Lee, J.W.; Lim, T.H.; Park, S.J. Fundamental mechanisms involved in the degradation of nickel-yttria stabilized zirconia (Ni-YSZ) anode during solid oxide fuel cells operation: A review. Ceram. Int. 2016. [Google Scholar] [CrossRef]
- Subotić, V.; Stoeckl, B.; Lawlor, V.; Strasser, J.; Schroettner, H.; Hochenauer, C. Towards a practical tool for online monitoring of solid oxide fuel cell operation: An experimental study and application of advanced data analysis approaches. Appl. Energy 2018. [Google Scholar] [CrossRef]
- Xia, J.; Wang, C.; Wang, X.; Bi, L.; Zhang, Y. A perspective on DRT applications for the analysis of solid oxide cell electrodes. Electrochim. Acta 2020, 349. [Google Scholar] [CrossRef]
- Drach, Z.; Hershkovitz, S.; Ferrero, D.; Leone, P.; Lanzini, A.; Santarelli, M.; Tsur, Y. Impedance spectroscopy analysis inspired by evolutionary programming as a diagnostic tool for SOEC and SOFC. Solid State Ionics 2016, 288, 307–310. [Google Scholar] [CrossRef]
- Sumi, H.; Shimada, H.; Yamaguchi, Y.; Yamaguchi, T.; Fujishiro, Y. Degradation evaluation by distribution of relaxation times analysis for microtubular solid oxide fuel cells. Electrochim. Acta 2020, 339. [Google Scholar] [CrossRef]
- Capa, A.; García, R.; Chen, D.; Rubiera, F.; Pevida, C.; Gil, M.V. On the effect of biogas composition on the H2 production by sorption enhanced steam reforming (SESR). Renew. Energy 2020, 160, 575–583. [Google Scholar] [CrossRef]
- STEAG EBSILON Services Steag Ebsilon Website. Available online: https://www.ebsilon.com/en/ (accessed on 28 August 2020).
- Schluckner, C.; Subotić, V.; Lawlor, V.; Hochenauer, C. Carbon Deposition Simulation in Porous SOFC Anodes: A Detailed Numerical Analysis of Major Carbon Precursors. J. Fuel Cell Sci. Technol. 2015, 136, 894–908. [Google Scholar] [CrossRef]
- Sorce, A.; Greco, A.; Magistri, L.; Costamagna, P. FDI oriented modeling of an experimental SOFC system, model validation and simulation of faulty states. Appl. Energy 2014, 136, 894–908. [Google Scholar] [CrossRef]
- Subotić, V.; Schluckner, C.; Mathe, J.; Rechberger, J.; Schroettner, H.; Hochenauer, C. Anode regeneration following carbon depositions in an industrial-sized anode supported solid oxide fuel cell operating on synthetic diesel reformate. J. Power Sources 2015, 295, 55–66. [Google Scholar] [CrossRef]
- HSC-Chemistry HSC Chemistry, Software for Process simulation, Reactions Equations, Heat and Material Balances, Heat Loss Calculator, Equilibrium Calculations, Electrochemical Cell Equilibriums, Eh-pH Diagrams – Pourbaix diagram, Tpp Diagrams – Stability diagrams, Mineralogy Iterations Website. Available online: http://www.hsc-chemistry.net/?gclid=Cj0KCQiAyJOBBhDCARIsAJG2h5fqRjff5sEBaTNC7lopY0ms_DCH9HR2sPQWYdSGehvF0Ncj9KP6-DMaAsQZEALw_wcB (accessed on 12 February 2021).
- Gordon, S.; McBride, B.J. Computer Program for Calculation of Complex Chemical Equilibrium; NASA: Washington, DC, USA, 1994. [Google Scholar]
- Walluk, M.R.; Lin, J.; Waller, M.G.; Smith, D.F.; Trabold, T.A. Diesel auto-thermal reforming for solid oxide fuel cell systems: Anode off-gas recycle simulation. Appl. Energy 2014, 130, 94–102. [Google Scholar] [CrossRef]
- Dietrich, R.U.; Oelze, J.; Lindermeir, A.; Spitta, C.; Steffen, M.; Küster, T.; Chen, S.; Schlitzberger, C.; Leithner, R. Efficiency gain of solid oxide fuel cell systems by using anode offgas recycle—Results for a small scale propane driven unit. J. Power Sources 2011, 196, 7152–7160. [Google Scholar] [CrossRef]
- Tsai, T.I.; Troskialina, L.; Majewski, A.; Steinberger-Wilckens, R. Methane internal reforming in solid oxide fuel cells with anode off-gas recirculation. Int. J. Hydrog. Energy 2016, 41, 553–561. [Google Scholar] [CrossRef]
- van Biert, L.; Visser, K.; Aravind, P.V. A comparison of steam reforming concepts in solid oxide fuel cell systems. Appl. Energy 2020, 264, 114748. [Google Scholar] [CrossRef]
- Herrmann, T.; Dillig, M.; Hauth, M.; Karl, J. Conversion of tars on solid oxide fuel cell anodes and its impact on voltages and current densities. Energy Sci. Eng. 2017, 5, 194–207. [Google Scholar] [CrossRef]
- Palma, V.; Ricca, A.; Ciambelli, P. Fuel cell feed system based on H<inf>2</inf> production by a compact multi-fuel catalytic ATR reactor. Int. J. Hydrog. Energy 2013, 38, 406–416. [Google Scholar] [CrossRef]
- Zazhigalov, S.; Rogozhnikov, V.; Snytnikov, P.; Potemkin, D.; Simonov, P.; Shilov, V.; Ruban, N.; Kulikov, A.; Zagoruiko, A.; Sobyanin, V. Simulation of diesel autothermal reforming over Rh/Ce0.75Zr0.25O2-δ-η-Al2O3/FeCrAl wire mesh honeycomb catalytic module. Chem. Eng. Process. Process. Intensif. 2020, 150, 107876. [Google Scholar] [CrossRef]
- C&CS GmbH. C&CS. Available online: https://www.candcs.eu/produkte.html (accessed on 18 January 2021).
- Voegtlin Instruments GmbH. red-y smart series–Thermal Mass Flow Meters and Controllers. Available online: https://www.voegtlin.com/en/mass-flow-meters-and-controllers-for-gases/red-y-smart-series/ (accessed on 15 January 2021).
- Carbolite Gero GmbH & Co. KG. Carbolite Gero: Laborofen & Industrieofen Hersteller. Available online: https://www.carbolite-gero.de/ (accessed on 18 January 2021).
- Automation Products GmbH. SCC-C Sample Gas Cooler. Technical Report. 2005. Available online: https://library.e.abb.com/public/05aafb9b8df8cafbc1257b0c005465de/42-23-55-01-EN.pdf (accessed on 8 January 2021).
- Automation Products GmbH, A. SCC-F Sample Gas Feed Unit. Technical Report. 2015. Available online: https://new.abb.com/products/measurement-products/analytical/continuous-gas-analyzers/continuous-gas-analyzers-sample-handling/scc-f (accessed on 8 January 2021).
- Automation Products GmbH, A. Advance Optima AO2000 Serie. Technical Report. 2009. Available online: https://library.e.abb.com/public/db3096bae2566231c1257b0c005468b9/10-24-120-01-EN.pdf (accessed on 8 January 2021).
- KERAFOL Keramische Folien GmbH & Co. KG. KeraCell III. Technical report. 2014. Available online: https://www.kerafol.com/_wpframe_custom/downloads/files/Datenblatt_KeraCell-III_EN___143620-17012020.pdf (accessed on 12 February 2021).
- Air Liquide. Technische Gase von Air Liquide in Österreich |. Available online: https://industrie.airliquide.at/ (accessed on 18 January 2021).
- Alup Kompressoren. ALUP Compressors Home—Air Compressors - Air treatment - ALUP Global. Available online: https://www.alup.com/en (accessed on 19 January 2021).
- KNAUER Wissenschaftliche Geräte GmbH. HPLC pump 10 ml/min ceramic pump head. Available online: https://www.knauer.net/de/kompakte-hplc-pumpe-ohne-drucksensor-mit-10-mlmin-keramik-pumpenkopf/p20457 (accessed on 18 January 2021).
- ABB Automation Products GmbH. ABB MAGNOS 206 OXYGEN ANALYZE. Available online: https://new.abb.com/products/A12016/magnos-206-oxygen-analyze (accessed on 18 January 2021).
- Automation GmbH. SCC-S Sample Gas Feed Unit. Technical Report. 2011. Available online: https://library.e.abb.com/public/cbea14befa392a39c125792c0034be9d/42-23-59-01-EN.pdf (accessed on 8 January 2021).
- RIGOL Technologies Inc. DL3000 Precision DC Electronic Loads | RIGOL. Available online: https://www.rigolna.com/products/dc-power-loads/dl3000/ (accessed on 18 January 2021).
- ITECH LTD., I.E.C. Wide range high power DC power supply | IT6500-Welcome to ITECH. Available online: http://www.itech.sh/en/product/dc-power-supply/IT6500.html (accessed on 18 January 2021).
- Subotić, V.; Königshofer, B.; Juričić, Đ.; Kusnezoff, M.; Schröttner, H.; Hochenauer, C.; Boškoski, P. Detailed insight into processes of reversible solid oxide cells and stacks using DRT analysis. Energy Convers. Manag. 2020, 226, 113509. [Google Scholar] [CrossRef]
- Pasel, J.; Samsun, R.C.; Peters, R.; Thiele, B.; Stolten, D. Long-term stability at fuel processing of diesel and kerosene. Int. J. Hydrog. Energy 2014, 39, 18027–18036. [Google Scholar] [CrossRef]
- Hofmann, P.; Panopoulos, K.D.; Fryda, L.E.; Schweiger, A.; Ouweltjes, J.P.; Karl, J. Integrating biomass gasification with solid oxide fuel cells: Effect of real product gas tars, fluctuations and particulates on Ni-GDC anode. Int. J. Hydrog. Energy 2008, 33, 2834–2844. [Google Scholar] [CrossRef]
- Sumi, H.; Yamaguchi, T.; Hamamoto, K.; Suzuki, T.; Fujishiro, Y.; Matsui, T.; Eguchi, K. AC impedance characteristics for anode-supported microtubular solid oxide fuel cells. Electrochim. Acta 2012, 67, 159–165. [Google Scholar] [CrossRef]
- Sonn, V.; Leonide, A.; Ivers-Tiffée, E. Combined Deconvolution and CNLS Fitting Approach Applied on the Impedance Response of Technical Ni/8YSZ Cermet Electrodes. J. Electrochem. Soc. 2008, 155, B675. [Google Scholar] [CrossRef]
- Yan, J.; Chen, H.; Dogdibegovic, E.; Stevenson, J.W.; Cheng, M.; Zhou, X.D. High-efficiency intermediate temperature solid oxide electrolyzer cells for the conversion of carbon dioxide to fuels. J. Power Sources 2014, 252, 79–84. [Google Scholar] [CrossRef]
- DiGiuseppe, G.; Thompson, D.; Gumeci, C.; Hussain, A.M.; Dale, N. Distribution of relaxation times analysis and interfacial effects of LSCF fired at different temperatures. Int. J. Hydrog. Energy 2019, 44, 27067–27078. [Google Scholar] [CrossRef]
- Wang, G.; Zhang, Y.; Han, M. Densification of Ce0.9 Gd0.1O2-δ interlayer to improve the stability of La0.6Sr0.4Co0.2Fe0.8 O3-δ/Ce0.9 Gd0.1O2-δ interface and SOFC. J. Electroanal. Chem. 2020, 857. [Google Scholar] [CrossRef]
- Lyu, Z.; Shi, W.; Han, M. Electrochemical characteristics and carbon tolerance of solid oxide fuel cells with direct internal dry reforming of methane. Appl. Energy 2018, 228, 556–567. [Google Scholar] [CrossRef]
- Kromp, A.; Leonide, A.; Weber, A.; Ivers-Tiffée, E. Hydrogen-Oxidation Kinetics in Reformate-Fuelled Anode Supported SOFC. ECS Trans. 2011, 35, 665–678. [Google Scholar] [CrossRef]
Publisher’s Note: MDPI stays neutral with regard to jurisdictional claims in published maps and institutional affiliations. |
© 2021 by the authors. Licensee MDPI, Basel, Switzerland. This article is an open access article distributed under the terms and conditions of the Creative Commons Attribution (CC BY) license (http://creativecommons.org/licenses/by/4.0/).

