
A Study on Lap Joint Welding of Thin Plate ASTM F1684 Using Fiber Laser Welding


 and
and
Abstract
1. Introduction
2. Materials and Methods
3. Results
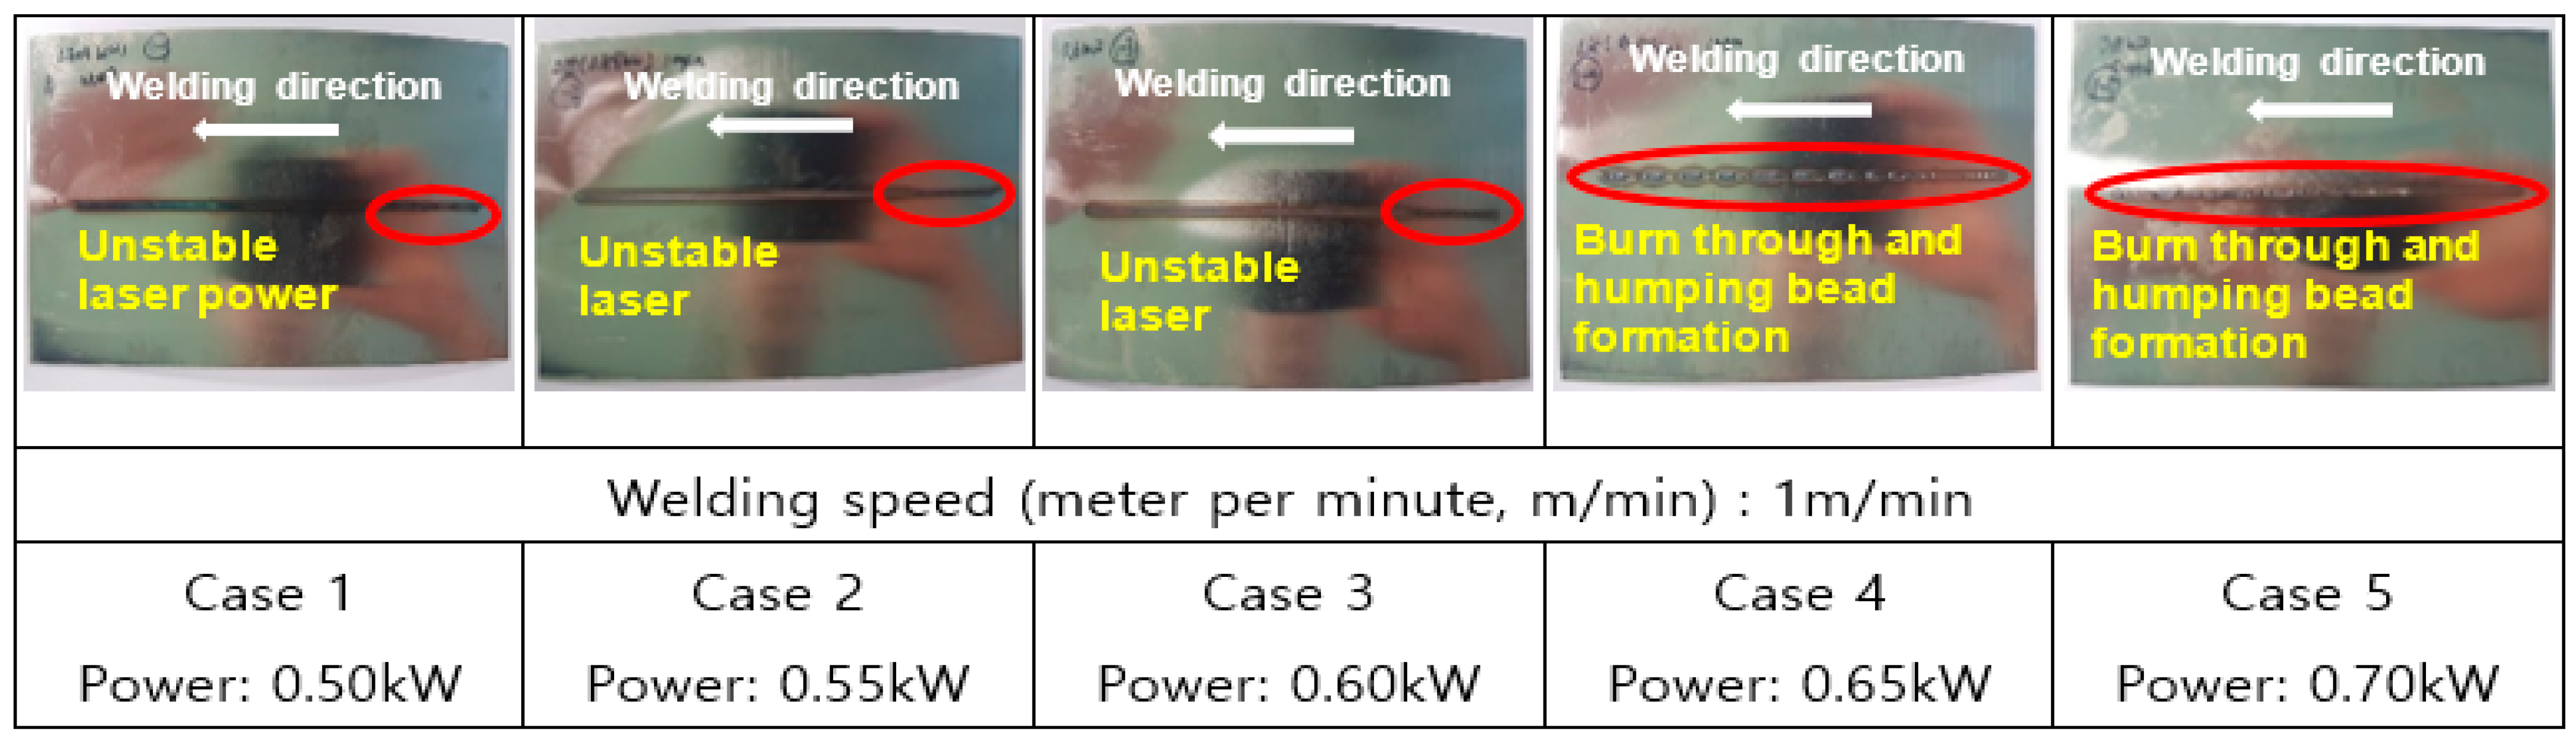
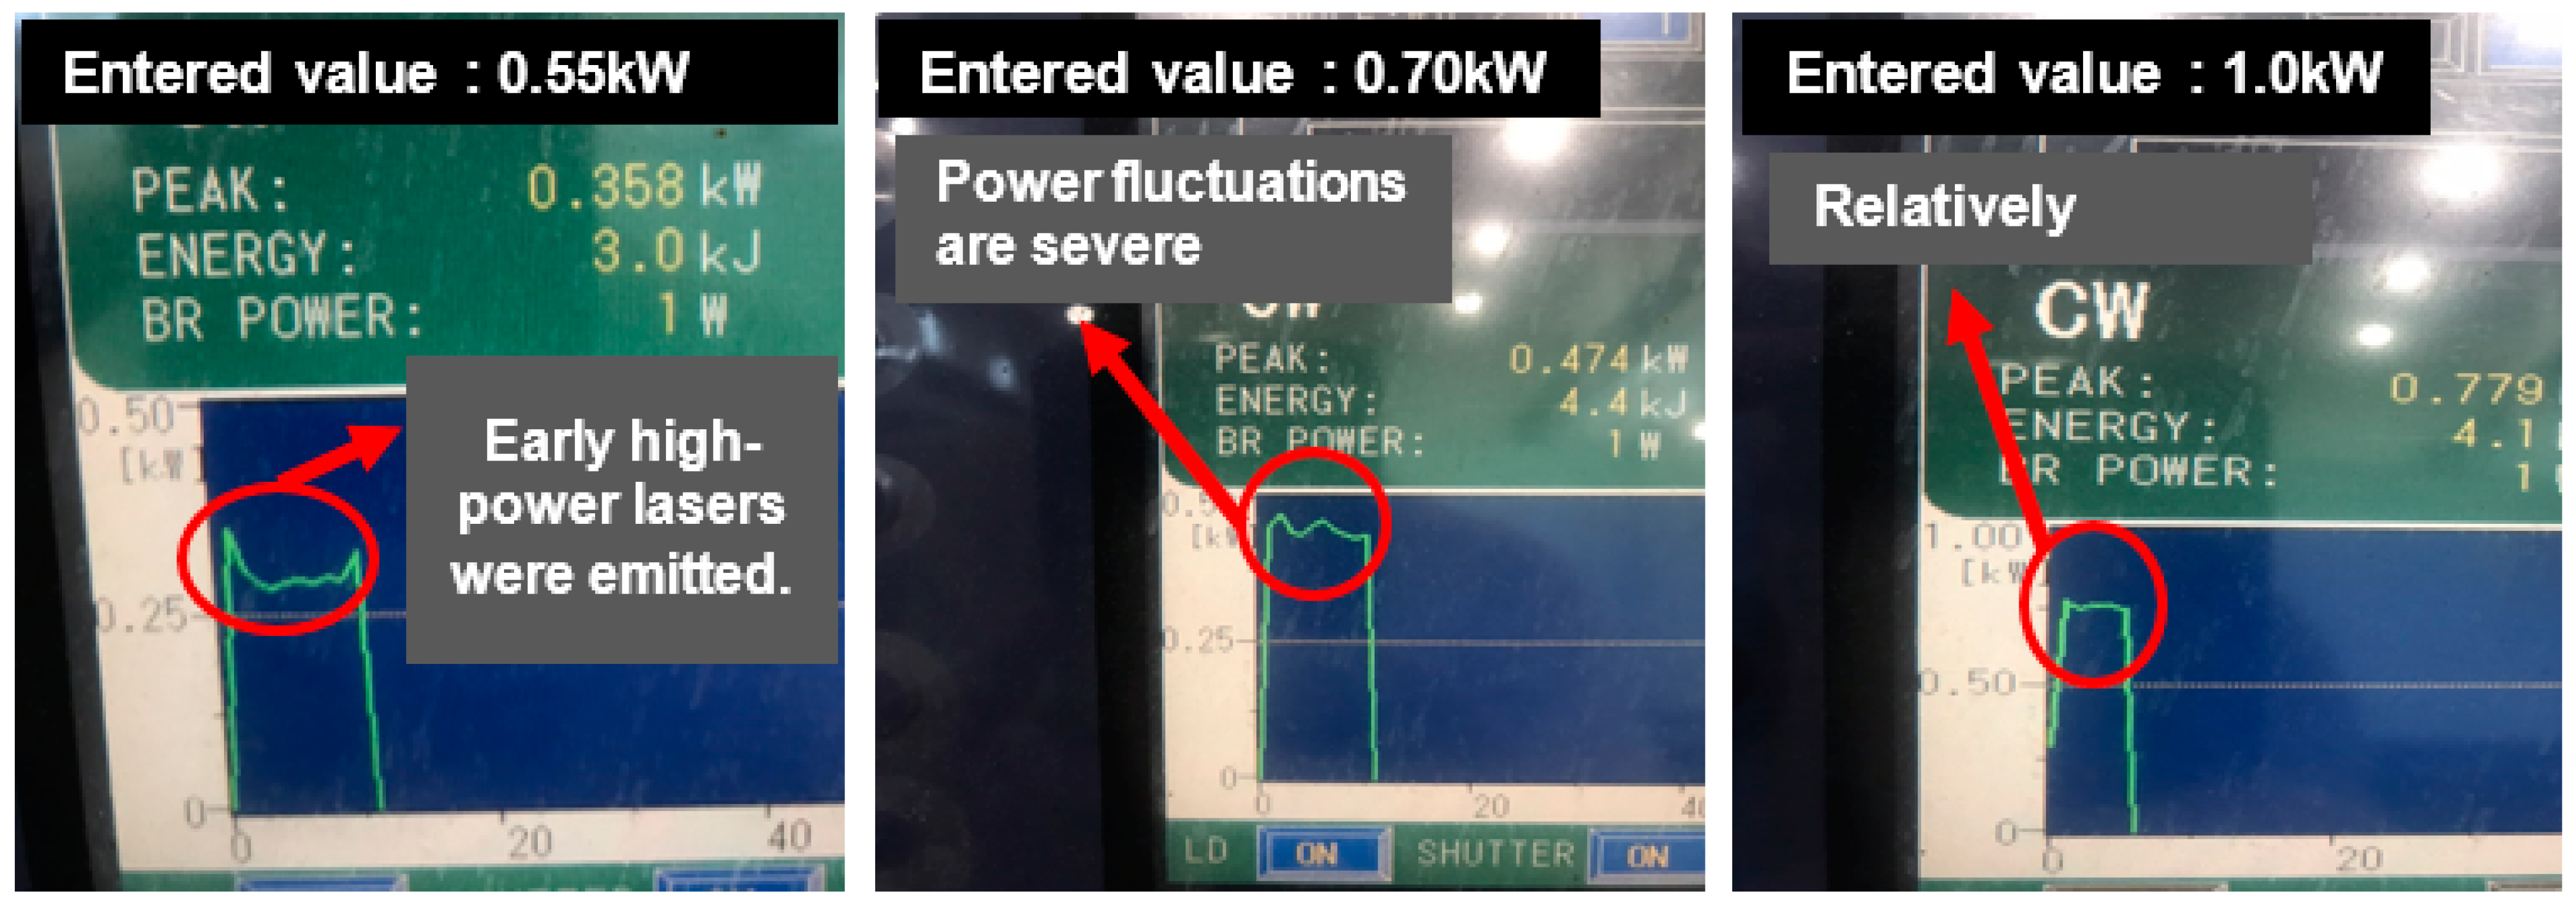
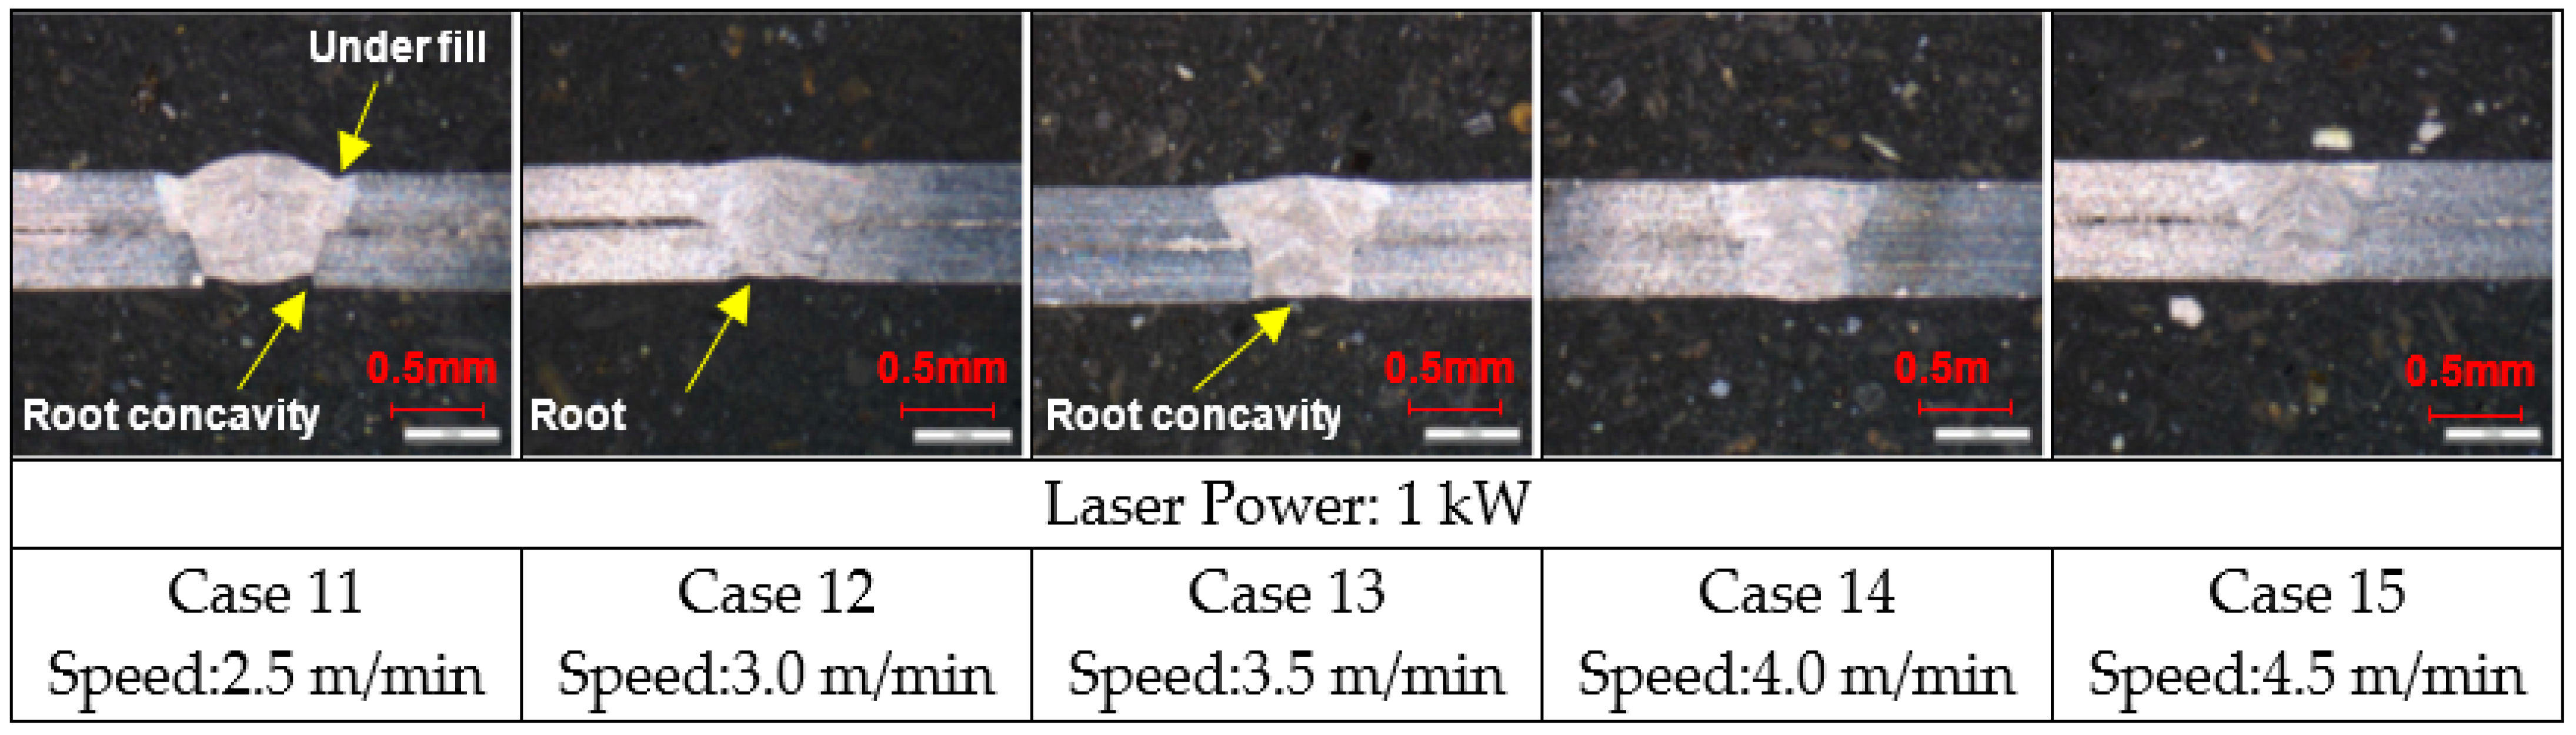
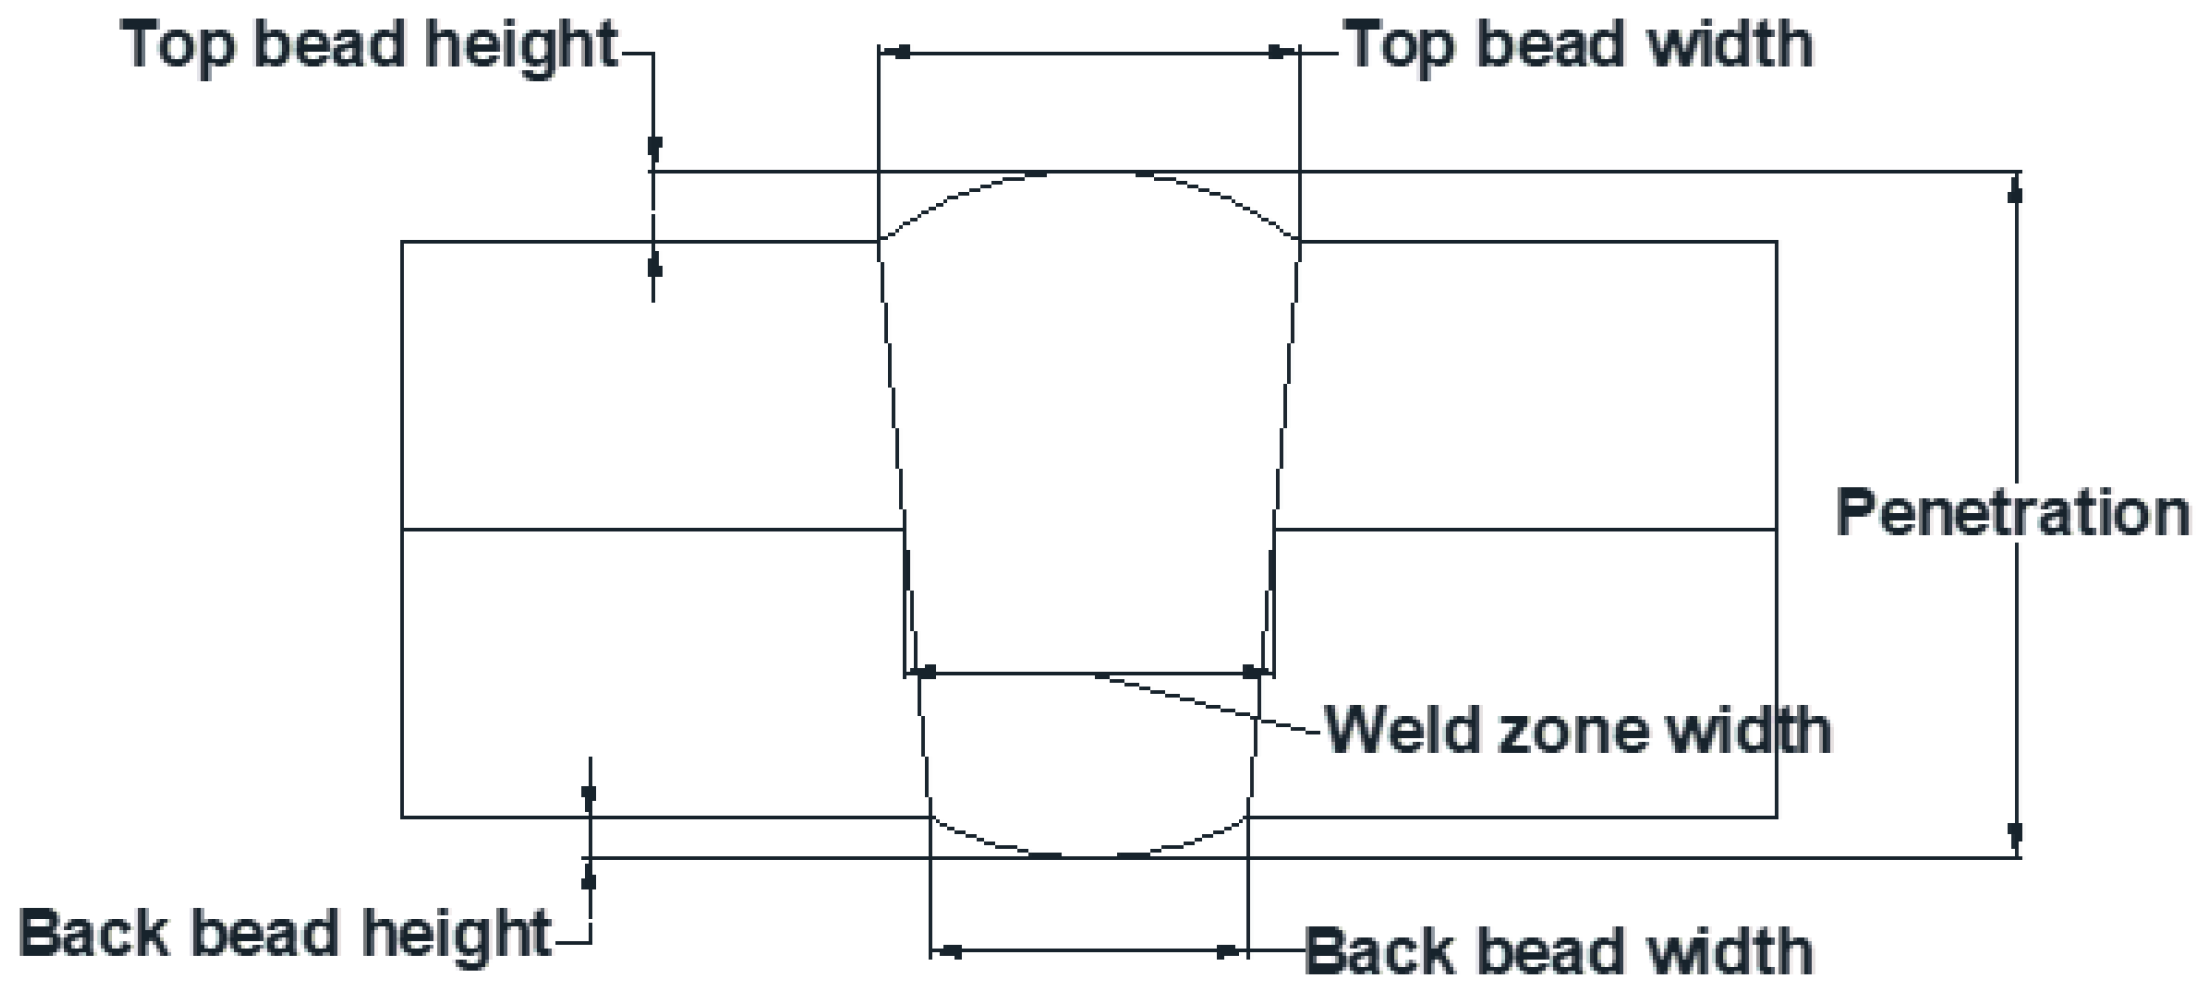
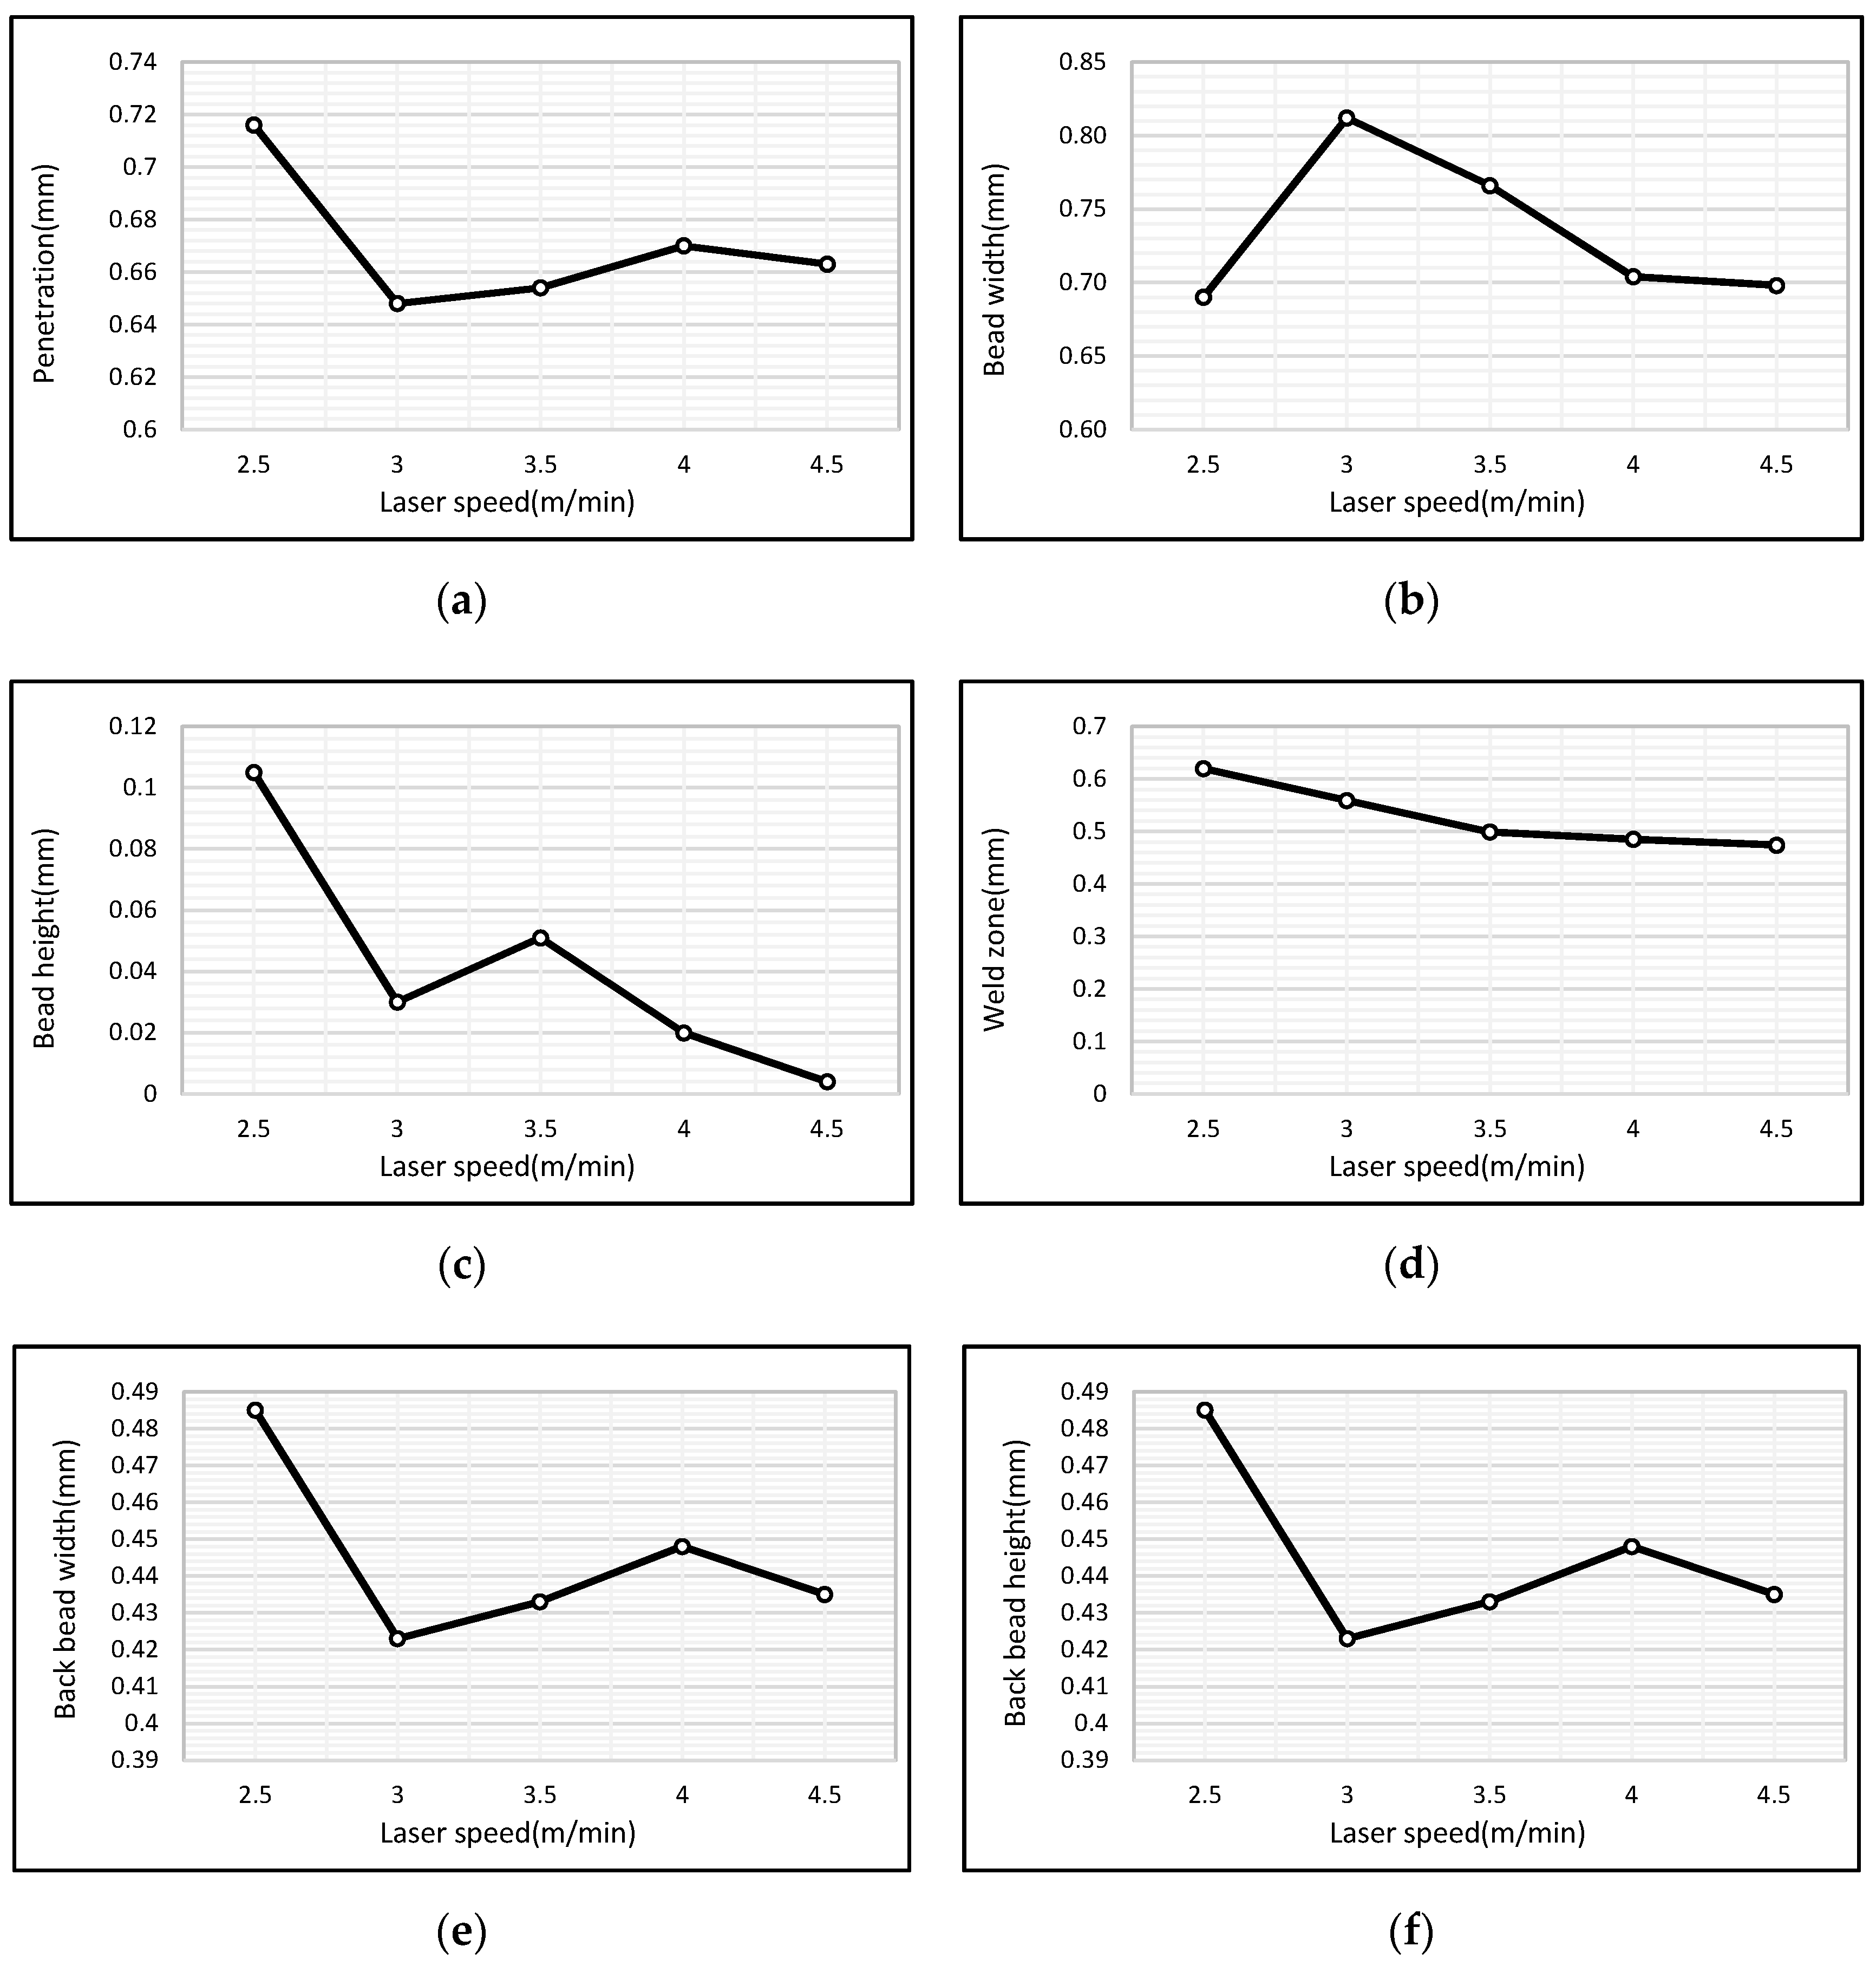
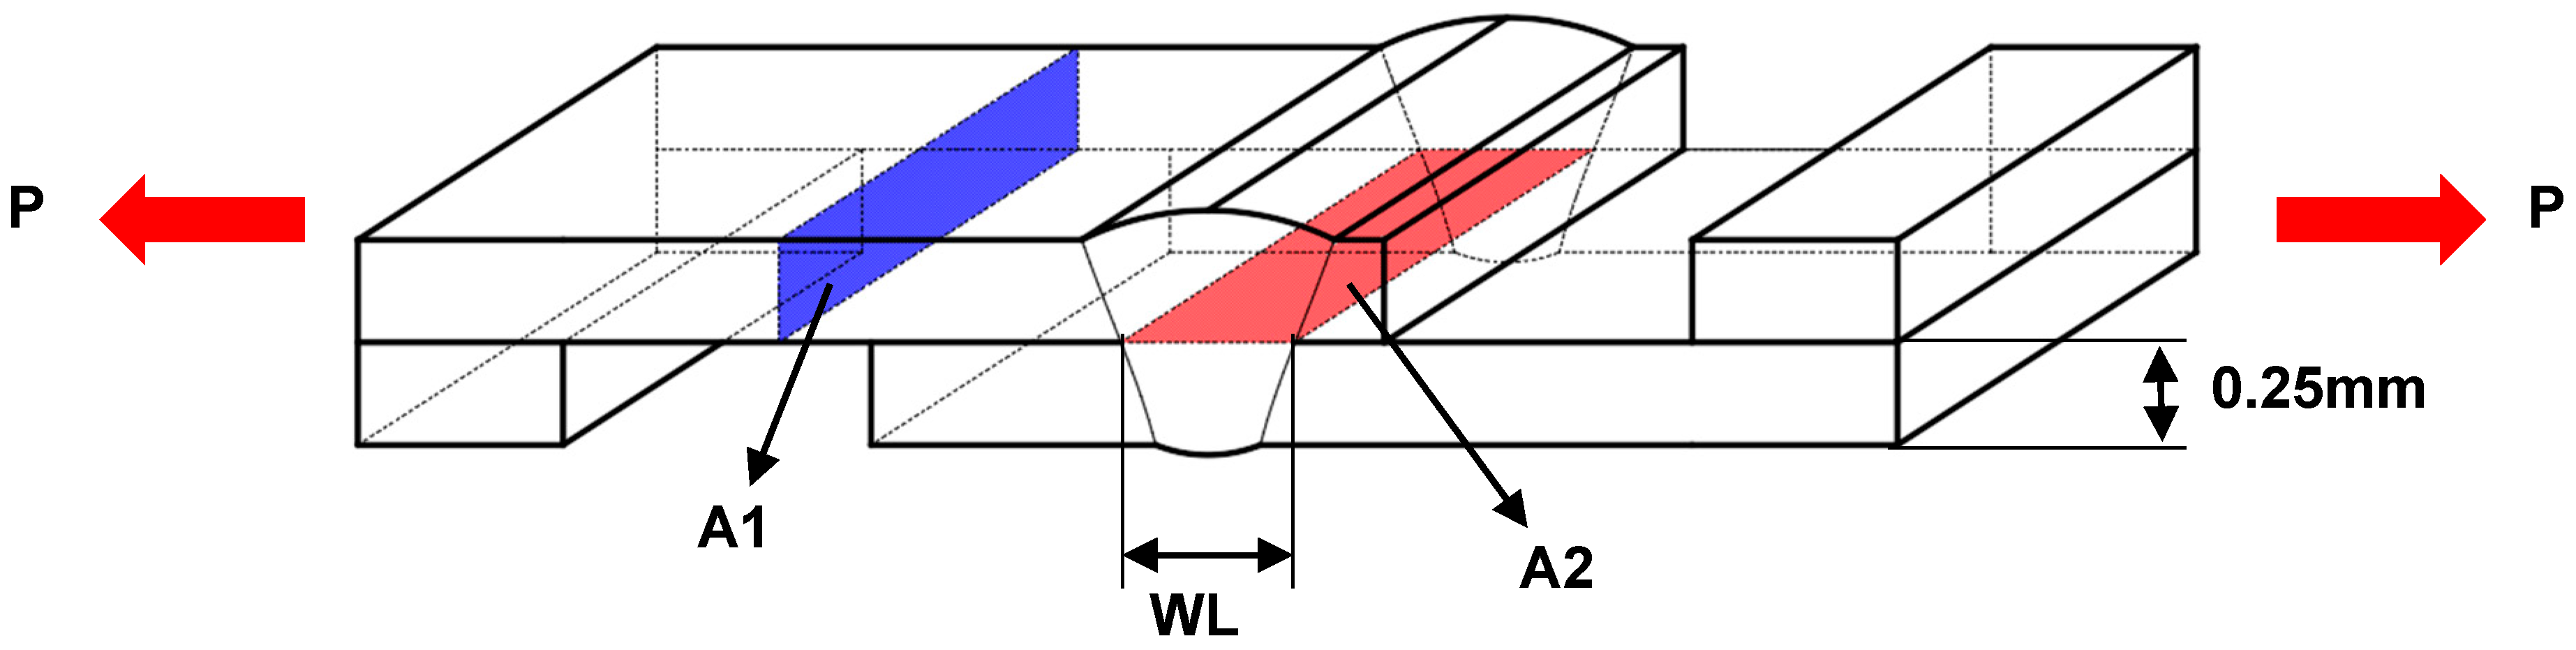
3.1. Analysis of Cross-Section Observation Results
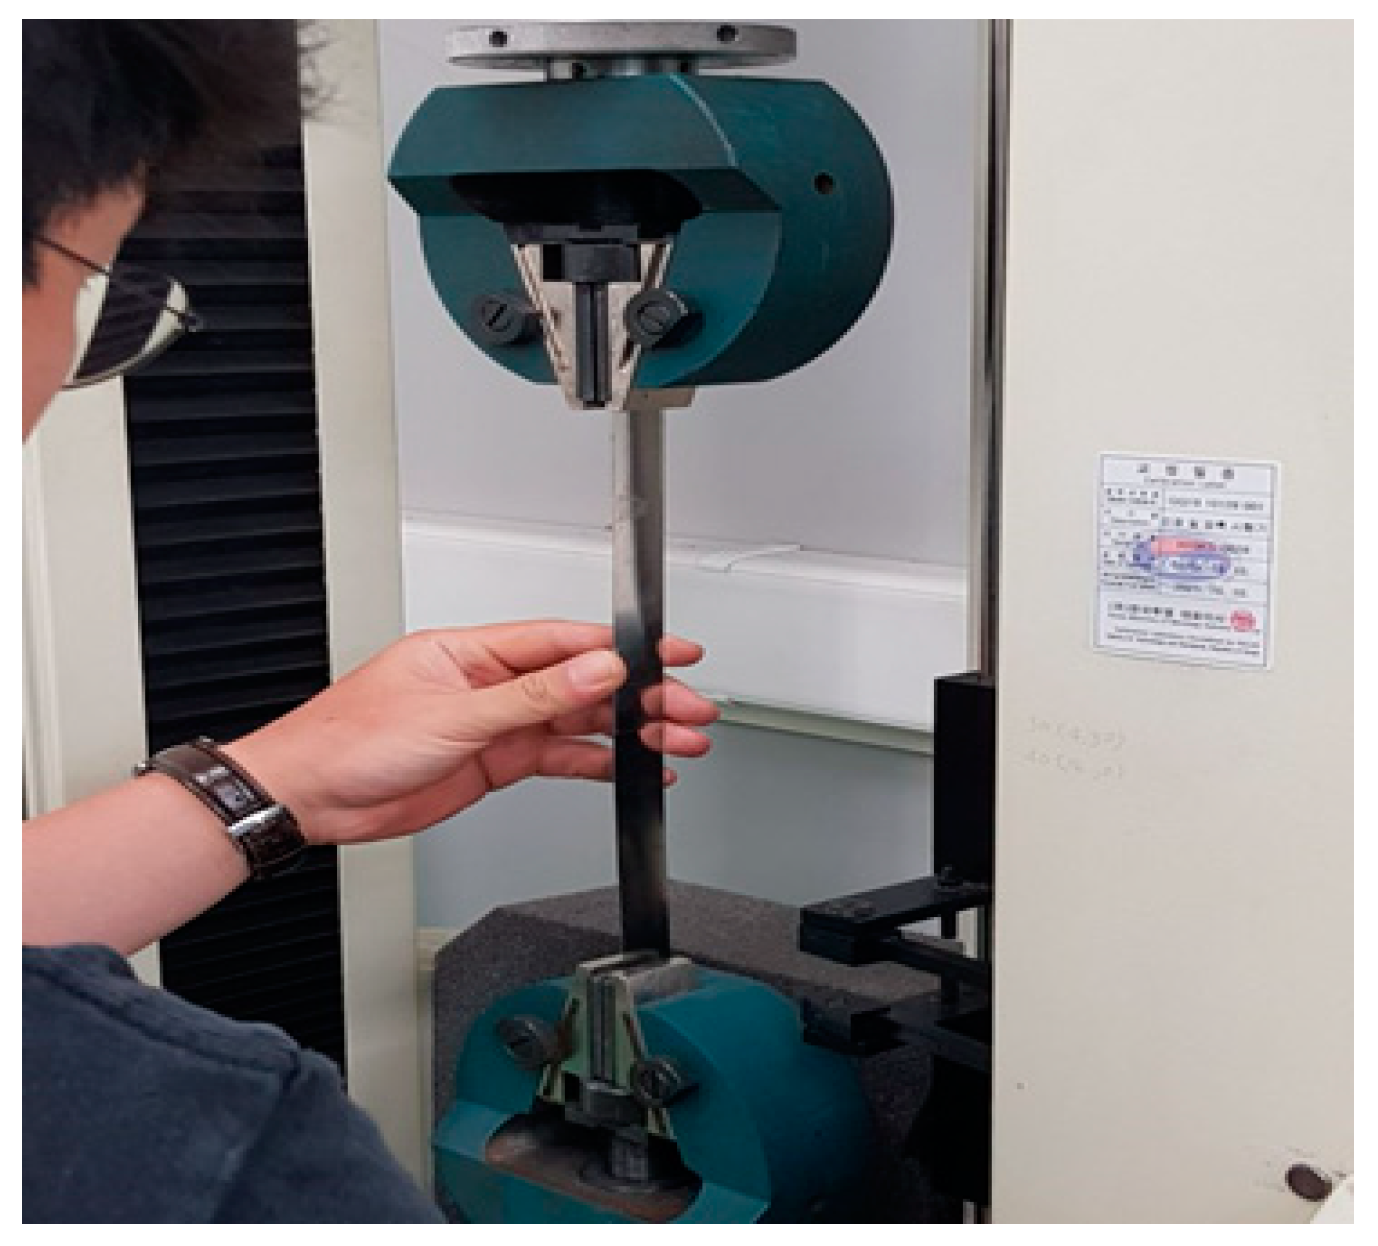
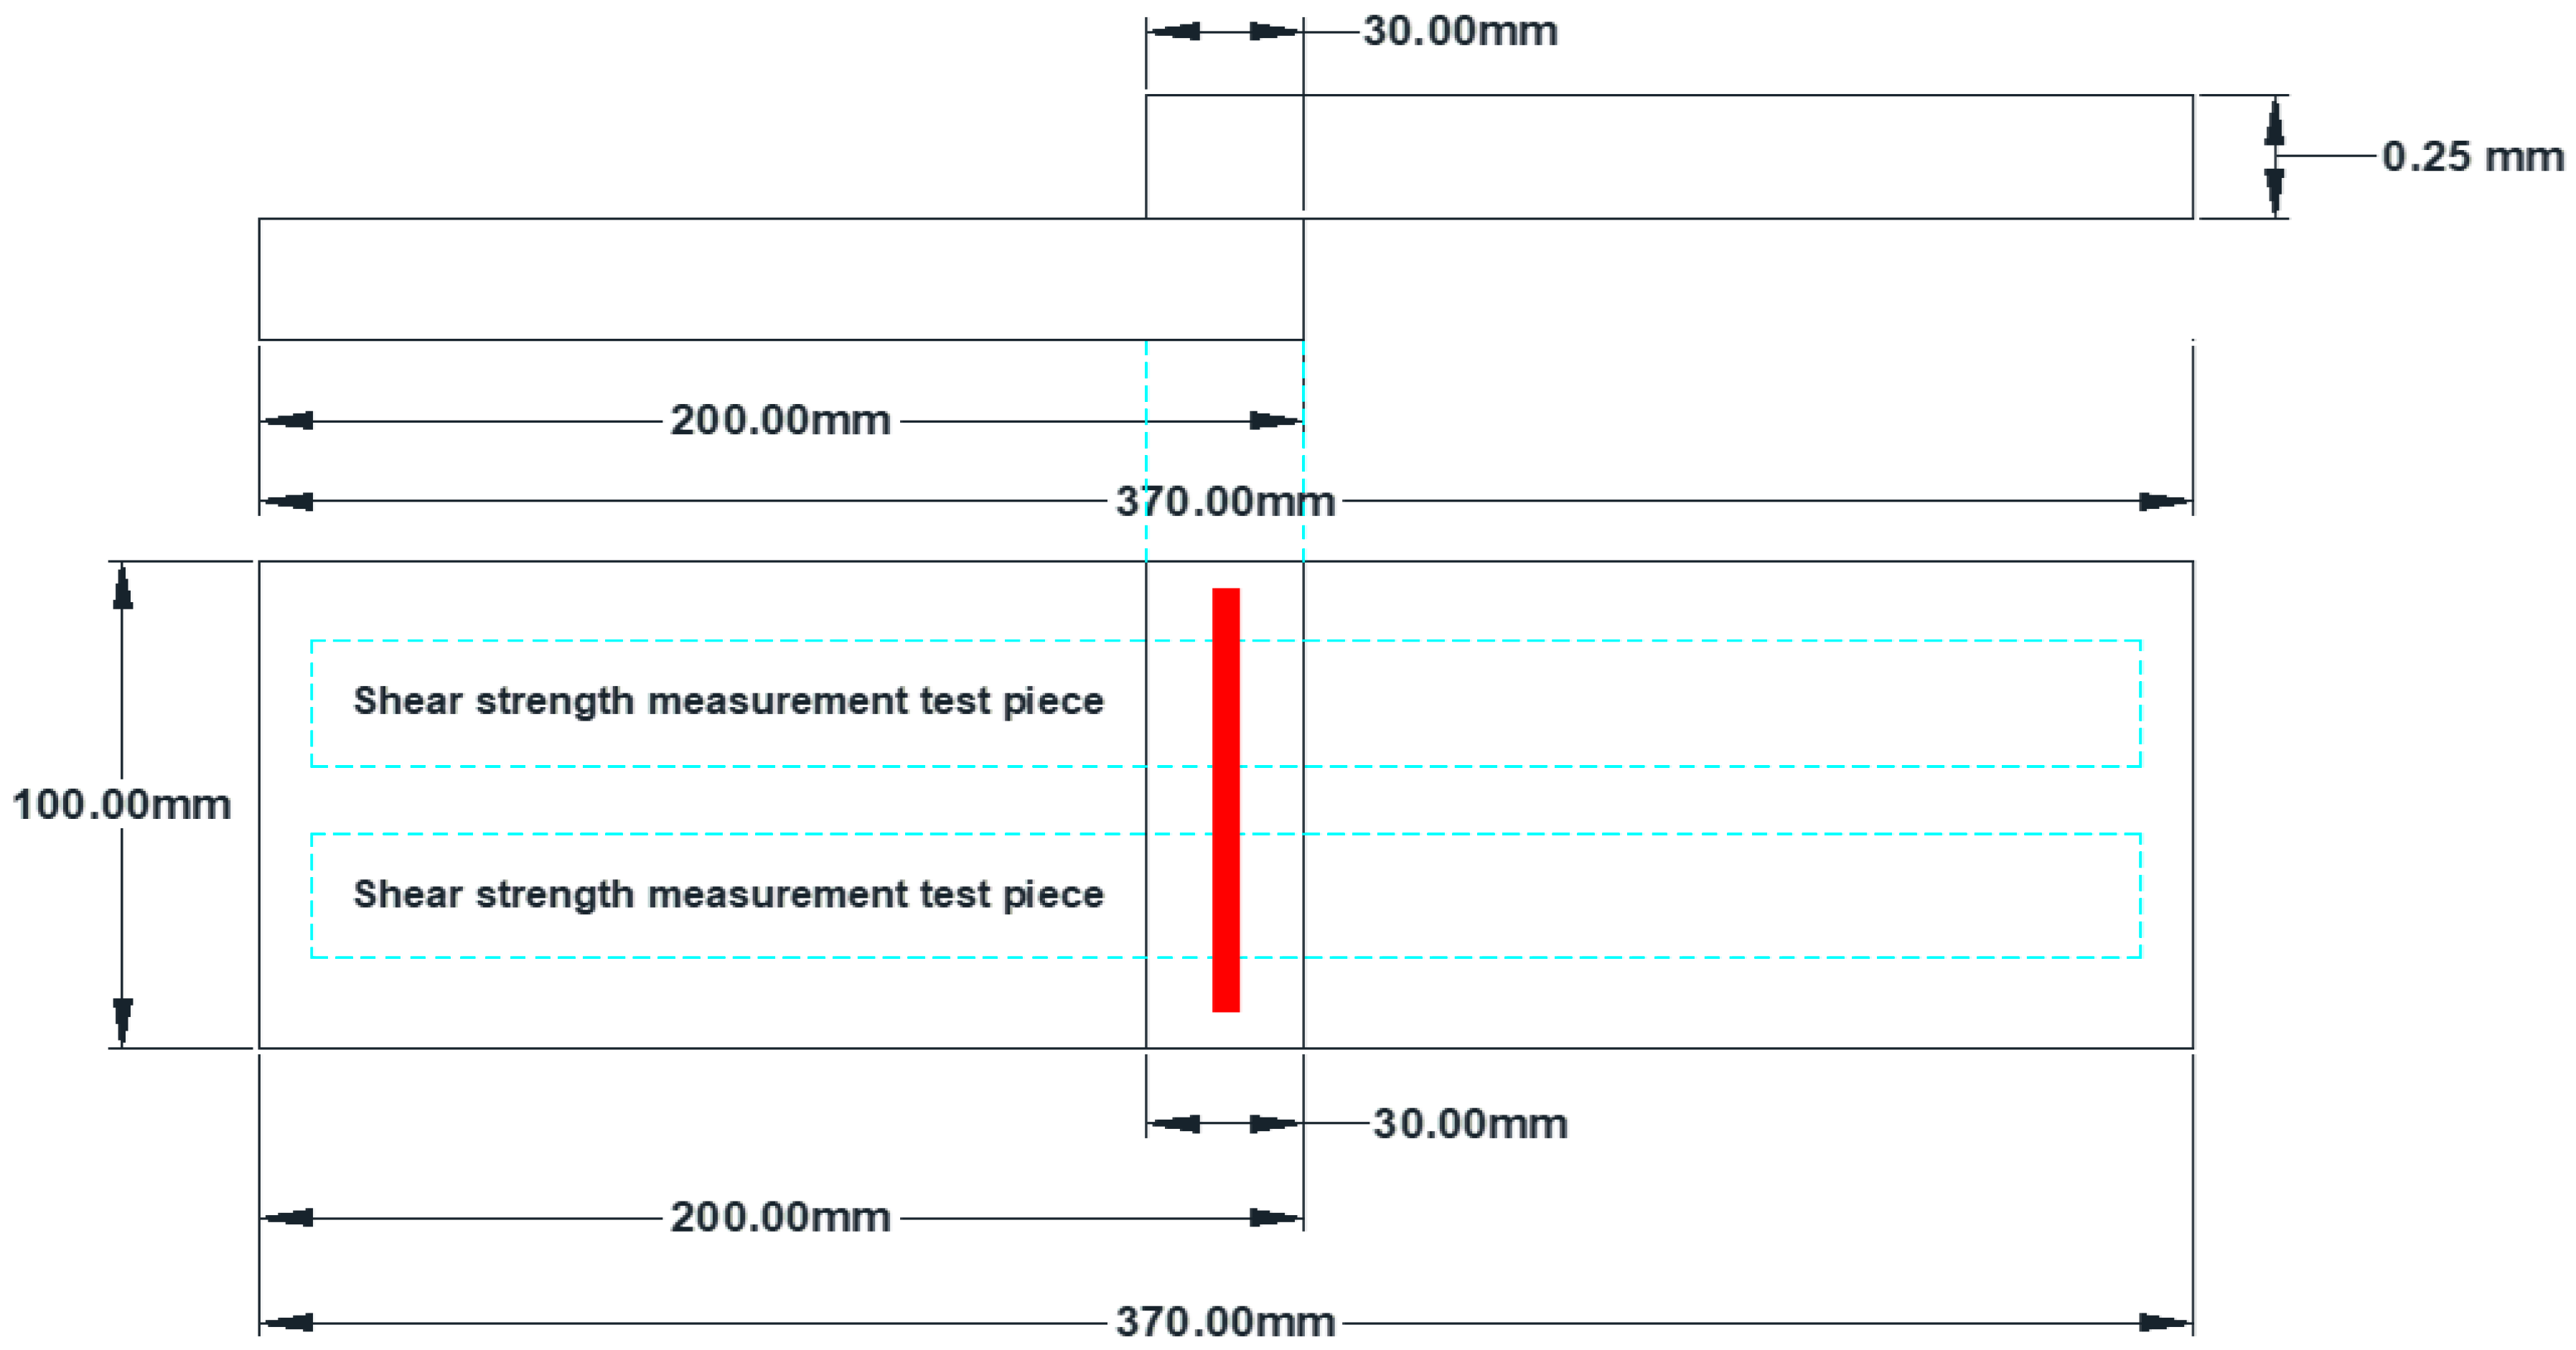
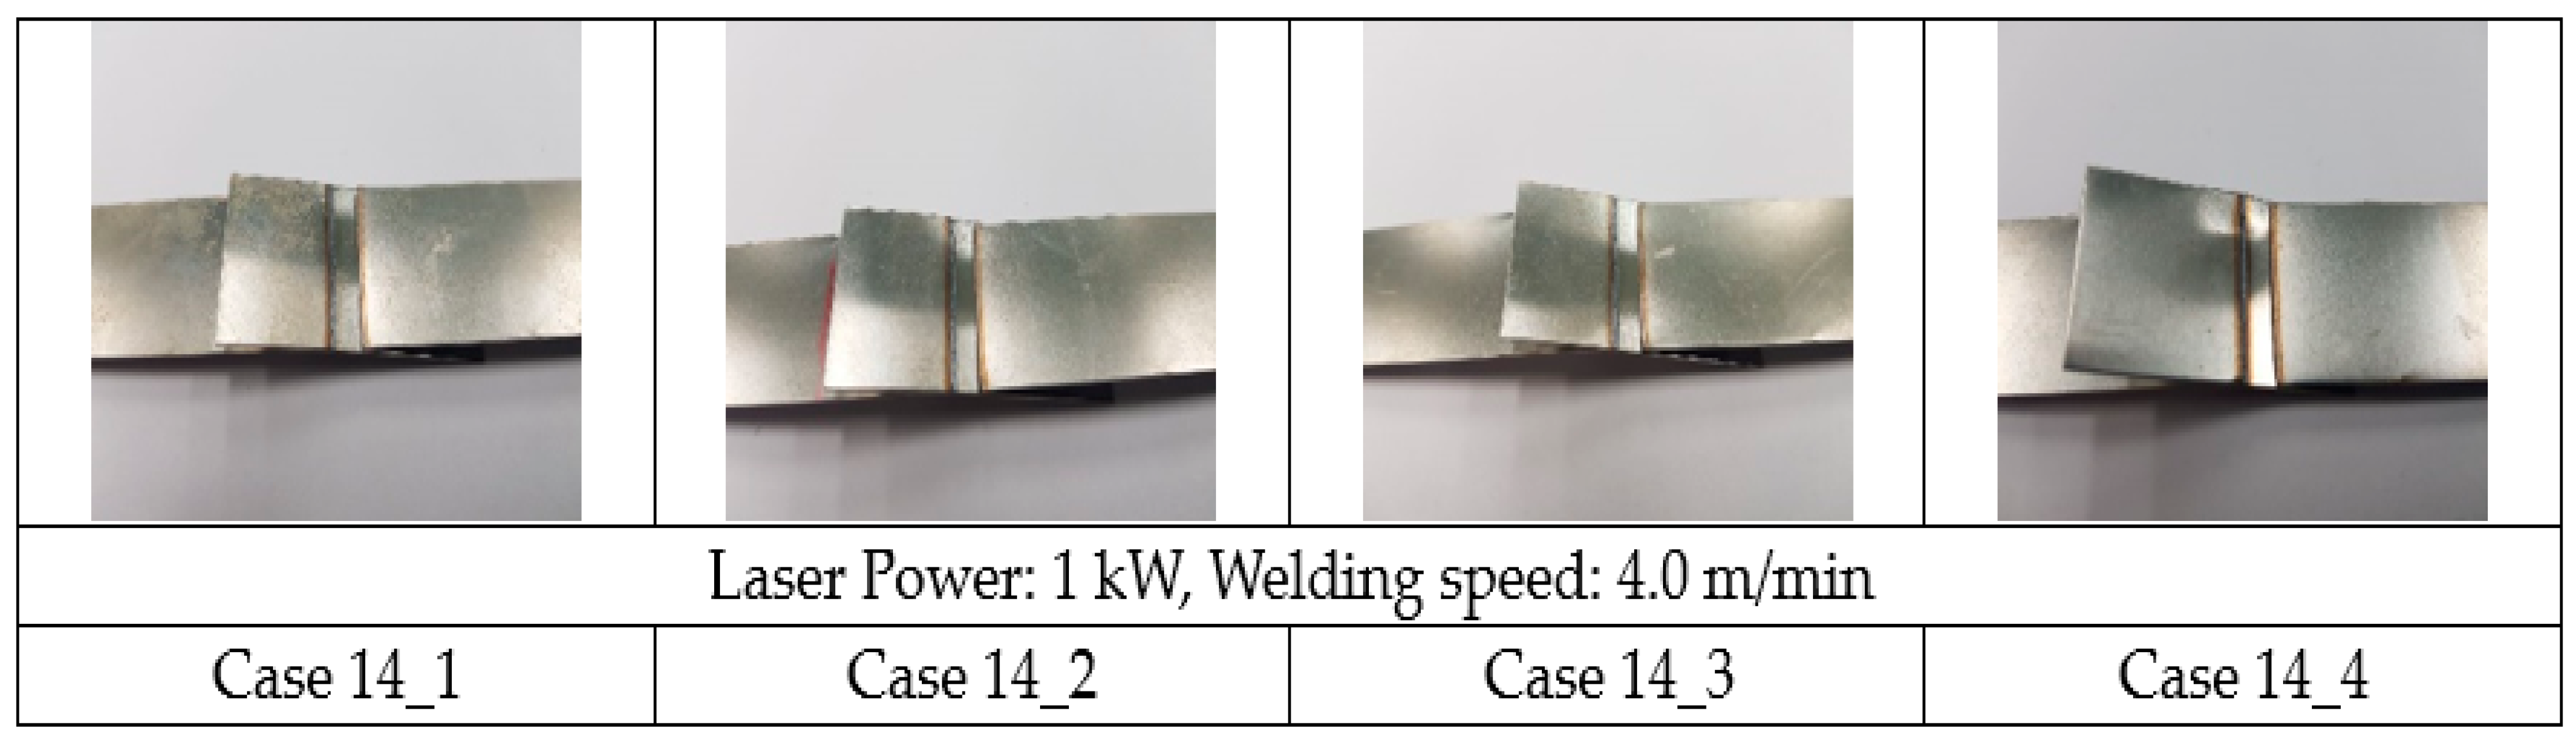
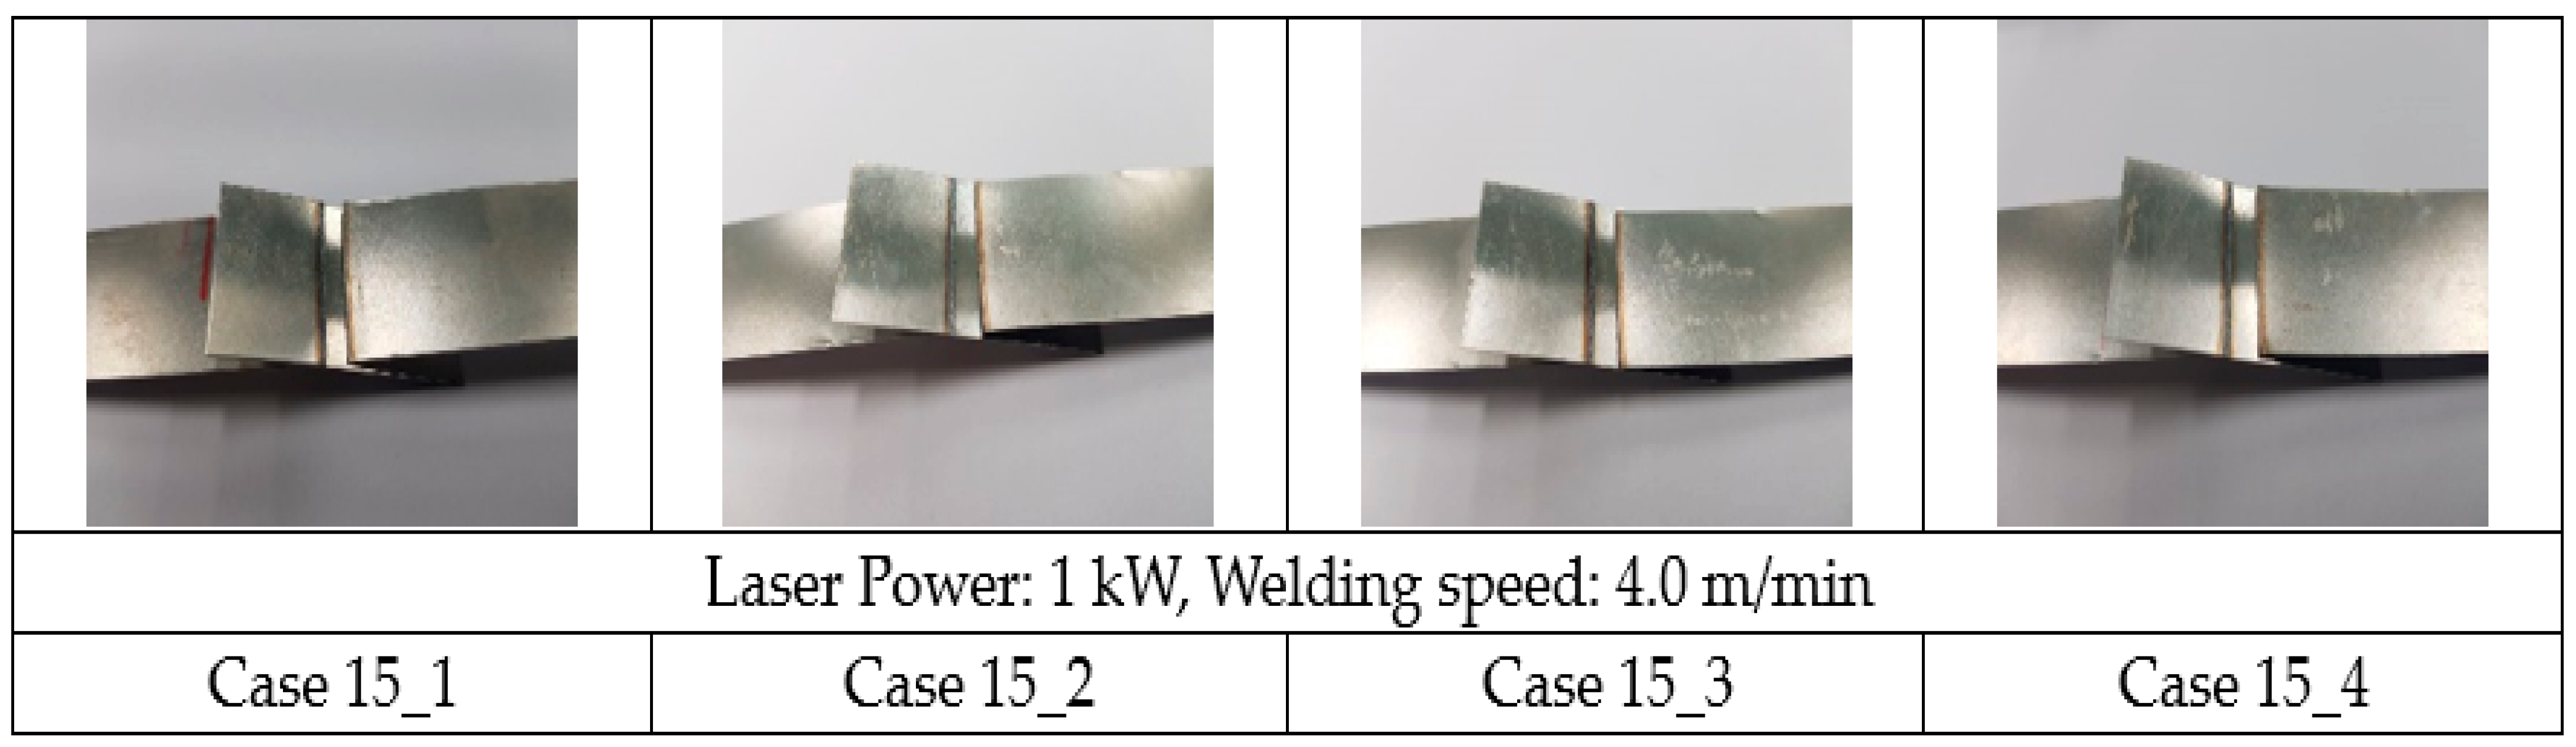
3.2. Shear Strength Test
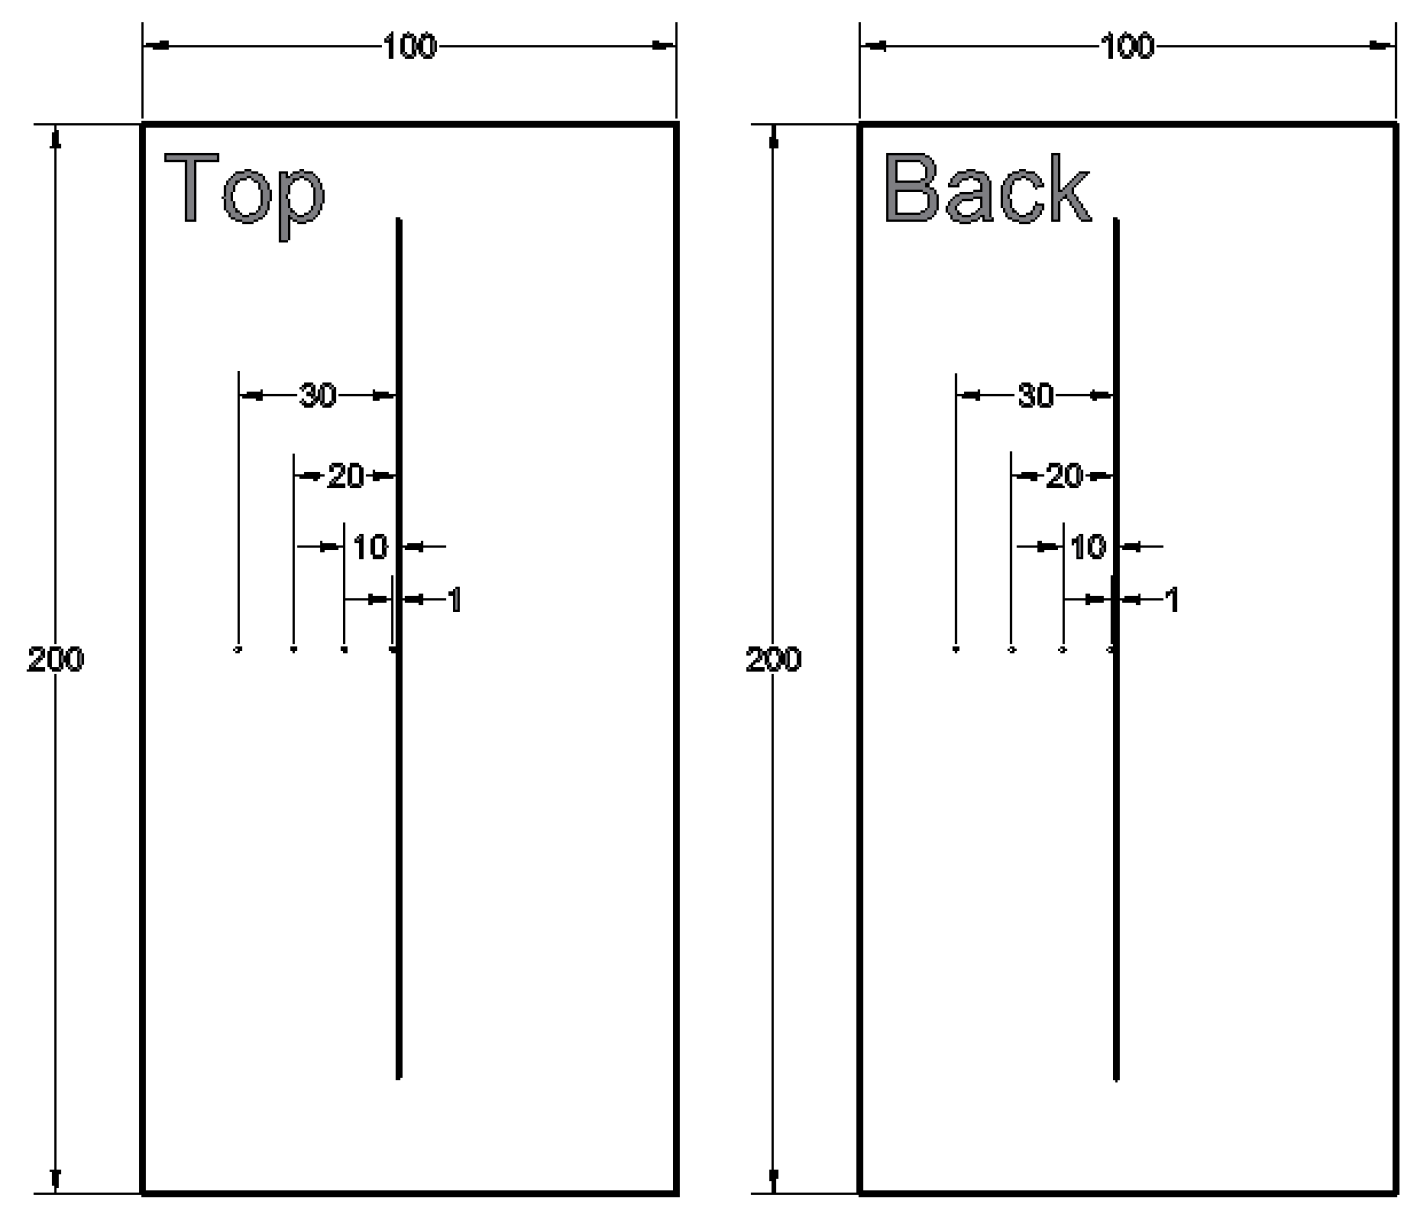
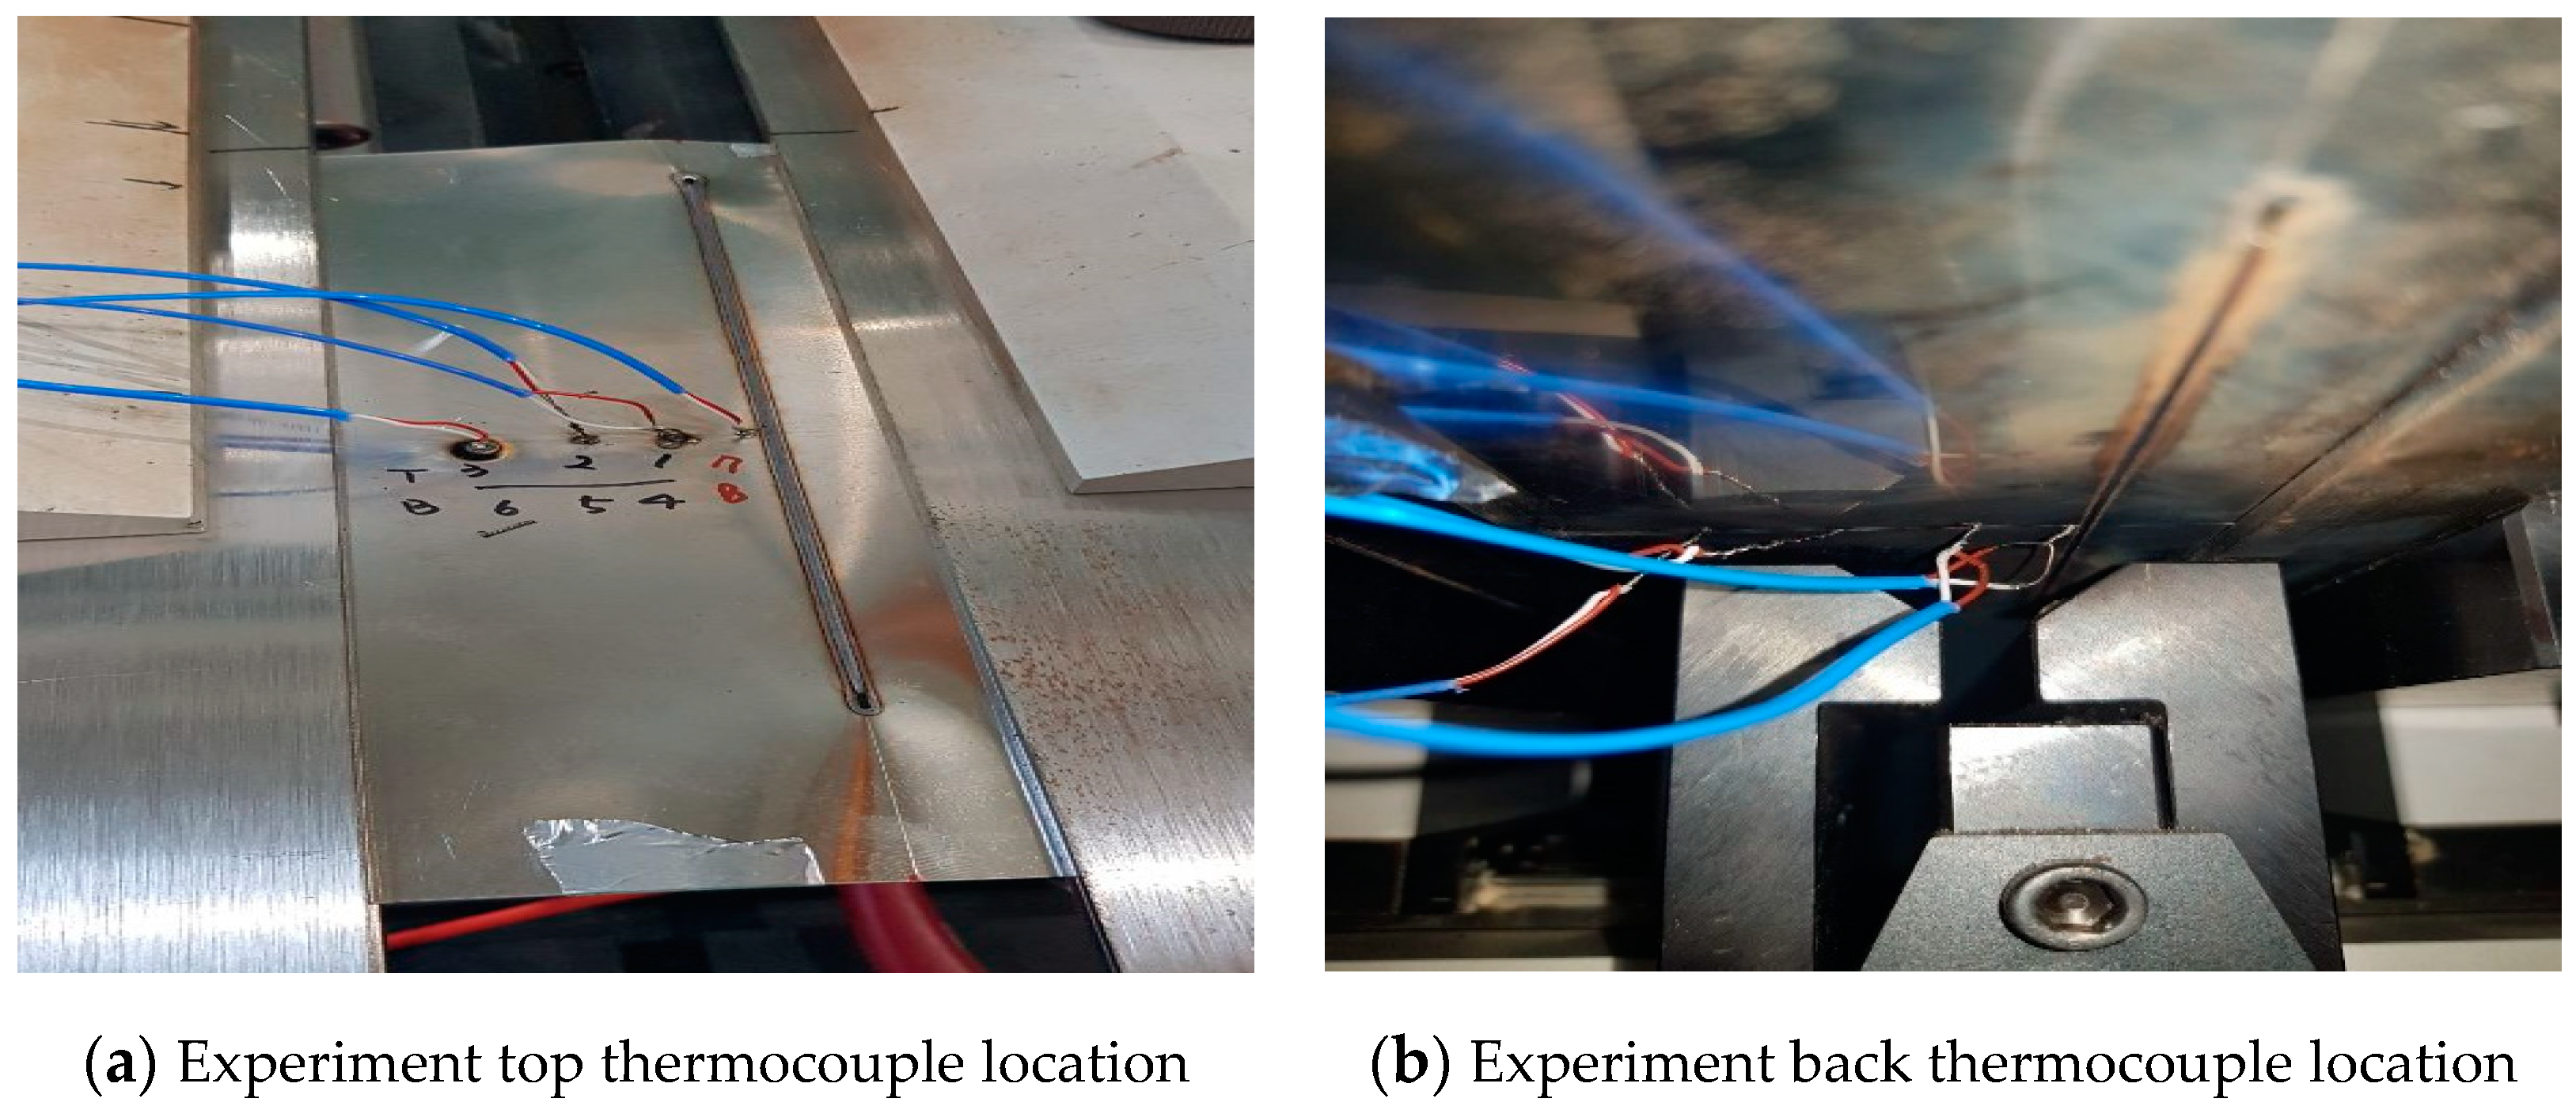
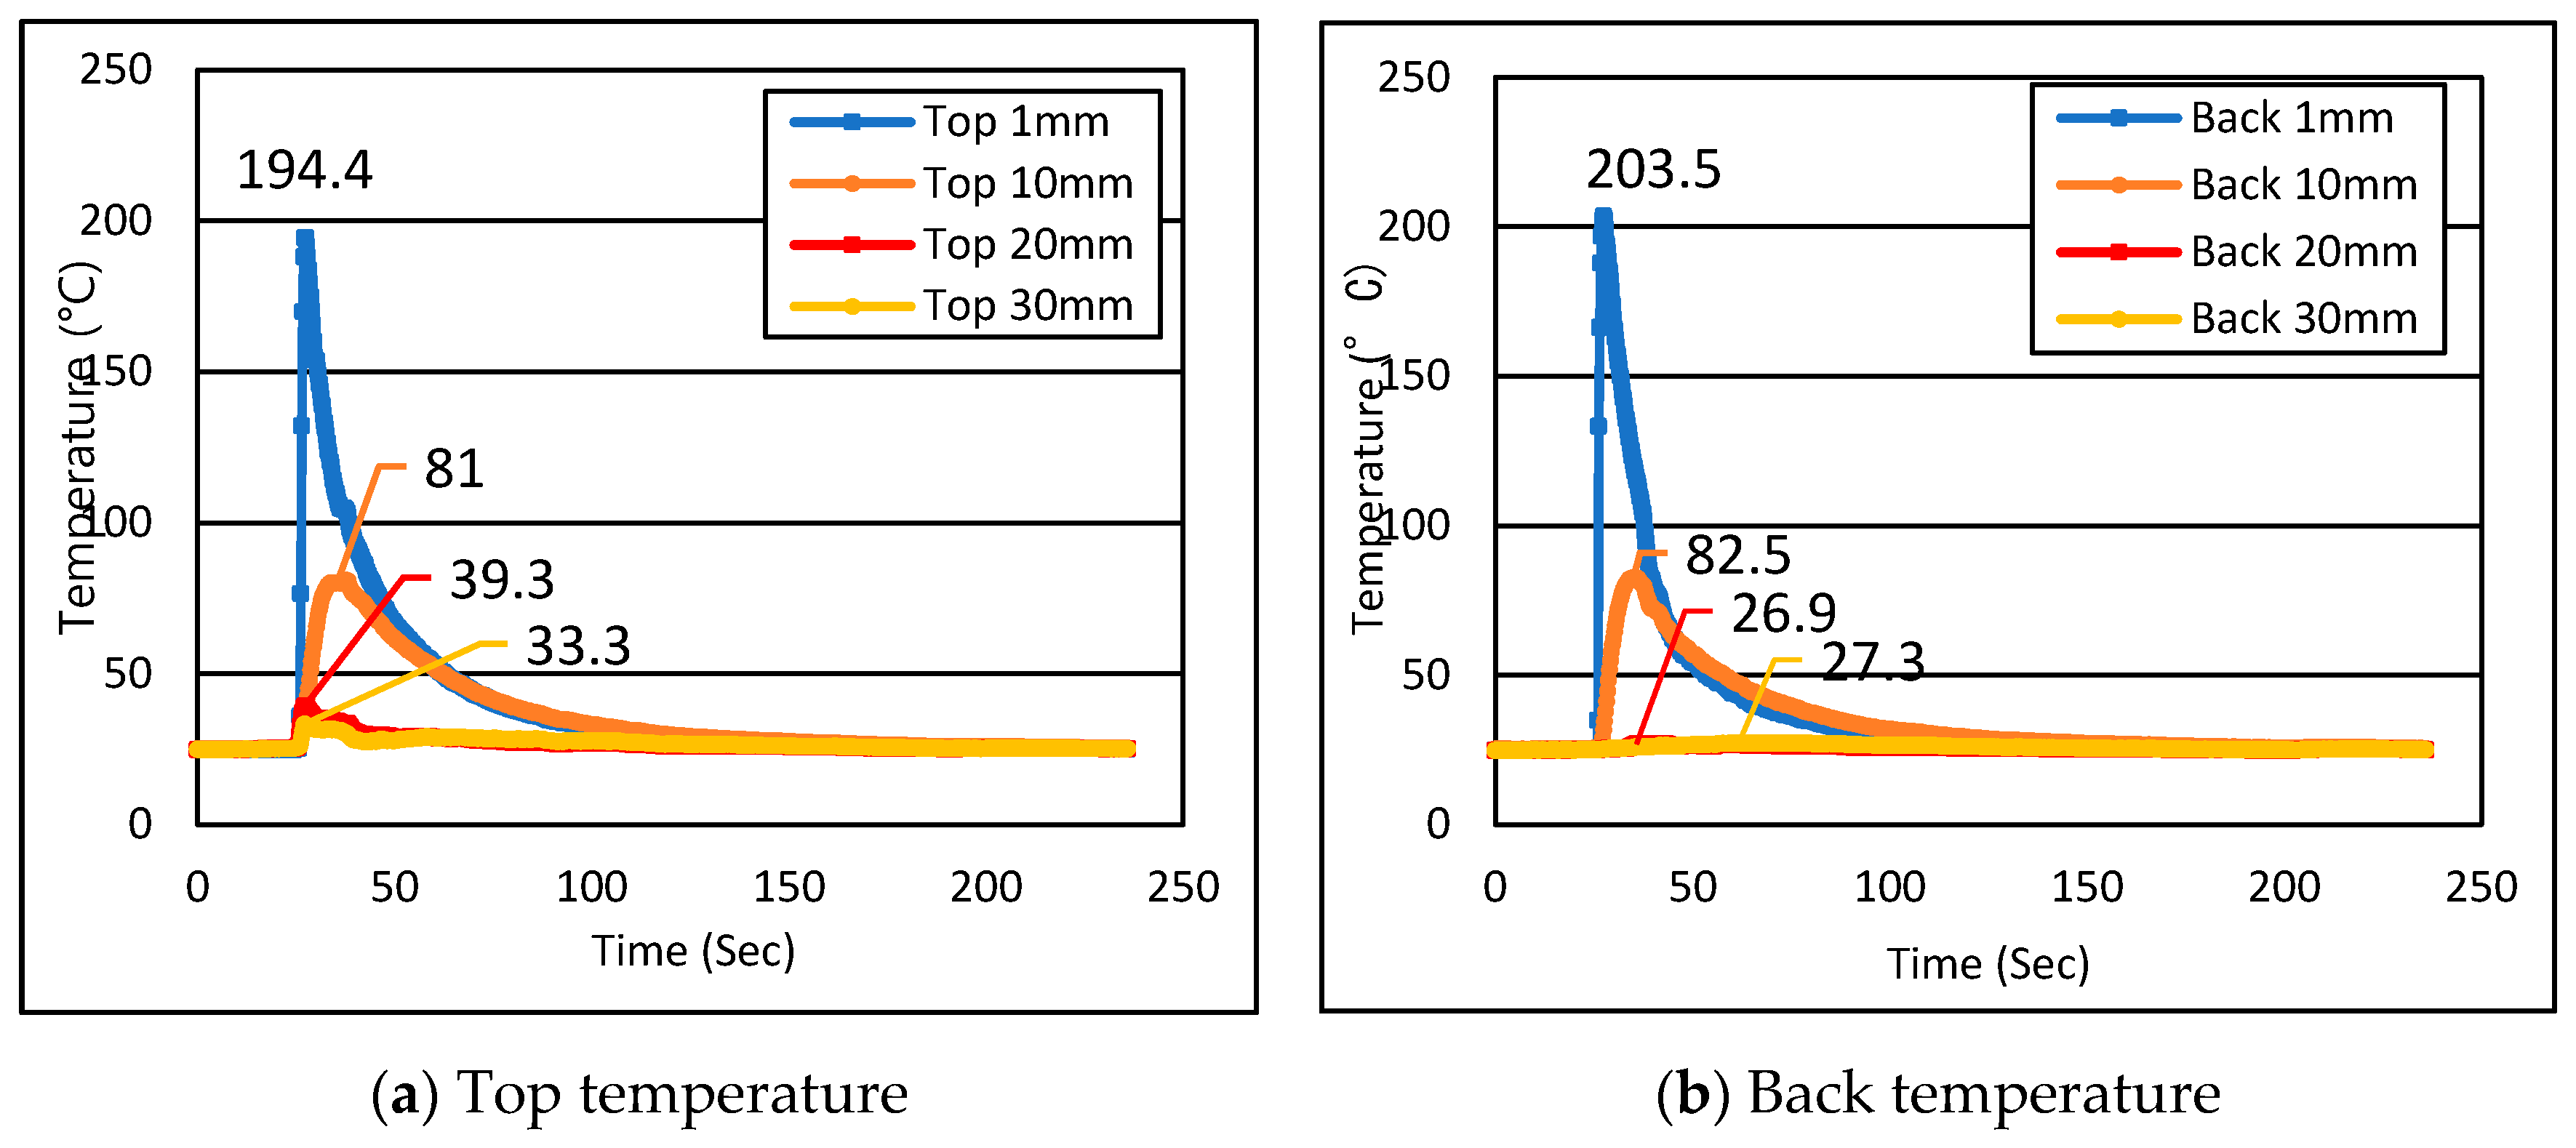
3.3. Temperature Measurement of Welding Part
4. Discussion
5. Conclusions
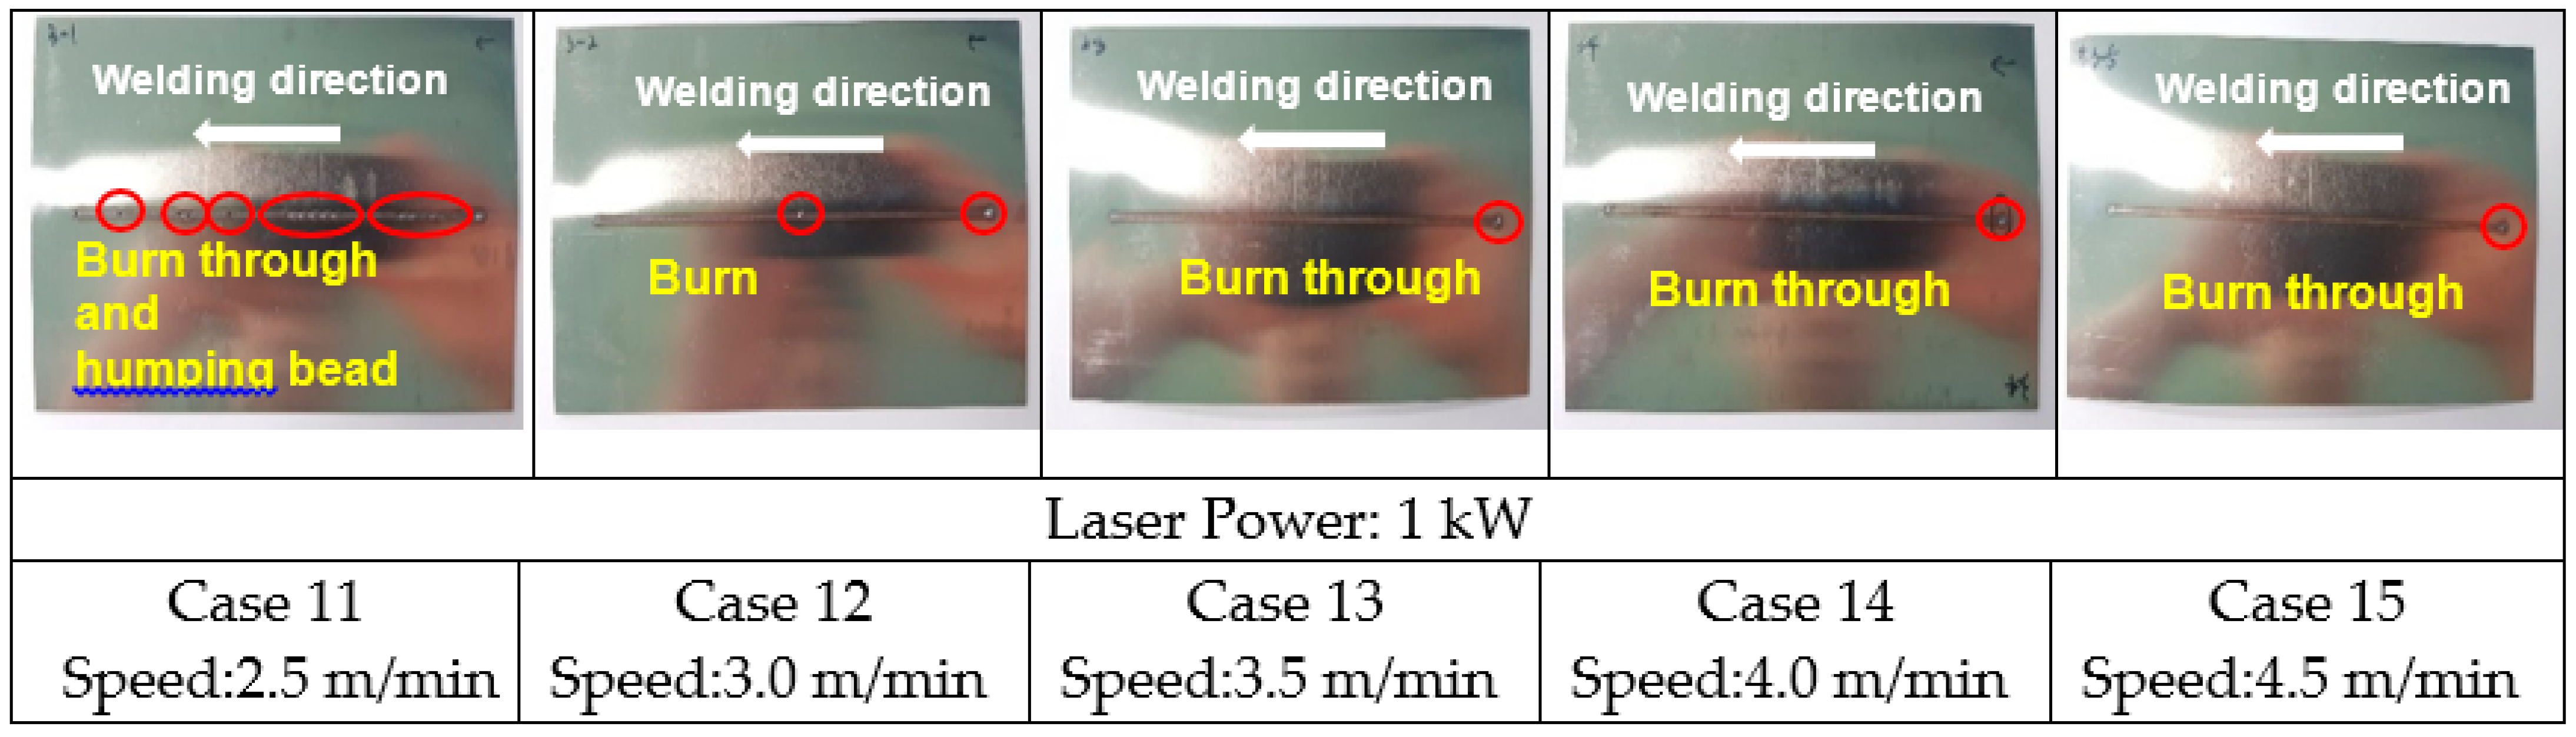
- The conditions required for excellent lap joint welding quality of 0.25 t ASTM F1684 were a welding power of 1 kw and a welding speed of 4.0 m/min or 4.5 m/min. When welding at the above conditions, it was confirmed that excellent quality was obtained by securing sufficient beads on the back side.
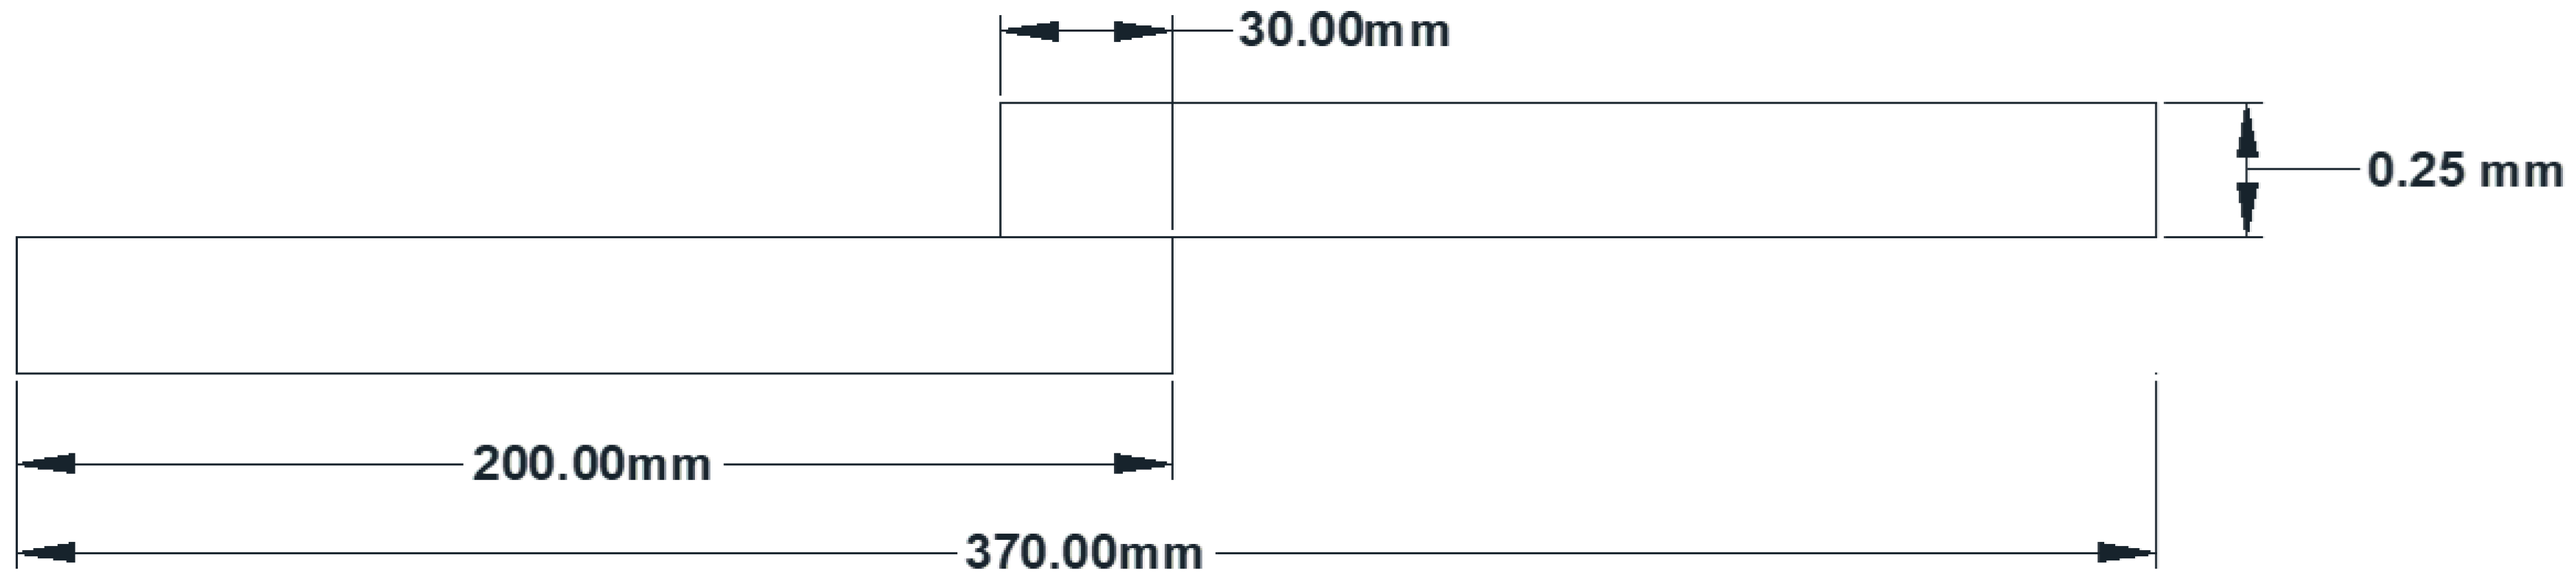
- The tensile strength of a welding part was compared with that of a base metal after lap joint welding under the condition that sufficient beads appeared on the back side. When the width was 20 mm and the thickness was 0.25 mm, the tensile strength of the base metal was 2296.33 N and the tensile strength of the welding specimen was 2034 N, which was 88.6% that of the base metal.
- By comparing top and back, it was confirmed that similar temperature distributions were shown. In addition, it was confirmed that the maximum temperature at a location 1 mm from the welding line was 203.5 °C, and the maximum temperature at a location 10 mm away was 81 °C.
Author Contributions
Funding
Data Availability Statement
Conflicts of Interest
References
- Li, K.; Wu, M.; Gu, X.; Yuen, K.; Xiao, Y. Determinants of ship operators’ options for compliance with IMO 2020. Transp. Res. Part D Transp. Environ. 2020, 86, 102459. [Google Scholar] [CrossRef]
- Xu, H.; Yang, D. LNG-fuelled container ship sailing on the Arctic Sea: Economic and emission assessment. Transp. Res. Part D Transp. Environ. 2020, 87, 102556. [Google Scholar] [CrossRef]
- Hwang, S.; Jeong, B.; Jung, K.; Kim, M.; Zhou, P. Life Cycle Assessment of LNG Fueled Vessel in Domestic Services. J. Mar. Sci. Eng. 2019, 7, 359. [Google Scholar] [CrossRef]
- Van, T.; Ramirez, J.; Rainey; Ristovski, Z.; Brown, R. Global impacts of recent IMO regulations on marine fuel oil refining processes and ship emissions. Transp. Res. Part D Transp. Environ. 2019, 70, 123–134. [Google Scholar] [CrossRef]
- Seddiek, I.; Elgohary, M. Eco-friendly selection of ship emissions reduction strategies with emphasis on SOx and NOx emissions. Int. J. Nav. Archit. Ocean Eng. 2014, 6, 737–748. [Google Scholar] [CrossRef]
- Choi, Y.; Ahn, J.; Jo, C.; Chang, D. Prismatic pressure vessel with stiffened-plate structures for fuel storage in LNG-fueled ship. Ocean Eng. 2020, 196, 106829. [Google Scholar] [CrossRef]
- Kim, B.; Park, J.; Lee, J.; Kim, M. Study on the Initial Design of an LNG Fuel Tank using 9 wt.% Nickel Steel for Ships and Performance Evaluation of the Welded Joint. J. Weld. Join. 2019, 37, 555–563. [Google Scholar] [CrossRef]
- Han, K.; Kim, D.; Yun, K.; Shin, Y.; Lee, H. Effect of Al and Zn-coated Layer of Scaffolding on Weldability of Cryogenic Material in LNG Carriers. J. Weld. Join. 2019, 37, 9–14. [Google Scholar] [CrossRef]
- Yang, W.; Kil, W.; Moon, B.; Nam, H.; Kang, N. Tensile and Microstructural Behaviors of Austenitic Stainless Steel GTA Welds for Cryogenic Application. J. Weld. Join. 2020, 38, 400–408. [Google Scholar] [CrossRef]
- Park, J.; An, G. Fracture Characteristics of Cryogenic Steel Using Weibull Stress Analysis. J. Weld. Join. 2019, 37, 531–538. [Google Scholar] [CrossRef]
- Wang, H.; Hu, S.; Shen, J.; Li, D.; Lu, J. Effect of duty cycle on microstructure and mechanical properties of pulsed GTAW Lap joint of Invar. J. Mater. Process. Technol. 2017, 243, 481–488. [Google Scholar] [CrossRef]
- Qiu, C.; Adkins, N.; Attallah, M. Selective laser melting of Invar 36: Microstructure and properties. Acta Mater. 2016, 103, 382–395. [Google Scholar] [CrossRef]
- Park, W.; Chun, M.; Han, M.; Kim, M.; Lee, J. Comparative study on mechanical behavior of low temperature application materials for ships and offshore structures: Part I—Experimental investigations. Mater. Sci. Eng. A 2011, 528, 5790–5803. [Google Scholar] [CrossRef]
- Harrison, N.; Todd, L.; Mumtaz, K. Thermal expansion coefficients in Invar processed by selective laser melting. J. Mater. Sci. 2017, 52, 10517–10525. [Google Scholar] [CrossRef] [PubMed]
- Yakout, M.; Cadamuro, A.; Elbestawi, M.; Veldhuis, S. The selection of process parameters in additive manufacturing for aerospace alloys. Int. J. Adv. Manuf. Technol. 2017, 92, 2081–2098. [Google Scholar] [CrossRef]
- Zhan, X.; Liu, Y.; Ou, W.; Gu, C.; Wei, Y. The Numerical and Experimental Investigation of the Multi-layer Laser-MIG Hybrid Welding for Fe36Ni Invar Alloy. J. Mater. Eng. Perform. 2015, 24, 4948–4957. [Google Scholar] [CrossRef]
- Zhan, X.; Li, Y.; Ou, W.; Yu, F.; Chen, J.; Wei, Y. Comparison between hybrid laser-MIG welding and MIG welding for the invar36 alloy. Opt. Laser Technol. 2016, 85, 75–84. [Google Scholar] [CrossRef]
- Jasthi, B.; Arbegast, W.; Howard, S. Thermal Expansion Coefficient and Mechanical Properties of Friction Stir Welded Invar (Fe-36%Ni). J. Mater. Eng. Perform. 2009, 18, 925–934. [Google Scholar] [CrossRef]
- Zhao, Y.; Sato, Y.; Kokawa, H.; Wu, A. Microstructure and properties of friction stir welded high strength Fe-36 wt% Ni alloy. Mater. Sci. Eng. A 2011, 528, 7768–7773. [Google Scholar] [CrossRef]
- Corbacho, J.; Suarez, J.; Molleda, F. Grain Coarsening and Boundary Migration during Welding of Invar Fe-36Ni Alloy. Mater. Charact. 1998, 41, 27–34. [Google Scholar] [CrossRef]
- Kim, D.; Pyo, C.; Kim, J.; Kim, J.; Lee, H. A Study on Cross-Shaped Structure of Invar Material Using Cold Wire Laser Fillet Welding (PART I: Feasibility Study for Weldability). Metals 2020, 10, 1385. [Google Scholar] [CrossRef]


| Material | Composition (wt%) | |||
|---|---|---|---|---|
| ASTM F1684 | Ni | Mo | C | Mn |
| 36 | ~0.5 | ~0.1 | ~0.06 | |
| P | S | Si | Cr | |
| ~0.025 | ~0.025 | ~0.35 | ~0.5 | |
| Coefficient of Thermal Expansion (mm/mmK) | Young’s Modulus (GPa) | Density (kg/m3) |
|---|---|---|
| 1.2 × 10⁻⁶ | 148.0 | 8100.0 |
| Welding Parameters | Experimental Conditions |
|---|---|
| Laser power (kW) | 0.50, 0.55, 0.60, 0.65, 0.70 |
| Welding speed (m/min) | 1 |
| Defocus (mm) | 0 |
| Shielding gas Ar (L/min) | 15 |
| Tilting angle & Working angle (°) | 0 |
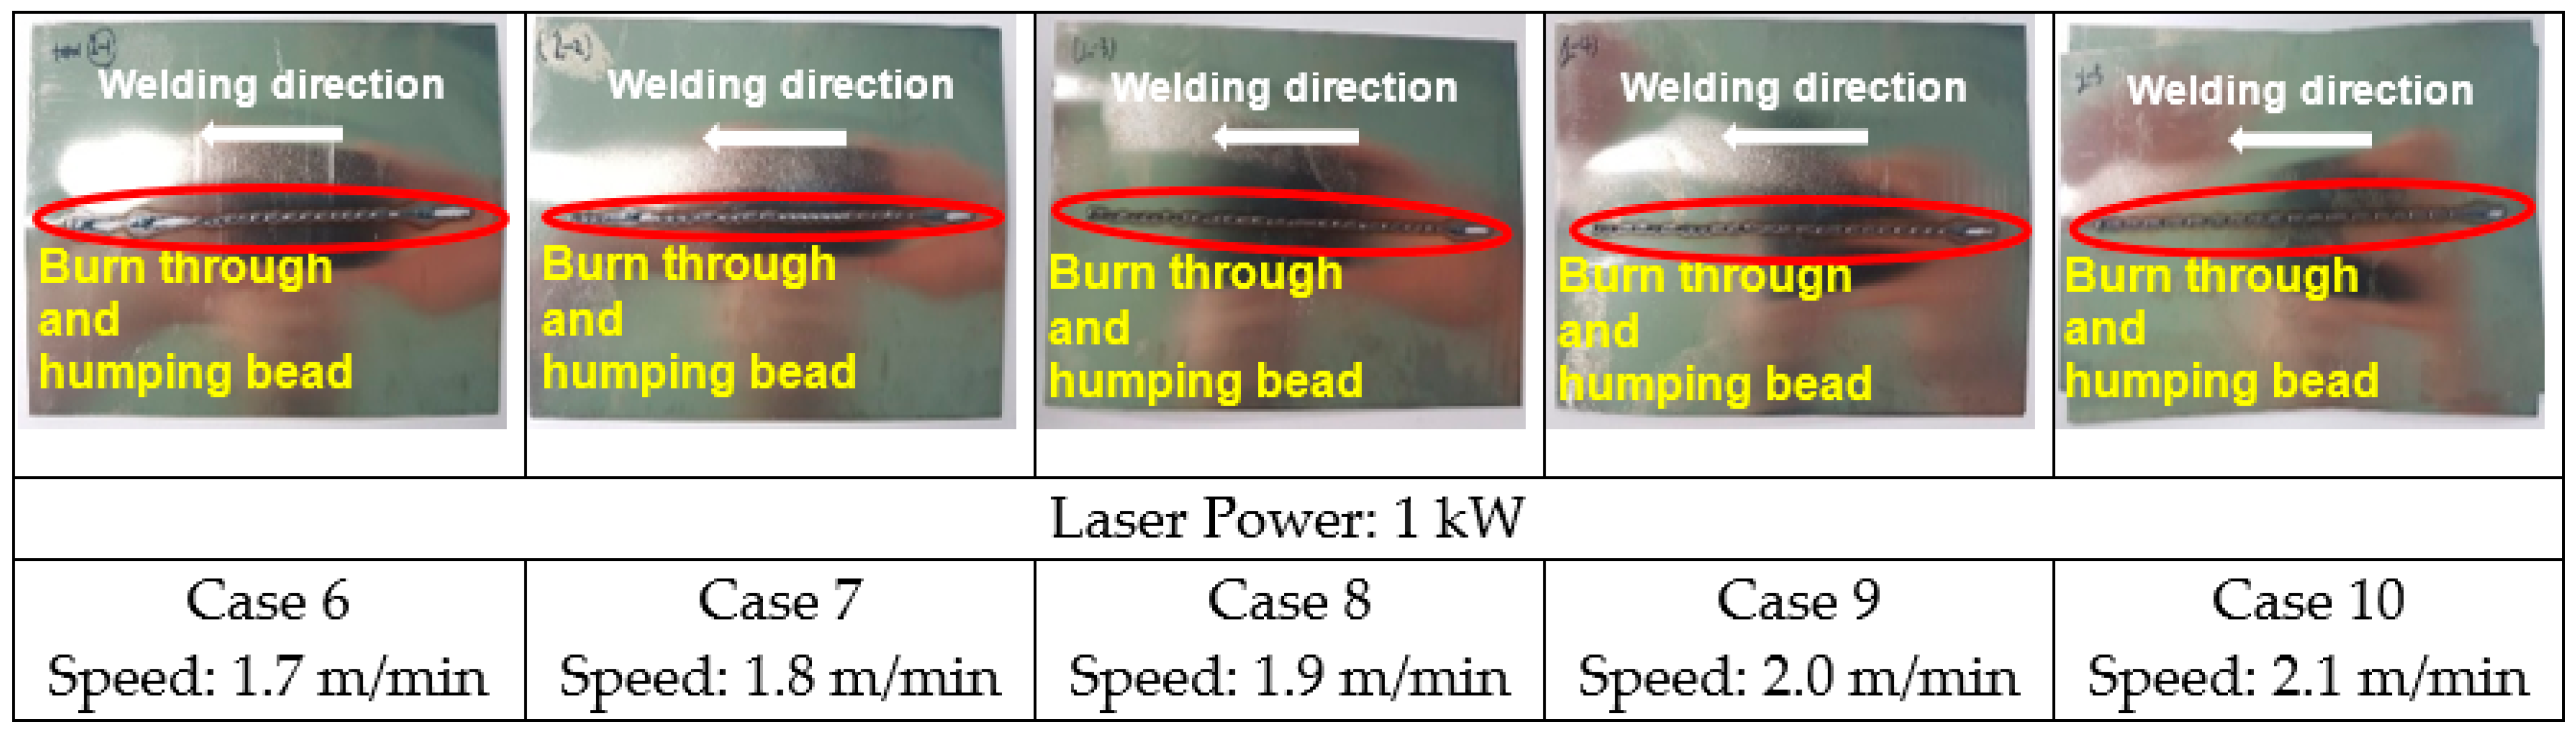
| Welding Parameters | Experimental Conditions |
|---|---|
| Laser power (kW) | 1 |
| Welding speed (m/min) | 1.7, 1.8, 1.9, 2.0, 2.1 |
| Defocus (mm) | 0 |
| Shielding gas Ar (L/min) | 15 |
| Tilting angle & Working angle (°) | 0 |
| Welding Parameters | Experimental Conditions |
|---|---|
| Laser power (kW) | 1 |
| Welding speed (m/min) | 2.5, 3.0, 3.5, 4.0, 4.5 |
| Defocus (mm) | 0 |
| Shielding gas Ar (L/min) | 15 |
| Tilting angle & Working angle | 0 |
| Case | Bead Width (mm) | Bead Height (mm) | Weld Zone (mm) | Back Bead Width (mm) | Back Bead Height (mm) | Penetration (mm) |
|---|---|---|---|---|---|---|
| 11 | 0.690 | 0.105 | 0.620 | 0.485 | −0.018 | 0.716 |
| 12 | 0.812 | 0.030 | 0.559 | 0.423 | −0.021 | 0.648 |
| 13 | 0.766 | 0.051 | 0.499 | 0.433 | −0.020 | 0.654 |
| 14 | 0.704 | 0.020 | 0.485 | 0.448 | 0.025 | 0.670 |
| 15 | 0.698 | 0.004 | 0.474 | 0.435 | 0.027 | 0.663 |
| Case # | Specimen Size (mm) | Max Force (N) | |
|---|---|---|---|
| Thick | Width | ||
| Case 14_1 | 0.25 | 20.22 | 2043 |
| Case 14_2 | 0.25 | 19.97 | 2045 |
| Case 14_3 | 0.25 | 20.14 | 2050 |
| Case 14_4 | 0.25 | 20.15 | 1998 |
| Average | 2034 | ||
| Standard deviation | 20.94 | ||
| Case # | Specimen Size (mm) | Max Force (N) | |
|---|---|---|---|
| Thick | Width | ||
| Case 15_1 | 0.25 | 20.00 | 2008 |
| Case 15_2 | 0.25 | 19.90 | 2048 |
| Case 15_3 | 0.25 | 19.61 | 1988 |
| Case 15_4 | 0.25 | 20.23 | 2043 |
| Average | 2021.75 | ||
| Standard deviation | 24.84 | ||
| Distance from Welding Line (mm) | Max Temp. (°C) of Top Plate | Time (s) at Max Temp. | Max Temp. (°C) of Back Plate | Time (s) at Max Temp. |
|---|---|---|---|---|
| 1 | 194.40 | 27.25 | 203.50 | 27.5 |
| 10 | 81.00 | 37.50 | 82.50 | 35.00 |
| 20 | 39.30 | 27.25 | 26.90 | 35.75 |
| 30 | 33.30 | 27.25 | 27.30 | 61.75 |
| CASE | Length (mm) | Rolling Direction (°) | Max Force (N) |
|---|---|---|---|
| Base metal 1 | 370 | 0 | 2395 |
| Base metal 2 | 370 | 0 | 2308 |
| Base metal 3 | 370 | 0 | 2325 |
| Base metal 4 | 200 | 0 | 2275 |
| Base metal 5 | 200 | 0 | 2318 |
| Base metal 6 | 200 | 0 | 2285 |
| Base metal 7 | 200 | 90 | 2243 |
| Base metal 8 | 200 | 90 | 2238 |
| Base metal 9 | 200 | 90 | 2280 |
| Average | 2296.33 | ||
| Standard deviation | 45.04 | ||
Publisher’s Note: MDPI stays neutral with regard to jurisdictional claims in published maps and institutional affiliations. |
© 2021 by the authors. Licensee MDPI, Basel, Switzerland. This article is an open access article distributed under the terms and conditions of the Creative Commons Attribution (CC BY) license (http://creativecommons.org/licenses/by/4.0/).
Share and Cite
Kim, J.; Kim, Y.; Kim, J.; Kim, Y.; Kim, D.; Kang, S.; Pyo, C. A Study on Lap Joint Welding of Thin Plate ASTM F1684 Using Fiber Laser Welding. Processes 2021, 9, 428. https://doi.org/10.3390/pr9030428
Kim J, Kim Y, Kim J, Kim Y, Kim D, Kang S, Pyo C. A Study on Lap Joint Welding of Thin Plate ASTM F1684 Using Fiber Laser Welding. Processes. 2021; 9(3):428. https://doi.org/10.3390/pr9030428
Chicago/Turabian StyleKim, Jaewoong, Younghyun Kim, Jisun Kim, Yongtai Kim, Dongwoo Kim, Sungwook Kang, and Changmin Pyo. 2021. "A Study on Lap Joint Welding of Thin Plate ASTM F1684 Using Fiber Laser Welding" Processes 9, no. 3: 428. https://doi.org/10.3390/pr9030428
APA StyleKim, J., Kim, Y., Kim, J., Kim, Y., Kim, D., Kang, S., & Pyo, C. (2021). A Study on Lap Joint Welding of Thin Plate ASTM F1684 Using Fiber Laser Welding. Processes, 9(3), 428. https://doi.org/10.3390/pr9030428