Abstract
This paper presents the computation of the cable ampacity and the temperature distribution through long duration based on the equivalent thermal circuit based on IEC 60287 standard and the Finite element method using COMSOL (Multiphysics environment, version 5.5). This study investigated the cable ampacity and the temperature rise of the cable core and sheath at steady state and emergency conditions. The cable ampacity was investigated at different conditions such as the variation of cable depth, soil properties, and soil temperature. The results confirmed the adaptation between the thermal circuit results and the COMSOL results as well as the effectiveness of using the numerical method to compute the cable ampacity. Using the COMSOL-based thermal properties evaluations, the transient performance of the cable is ascertained. The transient study is performed for different cable loading currents and dry zone sizes.
1. Introduction
The installation and maintenance of power cables are more expensive than overhead lines. The huge installation cost makes it imperative to use its full capacity. The ampacity of the cable is limited based on the cable temperature, which does not exceed 90 °C for XLPE cables and controls the cable lifetime. The cable insulation and its jacket subjected to damage with the excessive cable temperature [1]. The model of the power cable ampacity computation was proposed by Neher-McGrath in 1957 [2,3]. Utilities and cable manufactures depended on the international electrotechnical commission IEC 60287 standard, which used several simplifications and had its limitations. In addition, rating computations of the insulated cables with considering the non-adiabatic heating effects are explained in detail in [4,5].
Recently, several attempts were accomplished to modify the limitations in IEC 60287 standard. Aras et al. [1], compared the results of applying finite element method (FEM) to calculate the cable ampacity with the results of IEC 60287 standard and the experimental work results. Freitas, et al. [6], presented a numerical simulation for cable ampacity computation taking into consideration the effect of soil heat and moisture migration on the cable ampacity. Hiranandani [7], solve the problem of cable rating using Finite difference method (FDM) concerning the cables touching and separation of the cables using insulation materials. Hwang [8], used FEM to compute the cable rating in ducts.
The parameters of the thermal circuit representing the heat exchange of the cable under load condition were addressed in many works. Zaytsev [9] developed a technique to compute the thermal equivalent circuit of the high voltage cable buried into ground. The thermal circuit parameters are discussed simulating the environment of the cable in trefoil and plane configuration. In addition, the prediction of the heating of the cable is developed using the proposed method to protect the cable from insulation degradation. Yang, et al. [10], calculated the conductor temperature based on the thermal sensor position for high voltage cables. Four thermal circuit parameters were considered the temperature of insulation shield, the aluminum sheath, center of the waterproof compound, and the jacket surface to compute the conductor temperature. Simulation was presented to investigate the accuracy of the temperature computation of the cable. Diaz-Aguiló and de León, [11], modeled the transient thermal behavior of mutual heating effects between the power cables. They referred that although the proposed accurate model of the thermal circuit in IEC 60287, it is difficult to implement in electrical software and not consistent for layered model of the thermal resistance. In [11], an alternative model was developed consisting of injecting the correct current at the right position of the RC circuit representing the soil. The proposed model is validated using the FEM simulation of realistic cable establishment.
Nelson, et al. [12], the thermal behavior considering the cable center as a hottest spot was analyzed based on the ladder thermal circuit method. A suitable cross section area of the high voltage submarine cable was the main objective of this work, as well as a method of dynamic rating of the cable was proposed and accomplished via iterative process. The FEM results was compared with that of the proposed method to validate the proposed technique. Xiong, et al. [13], indicated that the studied the temperature field distribution and the cable ampacity improving the guidelines of cable manufactures. Thermal circuit in IEC 60287 and numerical simulation were used to compute the cable temperature. The numerical simulation results were close to that from the actual measurement. Žiga, et al. [14], investigated the influence of environmental conditions on the core heating of reinforced aluminum conductor steel. The computations of temperature distribution in steady state were performed based on the balance of powers not energies. The results showed the reliability and the ability of the proposed model to give satisfactory results according to the actual measured cable temperature.
Due to several simplifications and limitations of the IEC 60287 standard, this paper modelled the cable, based on the equivalent thermal circuit, using COMSOL environment. First, paper used the analytical model to compute the cable ampacity under different conditions and the temperature through a cable, using the two-loop thermal circuit of the cable, based on IEC 60287 standard. Since the analytical method considers some ideal assumptions, COMSOL Multiphysics was used to model the cable, to evaluate the temperature performance of the cable and sheath, concerning thermal model at different loading current.
In this work, the ladder thermal circuit is used to compute the cable ampacity and the distribution of temperature through the cable. The effect of the soil resistivity and cable depth on the cable ampacity is investigated. In addition, the transient rating calculations can be accomplished. The results from the thermal circuit were compared with that using numerical simulation using COMSOL software, which is build based on FEM. Transient thermal performance is evaluated at different load performances covering the conditions from maximum continuous load cycle to typical one. Concerning the maximum continuous load for long period (1000 h), impact of dry zone formation around the cable on the thermal performance is investigated at different dry zone thickness. The results indicated a good correlation between the analytical and numerical results.
2. Computation of the Steady State and Transient Cable Rating
The cable system as in Figure 1 can be presented using the ladder thermal circuit to compute both steady state and transient rating equations of the cable [15]. These equations are suitable for a single cable including one single core or multiple cores. Figure 2 illustrates the ladder thermal circuit representing the cable system and the parameters T and Q that refer to the thermal resistance and capacitance of the different cable components, respectively. The IEC standard [16,17] computes the cable ampacity based on reducing the ladder thermal circuit into a two-loop network to simplify the ampacity computation and standardize the procedures for basic cable types. Therefore, the transient response computation of a cable under load variations can be performed using a simplified two-loop ladder thermal circuit. If the cable system is presented using the ladder thermal circuit as in Figure 3, then the equivalent two-loop thermal circuit is illustrated in Figure 4 [15]. The parameters TA is used to express Tα and QA representing Qα to maintain the correct response of short duration. The parameters TB and QB can be expressed as follows [18,19],
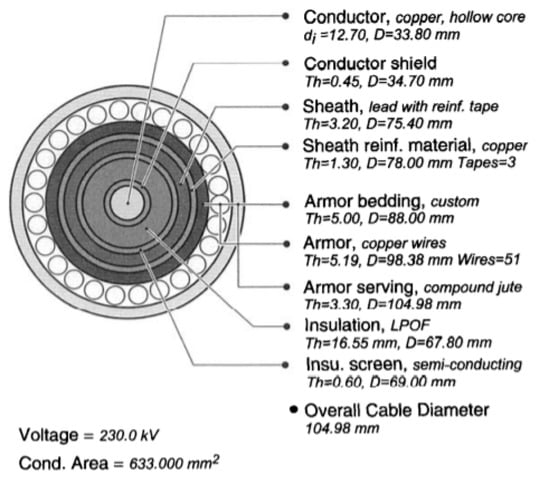
Figure 1.
Cable system parameters.
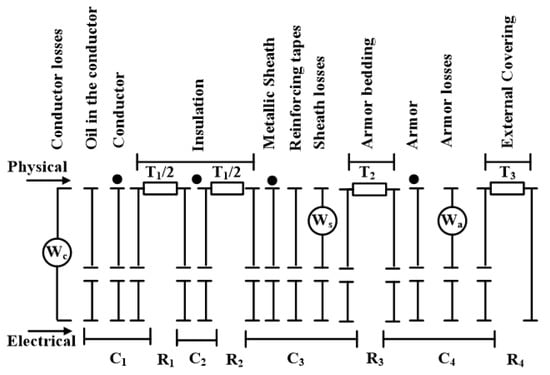
Figure 2.
Equivalent thermal circuit representing the cable system in Figure 1 indicating the physical and equivalent electrical parameters.

Figure 3.
Cable system ladder circuit.
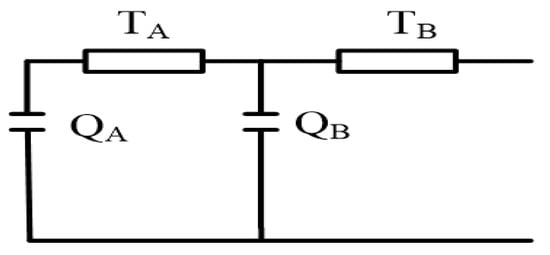
Figure 4.
A two-loop ladder equivalent thermal circuit.
The heat flow in the ladder thermal circuit increases in steps, then, the total joule losses can be expressed as follows,
where, Wc refers to the conductor losses, Ws refers to the sheath losses, Wa refers to the armor losses, λ1 refers to the sheath loss factor, and λ2 expresses the armor loss factor.
The cable temperature rise (Δθ) above the ambient temperature for the ladder thermal circuit can be expressed as
where, Wd is the dielectric losses, T1, T2, T3, and T4 are the thermal resistances per unit length between one conductor and the sheath, between sheath and armor, the external serving of the cable, and between the cable surface and the surrounding medium, respectively. The factor n refers to the number cable conductors.
Based on the fact that Wc = I2R, the permissible current rating of the cable without moisture migration is developed from (3) and can be expressed as follows,
where, R refers to the ac resistance of the cable.
The equations of the thermal network of Figure 5 can be solved to compute the transient rating of the power cables [15]. These equations are solved to determine the variation of the conductor temperature rise with time (θ(t)), where this temperature is not a function of I(t) as in steady state case.
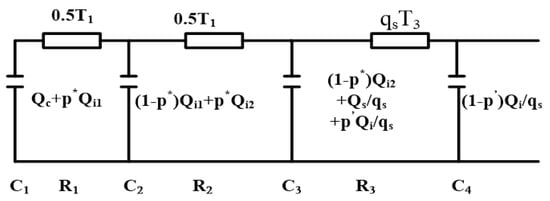
Figure 5.
Thermal cable network for a short-duration transient.
Van Wormer coefficient p* is expressed as
where, Di refers to the insulation diameter and dc refers to the cable diameter.
In addition, the other Van Wormer coefficient p’ can be expressed as,
where, De refers to the cable diameter.
The internal temperature rise of the conductor due to internal parts of the cable as a function of time can be computed as follows,
where, Wc is the power loss per unit length in a conductor based on the maximum conductor temperature attained. Ta and Tb refer to the thermal resistances of two-loop thermal circuit and can be expressed as follows,
where, TA and TB refer to the insulation layer and sheath layer thermal resistances. QA refer to the heat capacitance of the insulation. The parameters a and b are the poles of the transfer function (θc/Wc) where a and b can be expressed as follows [20],
where,
The power loss is assumed to be constant during the step of the transient. Further, the attainment factor of the conductor can be expressed as follows,
Based on the Kennelly hypothesis, the temperature rise at any point in the soil at any time is the sum of the temperature cause by heat sources Wt and by the fictitious image charge placed symmetrically with the earth surface. Therefore, the temperature rise at the outer surface of the cable is then given by,
where, D* = external surface diameter of cable (m), L* = axial burial depth of the cable (m), δ = soil diffusivity (m2 /s). The Ei refers to the exponential integral which can be expressed as,
For x < 0.1
And for large x
The total temperature rise of the conductor (θr(t)) above ambient temperature is computed as follows,
where, θc(t) refers the internal temperature rise of the conductor due to internal parts of the cable (Equation (5)), θe(t) refers the temperature rise at the outer surface of the cable (Equation (13)), and α(t) refers to the attainment factor of the conductor (Equation (12)).
Then, the total conductor temperature (θt(t)) can be expressed as follows,
Based on the cable internal parts, the internal temperature rise of the sheath can be computed as follows,
where,
The total sheath temperature rise above the ambient temperature can be calculated as follows,
And then the total temperature of the sheath
To compute the transient analysis of temperature of the cable, the conductor heat loss must be updated based on the calculated new conductor temperature then,
The reference temperature (θref) is considered as 20 °C. The αcu is the temperature coefficient of copper. The parameter (I0) refers to the loading current or the cable ampacity.
3. Results of the Simulation Model
MATLAB software (R2020b/17 September 2020) was used to compute the cable ampacity under different conditions and the transient temperature of the cable for long duration based on the two-loop thermal circuit of the cable. Figure 6 illustrates the flowchart to compute the cable ampacity. The required cable data, soil data, and temperature data are used as the input to compute the R, Wd, the sheath and armor factors, T, and Q. Furthermore, the type of cable configurations is identified (Flat or Trefoil), then the ampacity is computed for single and double bond (steady state and emergency). Several parameters that influence on the cable ampacity are investigated such as the cable depth, soil resistivity, and soil temperature.
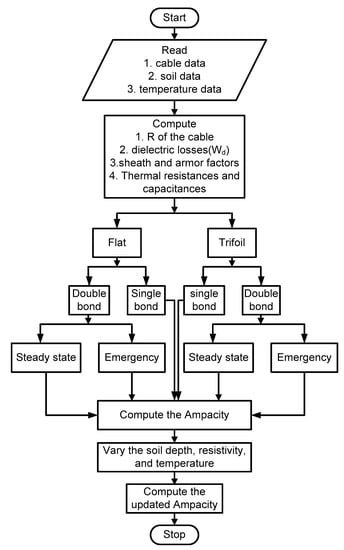
Figure 6.
The ampacity computation flowchart.
On the other hand, Figure 7. illustrates the flowchart explaining the temperature distribution through the cable element, which is determined based on the cable loading (ampacity), the cable data, and burial depth of the cable. The parameters of the two-loop thermal circuit are identified as well as the conductor losses (Wc). The temperatures of the cable and the sheath are now computed based on the variation of the conductor losses with the time (transient state). The specifications of the cable and soil are illustrated in Table 1.
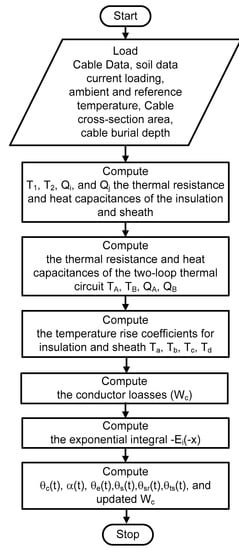
Figure 7.
Temperature distribution through the cable elements.

Table 1.
Input data for cable dimension, soil properties, and temperatures.
3.1. Results of Cable Ampacity with Soil Resistivity Variation
The thermal soil resistivity measurement depends on the thermal constants of the medium and can be used to install and design the underground cables. The variation of the thermal soil resistivity is attributed to the variation of the moisture content of the soil. An increase of the soil moisture content results in a reduced in the thermal soil resistivity [21]. Figure 8 illustrates the influence of the thermal soil resistivity in (m·°C/W) on the cable ampacity for different cable configurations. The trefoil configuration provides cable ampacity higher than that for flat configuration at a constant soil resistivity.
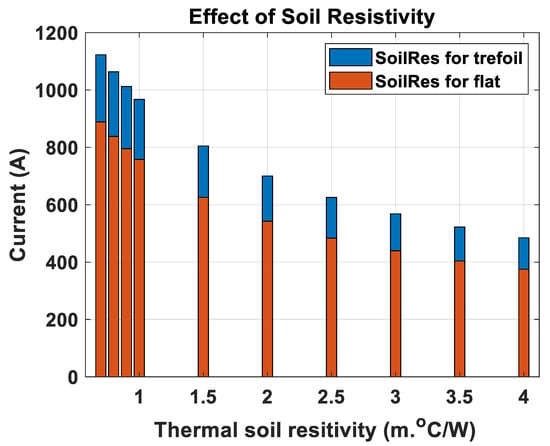
Figure 8.
Effect of the thermal soil resistivity on the cable ampacity.
3.2. Cable Ampacity under Soil Temperature Variation
Figure 9 explains the variation of the cable ampacity with the variation of the soil temperature for different cable configurations. At the same soil temperature, the cable ampacity for trefoil configuration is higher than that for the flat configuration. An increase in the cable temperature corresponds to the decrease of the cable current (cable loading). At the same cable loading, the soil temperature for trefoil configuration of the cable is higher than that for flat configuration.
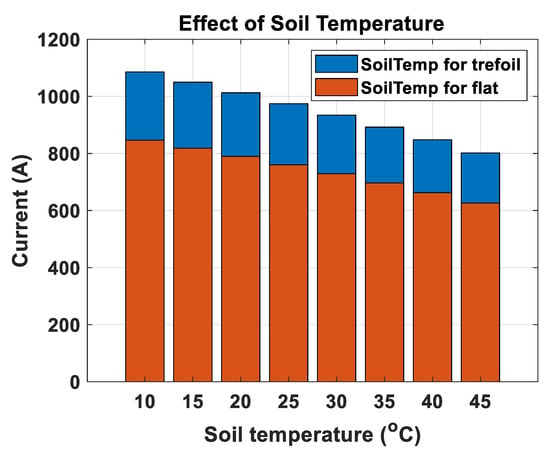
Figure 9.
Influence of the soil temperature on the cable ampacity.
3.3. Cable Ampacity under Varying of Cable Depth
Figure 10 illustrates the effect of the cable depth on the cable ampacity. An increase in the depth of the cable decreases the ampacity of the cable. The trefoil configuration provides cable ampacity higher than that for flat configuration at the same cable depth. An increase of the burial depth of the cable leads to the increase of the thermal resistance of the surrounding soil, which reduces the cable ampacity. Furthermore, at a great depth the laying cables has a significant effect on the cable rating. This effect relies on the ratio of the depth of lying to the tunnel/duct/cable diameter [19].
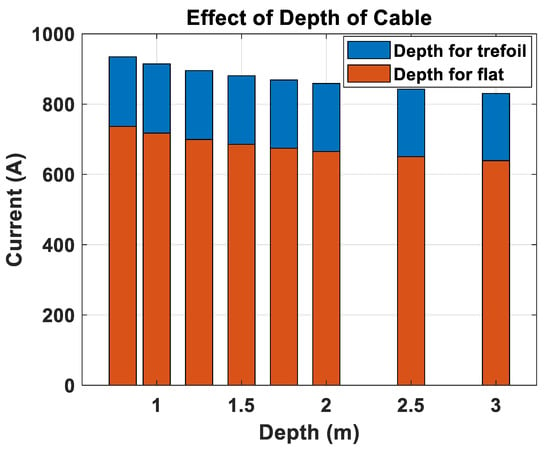
Figure 10.
Effect of cable depth on the cable ampacity.
3.4. Effect of the Cable Bond Configuration on the Cable Ampacity at Different Cable Temperature
There are two category ratings based on the load rating of the cable (cyclic ratings and emergency ratings). Cyclic rating is used the load varies daily over 24 h and it is the same for each day. The emergency ratings are considered when the load varies between ten minutes to one hour. Therefore, the emergency refers to the transient period when the load varies in the period less than one hour. The cable must operate at a load (temperature) higher than its normal load (temperature) for a short time. Therefore, the cable is designed to withstand the emergency overload rating that increases the cable temperature more than the operating cable temperature. In short circuit case occurs for half a second the 90 °C cable must withstand the highest temperature up to 250 °C.
The effect of cable temperature on the cable ampacity is investigated at different cable configurations and different mode operation (continuous and emergency operations). The operation modes refer to the maximum conductor operating temperatures.
Figure 11 shows that the single bond for flat configuration represents higher ampacity rather than the other bond and cable configuration at the same cable temperature. For the same loading current, the temperature of the cable for single bond flat configuration is less than the other cable configuration.
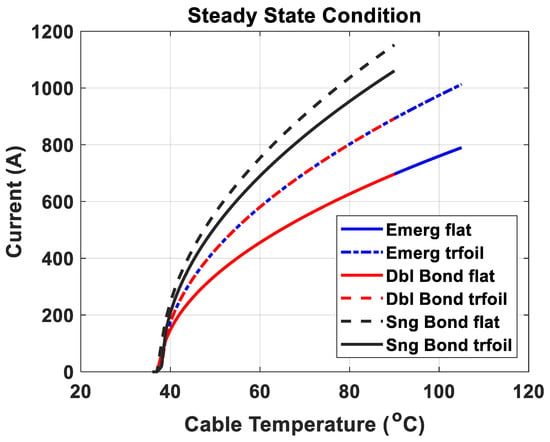
Figure 11.
Effect of the bond category on the cable ampacity with the variation of cable temperature.
3.5. Discussions
In IEC-60287 standard, the analytical method is utilized to compute the ampacity of the power cables. The analytical method is suitable when the cable is buried directly into ground and it considered the ground surface as a constant temperature boundary. In addition, it assumed constant temperature for each cable layer. The previous assumptions are ideal, and it did not meet the practical operational environment [13]. Moreover, these ideal assumptions that were introduced in various structural details and material models reflected to some extent for the obtained results [22]. Therefore, many advantages can be obtained when using the numerical methods such as boundary element method, finite difference method, and finite element method for computing the ampacity and temperature distribution of the power cables. The advantages include the less error of the computation results compared with the results from IEC 60287 standard and using the Multiphysics filed coupling analysis to enhance the computation operation process. Therefore, in the next section the temperature distribution at specified loading current is computing using the COMSOL Multiphysics software and comparing its results with that obtained using the IEC 60287 standard.
4. Temperature Rise Evaluation Using COMSOL Multiphysics
The thermal performance of the cable is evaluated using COMSOL Multiphysics where the prediction of the cable temperatures depends on the generated heat losses due to the conductor current, soil thermal resistivity and the ambient temperature of the cable. Therefore, Heat transfer in solids is used as a physics interface in COMSOL Multiphysics to determine the temperature performance through the underground cable. The cable can be modeled as a 2D using COMSOL Multiphysics where it is very long. This section covers temperature rise of the cable considering different conditions such as steady state load (maximum continuous load), transient loads, and existing dry zone around the cable.
For interface of heat transfer in solid in COMSOL Multiphysics, the following equation is solved [23]:
where, α, S, ρ, Cp, T, utrans, q, qr, and Q are thermal expansion coefficient, second Piola-Kirchhoff stress tensor, density, specific heat capacity, temperature, velocity vector, conduction-based heat flux, heat flux by radiation, and additional heat sources, respectively.
4.1. Steady State Cable Temperature Response
For maximum continuous loading of the cable, 1000 A, the heat losses are computed using Equation (23) and include as a heat source of the conductor in the thermal model in COMSOL Multiphysics. Figure 12 shows the conductor and sheath temperatures for long time duration such as 1000 h where the evaluations using COMSOL and equations are declared. Equations from (5) to (23) are based on the equivalent two-loop thermal circuit of the cable. A very close results of equations and COMSOL are achieved which confirms the validation of the heat transfer model. The evaluated temperature shows the safety performance of the cable under thermal condition as its temperature is far from the maximum permissible value which is 90 °C. The temperature difference between the conductor and sheath is around 6 °C. The temperature rise percentage is 4.61% when the time changes from 100 h to 1000 h.
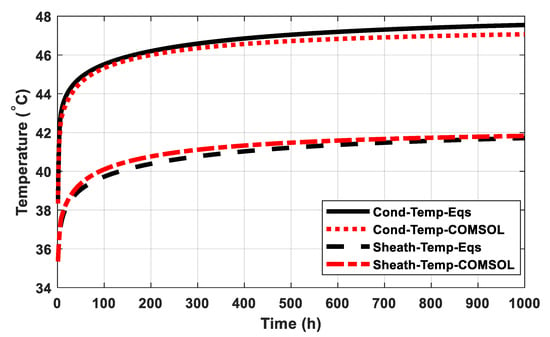
Figure 12.
The cable and sheath temperature variation through long duration.
4.2. Transient Cable Temperature
Based on the daily load cycle published in [24], the corresponding load currents similar to the published performance is considered and mentioned as “Load performance 1” as shown in Figure 13. Further performances are considered such as the step changing from 1000 A to 900 A repeatedly and the maximum continuous load 1000 A as shown in Figure 13 and indicated by “Load performance 2” and “Load performance 3”, respectively. The corresponding transient temperatures of the conductor and sheath based on these load performances under study are shown in Figure 14a,b, respectively. From the corresponding temperature behavior concerning Load performance 2, there are the accumulations of the conductor and sheath temperatures, where the current for the second maximum current 1000 A has a higher temperature comparing to the period during the first maximum current (temperature period (8–12 h)) although the same loading current of 1000 A. From the corresponding temperature behavior concerning Load performance 1, comparing the temperature performance through the periods (8–12 h (1000 A) and 16–20 h (960 A)) results temperature during 960 A higher than 1000 A. Therefore, changing loads have to be considered especially from lower value to highest one.
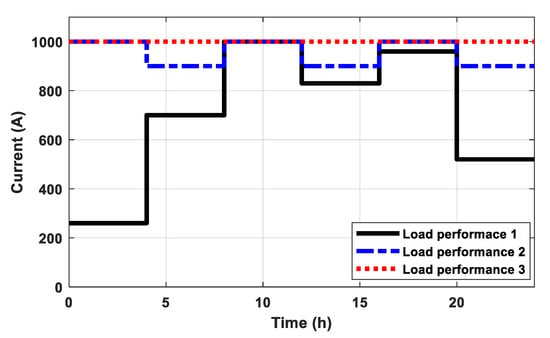
Figure 13.
Daily load cycle and step load performance.
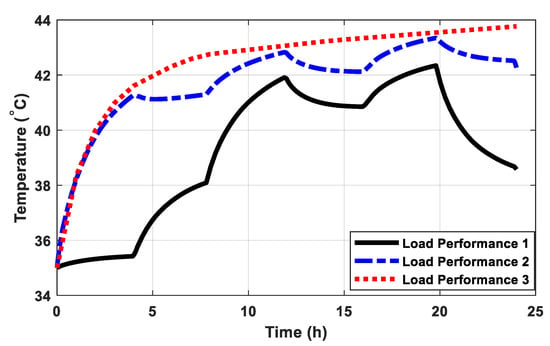
Figure 14.
The cable and sheath temperatures variation through different daily load cycle.
4.3. Impact of Dry Zone Formation on Temperature Performance
Dry zone can be formed around the underground cable due to the heating resulting from high temperature. In this study, dry zone thickness varies from 40 mm to 500 mm around the cable. The resistivity of the formation dry zone is assumed as 2.5 K·m/W. Considering maximum continuous load (1000 A), Figure 15a shows the conductor temperature rise under several thicknesses of dry zone. It shows that the temperature is raised by 15% when the dry zone thickness reaches to 500 mm. The same performance is declared from Figure 15b for sheath temperature.
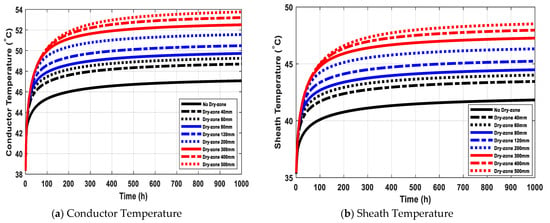
Figure 15.
Impact of dry zone thickness on the temperature rise.
5. Conclusions
The cable ampacity and temperature distribution through the cable layer can be computed based on the IEC 60287 standard using an analytical method that was applied on equivalent two-loop thermal circuit. The analytical method considered some ideal assumptions such as using the ground as a constant temperature boundary and considered the temperature of the cable layer is constant. The results of the computed cable ampacity based on the equivalent two-loop thermal circuit indicated that cable configuration, the soil resistivity, the soil temperature, and the cable depth have a great effect on the cable ampacity. Due to the shortage and ideal assumption in the analytical method in IEC 60287 standard, a numerical method as finite element method was used. COMSOL Multiphysics has been used as an accurate software to evaluate the temperature performance of the cable and sheath concerning thermal model. These performances have been studied considering different loads (typical, step, and maximum load cycles). The magnitudes impact of previous loading periods on the temperature performance have been investigated as accumulated temperature attitude. Effect of dry zone formation around the cable on the temperature behavior has been evaluated, as the temperature rise increased with increasing the thickness of the dry zone taking the same pattern along the studied period.
Author Contributions
Conceptualization, S.S.M.G.; methodology, S.S.M.G., N.A.S.; software, S.S.M.G., N.A.S.; validation, S.S.M.G., N.A.S., M.A.; formal analysis, N.A.S.; investigation, S.S.M.G., N.A.S.; resources, S.S.M.G.; data curation, S.S.M.G., M.A.; writing—original draft preparation, S.S.M.G., N.A.S.; writing—review and editing, M.A.; visualization, N.A.S.; supervision, S.S.M.G.; project administration, S.S.M.G., N.A.S.; funding acquisition, M.A. All authors have read and agreed to the published version of the manuscript.
Funding
This research was funded by TAIF UNIVERSITY RESEARCHERS SUPPORTING PROJECT, grant number TURSP-2020/146” and “The APC was funded by Mahrous Ahmed”.
Institutional Review Board Statement
Not applicable.
Informed Consent Statement
Not applicable.
Data Availability Statement
Not applicable.
Acknowledgments
The authors would like to acknowledge the financial support received from Taif University Researchers Supporting Project Number (TURSP-2020/146), Taif University, Taif, Saudi Arabia.
Conflicts of Interest
The authors declare no conflict of interest. The funders had no role in the design of the study; in the collection, analyses, or interpretation of data; in the writing of the manuscript, or in the decision to publish the results.
References
- Aras, F.; Oysu, C.; Yilmaz, G. An assessment of the methods for calculating ampacity of underground power cables. Electr. Power Compon. Syst. 2005, 33, 1385–1402. [Google Scholar] [CrossRef]
- Neher, J.H.; McGrath, M.H. The calculation of the temperature rise and load capability of cable system. AIEE Trans. 1957, 76, 752–772. [Google Scholar] [CrossRef]
- IEC Publication 60287. Calculation of the Continuous Current Ratings of Cables; IEC: Geneva, Switzerland, 1982. [Google Scholar]
- Cigre TB640: A Guide for Rating Calculations of Insulated Cables; Working Group B1.35: Paris, France, 2015.
- IEC 60949-1988. Calculation of Thermally Permissible Short-Circuit Currents, Taking into Account Non-Adiabatic Heating Effects, 1st ed.; International Electrotechnical Commission: Geneva, Switzerland, 2008. [Google Scholar]
- Freitas, D.S.; Prata, A.T.; DeLima, A.J. Thermal performance of underground power cables with constant and cyclic currents in presence of moisture migration in the surrounding soil. IEEE Trans. Power Deliv. 1996, 11, 1159–1170. [Google Scholar] [CrossRef]
- Hiranandani, A. Calculation of conductor temperature and ampacities of cable systems using a generalised finite element model. IEEE Trans. Power Deliv. 1991, 6, 15–29. [Google Scholar] [CrossRef]
- Hwang, C.C.; Jiang, Y.H. Extensions to the finite element method for thermal analysis of underground cable systems. Electr. Power Syst. Res. 2003, 64, 159–164. [Google Scholar] [CrossRef]
- Zaytsev, E. Development of Calculation Methodology of Thermal Equivalent Circuit’s Parameters for Predicting Temperature of High Voltage Cable Lines 110–500 kV. Appl. Mech. Mater. 2015, 792, 272–279. [Google Scholar] [CrossRef]
- Yang, L.; Qiu, W.; Huang, J.; Hao, Y.; Fu, M.; Hou, S.; Li, L. Comparison of Conductor-Temperature Calculations Based on Different Radial-Position-Temperature Detections for High-Voltage Power Cable. Energies 2018, 11, 117. [Google Scholar] [CrossRef]
- Diaz-Aguiló, M.; de León, F. Introducing Mutual Heating Effects in the Ladder-Type Soil Model for the Dynamic Thermal Rating of Underground Cables. IEEE Trans. Power Deliv. 2015, 30, 1958–1964. [Google Scholar] [CrossRef]
- Nielsen, T.V.M.; Jakobsen, S.; Savaghebi, M. Dynamic Rating of Three-Core XLPE Submarine Cables for Offshore Wind Farms. Appl. Sci. 2019, 9, 800. [Google Scholar] [CrossRef]
- Xiong, L.; Chen, Y.; Jiao, Y.; Wang, J.; Hu, X. Study on the Effect of Cable Group Laying Mode on Temperature Field Distribution and Cable Ampacity. Energies 2019, 12, 3397. [Google Scholar] [CrossRef]
- Voršič, Ž.; Maruša, R.; Pihler, J. New Method for Calculating the Heating of the Conductor. Energies 2019, 12, 2769. [Google Scholar] [CrossRef]
- Anders, G.J. Rating of Electric Power Cables in Unfavorable Thermal Environment; John Wiley & Sons, Inc.: Hoboken, NJ, USA, 2005. [Google Scholar]
- IEC Standard 60853-1. Calculation of the Cyclic and Emergency Current Ratings of Cables. Part I: Cyclic Rating Factor for Cables up to and Including 18/30 (36) kV; Publication 853-1: Geneva, Switzerland, 1985. [Google Scholar]
- IEC Standard 60853-2. Calculation of the Cyclic and Emergency Current Ratings of Cables. Part 2: Cyclic Rating Factor of Cables Greater than 18/30 (36) kV and Emergency Ratings for Cables of All Voltages; Publication 853-2: Geneva, Switzerland, 1989. [Google Scholar]
- Anders, G.J.; El-Kady, M.A. Transient Ratings of Buried Power Cables Part 1: Historical Perspective and Mathematical Model. IEEE Trans. Power Deliv. 1992, 7, 1724–1734. [Google Scholar] [CrossRef]
- Dorison, E.; Anders, G.J.; Lesur, F. Ampacity Calculations for Deeply Installed Cables. IEEE Trans. Power Deliv. 2010, 25, 524–533. [Google Scholar] [CrossRef]
- Heggås, M. Dynamic Rating of Power Cables Based upon Transient Temperature Calculations. Master’s Thesis, Norwegian University of Science and Technology, Trondheim, Norway, June 2019. [Google Scholar]
- IEEE Std 442-1981. IEEE Guide for Soil Thermal Resistivity Measurement; IEEE: Washington, DC, USA, 1981; pp. 1–16. [Google Scholar]
- Nahman, J.; Tanaskovic, M. Calculation of the ampacity of high voltage cables by acounting for radiation and solar heating effects using FEM. Eur. Trans. Electr. Power 2013, 23, 3301–3314. [Google Scholar]
- Heat Transfer Module User’s Guide; COMSOL 5.5, COMSOL, Inc.: Burlington, MA, USA; Available online: www.comsol.com (accessed on 30 December 2020).
- Rasoulpoor, M.; Mirzaie, M.; Mirimani, S.M. Thermal assessment of sheathed medium voltage power cables under non-sinusoidal current and daily load cycle. Appl. Therm. Eng. 2017, 123, 353–364. [Google Scholar] [CrossRef]
Publisher’s Note: MDPI stays neutral with regard to jurisdictional claims in published maps and institutional affiliations. |
© 2021 by the authors. Licensee MDPI, Basel, Switzerland. This article is an open access article distributed under the terms and conditions of the Creative Commons Attribution (CC BY) license (http://creativecommons.org/licenses/by/4.0/).