Article

Pore-Scale Simulations of Particles Migration and Deposition in Porous Media Using LBM-DEM Coupling Method

College of Urban Construction, Nanjing Tech University, Nanjing 211800, China
*
Author to whom correspondence should be addressed.
Processes 2021, 9(3), 465; https://doi.org/10.3390/pr9030465
Submission received: 10 February 2021 / Revised: 27 February 2021 / Accepted: 2 March 2021 / Published: 5 March 2021

Abstract

:
This paper studies the migration and deposition of suspended particles in porous media. This problem results from the fact that during the operation of a groundwater source heat pump, the recharging process will contribute to the impairment of soil permeability. A coupling lattice Boltzmann method, discrete element method and immersed moving boundary method were used to investigate the migration of particles in porous media. The DKT (Drifting, Kissing, Tumbling) phenomena were employed to validate our program. The coupled effects of concentration, flow rate and pH on the clogging mechanism of the porous media were analyzed. Results show that, due to the repulsive barrier between the particles and porous media, there is a critical velocity. At a low flow rate, the deposition ratio increases with the increase in velocity. Beyond the critical velocity, the deposition ratio decreases when the velocity increases due to higher shear force. Permeability impairment increases with the increase in concentration, especially in the low flow rate condition. Changes in pH mainly affect the repulsive barrier. For a low flow rate, the decrease in repulsive barrier greatly promotes the deposition of particles. Under the condition of favorable deposition, the increase in flow rate reduces the deposition phenomenon. Under the condition of unfavorable deposition, the lower flow rate condition has a lower deposition ratio. The process of particle deposition and the dynamic motion after deposition were observed such as particles gliding over the surface. Accumulated particles in the downstream form bridges and hinder fluid flow. At a high flow rate, strong shear force is more capable of destroying bridges and recovering permeability. Adsorbed particles glide on the surface of the grain and deposit in the downstream. This paper aims to help understanding of the micro-events of particle deposition and the clogging process.

1. Introduction

Suspended particles migration and deposition in porous media is a common issue in natural phenomena and industry processes. During the operation of the recharge system of a groundwater source heat pump system (GSHP), the problem of internal clogging in the aquifer reduces the efficiency of the recharge system, thus affecting the operation of the GSHP [1,2]. Particles invade the flow channel or pore space under the action of hydrodynamic force and strain force, resulting in reduced porosity and permeability impairment [3,4,5]. Such problems also occur in other fields including treatment of septic tank effluent and wastewater [6,7] and development of oil and gas fields [8,9]. Therefore, understanding the migration and deposition mechanism of particles in porous media and predicting the clogging formation have important academic value and practical significance.
Some studies have been carried out to tackle this problem and put forward several mathematical models. To study particle migration in porous media, some theoretical models has been developed [10,11]. However, estimating permeability value as a function of porosity, grain size, and the structure of pore space can be challenging, which limits the application of theoretical models. At present, the mainstream method to is using column experiments. Alem et al. studied the effect of hydrodynamic forces on particle migration in porous media [12]. The study shows that as the injection volume increases, the larger particles penetrate more deeply into the porous media, and the size of particles observed in the effluent gradually increases. Zhang et al. studied the influence of pore structure and flow rate on the hydrodynamic mechanism, diffusion effect and acceleration effect of particle migration and deposition in saturated porous media [13]. The result shows that with the increase in seepage velocity, the influence of hydrodynamics on the outflow concentration of particles is increasing, while the influence of pore structure is relatively weakened. In addition, several studies have been conducted about the mechanism of suspended particle transportation by experiments [14,15,16]. These column experiments provide important understanding of particle transport and deposition characteristics. Based on experiments, the process of particles deposition in porous media has been detailed before [17,18,19].
To observe the micromechanical process of particle migration, deposition and retention in experiment methods and classical modeling is still a challenge. Although, some microscopic visualization experiment techniques have had rapid development such as particle image velocimetry (PIV) [20] and magnetic resonance velocimetry (MRV) [21], it is still hard to reveal the mechanical properties of interaction between fluid and solid phase. As an alternative, numerical simulations provide a potential way to understand these processes. Computational fluid dynamics (CFD) coupled with the Discrete element method (DEM) method has been an effective tool for studying particles transportation such as fluidized bed system [22,23], particulate fouling [24,25] and some other fields [26,27,28]. By using the coupled method, the local phase velocity, spatial distribution, detailed information flow pattern of liquid phasor, particle residence time and particle trajectory can be studied. Benefiting from simplified governing equations and parallel computing performance, the Lattice Boltzmann method (LBM) coupled with DEM is more efficient than the CFD-DEM method when dealing with moving particle boundaries. Based on this method, some researches have been conducted including particle transport in flows [29,30], solid rheology [31,32] and soil fluidization [33,34]. Actually, there is seldom literature about observing particle migration behavior and clogging formation process in packed granular materials at pore scale. Parvan studied particle retention and clogging in porous media [35]. The result shows that the structure of porous media has great influence on particle migration. Zhou studied particle retention and permeability impairment in porous media [36]. They found that the size of solid particles, flow rate and particle volume fraction have great influence on permeability impairment of porous media.
This paper mainly studies the migration and deposition process of particle in porous media and the permeability impairment of porous media. Since fluid–solid interactions in porous media flow occur in pore scale, it seems more appropriate to simulate this process from a microscopic or mesoscopic perspective. Therefore, we attempt to couple the LBM-DEM to further understand the mechanism of particle migration and deposition in pore space. This study provides a microprocess observation and understanding process of GSHP recharge clogging.

2. Materials and Methods

A modified LBM under a Eulerian coordinate is used to simulate the fluid flow and a DEM soft-sphere model under a Lagrange coordinate is used to deal with the collision problems between solid phase. When dealing with a fluid–solid boundary, the immersed moving boundary method (IMB) is chosen to couple the LBM-DEM model [37]. The model considers the two-way coupled with solid phase and liquid phase and can capture the motion of particle and track the trajectory of individual particle.

2.1. Particle Governing Equations Based on DEM

DEM is a computer simulation method in which particles are specified as individual physical and mechanical properties first introduced by Cundall and Strack [38]. The motion of particles in DEM is determined by Newton’s second law. Each particle has two types of motion: translation and rotation. The motion of each particle is governed by the law of conservation of linear momentum and angular momentum. The equation of motion is numerically integrated by the finite difference method:
x i t + Δ t = v · Δ t + x i t , v i t + Δ t = F i m i · Δ t + v i t , ω i t + Δ t = T i I i · Δ t + ω i t
where i denotes the particle index; x denotes the position of particle; v denotes the velocity of particle; ω denotes the angular velocity of particle; m denotes the particle mass; I denotes the moment of inertia and ∆t denotes time step. Each particle trajectory is explicitly solved by the following force balance:
F i = F f + F c + F a d + F r e + F g
T i = T f + T c
where Ff and Tf denotes the hydrodynamic force and torque induced by fluid flow, respectively; Fc and Tc denotes the contact forces and the torque resulting from the contact forces, respectively; Fad and Fre denotes the adhesive force and repulsive force, separately; Fg denotes the gravity force.

2.1.1. Contact Force (Fc)

In this paper, we calculate the contact force between particles by the soft-sphere DEM model. Soft-sphere DEM simplify the particle interaction into a spring damper process [39]. The interaction force of each pair of contact particles can be expressed as:
F c = F c n + F c t
F c n = ( k n δ n + η n V i j n n i j ) n i j
F c t = min ( ζ · | F c i j n | , k t i j δ i j t + η i j t V i j t t i j ) t i j
where n and t denote the normal and tangent unit vectors, respectively; Fcn and Fct denotes the normal and tangent contact forces, respectively. As Figure 1 shows, when two particles collide, the deformation of the interface is replaced by two overlaps. δn and δt denotes the normal and tangent overlap length, respectively; Vijn and Vijt denote the relative velocity at the normal and tangent contact point, respectively; kn and kt denotes normal and tangent stiffness constant, respectively. ηn and ηt denote normal damping constant and tangent damping constant, respectively and ζ denotes the friction coefficient. The spring coefficients are related to the Young’s modulus and Poisson’s ratio [40]. Additionally, η is features the restitution coefficient σ and the reduced mass mij = mi·mj/(mi + mj), and in our simulations, we always choose ηn = ηt:
η i j n = η i j t = 2 ln σ m i j k n i j π 2 + l n 2 σ
In the static friction stage, the tangential force is derived from the tangential displacement and damping of the particles. When the tangential force crosses the threshold, the friction turns to dynamic friction. At this point the tangential force is a function of the absolute value of the normal force. In addition, the model considering rolling friction, additional torque is added according to the following equations:
T c = r i · ( F c t × n )
The spring in the normal and tangential direction accounts for the elastic part of the impact force, while the dashpot accounts for the energy loss during the collision. The duration of the collision event can be calculated by the following [41].
T = 2 π m i j 4 m i j k n η n 2
When the contact between particles occurs, the force and torque acting on the particles are calculated by Equations (4)–(8).

2.1.2. Long-Range Force

The long-range force is mainly calculated by DLVO theory in this paper [42]. Van der Waals force and electric double-layer force are considered to be the dominant forces in DLVO theory [43]. Van der Waals interaction is a microscopic scale attraction originating from permanent and induced electrical interactions between two or more atoms or molecules. Van der Waals force between particles can be calculated by Hamaker expression [44]:
F a d = A H ( 4 r i r j ) 3 6 ( S ij ( S ij 2 ( r i + r j ) 2 ) 2 · ( S ij 2 ( r i + r j ) 2 + 4 r i r j ) 2 )
where Sij denotes the center-to-center distance between the two particles; AH is the Hamaker constant. As can be seen from the formula, Van der Waals energy is generally only related to the size of the particles and the distance between the particles and the surface of the medium. The major repulsive force between particles is electric double-layer force. Analysis expression of force of electric double-layer can be obtained by Debye approximation method:
F r e = 64 π ε r ε 0 κ ( R T F z ) · t a n h ( F z ψ i 4 R T ) · t a n h ( F z ψ j 4 R T ) · r i r j r i + r j e κ h i j
where εr denotes the permittivity of vacuum; ε0 denotes the dielectric constant of the medium; R denotes the gas constant; F denotes the Faraday constant; ψ denotes the zeta-potentials of the surface; z denotes the valence of the background electrolyte; hij denotes the distance between particle surfaces and κ is the reciprocal of Debye length, the expression is as follow:
κ = ( 2 × 10 3 e l 2 N A I ε r ε 0 k b T ) 0.5
where el denotes the electronic basic charge; NA denotes the Avogadro constant and I denotes the ionic strength of solution. DLVO theory is based on the direct collision hypothesis, and does not consider the motion and force caused by collision. For particle size is higher than micron, the force on particle collision cannot be ignored [45]. When Sij approaches zero, there will be numerical singularity problems in Equation (11), which is physically and practically unrealistic. Some research solves the problem by using a cut-off distance (0.1–0.2 nm) between the surfaces of a given particle [46,47]. When simulate adhesive particles contact, the JKR (Johnson, Kendall and Roberts) theory give good predictions of the contact size [48]. In this paper, we use JKR equation to calculated adhesive force Fad when two particles come close to physically contact each other [49]:
F a d = 1.5 π r i r j / ( r i + r j ) w i l j
where wilj is surface adhesive energy determined by interfacial energy.

2.2. Fluid Governing Equations Based on LBM

The Lattice Boltzmann Method (LBM) is a fluid dynamics numerical solution based on the molecular motion theory and statistical mechanics [50]. In LBM, the flow field of fluid is divided into regular grids, and the fluid is regarded as a group of fluid particles at the grid nodes. The flow process of the fluid can be obtained by using the lattice Boltzmann equation to solve the collision function and the migration function of each grid node. The Lattice Boltzmann equation has two main models used to deal with the collision process between fluid particles: Bhatnagar–Gross–Krook model (BGK) based on the theory of single relaxation time and Multiple Relaxation Time model (MRT). Due to the good computational efficiency of BGK, in this paper we use BGK to deal with the collision process. In BGK, the Boltzmann equation reads as:
f i ( x + c i Δ t , t + Δ t ) = f i ( x , t ) Δ t τ BGK ( f i ( x , t ) f i eq ( x , t ) )
where ci denotes the discrete lattice velocity; fi (x, t) denotes the density distribution function for a fluid node moving with velocity ci at position x and time t; Δt denotes the time step; τBGK denotes the relaxation time; f i eq (x, t) denotes the local equilibrium distribution function of fi (x, t), It is usually expressed as a discrete Maxwell distribution function:
f i eq ( x , t ) = w i ρ [ 1 + c i · u c s 2 + ( c i · u ) 2 2 c s 4 u 2 2 c s 2 ]
where wi denotes weight factor; ρ denotes fluid density; u denotes fluid velocity; cs denotes lattice sound velocity. DnQm can be used to divide BGK models with different discrete speeds in the division of grid. Where n denotes the spatial dimension and m denotes the number of discrete velocity directions. In this paper, we use D2Q9 model. In this model cs = c/√3, where c = Δxt; Δx denotes the lattice distance; Δt denotes the time step. In the model, the 9 direction velocity vectors and weighing factors can be expressed as:
c i = c [ 0 1 0 1 0 1 1 1 1 0 0 1 0 1 1 1 1 1 ]
w i = { 4 9 ,   i = 0 1 9 ,   i = 1 ,   2 ,   3 ,   4   1 36 ,   i = 5 ,   6 ,   7 ,   8
According to the above formula, the density distribution function at the lattice point can be obtained. The density ρ, velocity u and pressure P of the fluid can be calculated by the density distribution function:
ρ = i = 0 8 f i , ρ u = i = 0 8 c i f i , P = c s 2 ρ
In addition, the kinematic viscosity of the fluid ν is expressed as:
ν = c s 2 ( τ BGK 1 2 ) Δ t

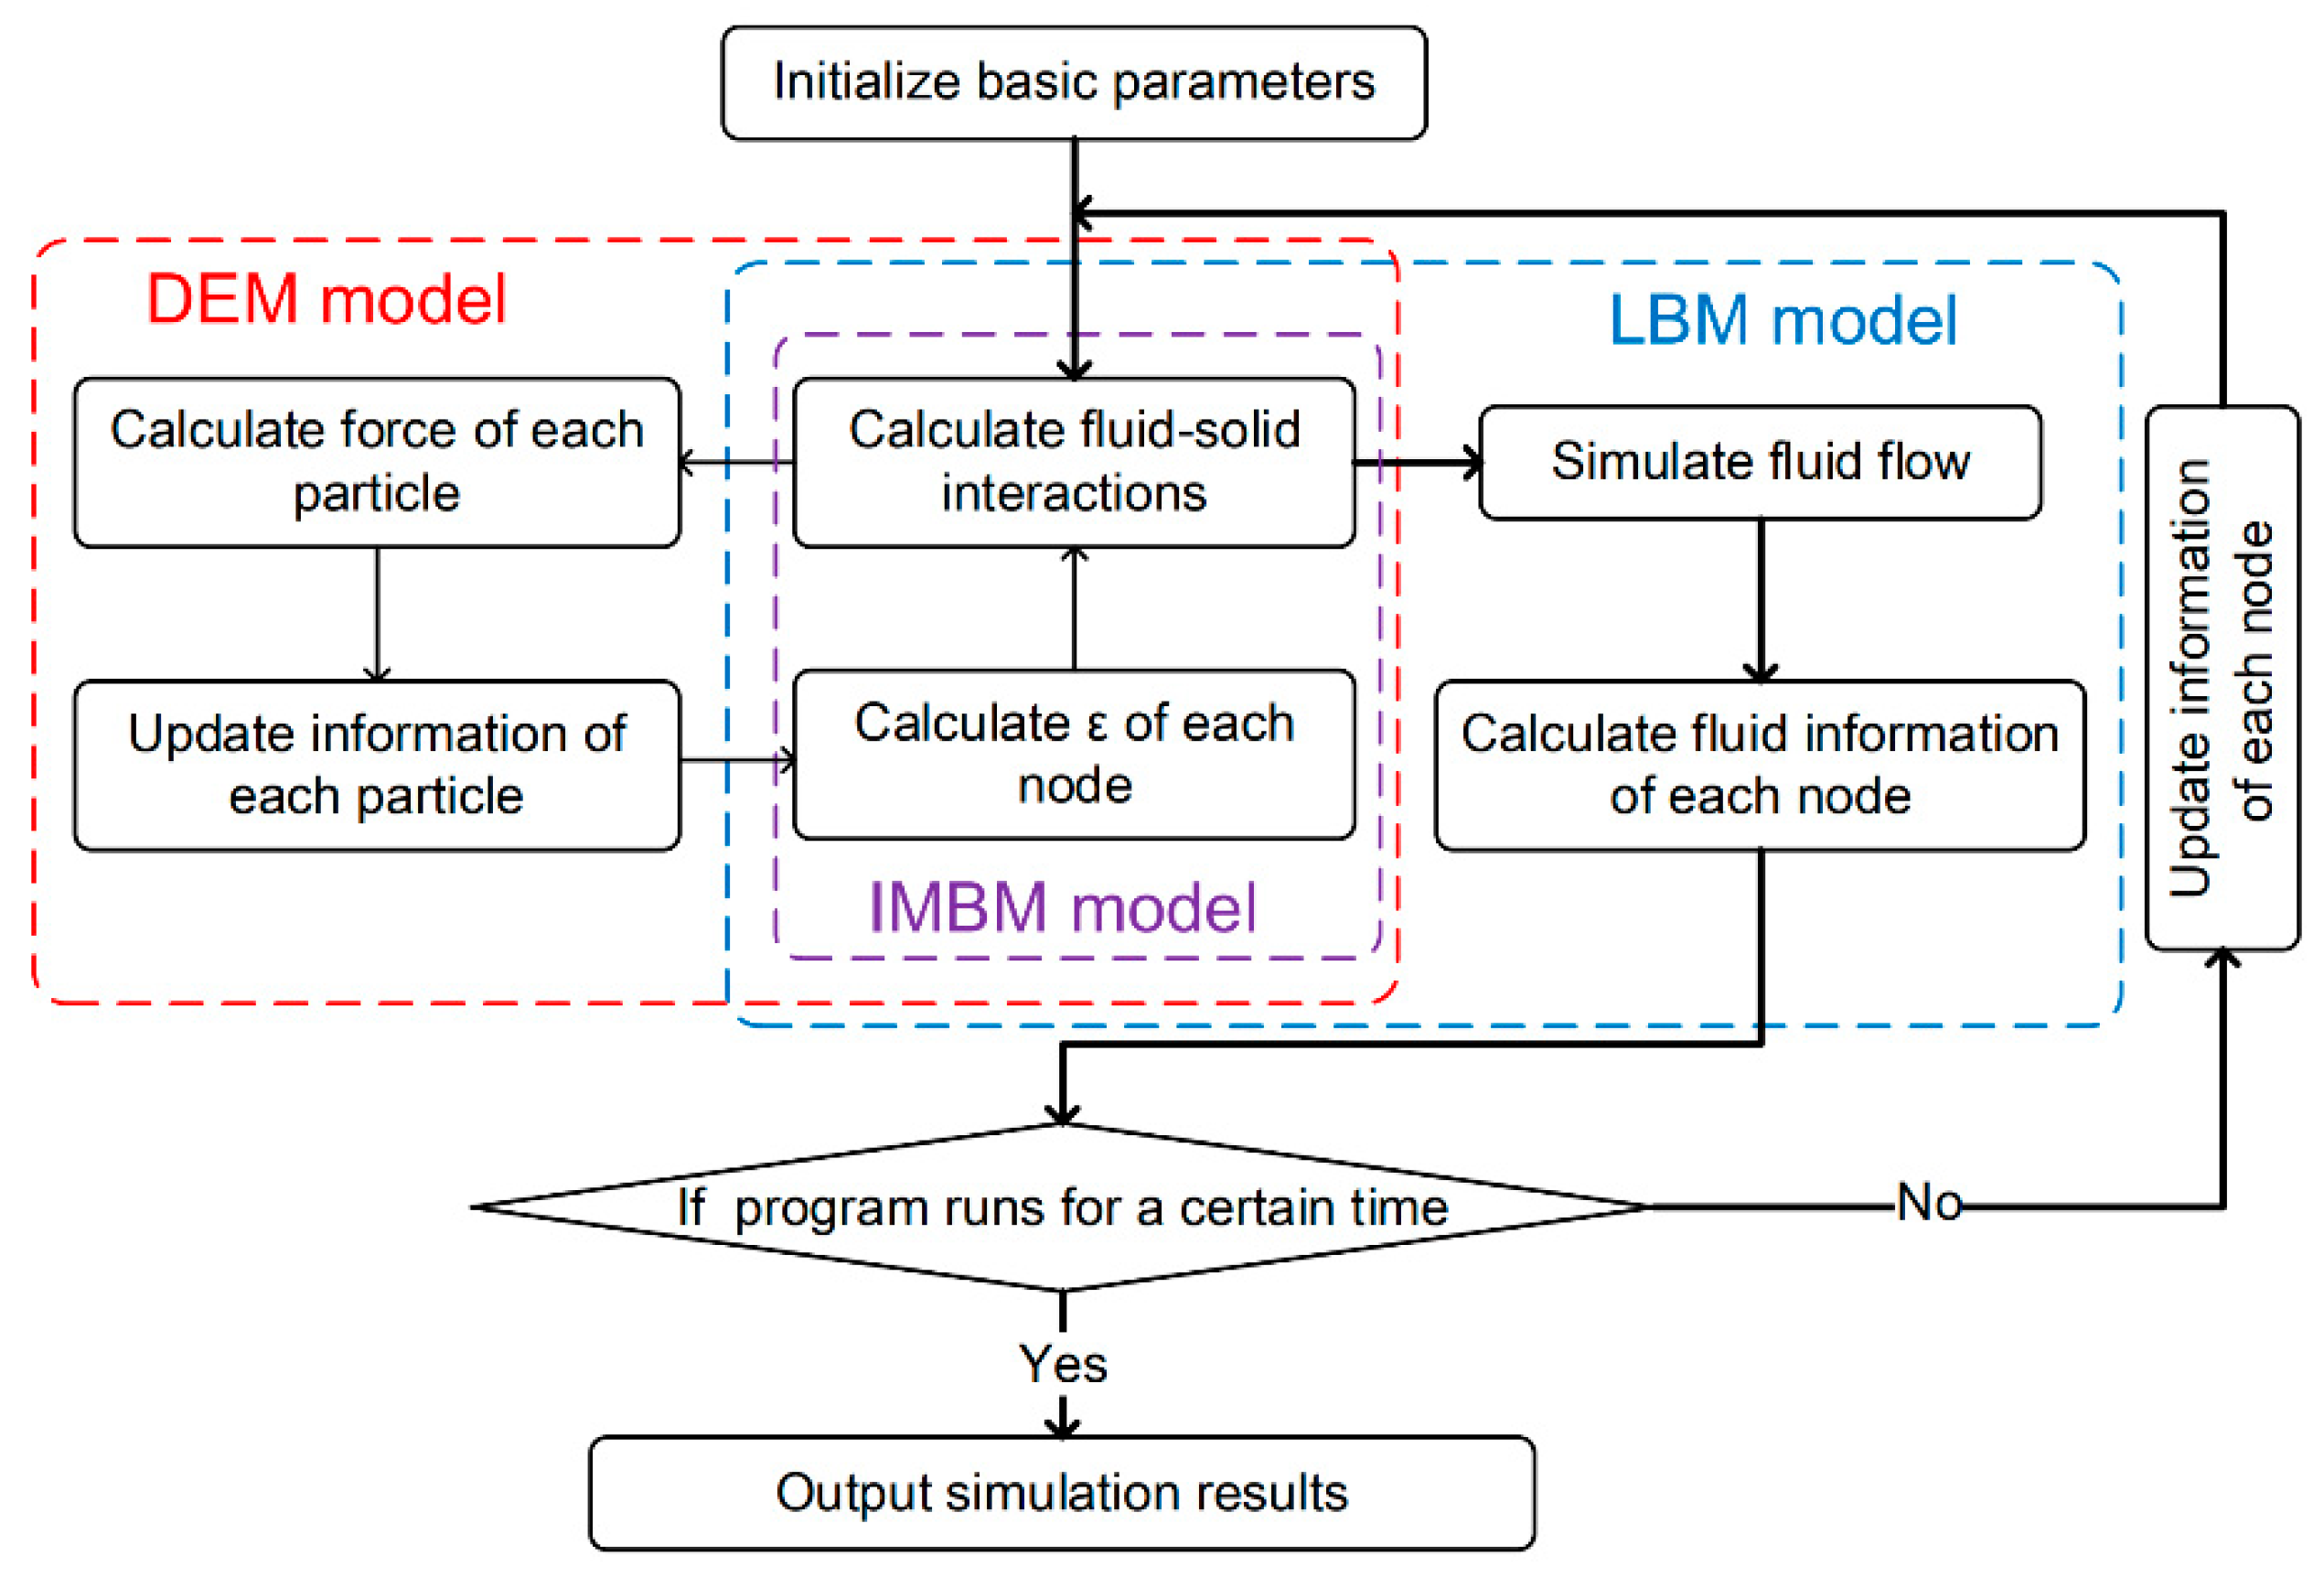
2.3. The LBM-DEM Coupled Method

In dealing with the interactions between fluid flow and particle movement, Noble et al. proposed a scheme of immersion boundary method in which an additional collision term is added to the Boltzmann equation to reflect the effect of solids on fluid flow [37]. The method has been proved to have sufficient stability in calculating hydrodynamic forces [51]:
f i ( x + c i Δ t , t + Δ t ) = f i ( x , t ) ( 1 B s ) [ Δ t τ BGK f i ( x , t ) f i eq ( x , t ) ] + B s Ω i s
where Ωis denotes the additional collision terms for nodes overlapping with solids; Bs is the weight coefficient related to εs:
Ω i s = [ f i ( x , t ) f i eq ( ρ , u ) ] [ f i ( x , t ) f i eq ( ρ , v p ) ]
B s ( ε s , τ BGK ) = ε s ( τ BGK Δ t 1 2 ) ( 1 ε s ) + ( τ BGK Δ t 1 2 )
where εs is percentage of solids in lattice. As Figure 2 shows, when εs = 0 the lattice is in the flow field; and εs = 1, the lattice is located at the internal node of the solid. When εs is between 0 and 1, the lattice is located at the boundary between solid and fluid. The value Bs can be obtained by determining the εs of each node. Therefore, when the particle invades LBM cell, the process of cell transform from fluid node to solid node is gradual. This improves the stability in calculating fluid flow. The drag force and torque acting on the particle induced by fluid flow can be calculated from the following equations:
F f = k = 1 n ( B s ( k ) · i = 0 8 Ω i s c i )
T f = k = 1 n ( ( x r x j ) × B s ( k ) ( i = 0 8 Ω i s c i ) )
where n denotes the total number of nodes overlapped by particles; (xrxj) denotes the relative position of the rth node to the particle j center.
Based on the above algorithm, the coupling model based on LBM and DEM is established. Figure 3 shows the process for the LBM–DEM simulation. After the initial conditions of the flow field and the particles are set, at each step of fluid computational motion, executes the DEM cycle. The DEM time step is commonly limited by the explicit schemes due to stability considerations. To improve the DEM calculation accuracy, an extremely short time step should be considered when particles contact, which is much smaller than time scale of fluid motion. Multi-time scale calculation method is used to solve the difference between solid and fluid time scale. We use the fluid time step to evolve particles that are not involved in a collision and a much smaller time scale to evolve particles that are involved in a collision.

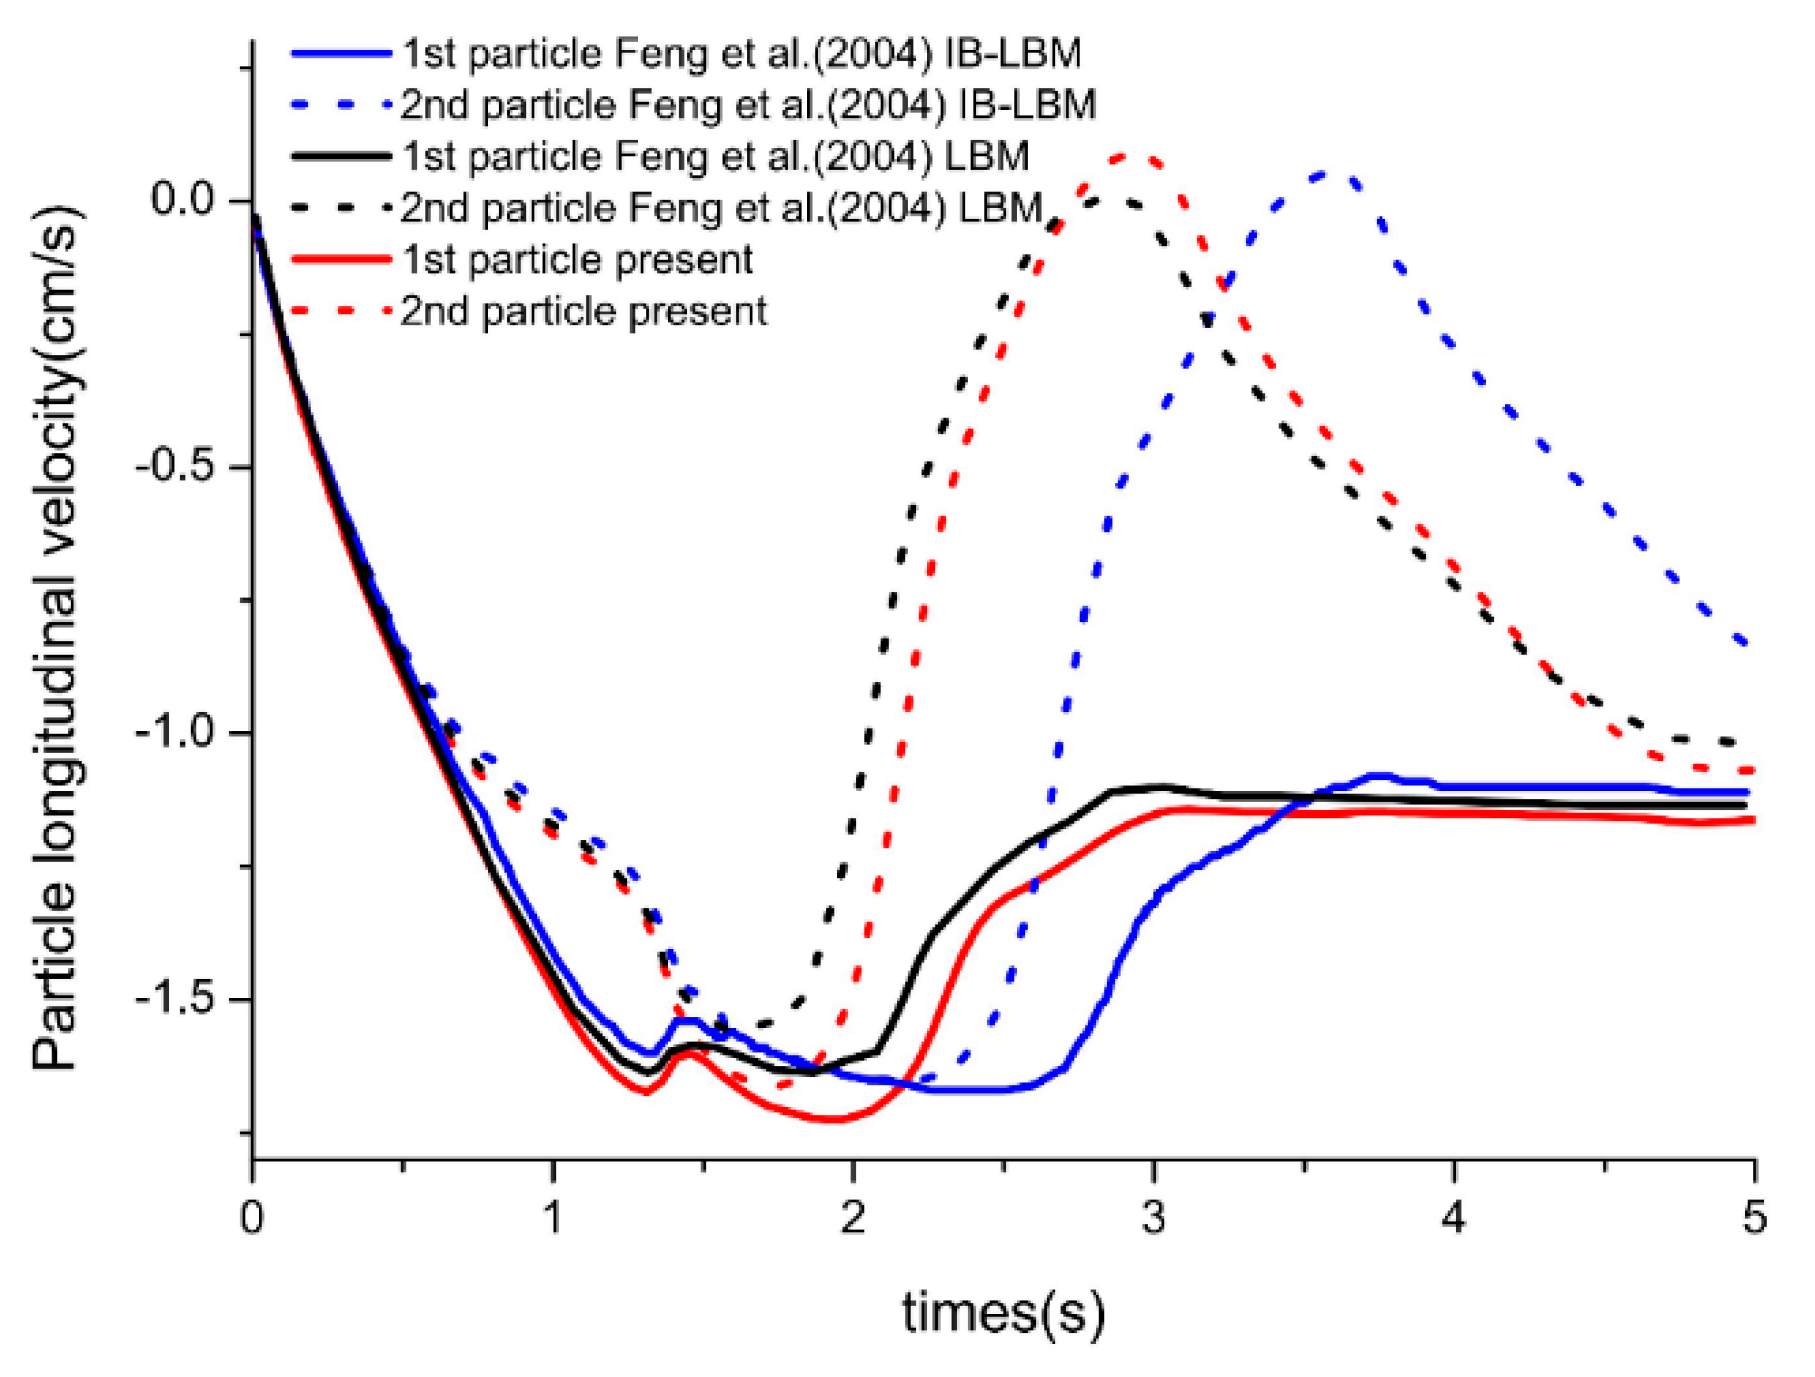
3. Model Verification

To verify the accuracy of the coupled LBM-DEM model in this paper, the sedimentation process of two particles falling in the rectangular channel which is known as the DKT phenomenon is simulated. In this model, the channel length is 8 cm, width is 2 cm, and the non-slip boundary condition is applied to all walls. The length of the unit grid is 0.01 cm × 0.01 cm. The particle density is 1.01 g/cm3 and radius is 0.2 cm. The initial position of first particle is (0.99 cm, 7.2 cm) and the position of second particle 2 is (1 cm, 6.8 cm). The fluid kinematic viscosity is 1 × 10⁻⁶ m2/s and the density of the fluid is 1 g/cm3.
At the beginning, the fluid is stationary and the particles begin to move by gravity. The Figure 4 shows the state of the two deposited particles at each time, showing the collision and rolling process between the particles. Figure 5 shows the change of longitudinal velocity of particles over time and compared with previous working data [52]. Results have a good match with Feng LBM program but there are some differences with Feng IB-LBM program. The difference of simulation results mainly reflects on the time of collision between the two particles. In Feng’s calculation, the process lasted about 0.9 s, while in this paper only 0.4 s. This difference depends on the different ways of dealing with boundaries, but the state of the particles before and after contact is close. The accuracy of this coupled LBM-DEM method is acceptable compared with the previous experimental results.

4. Results and Discussion

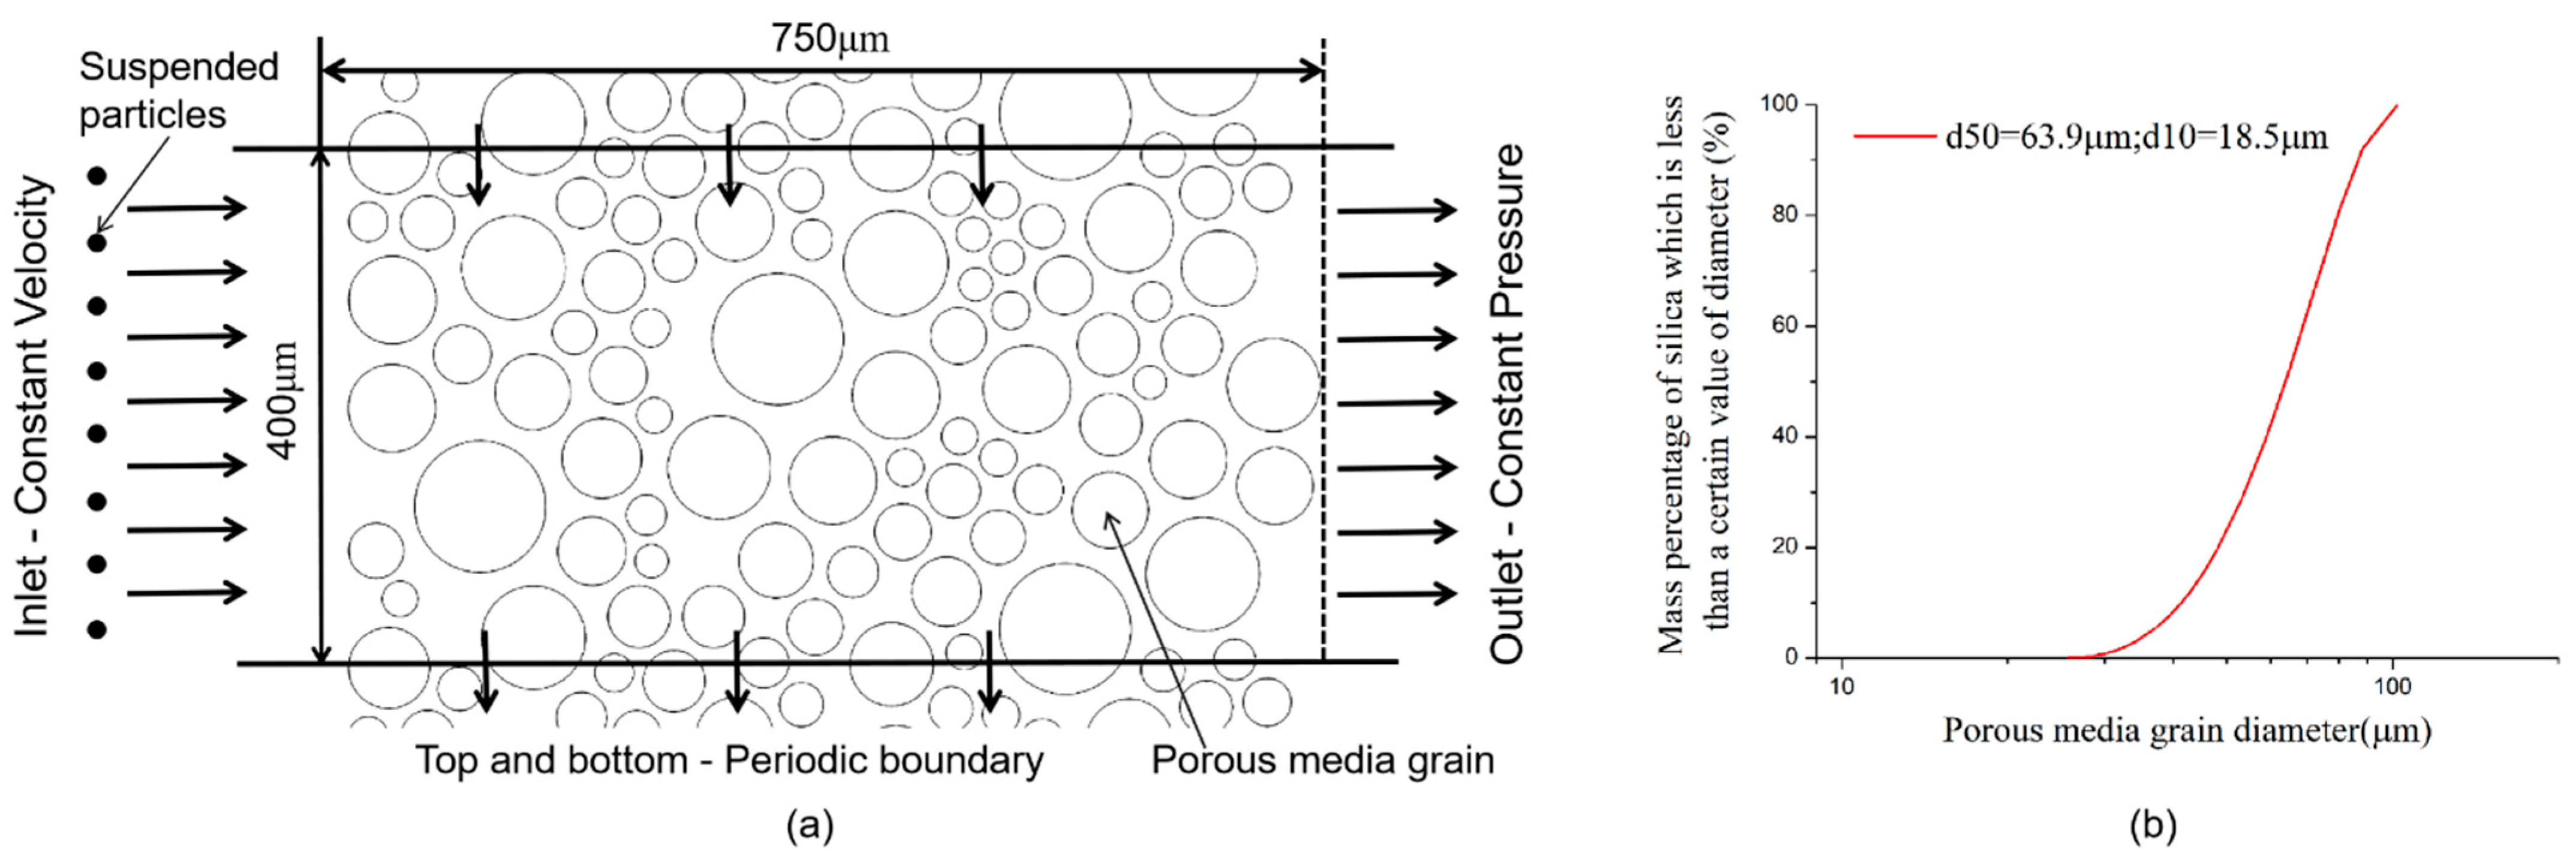
4.1. Simulation Method and Conditions

Artificial recharge water in GSHP has the characteristics of low nutrition, low ionic strength and large difference of ionic composition [53]. The particle size of micro-solids in recharging water ranges from millimeters to nanometers. Porous media are constructed by randomly generated circle grains, and then imported into the LBM calculation model by image processing technology. These skeleton grains remain fixed during subsequent numerical calculations. As Figure 6a shows, the length of the model is 750 μm and the width is 400 μm. Simulation area is divided into 750 × 400 grids. The left side is a constant velocity boundary, the right side is a constant pressure boundary, and the top and bottom boundary are the periodic boundary. The porous model porosity is 0.45 and the initial permeability is 5.5 μm2. Figure 6b shows the diagram of particle diameter statistical distribution for porous media. In order to accelerate the process of particle aggregation and deposition, a smaller particle size ratio was selected. The particle size ratio dp/d50 = 0.06 (here dp is diameter of particle and d50 is the mean diameter of porous particle grain). In this paper, we use pore volume (PV) through the entrance of porous media as a measure of time, which is defined as the ratio of the volume of water flowing through porous media to the total pore space volume:
PV = V i n V p
where Vin denotes the volume of injected liquid; Vp denotes the volume of pore space. By using PV instead of time, the influence of pore volume and velocity difference on the experimental results can be eliminated. At the beginning of the simulation, the fluid flows through the porous media until the flow field is stable, and the time is set to the initial time (PV = 0). Particles continually added from the entrance until PV = 3. The basic parameters of the simulation study are summarized in Table 1.

4.1.1. Data Processing

Permeability is a key factor in porous media, which determines the resistance of fluid flowing through it. The retention of particle changes the porosity of the porous media and preferential flow path, thus affecting the permeability. According to Darcy law, permeability in LBM units can be written as:
k = v μ L Δ P
where k denotes the permeability; μ denotes the viscosity of fluid; L denotes the length of the porous media; ∆P denotes the pressure drop. In order to assess the severity of permeability damage, dimensionless remaining permeability is defined as:
k r = k k 0
where kr denotes the percentage of remaining permeability; k0 denotes the initial permeability of porous media. In breakthrough curves, the normalized concentration Cr is a function of PV:
C r = C o u t C 0
where Cout and C0 are the volume concentrations in the effluent and influent, separately. To analyze the difference of particle deposition and migration under different conditions, the deposition ratio is determined as percentage of particles retained (Mr).

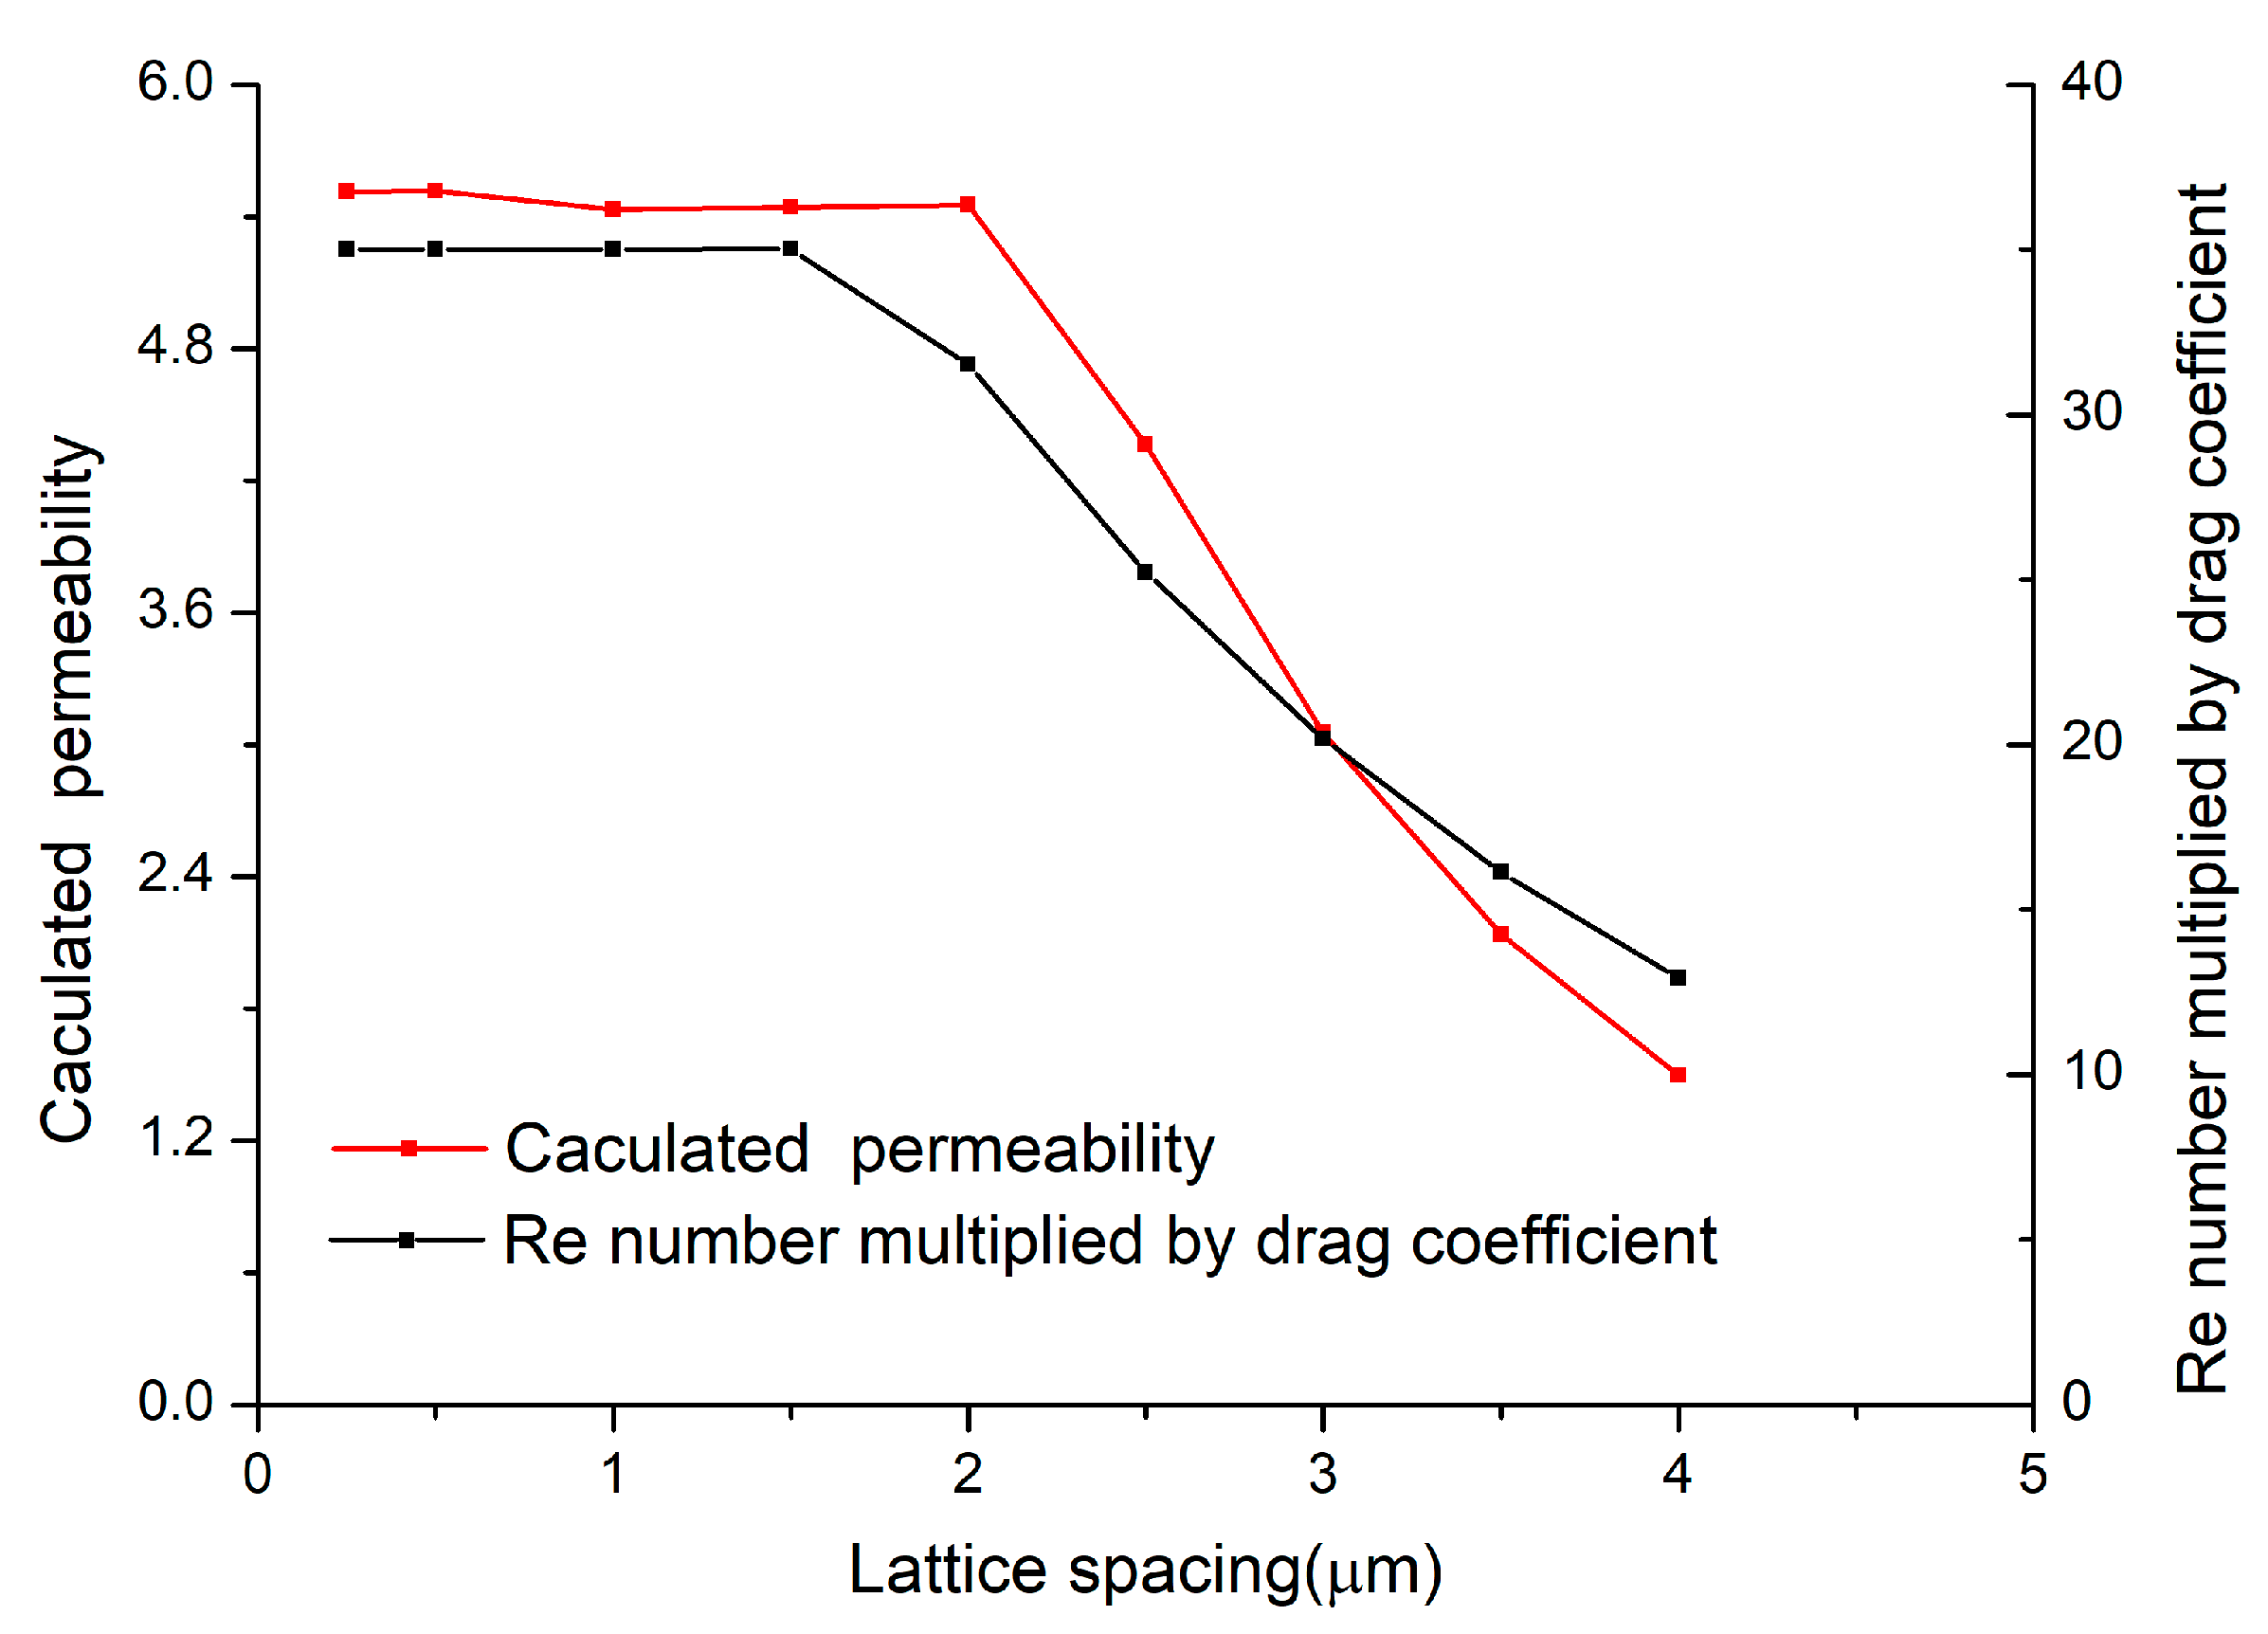
4.1.2. Grid-Independence Test

Before we proceed further, the effect of the mesh is considered by a large number of numerical simulations, as shown in the Figure 7, permeability is independent of mesh size as long as the lattice spacing is not smaller than 5 × 10⁻⁷ m. Hydrodynamics of fluid applied to particles are calculated by IMBM. When the lattice spacing is less than 10−6, the force on the particle is independent of the lattice spacing. Therefore, we will use this lattice spacing in the following simulation.

4.2. Analysis of Simulation Results

4.2.1. Coupling Effect of Flow Rate and Concentration

This section mainly discusses the retention characteristics of particles and the permeability damage of porous media under different conditions. Particle migration and deposition in porous media of different inlet flow rate (vin = 4, 7, 12, 24 mm/s) and concentration (C0 = 0.005, 0.01, 0.02) was simulated. The suspension is under condition of low ion and neutral suspension. Figure 8 shows the breakthrough curve of effluent concentration and deposition ratio with different concentration condition. When C0 = 0.005, with the increase in inlet flow rate, the plateau values of Cr were 1.1, 0.5, 0.56, and 0.5, respectively; the deposition ratio was 6%, 64%, 61%, and 59%, respectively. In aqueous solution at normal temperature, both silica and kaolin have a negative charge on the surface. This formation creates an electrical double layer and due to low ionic strength, the electric double-layer repulsive force has a long range of action. In low concentration condition (C0 = 0.005), the case vin = 4 mm/s has the lowest deposition ratio. Due to the high repulsive barrier, the deposition of particle on porous media is limited at low flow rates. When inlet flow rate vin = 7 mm/s, the particles have enough hydrodynamic force to break through the exclusion barrier and deposit on porous media. Beyond the velocity of 7 mm/s, with increasing inlet velocity, the particles tend to be trapped by porous media grain, but disengaged under stronger hydrodynamic shear and the time reaching the peak value of Cr increased. Therefore, there is a critical velocity has highest deposition ratio. This point has been found in previous experiments, especially with high repulsive barrier [55,56]. When C0 = 0.02, with the increase in inlet flow rate, the plateau values of Cr were 0.6, 0.32, 0.28, and 0.59, respectively; the retention rate was 53%, 73%, 76%, and 53%, respectively. As Figure 8d shows, for low velocity (vin = 4.0 mm/s), the deposition ratio increased significantly with increasing of concentration. However, for condition vin = 7.5 mm/s and vin = 12 mm/s, C0 = 0.01 has the lowest deposition rate. For high velocity (vin = 24.0 mm/s), concentration has little effect on deposition ratio. The interference between particles may promote the process both the deposition of particles and the release of deposited particles. Therefore, the effect of concentration on particle migration and deposition in previous studies is not clear [57,58].
Furthermore, the impairment of permeability was observed. Figure 9 shows the transient remaining permeability. The permeability impairment of porous media is similar at low concentration and the permeability for each case is almost unaffected, even if the deposition ratio is really different. When C0 = 0.01 and 0.02, the permeability impairment of case vin = 4 mm/s is more serious although the deposition rate is lowest. Figure 10 shows a few snapshots of particle retention in the porous media. It can be found that although the deposition ratio is lowest at low flow rate (vin = 4 mm/s), when the particle bridging occurs, it is difficult to destroy bridge due to low shear force. The high shear force at high velocity is more capable to destroy the stability of the bridge. As a result, with the increasing of flow rate, the permeability impairment decreases even with higher deposition ratio.

4.2.2. Coupling Effect of Flow Rate and pH

In groundwater environment, the suspension is slightly acidic or alkaline due to the action of microorganisms. For different pH conditions, the surface electric charge of particle and porous media grains will change, which will affect the interaction between suspensive particle and porous media, and then affect the deposition of particle. The decrease in pH makes the value of the zeta potential of particle and porous media increase and the absolute value decrease, which is beneficial for particle deposited on porous media. In this paper, we assume that particle have the same zeta potential as porous media. When the pH was 5.5, 7, and 9, the value of zeta was −23, −30, and −40 mV, respectively. Figure 11 shows the potential energy curves between particles and porous media grains under different pH condition. When the pH was 5.5, 7, and 9, the repulsive barrier is 1400 KT, 2800 KT, and 5300 KT, respectively. The secondary potential well is lower than 1 KT and can be neglected under hydrodynamic action.
Figure 12a–c shows the breakthrough curve of effluent concentration with different pH condition (pH = 5.5, 7, 9). When the suspension is slightly acidic (pH = 5.5), and the repulsive barrier is slow, as the flow rate increased from 4 to 12 mm/s, the plateau values of Cr was 0.35, 0.4, 0.47, and 0.67, respectively; the retention rate was 69%, 66%, 60%, and 55%, respectively. When the suspension is slightly alkaline (pH = 9), as the flow rate increased from 4 to 12 mm/s, the plateau values of Cr was 1.04, 0.86, 0.45, and 0.46, respectively and the deposition rate was 2%, 34%, 61%, and 65%. In the slightly acidic suspension with lower repulsive barrier, the retention rate decreases with the increase in flow rate. The phoneme in alkaline suspension with high barrier is totally opposite. Under acidic conditions, the interaction the double layer electrical force is weak, and the particles can be easily deposited on the surface of porous media. The increasing of flow rate, result in the increases of shear force, which makes the particles more easily detached. However, under alkaline conditions, the lower flow rate makes it difficult for particles deposits on the surface of porous media. The increase in the barrier increases the critical velocity. However, it is worth noting that DLVO theory describes surface interactions qualitatively rather than quantitatively. The repulsive barrier calculated by DLVO theory is often higher than the real condition, especially in the unfavorable condition [56]. As a result, the critical velocity in this paper is probably higher than previous experiment study.
As Figure 12d shows, in the condition of low flow rate, the decrease in the repulsive barrier makes the deposition ratio of the particle increase obviously. The lower barrier can obviously help the deposition of particles. However, when the flow rate is high, the change of pH has little effect on deposition ratio. Figure 13 shows the transient remaining permeability. We note that even there are great differences in deposition ratio under different conditions, the change of permeability impairment is small. The decrease in permeability is mainly due to the retention bridge of particles at the pore throat. We speculate that the production of bridging is mainly affected by concentration.

4.3. Particle Micro Deposition Behavior

The advantage of simulation is the ability to trace all particles at pore scale. We were able to investigate the different microscopic events leading to particle deposition. When concentration is low, particle deposition is only related to the interaction between particle and porous grain. At different incident velocities, the force, velocity and trajectory of particle is different during collision. As Figure 14 shows, when the particle approach grain the DLVO potential energy diagram sequentially appeared as a secondary potential well, a repulsive barrier and a primary potential well. The simulated environment in this paper is also under the condition of a low ionic concentration environment, and the electrostatic shielding effect is weak. The secondary potential well can be neglected under hydrodynamic action. In order to reach the primary potential well, the drag force needs to overcome the repulsive barrier.
The deposition of particle is mainly related to inertial deposition and interception. The flow field is the most direct factors affecting particle deposition. The particle flow along the streamline and having potential contact with the grains of porous media. Figure 15 shows the collision between particle and grain at different flow rate. When vin = 4 mm/s, particle cannot overcome the repulsive barrier at low flow rate and hard to deposit on the porous media. For vin = 7.5 mm/s, particle has enough kinetic energy overcome the repulsive barrier and enter the primary potential well. The particles accelerate under the action of adhesive action after breaking through the repulsive barrier and contact with grain finally. The particles do not deposit directly in porous media after a collision. After colliding between particle and grain, the particle rebounds in the opposite direction. Due to the energy of the damping dissipates the kinetic energy of the particle, the rebound velocity is smaller than the velocity at the beginning of the collision. However, the particles cannot reach the separation point at the end of the first rebound, and are pulled back for a new approach and subsequent rebound. The kinetic energy is gradually dissipated in the process, and the particles are finally deposited on the porous media.
However, in high concentration suspension, the deposition of particle is usually affected by the action of other particles. Figure 16 and Figure 17 show the transportation of some particles in the throat under low velocity (vin = 4 mm/s) and high concentration (C0 = 0.02) condition. When multiple particles pass through the pore throat, as Figure 16 shows, blue particle near the grain surface transport slower through the pore throat, and the red particle at the center of the throat has higher speeds. The blue particle could not break through the repulsive barrier through hydrodynamic and inertial effects. With the repulsive interference of red particle and the impact of hydrodynamic forces, the blue particle deposit on the surface of grain. In addition, the increase in concentration promotes the flocculation between particles. As Figure 17 shows, due to the velocity gradient in the throat, the following particle in the center of the channel collide and flocculate with the particle at the edge of the channel. Particles flocculated into large aggregates and occupy the throat, which leads to the permeability impairment. According to above section, under the condition vin = 4 mm/s, as the concentration increased from 0.05 to 0.2, the deposition rate increased from 6% to 53%. Therefore, it can be seen that the deposition rate of particle is low at low concentration and low flow rate, but the deposition of particle at high concentration is very obvious.

4.4. Dynamics of the Clogging Process and Resuspension

Compared with the previous section, the dynamic behavior after particle deposition is shown in this section. As demonstrated in Figure 18, the contact between particle and porous grain is often upstream, but deposition occurs downstream. During the clogging process, due to hydrodynamic and shear torque, the particles roll with the surface and tend to deposit in the downstream zone of the porous grain. This mainly lies in the assumption that the surface of porous media is smooth and ignoring the roughness of grain surface [59]. Similar particle behavior was also found in some experiments. Particles deposit on the surface or at the secondary potential well and migrate to the downstream as water flows [60]. The movement of particles downstream may be the decisive factor in clogging. Deposition of particles expands the surface area of the collector, making subsequent particles more accessible to contract with grain. As Figure 19 shows, with the accumulation of downstream deposition, the flow throat is gradually encroached until the particles form a bridge, which hinder the fluid flow under the action of the particle bonds. Therefore, the internal structure of porous media plays an important role in the formation of clogging layer. This is similar to the results of previous studies [61]. In their study, the critical concentration of particles was 20%. When the concentration is lower than this value, the clogging layer occurs through continuous deposition, whereas for 20% concentration, sudden bridging formation can occur. However, the particle concentration does not reach this value during recharge process. Therefore, the formation of clogging layer should be produced by continuous deposition during recharge process.
Resuspension is often observed during clogging process, especially in condition of high flow rate. The interaction between particles is much smaller than that between particle and grain which leads to the breakage of particle bonds. As Figure 20 shows, particle bonds break and the throat restored permeability. After resuspension, the agglomerate is deposited downstream or enters deeper into the porous media. Due to large volume, there-suspended agglomerates tend to deposit again. Breakage of particle aggregates usually releases some individual particles, as the yellow particles shown in Figure 20. The stability of the particle bridge is directly related to the magnitude of the hydrodynamic force. This explains that at high flow rates condition, the low permeability decay even with higher deposition rate.
Furthermore, in the case of high flow rate, the fluid has strong shear force on deposited particles. Hydrodynamic effects can significantly alter particle deposition, especially detach deposited particles from the primary minimum well [62,63]. As the flow rate increases, more particle will leave the surface and reduce the deposition rate in favorable deposition environment. As Figure 21 shows, after interaction of particle through the throat, the deposited particle is separated from the surface and resuspended. Due to the repulsive force of the deposited particles, suspend particle accelerate or slow in the throat, thus changing the flow field distribution of the throat. The change of flow field increases the lift force of the deposited particles and promotes the resuspend of the deposited particles. Therefore, the interaction between particles may promote the deposition process or facilitate the release of deposited particle. This explains why the deposition rate increases first and then decreases with the increase in particle concentration when vin = 7.12 mm/s. It is important to note that, the effect of increasing hydrodynamic force on the release of sediment particles is clear but not obvious compared to previous research. It mainly due to not considering the complexity of natural environment, such as roughness, which is expected to play a major role both in particle retention and release [64,65].

5. Summary and Conclusions

Understanding the migration and deposition mechanism of particles in porous media and predicting the clogging formation has important academic meanings and engineering significance.
Taking IMBM mode as the connection, we coupled the LBM-DEM method to simulate particle migration and retention inside the porous media during recharging groundwater. This method identifies important microscopic events. Based on DLVO theory, the deposition of particles and the permeability attenuation mechanism of porous media are studied. The coupled effects of concentration, flow rate and pH on the clogging mechanism of porous media were analyzed. For single particles, due to the repulsive barrier between particles and porous media, there is a critical velocity. At low velocity, the deposition ratio increases with the increase in velocity. Beyond the critical velocity, the deposition ratio decreases with the velocity increases due to higher shear force. The increase in concentration makes the interaction between particles more frequent. The interaction of particles promotes deposition of particles in low flow rate and also promotes the release of deposited particles in high flow rate. In general, the increase in concentration increases permeability impairment at all velocity conditions, and the increase in concentration in the low flow rate condition is more obvious for permeability impairment. When the concentration is constant, the increase in flow rate improves the permeability impairment, even with a higher deposition ratio. Changes in pH mainly affect the value of the repulsive barrier. Under the acidic condition, the increase in flow rate reduces the deposition rate. Under the alkaline condition, the low flow rate condition has a low deposition ratio due to it being hard for particles to break through the repulsive barrier. For low flow rate, the decrease in repulsive barrier in the acidic condition greatly promotes the deposition of particles. For high flow rate, particles are more affected by hydrodynamic forces, which make the pH less affected in particle deposition.
In addition, the deposition phenomenon in porous media with micron size particles is more fully understood by simulation. The process of particle deposition and the dynamic motion after deposition were observed such as particles gliding over the surface. Accumulated particles in the downstream form bridges and hinder fluid flow. In high flow rate, strong shear force is more capable of destroying bridges and recovering permeability. Adsorbed particles glide on the surface of the grain and deposit in the downstream. This is almost undetectable in an experimental study as it would require a nanometer spatial resolution and a very high temporal resolution. These micro-phenomena help explain the macro-characteristics of particle migration and deposition.
This method has great potential in studying the migration of particles in porous media. However, there are still some improvements in improving the accuracy and reducing the cost of calculation. Furthermore, groundwater recharging is a very complex microscopic process and the deposition mechanics of particles with different physical properties in porous media vary greatly, which needs further study.

Author Contributions

Conceptualization, Y.G. and L.C.; methodology, L.C.; software, L.C.; validation, L.C., Y.Z. and S.W.; formal analysis, Y.Z.; investigation, Y.Z.; resources, Y.Z.; data curation, Y.Z.; writing—original draft preparation, Y.Z.; writing—review and editing, L.C.; supervision, L.C.; project administration, Y.G.; funding acquisition, Y.G. All authors have read and agreed to the published version of the manuscript.

Funding

This research received no external funding.

Institutional Review Board Statement

Not applicable.

Informed Consent Statement

Not applicable.

Data Availability Statement

The data presented in this study are available on request from the corresponding author. The data are not publicly available due to restrictions of privacy.

Acknowledgments

We are grateful to the High-Performance Computing Center of Nanjing Tech University for supporting the computational resources.

Conflicts of Interest

The authors declare no conflict of interest.

Nomenclature

xPosition of particle/Grid coordinate
i, jParticle index/Direction in LBM
t, ∆tTime and Time step
vp,ωpVelocity and angular velocity of particle
m, IMass of particle and moment of inertia
F, TForce and torque on particles
Ff, TfHydrodynamic force and torque induced by fluid flow
Fc, TcContact forces and Torque resulting from the contact process
Fad, FreAdhesive force and repulsive force
FgGravity force
n, tNormal unit vectors and tangent unit vectors
nNumber
kStiffness constant
δOverlap length
σCoefficient of restitution
ηDamping constant
ζFriction coefficient
VijRelative velocity between particle i and j
rParticle radius
Sij, hijCenter-to-center distance and surface distance between particle i and j
AHHamaker constant
εr, ε0Permittivity of vacuum and dielectric constant of the medium
RGas constant
FFaraday constant
ψZeta-potentials of the surface
zValence of the background electrolyte
κReciprocal of Debye length
elElectronic basic charge
NAAvogadro constant
IIonic strength of solution
TTemperature
TDuration of the collision event
wiljSurface adhesive energy
ciDiscrete lattice velocity
fiDensity distribution function
τBGKRelaxation time
feqLocal equilibrium distribution function
wiWeight factor
wiWeight factor
ρf, ρlbm, ρFluid density, fluid density in LBM and particle density
uFluid velocity
csLattice sound velocity
P, ∆PPressure of the fluid and pressure drop
ΩisAdditional collision terms for nodes overlapping with solids
BsWeight coefficient
εsPercentage of solids in lattice
Vin, VpVolume of injected liquid and volume of pore space
vinInlet flow rate
PVPore volume
kPermeability
kr, k0Percentage of remaining permeability and initial permeability of porous media
μViscosity of fluid
LLength of the porous media
CrNormalized concentration
Cout, C0Volume concentrations in the effluent and volume concentrations in the influent
MrPercentage of particles retained

References

  1. Rybach, L.; Sanner, B. Ground-Source Heat Pump Systems-The European Experience. Geo Heat Cent. Q. Bull. 2000, 21, 16–26. [Google Scholar] [CrossRef]
  2. Lund, J.; Sanner, B.; Rybach, L.; Curtis, R.; Hellström, G. Geothermal (ground-source) heat pumps a world overview. Geo Heat Cent. Q. Bull. 2004, 25, 1–10. [Google Scholar]
  3. Sharma, M.M.; Yortsos, Y.C. Fines Migration in Porous-Media. Aiche J. 1987, 33, 1654–1662. [Google Scholar] [CrossRef]
  4. Boek, E.S.; Hall, C.; Tardy, P.M.J. Deep Bed Filtration Modelling of Formation Damage Due to Particulate Invasion from Drilling Fluids. Transp. Porous Media 2012, 91, 479–508. [Google Scholar] [CrossRef]
  5. Bedrikovetsky, P.; Caruso, N. Analytical Model for Fines Migration During Water Injection. Transp. Porous Media 2014, 101, 161–189. [Google Scholar] [CrossRef]
  6. Abdoli, S.M.; Shafiei, S.; Raoof, A.; Ebadi, A.; Jafarzadeh, Y.; Aslannejad, H. Water Flux Reduction in Microfiltration Membranes: A Pore Network Study. Chem. Eng. Technol. 2018, 41, 1566–1576. [Google Scholar] [CrossRef]
  7. McKinley, J.W.; Siegrist, R.L. Soil Clogging Genesis in Soil Treatment Units Used for Onsite Wastewater Reclamation: A Review. Crit. Rev. Environ. Sci. Technol. 2011, 41, 2186–2209. [Google Scholar] [CrossRef]
  8. Feng, Q.; Xu, S.; Wang, S.; Li, Y.; Gao, F.; Xu, Y. Apparent permeability model for shale oil with multiple mechanisms. J. Pet. Sci. Eng. 2019, 175, 814–827. [Google Scholar] [CrossRef]
  9. Guo, W.; Guo, X.; Chen, X.; Li, Y.; Li, Z.; An, Y.; Dai, W. Laboratory Evaluation of the Permeability Durability of Utilization of Oil Shale Waste as Fine Aggregate in Open Grade Friction Course in Seasonal Frozen Regions. Appl. Sci. 2020, 10, 419. [Google Scholar] [CrossRef] [Green Version]
  10. Fallah, H.; Fathi, H.B.; Mohammadi, H. The Mathematical Model for Particle Suspension Flow through Porous Medium. Geomaterials 2012, 2, 57–62. [Google Scholar] [CrossRef] [Green Version]
  11. Ding, Y.; Wen, D. Particle migration in a flow of nanoparticle suspensions. Powder Technol. 2005, 149, 84–92. [Google Scholar] [CrossRef]
  12. Alem, A.; Elkawafi, A.; Ahfir, N.-D.; Wang, H. Filtration of kaolinite particles in a saturated porous medium: Hydrodynamic effects. Hydrogeol. J. 2013, 21, 573–586. [Google Scholar] [CrossRef]
  13. Zhang, P.Y.; Bai, B.; Jiang, S.C. Coupled effects of hydrodynamic forces and pore structure on suspended particle transport and deposition in a saturated porous medium. Rock Soil Mech. 2016. [Google Scholar] [CrossRef]
  14. Shen, C.Y.; Bradford, S.; Wang, Z.; Huang, Y.F.; Zhang, Y.L.; Li, B.G. DLVO Interaction Energies between Hollow Spherical Particles and Collector Surfaces. Langmuir 2017, 33, 10455–10467. [Google Scholar] [CrossRef] [PubMed]
  15. Ahfir, N.D.; Hammadi, A.; Alem, A.; Wang, H.Q.; Le Bras, G.; Ouahbi, T. Porous media grain size distribution and hydrodynamic forces effects on transport and deposition of suspended particles. J. Environ. Sci. 2017, 53, 161–172. [Google Scholar] [CrossRef]
  16. Bennacer, L.; Ahfir, N.D.; Alem, A.; Wang, H.Q. Coupled Effects of Ionic Strength, Particle Size, and Flow Velocity on Transport and Deposition of Suspended Particles in Saturated Porous Media. Transp. Porous Media 2017, 118, 251–269. [Google Scholar] [CrossRef]
  17. Liu, Q.S.; Cui, X.Z.; Zhang, C.Y.; Zhan, T. Effects of particle size on characteristics of transportation and deposition of suspended particles in porous media. Chin. J. Geotech. Eng. 2014, 36, 1777–1783. [Google Scholar] [CrossRef]
  18. Razzaghmanesh, M.; Borst, M. Investigation clogging dynamic of permeable pavement systems using embedded sensors. J. Hydrol. 2018, 557, 887–896. [Google Scholar] [CrossRef] [PubMed]
  19. Du, X.; Ye, X.; Zhang, X. Clogging of saturated porous media by silt-sized suspended solids under varying physical conditions during managed aquifer recharge. Hydrol. Process. 2018, 32, 2254–2262. [Google Scholar] [CrossRef]
  20. Li, X.; Mi, Z.; Tan, S.; Wang, R.; Wang, X. PIV study of velocity distribution and turbulence statistics in a rod bundle. Ann. Nucl. Energy 2018, 117, 305–317. [Google Scholar] [CrossRef]
  21. Reci, A.; Sederman, A.J.; Gladden, L.F. Experimental evidence of velocity profile inversion in developing laminar flow using magnetic resonance velocimetry. J. Fluid Mech. 2018, 851, 545–557. [Google Scholar] [CrossRef]
  22. Khan, M.S.; Karim, I.; Evans, G.M.; Doroodchi, E.; Joshi, J.B.; Mitra, S. Estimation of dispersion coefficient in a solid-liquid fluidised bed system. Powder Technol. 2020, 374, 560–576. [Google Scholar] [CrossRef]
  23. Peng, Z.; Joshi, J.B.; Moghtaderi, B.; Khan, M.S.; Evans, G.M.; Doroodchi, E. Segregation and dispersion of binary solids in liquid fluidised beds: A CFD-DEM study. Chem. Eng. Sci. 2016, 152, 65–83. [Google Scholar] [CrossRef]
  24. Poletto, V.G.; De Lai, F.C.; Junqueira, S.L.M. CFD-DEM simulation of mud cake formation in heterogeneous porous medium for lost circulation control. J. Braz. Soc. Mech. Sci. Eng. 2020, 42. [Google Scholar] [CrossRef]
  25. Trofa, M.; D′Avino, G.; Sicignano, L.; Tomaiuolo, G.; Greco, F.; Maffettone, P.L.; Guido, S. CFD-DEM simulations of particulate fouling in microchannels. Chem. Eng. J. 2019, 358, 91–100. [Google Scholar] [CrossRef]
  26. Zhang, H.; Li, T.; Huang, Z.; Kuang, S.; Yu, A. Investigation on vertical plug formation of coarse particles in a non-mechanical feeder by CFD-DEM coupling method. Powder Technol. 2018, 332, 79–89. [Google Scholar] [CrossRef]
  27. Zou, Y.; Chen, C.; Zhang, L. Simulating Progression of Internal Erosion in Gap-Graded Sandy Gravels Using Coupled CFD-DEM. Int. J. Geomech. 2020, 20. [Google Scholar] [CrossRef]
  28. Wang, S.; Li, H.; Wang, R.; Tian, R.; Sun, Q.; Ma, Y. Numerical simulation of flow behavior of particles in a porous media based on CFD-DEM. J. Pet. Sci. Eng. 2018, 171, 140–152. [Google Scholar] [CrossRef]
  29. Han, K.; Feng, Y.T.; Owen, D.R.J. Numerical simulations of irregular particle transport in turbulent flows using coupled LBM-DEM. CMES Comput. Model. Eng. Sci. 2007, 18, 87–100. [Google Scholar] [CrossRef]
  30. Fan, J.; Luu, L.-H.; Noury, G.; Philippe, P. DEM-LBM numerical modeling of submerged cohesive granular discharges. Granul. Matter 2020, 22. [Google Scholar] [CrossRef]
  31. Najuch, T.; Sun, J. Analysis of two partially-saturated-cell methods for lattice Boltzmann simulation of granular suspension rheology. Comput. Fluids 2019, 189, 1–12. [Google Scholar] [CrossRef]
  32. Su, T.C.; O′Sullivan, C.; Yasuda, H.; Gourlay, C.M. Rheological transitions in semi-solid alloys: In-situ imaging and LBM-DEM simulations. Acta Mater. 2020, 191, 24–42. [Google Scholar] [CrossRef]
  33. Cui, X.L.; Li, J.; Chan, A.; Chapman, D. Coupled DEM-LBM simulation of internal fluidisation induced by a leaking pipe. Powder Technol. 2014, 254, 299–306. [Google Scholar] [CrossRef]
  34. Montella, E.P.; Toraldo, M.; Chareyre, B.; Sibille, L. Localized fluidization in granular materials: Theoretical and numerical study. Phys. Rev. E 2016, 94, 14. [Google Scholar] [CrossRef] [Green Version]
  35. Parvan, A.; Jafari, S.; Rahnama, M.; Apourvari, S.N.; Raoof, A. Insight into particle retention and clogging in porous media; a pore scale study using lattice Boltzmann method. Adv. Water Resour. 2020, 138. [Google Scholar] [CrossRef]
  36. Zhou, K.; Hou, J.; Sun, Q.C.; Guo, L.L.; Bing, S.X.; Du, Q.J.; Yao, C.J. A Study on Particle Suspension Flow and Permeability Impairment in Porous Media Using LBM-DEM-IMB Simulation Method. Transp. Porous Media 2018, 124, 681–698. [Google Scholar] [CrossRef]
  37. Noble, D.R.; Torczynski, J.R. A lattice-Boltzmann method for partially saturated computational cells. Int. J. Mod. Phys. C 1998, 9, 1189–1201. [Google Scholar] [CrossRef]
  38. Cundall, P.A.; Strack, O.D.L. Discrete Numerical-Model for Granular Assemblies. Geotechnique 1979, 29, 47–65. [Google Scholar] [CrossRef]
  39. Crowe, C.T.; Sommerfield, M.; Tsuji, Y. Multiphase Flows with Droplets and Particles, 2nd ed.; CRC Press: Boca Raton, FL, USA, 2011; ISBN 9781439840504. [Google Scholar]
  40. Tsuji, Y.; Tanaka, T.; Ishida, T. Lagrangian Numerical Simulation of Plug Flow of Cohesionless Particles in a Horizonal Pipe. Powder Technol. 1992, 71, 239–250. [Google Scholar] [CrossRef]
  41. Rettinger, C.; Ruede, U. A coupled lattice Boltzmann method and discrete element method for discrete particle simulations of particulate flows. Comput. Fluids 2018, 172, 706–719. [Google Scholar] [CrossRef] [Green Version]
  42. Vigil, G.; Xu, Z.H.; Steinberg, S.; Israelachvili, J. Interactions of Silica Surfaces. J. Colloid Interface Sci. 1994, 165, 367–385. [Google Scholar] [CrossRef]
  43. Liang, Y.; Hilal, N.; Langston, P.; Starov, V. Interaction forces between colloidal particles in liquid: Theory and experiment. Adv. Colloid Interface Sci. 2007, 134–135, 151–166. [Google Scholar] [CrossRef]
  44. Peng, Z.B.; Doroodchi, E.; Evans, G. DEM simulation of aggregation of suspended nanoparticles. Powder Technol. 2010, 204, 91–102. [Google Scholar] [CrossRef]
  45. Yang, H.T.; Balhoff, M.T. Pore-network modeling of particle retention in porous media. Aiche J. 2017, 63, 3118–3131. [Google Scholar] [CrossRef]
  46. Abbasfard, H.; Evans, G.; Moreno-Atanasio, R. Effect of van der Waals force cut-off distance on adhesive collision parameters in DEM simulation. Powder Technol. 2016, 299, 9–18. [Google Scholar] [CrossRef]
  47. Mihajlovic, M.; Roghair, I.; Annaland, M.V.S. On the numerical implementation of the Van der Waals force in Soft-Sphere Discrete Element Models for gas-solid fluidization. Chem. Eng. Sci. 2020, 226. [Google Scholar] [CrossRef]
  48. Johnson, K.L.; Kendall, K.; Roberts, A.D. Surface Energy and the Contact of Elastic Solids. Procrsoclonda 1971, 324, 301–313. [Google Scholar] [CrossRef] [Green Version]
  49. Hong, C.W. From Long-Range Interaction to Solid-Body Contact Between Colloidal Surfaces During Forming. Jeuroceramsoc 1998, 18, 2159–2167. [Google Scholar] [CrossRef]
  50. McNamara, G.R.; Zanetti, G. Use of the Boltzmann-Equation to Simulate Lattice-Gas Automata. Phys. Rev. Lett. 1988, 61, 2332–2335. [Google Scholar] [CrossRef] [PubMed]
  51. Feng, Q.H.; Cha, L.M.; Dai, C.L.; Zhao, G.; Wang, S. Effect of particle size and concentration on the migration behavior in porous media by coupling computational fluid dynamics and discrete element method. Powder Technol. 2020, 360, 704–714. [Google Scholar] [CrossRef]
  52. Feng, Z.G.; Michaelides, E.E. The immersed boundary-lattice Boltzmann method for solving fluid–particles interaction problems. J. Comput. Phys. 2004, 195, 602–628. [Google Scholar] [CrossRef]
  53. Fan, W.; Li, Q.; Huo, M.X.; Wang, X.Y.; Lin, S.S. Transport of bacterial cell (E. coli) from different recharge water resources in porous media during simulated artificial groundwater recharge. Front. Environ. Sci. Eng. 2020, 14, 13. [Google Scholar] [CrossRef]
  54. Bergstrom, L. Hamaker constants of inorganic materials. Adv. Colloid Interface Sci. 1997, 70, 125–169. [Google Scholar] [CrossRef]
  55. Chen, X.; Cai, Q.; Wu, Z. Experimental and theoretical study of coupled influence of flow velocity increment and particle size on particle retention and release in porous media. Water Sci. Eng. 2017, 10, 236–245. [Google Scholar] [CrossRef]
  56. Zhao, W.; Zhao, P.; Tian, Y.; Shen, C.; Li, Z.; Peng, P.; Jin, C. Investigation for Synergies of Ionic Strength and Flow Velocity on Colloidal-Sized Microplastic Transport and Deposition in Porous Media Using the Colloidal-AFM Probe. Langmuir 2020, 36, 6292–6303. [Google Scholar] [CrossRef]
  57. Hou, J.; Xu, X.; Lan, L.; Miao, L.; Xu, Y.; You, G.; Liu, Z. Transport behavior of micro polyethylene particles in saturated quartz sand: Impacts of input concentration and physicochemical factors. Environ. Pollut. 2020, 263. [Google Scholar] [CrossRef] [PubMed]
  58. Zhao, J.; Ye, X.; Du, X.; Zhang, X.; Cui, R. Study on the migration characteristics of suspended particles in porous media during different concentration of suspension. Water Resour. Hydropower Eng. 2019, 50, 25–31. [Google Scholar] [CrossRef]
  59. Shen, C.; Li, B.; Wang, C.; Huang, Y.; Jin, Y. Surface Roughness Effect on Deposition of Nano- and Micro-Sized Colloids in Saturated Columns at Different Solution Ionic Strengths. Vadose Zone J. 2011, 10, 1071–1081. [Google Scholar] [CrossRef]
  60. Kuznar, Z.A.; Elimelech, M. Direct microscopic observation of particle deposition in porous media: Role of the secondary energy minimum. Colloids Surf. A Physicochem. Eng. Asp. 2007, 294, 156–162. [Google Scholar] [CrossRef]
  61. Agbangla, G.C.; Bacchin, P.; Climent, E. Collective dynamics of flowing colloids during pore clogging. Soft Matter 2014, 10, 6303–6315. [Google Scholar] [CrossRef] [PubMed] [Green Version]
  62. Jin, C.; Ren, C.L.; Emelko, M.B. Concurrent Modeling of Hydrodynamics and Interaction Forces Improves Particle Deposition Predictions. Environ. Sci. Technol. 2016, 50, 4401–4412. [Google Scholar] [CrossRef] [PubMed]
  63. Lee, H.; Kim, S.C.; Chen, S.-C.; Segets, D.; Pui, D.Y.H. Predicting collision efficiencies of colloidal nanoparticles in single spherical and fibrous collectors using an individual particle tracking method. Sep. Purif. Technol. 2019, 222, 202–213. [Google Scholar] [CrossRef]
  64. Abdelfatah, E.; Kang, K.; Pournik, M.; Shiau, B.J.B.; Harwell, J. Mechanistic study of nanoparticles deposition and release in porous media. J. Pet. Sci. Eng. 2017, 157, 816–832. [Google Scholar] [CrossRef]
  65. Sefrioui, N.; Ahmadi, A.; Omari, A.; Bertin, H. Numerical simulation of retention and release of colloids in porous media at the pore scale. Colloids Surf. A Physicochem. Eng. Asp. 2013, 427, 33–40. [Google Scholar] [CrossRef] [Green Version]
Figure 1. Schematic representation of two particles i and j, together with reference quantities required by the DEM collision model.
Processes 09 00465 g001
Figure 2. IMB scheme and definition of local solid ratio ε.
Processes 09 00465 g002
Figure 3. Flowchart for the coupled LBM–DEM numerical procedure.
Processes 09 00465 g003
Figure 4. Position of two particles in the channel at different time stages.
Processes 09 00465 g004
Figure 5. The velocity profile of the two particles in the y-direction with time.
Processes 09 00465 g005
Figure 6. (a) The two-dimensional simulation model of the porous media (b) Diagram of grain diameter statistical distribution for porous media.
Processes 09 00465 g006
Figure 7. Grid-independence test at various grid elements.
Processes 09 00465 g007
Figure 8. The breakthrough curve of effluent concentration and variation of deposition ratio (a) C0 = 0.005; (b) C0 = 0.01; (c) C0 = 0.02; (d) Variation of deposition ratio.
Processes 09 00465 g008
Figure 9. Variation of the dimensionless remaining permeability of the porous media versus flow rate and concentration.
Processes 09 00465 g009
Figure 10. Particles deposition and velocity distribution. (a) v = 4.0 mm/s, C0 = 0.02; (b) v = 12.0 mm/s, C0 = 0.02.
Processes 09 00465 g010
Figure 11. The potential energy curves between particles and porous media grain.
Processes 09 00465 g011
Figure 12. The breakthrough curve of effluent concentration and variation of deposition ratio (a) pH = 5.5; (b) pH = 7; (c) pH = 9; (d) Variation of deposition ratio.
Processes 09 00465 g012
Figure 13. Variation of the dimensionless remaining permeability of the porous media versus flow rate and pH.
Processes 09 00465 g013
Figure 14. Movement of a particle when approaching grain.
Processes 09 00465 g014
Figure 15. The collision process between particle and porous media grain with different flow rate: (a) Particle approach grain with high velocity. (b) Distance between particle and grain. (c) Particle approach grain with slow velocity. (d) Distance between particle and grain.
Processes 09 00465 g015
Figure 16. Multi-particle movement in the throat under low flow rate. (a) Particle deposition analysis; (b) Particles approaching process; (c) Particle deposition process.
Processes 09 00465 g016
Figure 17. Particle flocculation process in the throat under low flow rate. (a) Particle flocculation process analysis. (b) Particle flocculation process in simulation.
Processes 09 00465 g017
Figure 18. Particle glides over the surface and deposit in the downstream: approaching, adsorption, gliding process and deposition.
Processes 09 00465 g018
Figure 19. The clogging process of throat and changed the flow path: particle distribution and flow field vector diagram. (a) Cumulative deposition process; (b) Occupy throat; (c) Complete clogging.
Processes 09 00465 g019
Figure 20. The breakage of particle bonds and release particle: particle distribution and flow field vector diagram (a) Clogging state; (b) Breakage process of particle bonds; (c) Release particle after breakage of bonds.
Processes 09 00465 g020
Figure 21. Re-suspension process of deposited particle: particle distribution and flow field vector diagram. (a) Approach process; (b) Interaction process; (c) Re-suspension process.
Processes 09 00465 g021
Table 1. The basic parameters of the LBM-DEM simulation.
LBM and Fluid Paraments DEM and Particle Paraments
Lattice spacing, ∆x1 × 10−6 mNormal stiffness kn2 × 106 N/m
LBM time step, ∆t5 × 10−8 sTangential stiffness kt0.8 × kn
Relation time, τBGK0.65Coefficient of restitution, σ0.8
Fluid density (H2O), ρf1 × 103 kg/m3Friction coefficient, ζ0.5
Fluid density in LBM, ρlbm1Particle density, ρ2.6 × 10³ kg/m3
Ionic valence, z1Hamaker constant [54], AHwall-p0.9 × 10−20 J
Temperature, T280 KHamaker constant, AHp-p2.9 × 10−20 J
Fluid viscosity, μf1 × 10−3 Pa∙sDEM Time step, ∆tdem5 × 10−8 s/5 × 10−10 s
Ionic strength, I5 mMSurface adhesive energy, wilj 1 mJ/m2
Diameter of particle, dp4 μm
Publisher’s Note: MDPI stays neutral with regard to jurisdictional claims in published maps and institutional affiliations.

