Article

The Relationship of Moisture and Temperature to the Concentration of O2 and CO2 during Biodrying in Semi-Static Piles

by
Rosa María Contreras-Cisneros
,
Carlos Orozco-Álvarez
,
Ana Belem Piña-Guzmán
,
Luis Carlos Ballesteros-Vásquez
,
Liliana Molina-Escobar
,
Sandra Sharo Alcántara-García
and
Fabián Robles-Martínez
*
Instituto Politécnico Nacional (IPN), Unidad Profesional Interdisciplinaria de Biotecnología (UPIBI), Departamento de Bioprocesos, Ciudad de México C.P. 07340, Mexico
*
Author to whom correspondence should be addressed.
Processes 2021, 9(3), 520; https://doi.org/10.3390/pr9030520
Submission received: 3 February 2021 / Revised: 23 February 2021 / Accepted: 23 February 2021 / Published: 13 March 2021

Abstract

:
Biodrying was studied over 46 days in two piles (P1 and P2) composed of orange peel and two structuring materials (mulch: P1; sugarcane bagasse: P2). The oxygen and carbon dioxide levels were recorded at different depths (0.1 to 0.6 m). From the beginning to days 33–35 the drying was carried out by a combination of microbial heat, convection, and solar irradiance; moisture reached 30%, corresponding to a water activity (aw) of 0.88–0.9, which was insufficient to maintain microbial activity. Additionally, the O2 and CO2 levels (21% and 0%, respectively) evidenced the end of the biological phase of the process. After day 35, the drying occurred only by convection and solar irradiance. At the end, moisture reached 14% (P1) and 12% (P2), showing that the turning frequency, as well as the type and proportion of the structuring materials, were adequate and significantly influenced moisture reduction, allowing the aeration necessary for biodrying. At the end, a material with an average calorific value of 15,500 kJ/kg was obtained, comparable to wood and other fuels obtained from orange peel, making the biodrying process a suitable option for the stabilization and energy recovery of agricultural and agro-industrial waste with high moisture content.

1. Introduction

The continued increase in the world’s population demands an ever-increasing supply of energy to improve the quality of life. The use of fossil fuels has so far met the energy demand; however, their use continues to grow at an unsustainable rate, which has negative environmental consequences [1], such as air pollution and greenhouse gas emissions associated with climate change, that negatively affect the health of the population and the balance of various ecosystems. This has led to the development of research focused on the development of sustainable energy from renewable resources, including biofuels, which have been viewed as the most promising source for meeting energy demand through the use of biomass. San Miguel and Gutiérrez Martín [2] reported that biomass is the most widely used renewable energy resource in the world, well above wind or solar energy. This is mainly due to the use of wood and agricultural waste for the production of domestic and industrial heat.
On the other hand, it is known that worldwide, 1300 million tons/year of residues are generated from food waste [3] and that there is a problem linked to its poor management. In some products, organic waste may account for 39.5% of the food (sugarcane) or even 50% of the fruit, as in the case of oranges [4], so there is a strong need for the proper handling of these residual materials. Agroindustrial waste can, in some cases, represent not only an environmental problem (due to the generation of odors and gases during its decomposition), but also an economic one for those who generate it, due to the costs of its management and/or disposal. However, this type of waste should be seen as a valuable resource that can be recovered through various technologies.
The possibility of using lignocellulosic waste for energy recovery is attractive because it is expected to have both environmental and economic benefits [5]. These residues can be used as raw combustion material or transformed into a variety of fuel products, such as pellets, charcoal, bio-oil and bioethanol. Direct combustion is one of the three main thermochemical conversion methods for high-carbon biofuels derived from cellulosic biomass (cellulose, hemicellulose and lignin), such as woody or lignocellulosic plant material from various crops, pruning residues and dried animal waste [6,7].
In the thermal recovery of organic waste through incineration, the high moisture content of some wastes is a challenge that needs to be overcome, as it impacts the usable energy, due to the fact that there is an inversely proportional relationship between moisture and combustion power (CP). Therefore, through an organic solid waste stabilization process such as biodrying, it is possible to obtain a dry material with a high CP that is suitable for use as fuel [8], thus helping to mitigate the problem of poor organic waste management, while taking advantage of the resources that are currently available.
Biodrying is an aerobic bioprocess by which the moisture contained in waste is removed with the help of the metabolic heat generated by microorganisms that degrade organic matter. Various factors, such as the initial moisture content, waste porosity, aeration and the temperature reached inside the pile, are key elements that define the development and duration of the biodrying process [9]. The biodrying process is favored through the incorporation of structuring materials that improve air movement inside the waste piles, favoring gas exchange between the pile and the outside [10]. Additionally, O2 availability is favored for microbial activity to take place inside the waste piles. Several authors have studied the effect of materials such as sawdust [11] and pruning residues [12,13] as structuring agents to give porosity to plant residues with high moisture content, favoring the biodrying process. The decrease in moisture content can be used as an indicator of the efficiency in the biodrying process [14], since, being an aerobic process, high moisture contents limit O2 transport within the pile, whereas low moisture values limit microbial activity [15].
Biodrying allows taking advantage of organic waste and capitalizing on its potential use as biofuel, since its CP is increased, enabling biodried waste to compete with some incinerable materials such as wood (with CP of 12,200–15,360 kJ/kg for wood fuels with moisture content of 30% and 15%, respectively [16]). In the short or medium term, biodried material may have a greater competitive advantage in the power generation market, especially in the field of solid fuels, where studies such as Hamidian’s [17] demonstrated the profitability in implementing the biodrying process, as it can reduce up to 20% of the final moisture of the sludge from the paper industry for later use in the gasification process.
This work aimed to characterize the biodrying process, with particular emphasis on the concentration of O2 and CO2 and its relationship with the microbial activity dependent on water content and activity. Such factors have a determining role in the development of the thermophilic phase (>45 °C), where the organic degradation occurs, and abundant energy is released for the self-heating of piles, one of the driving forces of biodrying.

2. Materials and Methods

2.1. Materials

To carry out this study, agro-industrial organic solid waste from a juice extraction company (orange and carrot peel) and a sugar mill (sugarcane bagasse) were used, as well as mulch (shredded wood) obtained from a compost production plant located in the north of Mexico City. With the proportions of residues shown in Table 1, two piles were formed (Pile 1: P1 and Pile 2: P2) and subjected to the biodrying process, which was carried out inside a greenhouse-type tunnel.

2.2. Formation of Biodrying Piles

Both piles had a truncated pyramidal shape starting with a volume of 1.49 m3 and 1.13 m3 for P1 and P2. The materials were arranged in layers in the following order: mulch, orange peel and carrot bagasse/sugarcane bagasse. The sugarcane bagasse for P2 was added on the fourth day. To favor the diffusion of gases inside the piles and the removal of moisture, the piles were aerated by manual turning every 7 days.

2.3. Monitoring

During the biodrying process, the percentage of O2 and CO2, the moisture content, and the temperature, both of the piles and the environment, were monitored daily. The concentration of O2 and CO2 was measured using a TESTO model 350-S gas emission analyzer. To this end, six monitoring points were established on the left side of the piles, located, from top to bottom, at different depths in the horizontal plane (side to side) (0.1 m, 0.2 m, 0.3 m, 0.4 m, 0.5 m and 0.6 m) (Figure 1). To access the monitoring points, PVC (Polyvinyl chloride) tubes with an internal diameter of 0.02 m were horizontally placed in order to protect the O2 and CO2 monitoring probe. In the vertical plane (top-down), care was taken that the upper and lower points (0.1 m and 0.6 m, respectively) were at 0.05 m from the minor and major base of the piles.
The temperature was measured in the center of the piles at three different levels: upper center (at 0.05 m from the surface of the pile), geometric center and lower center (at 0.05 m from the bottom of the pile). Thermocouples were introduced at the temperature sampling points and connected to a Snap Pac System Opto 22 integrated data acquisition system. The moisture in the piles was determined by the gravimetric method using a convection drying oven and a BOECO analytical balance with a sensitivity of ±0.0001 g. This determination was carried out in triplicate with a 5 g sample.

2.4. Characterization of the Biodried Material

At the end of the bioprocess in both piles, the organic carbon content (%C) was determined by the Wilkley and Black method, in accordance with NOM-021-SEMARNAT-2000 [18]. The CP was measured in a PARR 1341EB series oxygen bomb calorimeter, as established by NMX-AA-33-1985 [19].
To compare the behavior of the measured parameters (%O2, %CO2, moisture and temperature) in both piles, an analysis of variance (ANOVA), for repeated samples, and a Tukey test with 95% confidence were performed. To compare the CP, %C and final moisture of the two piles, an ANOVA and a Tukey test that allows multiple comparisons at 95% confidence were performed using GraphPad Prism software.

3. Results and Discussion

3.1. Decrease in Weight, Volume and Water Content

The biodrying process was monitored for 46 days; the final moisture content (average between the center and the surface) was 14.4% for the P1 pile and 11.9% for the P2 pile, while the weight reduction was 83.5% (P1) and 85% (P2), even though the initial moisture content was higher in P2 (88%) than in P1 (75%), as shown in Table 2.
According to the ANOVA for repeated samples and a Tukey test with 95% confidence, there was no significant difference in the behavior of moisture in the center and surface of each pile or between them, despite the use of two different structuring materials (mulch and sugarcane bagasse).
The addition of structuring materials (mulch and sugarcane bagasse) favored gas exchange and promoted the escape of water vapor from inside the piles, resulting in a 70% reduction from the initial volume for P1. However, the P2 volume was reduced by only 34% (thus contributing greater porosity to the material at the end of the biodrying) even though the decrease in the amount of water was practically the same between the two piles (97–98%). This is because sugarcane bagasse has a greater reduction in weight than in volume as its moisture content decreases during biodrying [20]. Consequently, the density of the pile with bagasse decreased more (77%) than the density of the pile without bagasse (45%), as can be seen in the data of Table 2.
The beneficial effect of the texturizing material in the biodrying process has already been widely reported. For example, in a study by Mohammed et al. [13], which evaluates the effect of adding pruning waste during the biodrying of lettuce residues, it was reported that the moisture content was reduced 27% more than when no structuring material was added, resulting in a greater reduction of mass and volume. Tom et al. [21] stated that the reduction in mass and volume of the waste is correlated since both depend on the degradation of organic matter and the decrease in moisture during biodrying.

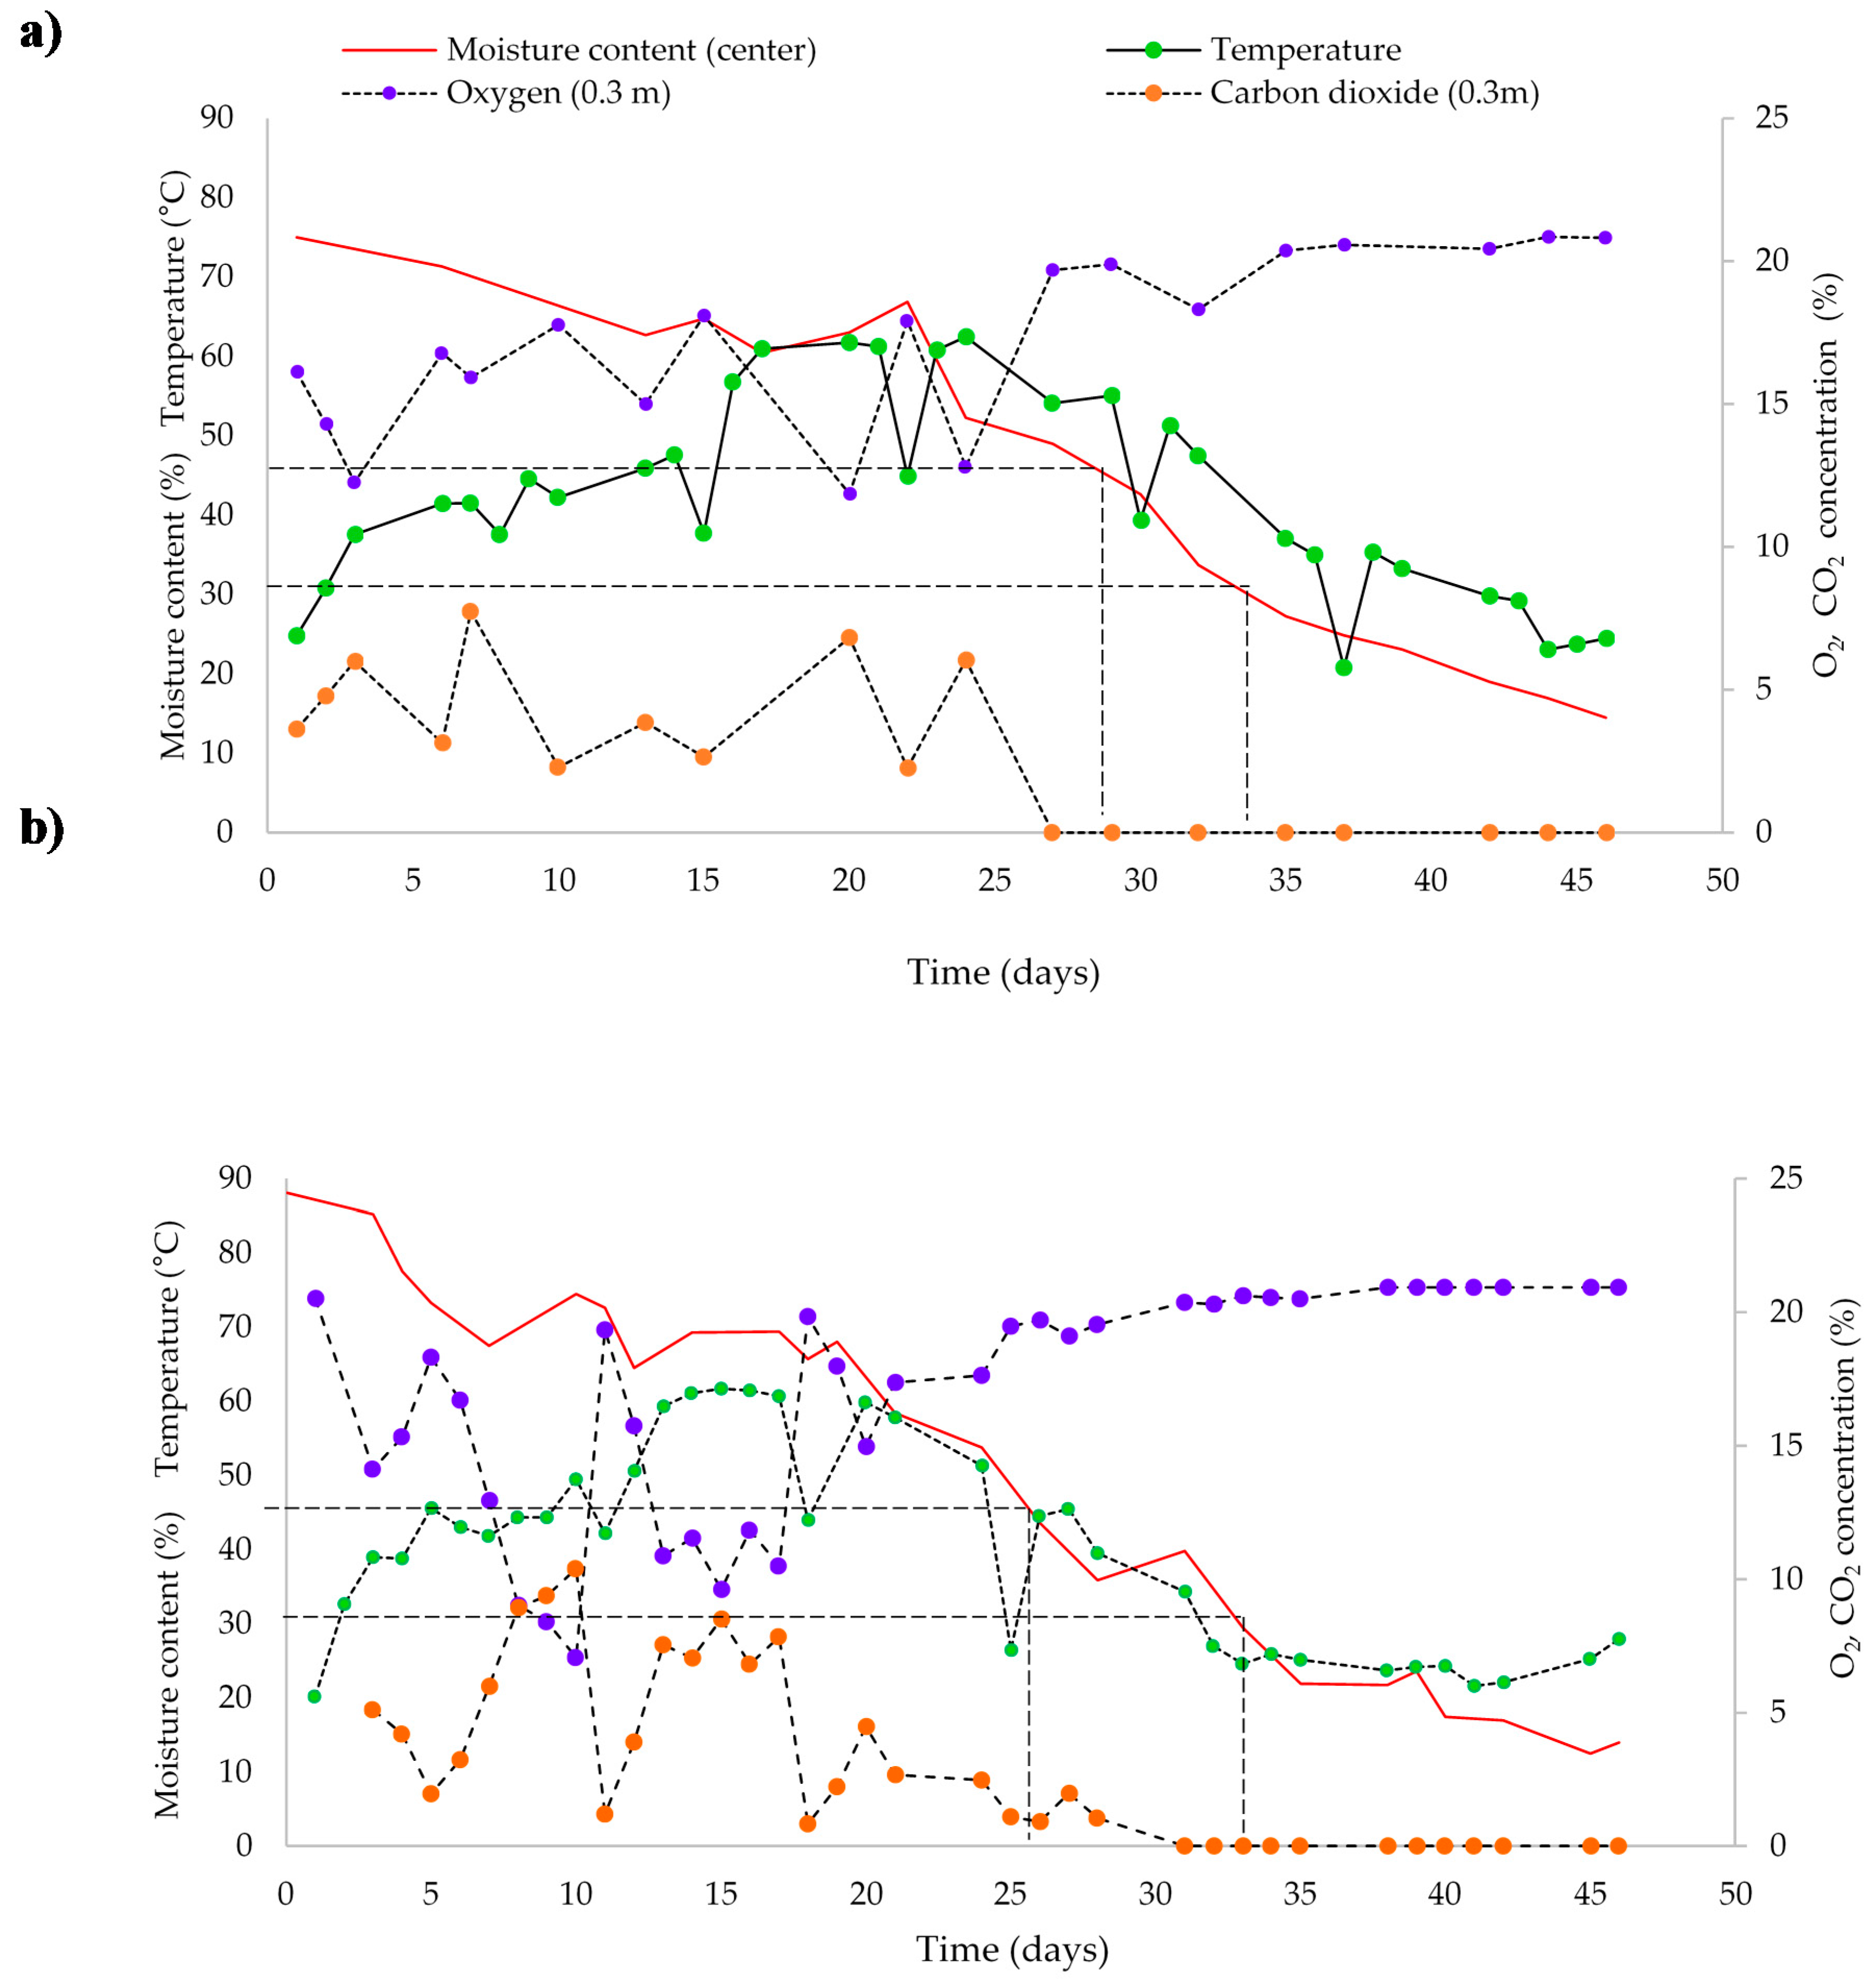
3.2. Decrease in Moisture and Drying Rate

Moisture reduction in greenhouse biodrying piles is the result of the increase in the temperature during the biodrying process due to the microbial activity in the waste mass, the relative humidity and air temperature inside the greenhouse (water concentration gradient in the air) and the level of air convection over the surface of the piles (velocity and its thermodynamic properties to obtain the mass transfer coefficient).
In a study carried out by Orozco et al. [22], under experimental conditions very similar to those of the present study, the authors found that during biodrying, it is possible to differentiate three phases: Phase I) when the temperature increases due to intense microbial activity; Phase II) when the pile temperature stabilizes because the rates of microbial heat generation and cooling of the pile by natural convection are balanced and Phase III) when the temperature drops due to the reduction of microbial activity. These authors also stated that the higher the turning frequency, the greater the reduction in moisture, since the loss of water vapor is favored; moreover, they calculated that the average evaporation of water during the 50 days of the biodrying process was approximately 4.58 kg of evaporated water per day.
For the present study, with a process lasting 46 days, the reduction of moisture both in the center and on the surface of both piles did not occur constantly throughout the process; additionally, by analyzing the relationship of this parameter with the behavior of the temperature in the piles, in Figure 2 it is possible to differentiate the three phases proposed by Orozco et al. [22]: Phase I corresponds to days 0 to 16 for P1 and 0 to 12 for P2; Phase II corresponds to days 16 to 31 for P1 and 12 to 26 for P2; Phase III can be located from days 31 to 46 for P1 and from 26 to 46 for P2.
It is important to note that although the start and end points of each phase do not coincide graphically for each pile, a relationship with the turnings is observed. While in P1 the first turning took place on day 7, in P2 the turning began on day 4 when the sugarcane bagasse was added, which resulted in a phase lag in the turning days without affecting the frequency (every 7 days). The influence of aeration is most clearly observed at the location of the boundary point of phases I and II immediately after the second turning, and the boundary point of phases II and III immediately after the fourth turning (Figure 2, turnings are shown with arrows).
Thus, it is observed that although Phase I lasted longer in P1 (16 days), the moisture reduction was lower (10.25%) than that achieved in P2, which remained in the first phase of biodrying for 12 days and reduced its moisture by 23.58%. Despite the above, the moisture obtained at the end of phase I was 64.75% for P1 and 64.49% for P2.
During Phase II, P1 achieved greater moisture reduction (26.42%) than P2 (20.89%), which can be attributed to this phase lasting longer in P1. Similarly, the longer duration of phase III (5 days more than the previous phases) resulted in a greater moisture reduction in P2 with 29.65%. The final moisture content of the process was 14.4% for P1 and 11.9% for P2.
For P1, the daily water removal (evaporation rate) was more intense during phase II, coinciding with the results shown in the work of Orozco et al. [23], while for P2, the highest drying rate occurred during phase I. Table 3 shows the percentage of moisture reduction and the mass of water removed per day for each pile during the three phases of biodrying. Water evaporation occurred at an average rate of 5.32 and 4.60 kg of water evaporated per day for P1 and P2, respectively (Table 3).
Moisture content is closely linked to microbial activity and therefore to the biodegradation of organic matter. In the present study, the calculation of the water removed/day in each phase of the biodrying was made considering that, based on the reduction of organic carbon in each pile, there was a degradation of organic matter of 11.6% and 14.9% for P1 and P2, respectively. These results are consistent with those reported by Orozco et al. [23], who emphasize that during biodrying, only 13% of the organic matter is degraded by microbial activity.
Both moisture (in the form of free and bound water) and the presence of nutrients in an organic waste pile favor microbial activity and thus the generation of metabolic heat, for which enzymatic activity is essential. When water acts as a solvent inside the cells, it forms solvation spheres in the dissolved molecules [24], so that enzymes have no activity if they are not adequately hydrated [25]. However, the amount of water available to microorganisms in a medium is not only a function of free water (water activity: aw), but also of the concentration of solutes (bound water) [17]. For example, for the growth of bacteria and yeasts on a substrate, minimum aw values of 0.90 and 0.88, respectively, are required [26]. On the other hand, the higher the temperature inside the pile, the lower the hygroscopicity of the materials, resulting in a reduction in the number of active sites for water retention in the materials [27].
Based on the water sorption isotherm in orange waste [28], in the present study, where 80% of the material in the piles corresponds to orange waste, the aw values at which a decrease in the microbial activity would be expected, the driving force behind biodrying, are reached when the moisture in the solid is 30%.

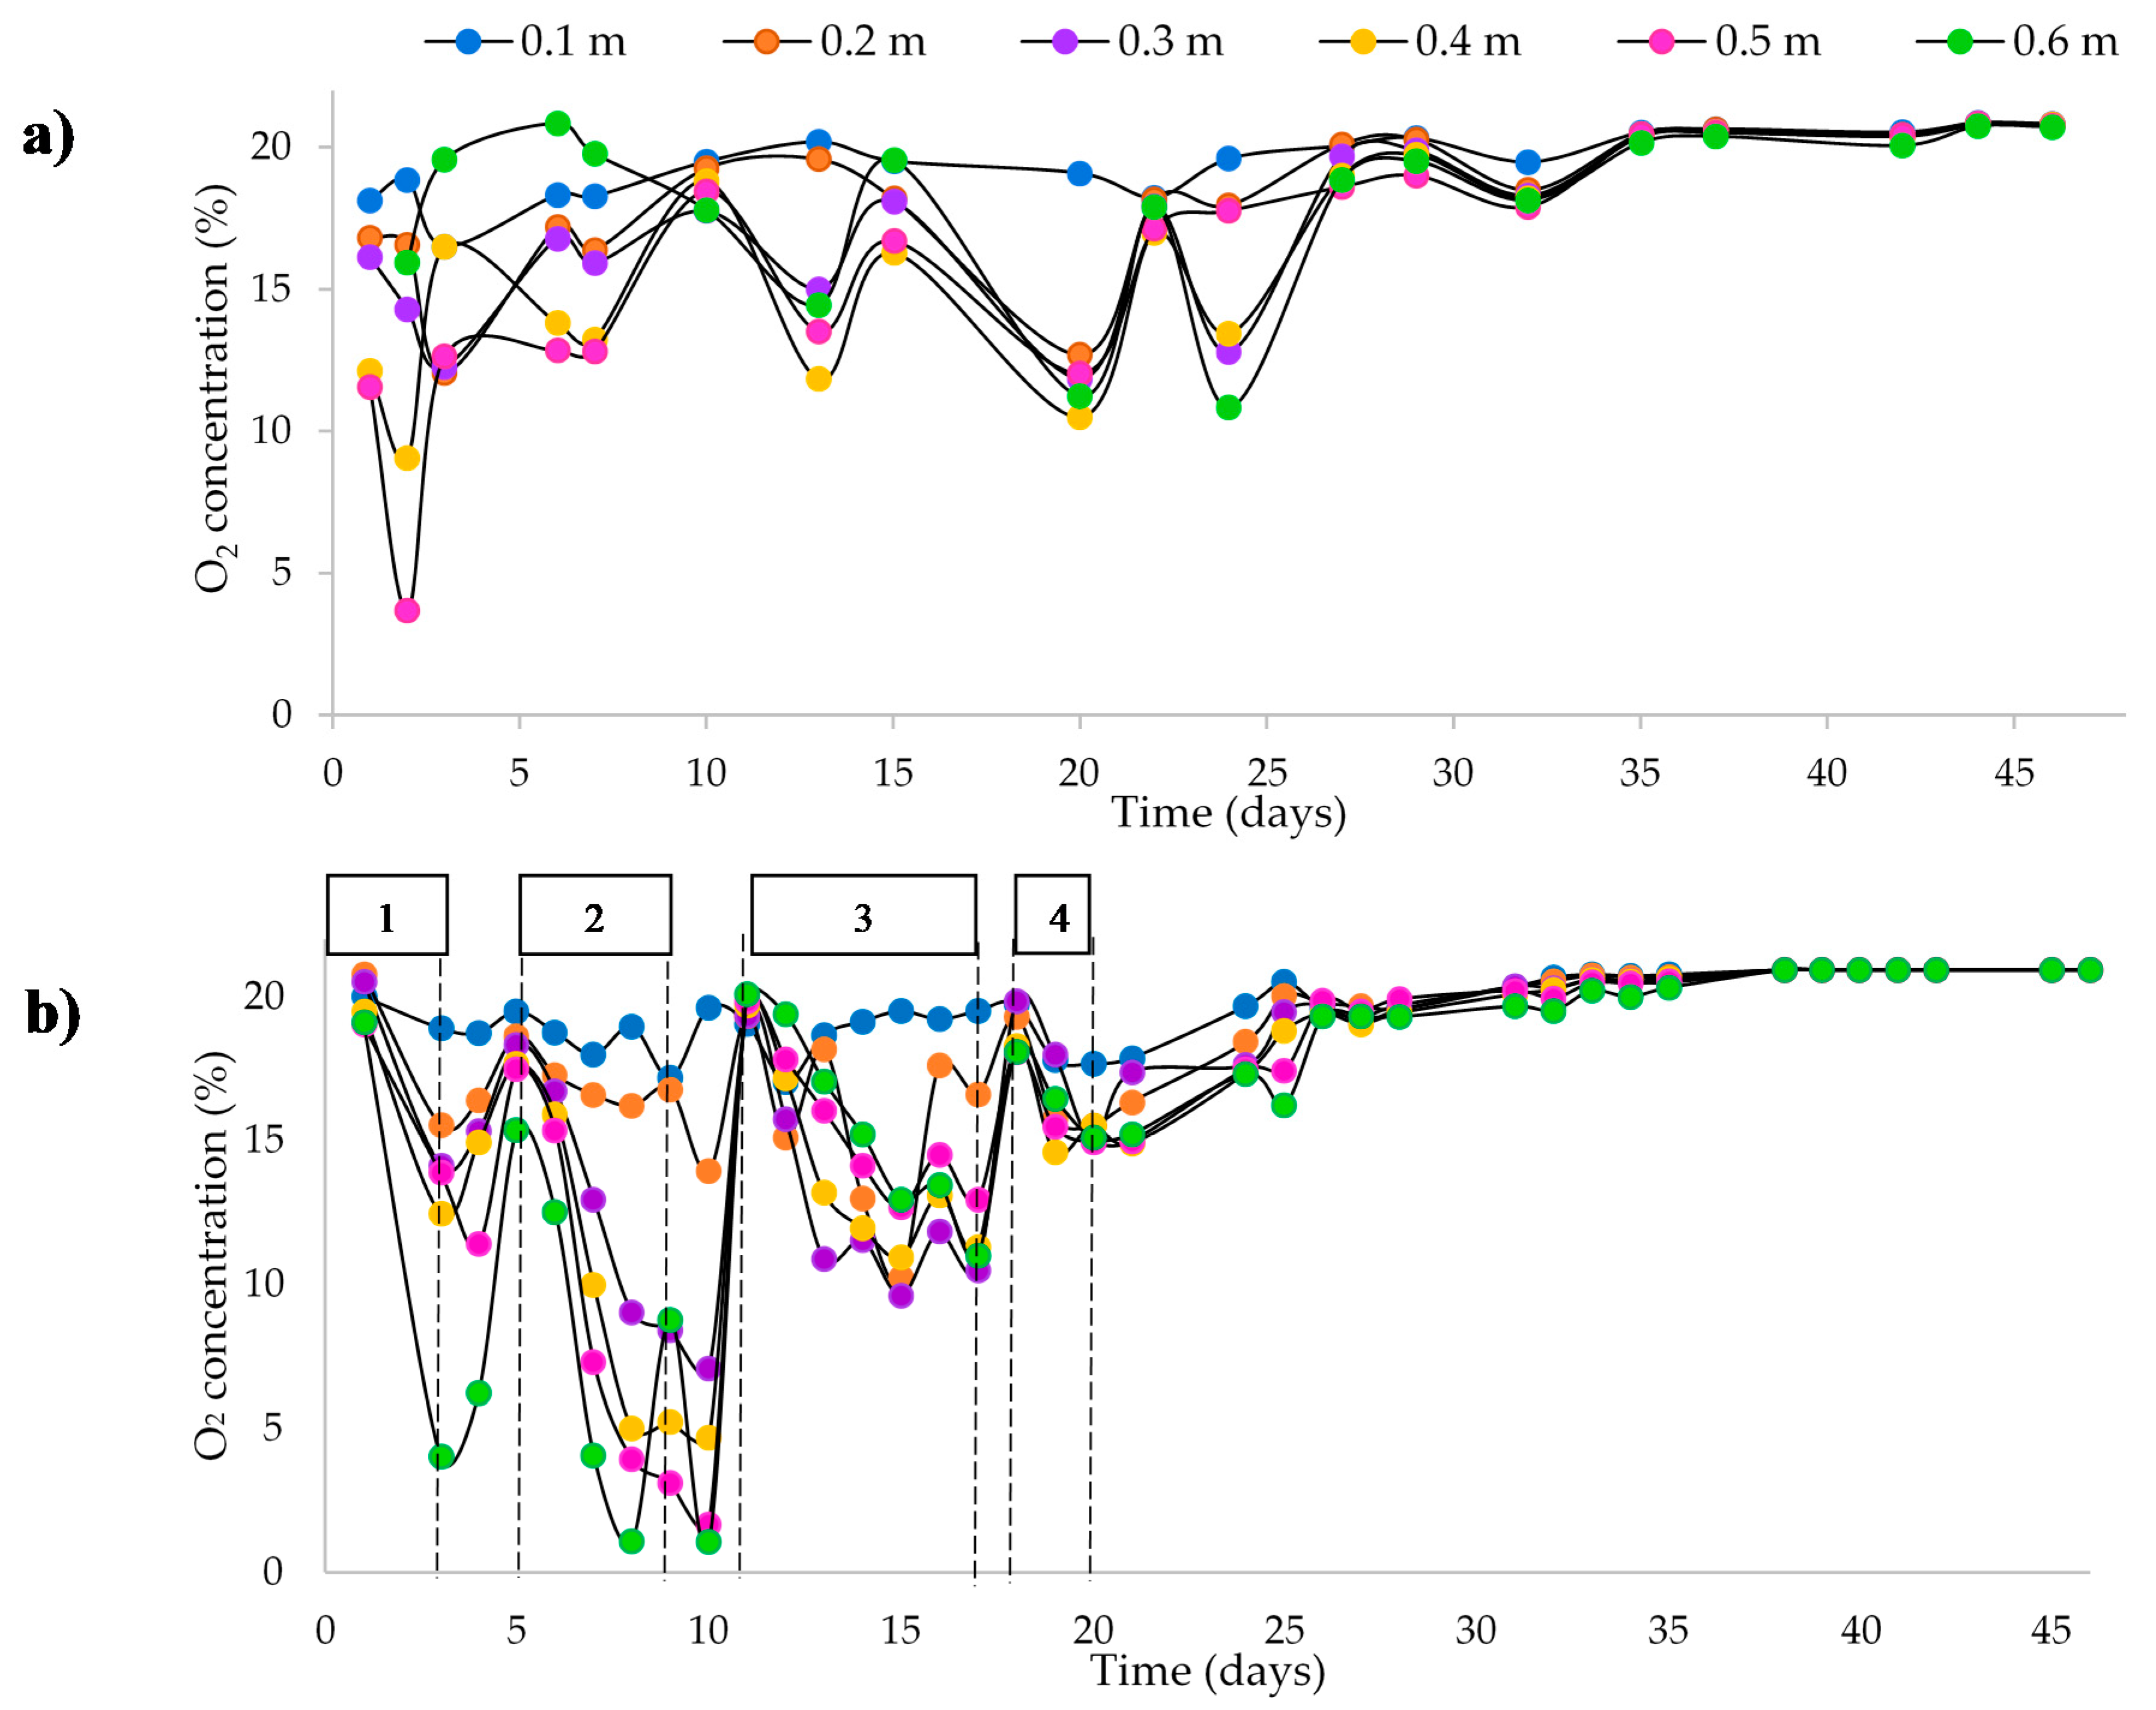
3.3. Behavior of the Oxygen Level Inside the Piles

Since biodrying is an aerobic biological process, the presence of O2 inside the piles is necessary to favor the degradation of organic matter, and thus, the generation of metabolic heat, without forgetting that moisture is the vehicle of oxygen. The O2 was supplied passively during almost the entire process and by periodically turning over the piles (every seven days). That is, between each turning, the O2 transfer depends on the environmental conditions inside the greenhouse, the depth level where the measurement is made and the degree of porosity of the pile. The mulch and sugarcane bagasse, used as structuring materials, favored the aeration of the piles.
Inside the pile, the O2 content decreases as a result of the consumption necessary for microbial activity, so that a balance is established between the natural transfer and consumption of O2. It is expected that the higher the O2 consumption due to microbial activity, the lower the levels recorded will be, and, in turn, these will be even lower at greater depths in the pile. When microbial activity ceases completely, the O2 content is 21% at any depth level in the pile, thereby corroborating that the porosity in both piles was also sufficient to allow natural O2 transfer. Based on this argument, it was necessary to perform calculations to determine the O2 transfer and consumption rates; the results are presented in Table 4. For the calculations, P2 was chosen because it had the highest O2 consumption, and the greatest depth was selected on the assumption that it would be the extreme case where microbial growth could be limited due to lack of oxygen. The results clearly show that the transfer of O2 into the pile was always higher than the consumption by the microorganisms. The level of O2 remaining at the end of each of the four time intervals considered was also calculated, obtaining results of the same order of magnitude between the experimental and the calculated ones, once the subtraction was made between O2 transfer and consumption: interval 1, 4% of experimental O2 vs. 1.26% calculated O2; interval 2, 1% of experimental O2 vs. 1.28% calculated O2; interval 3, 12% experimental vs. 10% calculated; interval 4, 15% experimental vs. 12% calculated.
Figure 3 shows the behavior of the O2 level in the piles over time and at different depths (on the horizontal (side to side) and vertical (top-down) plane). Due to the proximity to the surface of the piles, the O2 concentration at 0.1 and 0.2 m depth showed a different pattern with respect to the rest of depth levels assessed in both piles. The ANOVA for both piles shows that the oxygen concentrations at depths of 0.1 and 0.2 m were not significantly different (p < 0.05), showing the highest O2 level during the whole time that microbial activity was maintained (between 12.03% and 20.94% for P1 and between 10.23% and 20.94% for P2). This indicates a moderate consumption of O2 by the microorganisms (Table 4), and due to the proximity to the surface in each pile, the supply (oxygen transfer) met the O2 demand for microbial growth without major problems.
In the monitoring point at 0.3 m depth (considered as the central depth of the piles, Figure 1), the oxygen levels ranged from 12.64% to 20.94% for P1 and 7.07% to 20.52% for P2 during the whole process. Table 4 shows that the O2 transfer was always higher than the consumption by the microorganisms, which allows us to confirm that the turning frequency (every 7 days) in both piles was adequate in terms of incorporating air into the pile.
In P2 (excluding the points at 0.1 and 0.2 m), the lowest O2 concentration values (ranging from 1.06 to 7.07%) were recorded on day 10 of the process, which was due to the start of microbial growth at its highest rate (oxygen consumption = O C = μ m a x x o Y x O 2 ; µmax: maximum growth rate of the microbial population; xo: initial concentration of microbial biomass; YxO2: biomass yield to oxygen consumed, [29]), which caused a high consumption of this gas once the population had adapted to the nutrients that it began to degrade. This high O2 consumption was also favored by the porosity of the waste, providing favorable aeration levels to sustain the intense microbial activity (Table 4). This was best observed in P2, where sugarcane bagasse was used as a structuring material, which, as it lost moisture, presented greater porosity, favoring gas exchange between the pile and the outside.

3.4. Temperature Behavior

Microbial activity causes the increase in the temperature of the piles during biodrying; the evolution of this parameter in semi-static piles has already been widely reported [22,23,30,31]. These last authors estimated that only 35% of the metabolic heat generated during the biodrying process is used to raise the temperature inside the pile, while the remaining 65% is an energy contribution to evaporate the water contained in the waste. This contribution is only 13% of the total heat needed to evaporate the moisture, so the remaining 87% of the heat is provided by the convection of the air heated inside the greenhouse by solar irradiance, thus facilitating the stabilization and drying of the solid waste.
In this work, the thermophilic phase (period when temperature is above 45 °C) lasted from day 7 to day 32 for P1 (25 days) and lasted from day 5 to day 27 for P2 (22 days), Figure 2 shows the temperatures of the geometric, surface and lower centers of the P1 and P2 piles. The ANOVA for both piles shows that the temperatures recorded at the geometric center and surface center are not significantly different, but they are with the lower center temperatures, which were lower. When comparing these parameters between P1 and P2, no significant difference was found in the temperatures recorded in the center and on the surface, presenting a similar behavior, regardless of the proportions and type of structuring material used for the two piles.

3.5. O2 and CO2 and Their Relationship with the Moisture and Temperature Inside the Piles

The behavior of the moisture and temperature in the center of the piles and its relationship with the level of O2 and CO2 at 0.3 m depth is shown in Figure 4. Once the moisture in the pile reached levels below 45%, the concentration of O2 inside increased until it equaled the concentrations in the environment (21%). It is inferred that, from that moment on (day 27 (P1) and 26 (P2)) and in that particular stratum, the microbial activity was already decreasing as a consequence of the moisture reduction in the piles. From days 33–34, the O2 and CO2 levels were equal to those of the ambient air (21% and 0.03%, respectively), showing the total cessation of microbial activity (growth rate = 0).
The temperature in P2 remained between 25 and 30 °C after day 34, only due to solar irradiance and nighttime cooling, as shown by the mathematical biodrying process model proposed by Orozco et al. [23], for the behavior of temperature in the pile when there is no more microbial activity. In pile 2 on days 33–34, the moisture was 30% (43% on a dry basis), which corresponds to a water activity (aw) value of 0.9 in the model adapted from Smith for this work (Figure 5), which means that, as a result of the lower moisture level in the pile, for lower values of aw, and at values lower than 0.8, it is no longer possible to sustain the enzymatic activity of the bacteria, yeast and molds population, as shown in Table 5. However, in P1 after days 33–34, there was still reduced microbial activity as shown by the rise in temperature up to 40 °C after turning (day 36), which gradually decreased to the expected temperature of 25–30 °C. During this decreased microbial activity, oxygen consumption is so low that the transfer causes the levels of both gases to be practically the same as the ambient ones.
To explain this behavior, the adapted Smith’s model was used again (Figure 5); it indicates that at a moisture of 30%, the dry basis, (23% moisture in the pile) corresponds to an aw = 0.8, at which, according to the data in Table 5, the growth of at least the mold (fungus) population is possible. That is, when the pile 1 moisture was between 30% and 23%, the aw value was between 0.9 and 0.8 (corresponding to 43% and 30% moisture on a dry basis), sufficient to maintain microbial activity with a very low growth rate. This low microbial activity (but enough to raise the temperature to 38–40 °C; Figure 4a) caused low O2 consumption, which was completely covered by the O2 transfer shown in the results of Table 4, thus causing neither a decrease of O2 level nor an increase the concentration of CO2 (Figure 4a).
The water removal that occurred in the days after day 34 was the result of convective drying favored by the greenhouse conditions, achieving in this period a moisture decrease of 14% (P1) and 15% (P2).
Finally, it can be safely said that when O2 and CO2 levels reach ambient values, at any depth in the pile and after 30–35 days of biodrying, they will be indicative of the end of the microbial activity, due to their correspondence with an aw between 0.8 and 0.9, where each type of material to be biodried will have its own adsorption isotherm in which the moisture that is in equilibrium with its aw will be found.
It should be noted that the results of O2 consumption and CO2 production, observable in Figure 4, keep an equimolecular stoichiometry, as reported in the literature on microbial biochemistry, through the biological reaction of glucose: C6H12O6 + 6 O2 → 6 CO2 + 6 H2O + heat [29,32]. That is, taking any time interval where the oxygen level drops, its consumption will be practically equal to the CO2 production; for example, from day 15 to 20 in P1, the O2 consumption is 6% (18–12%) and the CO2 production is also 6% (8–2%); for P2, in the interval from day 5 to 10, the CO2 production is equal to the O2 consumption at a value of 9–10%.

3.6. Carbon, Nitrogen and Calorific Value

Based on the ANOVA, the biodried material obtained in both piles showed no significant differences in both %N (0.93% and 0.80% for P1 and P2, respectively) and in the final %C (42.74% and 40.36% for P1 and P2, respectively). There was also no difference in the CP obtained at the final moisture content of the bioprocess (15,272 kJ/kg for P1 and 15,832 kJ/kg for P2). Table 6 shows the overall results of the indirect indicators of the microbial activity during biodrying.
Orozco et al. [23] reported that biodried waste can retain 87% of the calorific value of the initial biomass on a dry basis after the biodrying process in semi-static piles of organic waste under conditions quite similar to those of the present work. The CP obtained at the final moisture content of P1 and P2 (14.4% and 11.9%, respectively) is comparable to the CP of wood fuels with 15% moisture, this being 15,360 kJ/kg [16]; in turn, it is also comparable to the CP of solid biofuel obtained by pyrolysis of orange peels (10,900–19,300 kJ/kg) reported by Monteiro-Santos et al. [33]. The increase in CP from wet to biodried waste allows highlighting the potential use of this bioprocess to stabilize waste with high moisture content and obtain a dry product that can be used as fuel. Table 7 shows the heat of combustion values of organic solid waste after the biodrying process, which range from 6964–17,139 kJ/kg, where the waste with the highest CP was the pile that was experimented on by Robles-Martínez et al. [31], placing the biodried material obtained in the present work among those that obtained the highest CP.

4. Conclusions

Three phases could be distinguished during the biodrying process; in the first two, microbial activity takes place that influences the temperature of the process and, therefore, the evaporation of water from the organic matter, while in the third phase the microbial activity ceases, and thus, drying is only carried out by convection. The O2 percentages found in the middle points of the pile were similar to those of the lower points and to one of the surface points, suggesting that the porosity provided by the type and proportion of the structuring materials used in each pile and the turning frequency were effective.
Through the behavior of the gases in the piles, it was shown that the microbial activity is limited by the moisture and its equilibrium with the water activity (aw), so that when the moisture was less than 35–30% (aw = 0.9), the microbial activity ceased completely, which was demonstrated by the O2 and CO2 values inside the pile, which were the same as those of the ambient air. Thus, the O2 concentration can be used as a reliable and safe indicator of the duration of microbial activity during biodrying. On the other hand, the decrease in moisture content of the waste after the cessation of microbial activity is attributed only to convective drying.
The biodried materials from both piles did not show statistically significant difference in terms of their calorific power, 15,272 kJ/kg (P1) and 15,832 kJ/kg (P2). In addition, the CP for both piles at the end of the process is comparable to that of wood fuels (15,360 kJ/kg) and solid biofuel from pyrolysis of orange peel (15,000 kJ/kg on average), demonstrating that the biodrying process is a suitable option for the stabilization and energy recovery of organic waste with high moisture content.

Author Contributions

Conceptualization F.R.-M.; methodology, R.M.C.-C., S.S.A.-G., L.M.-E. and L.C.B.-V.; validation, A.B.P.-G., C.O.-Á., F.R.-M., R.M.C.-C.; formal analysis, A.B.P.-G., C.O.-Á., F.R.-M., R.M.C.-C.; investigation, R.M.C.-C., S.S.A.-G., L.M.-E. and L.C.B.-V.; resources, A.B.P.-G., C.O.-Á. and F.R.-M.; data curation, A.B.P.-G., C.O.-Á., F.R.-M. and R.M.C.-C.; writing—original draft preparation, A.B.P.-G., C.O.-Á., F.R.-M., R.M.C.-C.; writing—review and editing, A.B.P.-G.; supervision, A.B.P.-G., C.O.-Á., F.R.-M.; project administration, F.R.-M.; funding acquisition, A.B.P.-G., F.R.-M. All authors have read and agreed to the published version of the manuscript.

Funding

This work was supported by research grant SIP-20170828 and SIP-20180146 from the Instituto Politécnico Nacional in Mexico.

Institutional Review Board Statement

Not applicable.

Informed Consent Statement

Not applicable.

Data Availability Statement

The data presented in this study are available on request from the corresponding author.

Acknowledgments

The authors thank the General Directors of Junamex S.A. de C.V. (Teresa Contreras Castillo and Mario Roberto Rebolledo Cortés) for the donation of the organic waste used in this work. R.M.C.C. and L.C.B.V. were recipients of scholarships from CONACyT-Mexico.

Conflicts of Interest

The authors declare no conflict of interest. The funders had no role in the design of the study; in the collection, analyses, or interpretation of data; in the writing of the manuscript, or in the decision to publish the results.

Appendix A

The estimated oxygen supply will be equal to the oxygen transfer rate
O T R = k L a s o [ C e q C L ] ;   k g   O 2 L   d ; Oxygen transfer rate [29]
k L = S h D O 2 d p a r ( 3600   ×   24 ) ;   m / d   ; Mass transfer coefficient in the liquid phase;
S h = 0.683   R e 0.466   S c 0.333 ; 40 < R e < 4000 ; Sherwood number [37]
  D O 2 = 2.4   × 10 9   m 2 s ; Diffusivity of oxygen in liquid water
d p a r = 6 T a s o ; Equivalent particle diameter;   d p = 0.0142   m
Γ = 0.68; shape factor of the particle (table 9.1, pag. 245) when h = 6.67 φ, considering the pile
residues as cylinders of diameter (φ) =0.015 m; and height (h) = 0.10 m; [38]
a s o : surface area of the particle; a s o = p a r t i c l e   a r e a p a r t i c l e   v o l u m e
p a r t i c l e   a r e a = π φ h + 2 ( π 4 φ 2 ) ; p a r t i c l e   v o l u m e = π 4 φ 2 h ; aso = 287 m−1
S c = μ O 2 ρ O 2 D O 2 ; Schmidt number
μ O 2 = 2.194   × 10 5   k g m   s   ; oxygen viscosity
ρ O 2 = 1.2068   × 10 5   k g m 3 ; oxygen density
R e = d p a r   v   ρ O 2 μ O 2 ; Reynolds number
v = 0.29 m/s; air velocity through the bed of solids and cleared from the Ergun equation:
Δ P L = [ 150 ( 1 ε ) 2 μ a i r e ε 3 d p a r 2 ] v +   [ 1.75   ( 1 ε ) ρ a i r e ε 3 d p a r ] v 2 [38]
μ a i r e = 1.941   × 10 5   k g m   s   ; air viscosity;
ρ a i r e = 1.109   k g m 3   ; air density
ε = 0.1 ; pile porosity [23];
L = 0.64 m; pile height
ΔP = 2078 Pa; pressure drop through the pile;
Δ P = ρ p i l e L   g ;   ρ p i l e = 331   k g / m 3 ; g = 9.81 m/s2
Δ P L = c ; [ 150 ( 1 ε ) 2 μ a i r e ε 3 d p a r 2 ] = b ; [ 1.75   ( 1 ε ) ρ a i r e ε 3 d p a r ] = a
c = b v + a v 2 ; f i n a l l y :   v 2 + b a v c a = 0 ; t h e   v a l u e   o f   t h e   p o s i t i v e   r o o t   w i l l   b e   ( v )
[ C e q C L ] ; kg O2/L
CL: concentration of oxygen dissolved in water; for this calculation it was considered equal to zero
Ceq: concentration of oxygen dissolved in water and in equilibrium with the concentration of oxygen in the air
C e q = f O 2 P t o t a l H 10 3 ; kg O2/L; [29]
H = 28.52 L. atm/g O2, at 35 °C; Henry’s constant; f O 2 : oxygen fraction; Ptotal: total pressure for a pile
depth of 0.6 m in Mexico City. Finally, the Ceq was calculated at the different f O 2 averages of Table 4 (%)
O2 v/v, converted to fraction) and at a Ptotal = 0.79 atm, obtaining the following results:
f O 2
(average)
Ceq
(×10-6 kg O2/L)
0.1153.19
0.0802.22
0.1604.43
0.1654.57

References

  1. Rodionova, M.V.; Poudyal, R.S.; Tiwari, I.; Voloshin, R.A.; Zharmukhamedov, S.K.; Nam, H.G.; Zayadan, B.K.; Bruce, B.D.; Hou, H.J.M.; Allakhverdiev, S.I. Biofuel production: Challenges and opportunities. Int. J. Hydrog. Energy 2017, 42, 8450–8461. [Google Scholar] [CrossRef]
  2. San Miguel, G.; Gutiérrez-Martín, F. Tecnologías para el Uso y Transformación de Biomasa Energética; Mundi-Prensa: Madrid, Spain, 2015; p. 442. [Google Scholar]
  3. FAO. Pérdidas y Desperdicios de Alimentos en América Latina y el Caribe; Tercer Boletín; FAO Regional Office for Latin America and the Caribbean: Santiago, Chile, 2016. [Google Scholar]
  4. Debernardi, T.D.; Contreras, R.M.; Piña, A.B.; Robles, F.; Aguilar, N.; Murguía, J. Management of Orange (Citrus sinensis) wastes from agroindustrial activities using sustainable biodrying and composting processes. In Agricultural Research Updates; Gorawala, P., Mandhatri, S., Eds.; Nova Science Publishers: New York, NY, USA, 2017; Volume 19, pp. 97–123. [Google Scholar]
  5. Barbosa-Evaristo, A.; Saraiva-Grossi, J.A.; Oliveira-Carneiro, A.; Duarte-Pimentel, L.; Yoshimitsu-Motoike, S.; Kuki, K.N. Actual, and putative potentials of macauba palm as feedstock for solid biofuel production from residues. Biomass Bioenerg. 2016, 85, 18–24. [Google Scholar] [CrossRef]
  6. Dai, J.; Saayman, J.; Grace, J.R.; Ellis, N. Gasification of woody biomass. Annu. Rev. Chem. Biomol. Eng. 2015, 6, 77–99. [Google Scholar] [CrossRef]
  7. Joshi, G.; Pandey, J.K.; Rana, S.; Rawat, D.S. Challenges and opportunities for the application of biofuel. Renew. Sust. Energ. Rev. 2017, 79, 1013–1026. [Google Scholar] [CrossRef]
  8. Dziedzic, K.; Łapczyńska-Kordon, B.; Malinowski, M.; Niemiec, M.; Sikora, J. Impact of aerobic biostabilization and biodrying process of municipal solid waste on minimization of waste deposited in landfills. Chem. Process Eng. 2015, 36, 381–394. [Google Scholar] [CrossRef] [Green Version]
  9. Dominczyk, A.; Krzystek, L.; Ledakowicz, S. Biodrying of organic municipal wastes and residues from the pulp and paper industry. Dry. Technol. 2014, 32, 1297–1303. [Google Scholar] [CrossRef]
  10. Yang, B.; Zhang, L.; Jahng, D. Importance of Initial Moisture Content and Bulking Agent for Biodrying Sewage Sludge. Dry. Technol. 2014, 32, 135–144. [Google Scholar] [CrossRef]
  11. Wu, Z.Y.; Cai, L.; Krafft, T.; Gao, D.; Wang, L. Biodrying performance and bacterial community structure under variable and constant aeration regimes during sewage sludge biodrying. Dry. Technol. 2018, 36, 84–92. [Google Scholar] [CrossRef]
  12. Robles-Martínez, F.; Ramírez-Sánchez, I.M.; Piña-Guzmán, A.B.; Colomer-Mendoza, F.J. Efecto de la adición de agentes estructurante a residuos hortícolas en tratamientos aerobios. INAGBI 2010, 2, 45–51. [Google Scholar] [CrossRef] [Green Version]
  13. Mohammed, M.; Ozbay, I.; Durmusoglu, E. Biodrying of green waste with high moisture content. Process Saf. Environ. Protect. 2017, 3, 420–427. [Google Scholar] [CrossRef]
  14. Navaee-Ardeh, S.; Bertrand, F.; Stuart, P. Key variables analysis of a novel continuous biodrying process for dryed mixed sludge. Bioresour. Technol. 2010, 101, 3379–3387. [Google Scholar] [CrossRef]
  15. Cai, L.; Chen, T.-B.; Zheng, S.-W.; Liu, H.-T.; Zheng, G.-D. Decomposition of lignocellulose and readily degradable carbohydrates during sewage sludge biodrying, insights of the potential role of microorganisms from a metagenomic analysis. Chemosphere 2018, 201, 127–136. [Google Scholar] [CrossRef]
  16. Valter-Francescato, E.A.; Luca, Z.B. Manual de Combustibles de Madera; Asociación Española de Valorización Energética de la Biomasa AVEBIOM: Valladolid, Spain, 2008; p. 79. [Google Scholar]
  17. Hamidian, A.; Sarshar, Z.; Stuart, P.R. Technoeconomic analysis of continuous biodrying process in conjunction with gasification process at pulp and papermills. Dry. Technol. 2017, 35, 300–311. [Google Scholar] [CrossRef]
  18. DOF. Norma Oficial Mexicana. NOM-021-RECNAT-2000. In Especificaciones de Fertilidad, Salinidad y Clasificación de Suelos, Estudio, Muestreo y Análisis; Diario Oficial de la Federación; SEMARNAT: Mexico City, Mexico, 2003. [Google Scholar]
  19. DOF. Norma Mexicana. NMX-AA-33-1985. In Protección Al Ambiente-Contaminación del Suelo-Residuos Sólidos Municipales-Determinación Del Poder Calorífico Superior; Diario Oficial de la Federación; SEMARNAT: Mexico City, Mexico, 1992. [Google Scholar]
  20. Osorio, G. Buenas Prácticas Agrícolas (BPA) y Buenas Prácticas de Manufactura (BPM) en la Producción de Caña y Panela; FAO: Medellín, Colombia, 2007. [Google Scholar]
  21. Tom, A.P.; Pawels, R.; Haridas, A. Biodrying process: A sustainable technology for treatment of municipal solid waste with high moisture content. Waste Manag. 2016, 49, 64–72. [Google Scholar] [CrossRef] [PubMed]
  22. Orozco-Álvarez, C.; Díaz-Megchún, J.; Díaz-Hernández, M.; Robles-Martínez, F. Efecto de la frecuencia de volteo en el biosecado de residuos sólidos orgánicos. Rev. Int. de Contam. Ambient. 2019, 35, 979–989. [Google Scholar] [CrossRef]
  23. Orozco-Álvarez, C.; Molina-Carbajal, E.; Díaz-Megchún, J.; Osorio-Mirón, A.; Robles-Martínez, F. Desarrollo de un modelo matemático para el biosecado de residuos sólidos orgánicos en pilas. Rev. Int. Contam. Ambient. 2019, 35, 79–90. [Google Scholar] [CrossRef]
  24. Soda, K. Structural and thermodynamic aspects of the hydrophobic effect. Adv. Biophys. 1993, 29, 1–54. [Google Scholar] [CrossRef]
  25. Mentré, P. Water in the orchestration of the cell machinery. Some misunderstandings: A short review. J. Biol. Phys. 2012, 38, 13–26. [Google Scholar] [CrossRef] [Green Version]
  26. Safefood 360. Safefood 360° Inc. 2014, Retrieved from Water Activity (aw) in Foods. Available online: https://www.safefood360.com/resources/Water-Activity.pdf (accessed on 10 February 2021).
  27. Téllez-Pérez, C.; Sobolik, V.; Montejano-Gaitán, J.G.; Abdulla, G.; Allaf, K. Impact of swell-drying process on water activity and drying kinetics of Moroccan pepper (Capsicum annum). Dry. Technol. 2015, 33, 131–142. [Google Scholar] [CrossRef]
  28. Omaña, M.; Cortes, F.; Isáza, C.; García, A. Isotermas de sorción de agua en residuos de extracción de jugo de naranja. Biotecnol. Sect. Agropecu. Agroind. 2010, 8, 61–67. [Google Scholar]
  29. Bailey, J.E.; Ollis, D.F. Metabolic Stoichiometry and Energetics. Biochemical Engineering Fundamentals; McGraw-Hill Education: Dunfermline, UK, 1986; p. 984. [Google Scholar]
  30. Colomer-Mendoza, F.J.; Robles-Martínez, F.; Herrera-Pratz, L.; Gallardo-Izquierdo, A.; Bovea, M.D. Biodrying as a biological process to diminish moisture in gardening and harvest wastes. Environ. Dev. Sustain. 2012, 14, 1013–1026. [Google Scholar] [CrossRef] [Green Version]
  31. Robles-Martínez, F.; Gerardo-Nieto, O.; Piña-Guzmán, B.; Montiel-Frausto, L.; Colomer-Mendoza, F.J.; Orozco-Álvarez, C. Obtención de un combustible alterno a partir del biosecado de residuos hortofrutícolas. Rev. Int. Contam. Ambient. 2013, 29, 79–88. [Google Scholar]
  32. Conn, E.E.; Stumpf, P.K. Bioquímica Fundamental; Editorial Limusa: Mexico City, Mexico, 1980. [Google Scholar]
  33. Monteiro-Santos, C.; Dweck, J.; Silva-Viotto, R.; Rosa, A.; Cardoso de Morais, L. Applications of Orange peel waste in the production of solid biofuels and biosorbents. Bioresour. Technol. 2015, 196, 469–479. [Google Scholar] [CrossRef] [PubMed]
  34. Adani, F.; Baido, D.; Calcaterra, E.; Genevini, P.L. The influence of biomass temperature on biostabilization-biodrying of municipal solid waste. Bioresour. Technol. 2002, 83, 173–179. [Google Scholar] [CrossRef]
  35. Shao, L.-M.; Ma, Z.-H.; Zhang, H.; Zhang, D.-Q.; He, P.-J. Bio-drying and size sorting of municipal solid waste with high water content for improving energy recovery. Waste Manag. Res. 2010, 30, 1165–1170. [Google Scholar] [CrossRef]
  36. Dach, J.; Bode, S. Biological Drying of Biowaste to Generate Biomass. In Proceedings of the ORBIT 2006 5th International Conference, Biological Waste Management, From Local to Global, Weimar, Germany, 13–15 September 2006; pp. 859–866. [Google Scholar]
  37. Cengel, Y.A.; Ghajar, A.J. Transferencia de Calor y Masa, 4th ed.; McGraw-Hill: Mexico City, Mexico, 2011; Volume 7. [Google Scholar]
  38. Barboza-Cánovas, G.V.; Ibarz, A. Operaciones Unitarias en la Ingeniería de Alimentos; Ediciones Mundi-Prensa: Madrid, Spain, 2005; Volume 9. [Google Scholar]
Figure 1. Location of the tubes inside the piles to carry out the determination of O2 and CO2.
Processes 09 00520 g001
Figure 2. Behavior of temperature and moisture during the biodrying process in P1 (a) and P2 (b). Arrows indicate turnings.
Processes 09 00520 g002
Figure 3. Percentage of O2 at different depths (0.1, 0.2, 0.3, 0.4, 0.5 and 0.6 m) of (a) pile P1 and (b) pile P2 during the biodrying process.
Processes 09 00520 g003
Figure 4. Behavior of %O2 and %CO2 at 0.3 m depth, of center temperature and center moisture of P1 (a) and P2 (b).
Processes 09 00520 g004
Figure 5. Sorption isotherm [28].
Processes 09 00520 g005
Table 1. Proportion of materials in waste piles.
MaterialComposition
Pile 1Pile 2
(kg)(%)(kg)(%)
Orange peel394.379.829779.8
Mulch50.210.213.33.5
Carrot bagasse49.510.00.00.0
Sugarcane bagasse0.00.06216.7
Total494100372.3100
Turning frequencyEvery 7 days
Table 2. Overall results of the biodrying of the waste piles.
PILETime
(days)
Weight
(kg)
Volume
(m3)
Density
(kg/m3)
Water
Content
(%)
Total Water
(kg)
Weight
Reduction
(%)
Volume
Reduction
(%)
Density
Reduction
(%)
Water
Content
Reduction
(%)
STARTP10494.01.4933175370.5////
P20372.31.1332988327.62////
ENDP14681.510.44718214.411.7383.5704596.83
P24655.840.7467511.96.2585.0347798.09
Table 3. Drying rates of waste piles.
Duration
(Days)
Moisture Reduction
(%)
Drying Rate
(kg Water per Day)
P1P2P1P2P1P2
Phase I0 to 160 to 1210.2523.584.068.12
Phase II16 to 3112 to 2626.4220.897.564.11
Phase III31 to 4626 to 4623.9329.654.432.55
Overall drying rate5.324.60
Table 4. Experimental consumption and estimated oxygen supply at 60 cm depth in pile 2.
Interval 1Interval 2Interval 3Interval 4
P1P2P1P2P1P2P1P2
% O2, v/v19415120121815
Average between start and end; % O2 v/v11.581616.5
Days035911171820.5
ΔO2; % O2 v/v151483
Δt; days3462.5
Oxygen consumption (OCexp=ΔO2 /100/Δt); Liters_O2/Liters of air per day0.0500.0350.0130.012
Wet pile weight; water loss of 7.79 kg /day494471455424408362354334
Average pile weight (pw); kg482439385344
Pile porosity (ε)0.10.10.10.1
Air occluded in the pile (Ap = pw * ε); kg48.2343.9538.4934.40
Oxygen consumption in the pile (OCP= OCexp * 32/29 * Ap);
kg O2/day
2.661.700.570.46
* Estimated oxygen supply (OS = OTR * Vpile), kg O2/day3.322.314.624.77
Oxygen remaining in the porosity
[Or=(OS-OCP) * 100 * ρairoxygen], % v/v
-1.26-1.28-10-12
* The calculation sequence for estimating the oxygen supply to the moisture in the pile is presented in Appendix A. All properties were estimated at 35 °C.
Table 5. Minimum aw values for the growth of microorganisms.
Microorganismsaw
Bacteria0.90
Yeasts0.88
Molds0.80
Halophilic bacteria0.75
Xerophilic molds0.61
Osmophilic yeasts0.61
Table 6. Overall results of the indirect indicators of microbial activity during biodrying of waste piles.
PILETime
(Days)
Organic Matter (%)Carbon
(%)
Nitrogen
(%)
C/NpHOrganic Matter Reduction (%)Carbon Reduction (%)Nitrogen Increase (%)
STARTP1093.6954.340.7077.573.4000
P2095.4155.340.7672.753.6000
ENDP14673.6942.740.9345.598.2320.0011.60.23
P24669.5940.360.8049.886.7625.8214.90.04
Table 7. Heat of combustion of solid waste after biodrying.
Waste TypeHeat of Combustion (kJ/kg)Moisture
(%)
Process Time (days)CharacteristicsReference
Organic solid waste15,272
15,832
14.4
11.9
46
46
Pile 1
Pile 2
The present work
Organic solid waste17,139635In piles without forced aeration[31]
Organic solid waste from gardening and harvesting6964
15,688
50
12.5
12
30
In piles without forced aeration[30]
Municipal solid waste10,531
14,056
59
32
6
11
In a reactor with forced aeration [34]
Municipal solid waste10,3004816In a reactor with forced aeration[35]
Biological waste9900
11,200
20
30
14In tunnels with forced aeration[36]
Publisher’s Note: MDPI stays neutral with regard to jurisdictional claims in published maps and institutional affiliations.

