Article

Algorithm to Use Some Specific Lean Manufacturing Methods: Application in an Industrial Production Process

by
Ana Cornelia Gavriluţă
,
Eduard Laurenţiu Niţu
* and
Constantin Alin Gavriluţă
Department of Manufacturing and Industrial Management, University of Piteşti, 1 Târgul din Vale Street, 110040 Pitesti, Romania
*
Author to whom correspondence should be addressed.
Processes 2021, 9(4), 641; https://doi.org/10.3390/pr9040641
Submission received: 16 March 2021 / Revised: 1 April 2021 / Accepted: 5 April 2021 / Published: 6 April 2021
(This article belongs to the Section Manufacturing Processes and Systems)

Abstract

:
Lean Manufacturing includes an ensemble of methods to analyze and continuously improve the functioning of manufacturing systems. The research presented in the literature highlights the fact that these methods are, on their own, in a process of continuous improvement as tools, being used in different ways, for different production systems. The paper presents an algorithm that facilitates the choice of the performance evaluation method, and the choice of the method of improvement that needs to be implemented for an efficient analysis and for a continuous increase of the manufacturing system performance. In addition to these, for the JobObservation and 5S methods, chartflows are proposed and specific tools are developed (questionnaires, forms etc.) that are meant to facilitate the implementation and to focus (guide) the user in the direction of improvement for the analyzed process. The algorithm, techniques, and tools developed in this research were used in a case study that took place in a production system “plastic injection”. Thus, a series of important improvements were made in the functioning of the production system, consisting of the reduction of production area, decrease of cycle time, decrease of the number of operators, stabilization, standardization, and securing of the work processes. All this has led to the improvement of several key performance indicators (KPIs) of the production system. The analysis of the investment in the reorganization of the production system in relation to the obtained gains shows a payback of approximately 1 month, proving the efficiency of use in such a form of the Lean Manufacturing methods.

1. Introduction

In an economic environment in continuous change and with an exponential growth of competitivity, the focus on the development of products and innovative projects has become an essential component in the manufacturing of low-cost, high-quality products [1]. The search for cautious global strategies to respond to new challenges is caused not only by intense global competition but also by continuous evolution of clients demand [2]. Appearing as an evolution of manufacturing concepts, and perfectly corelated with the way companies of the 21st century evolve [3], the Lean Manufacturing method is a way of thinking and a way to adapt to changes, to reduce waste, and to continuously improve. The Lean Manufacturing method makes a company competitive due to the increase of productivity [4] and the discharge of activities with no added value, cutting the cost of product manufacturing [5].
The implementation of Lean Manufacturing in a manufacturing system involves a change in the management of operators and layout design. According to [6], the Lean Manufacturing is a method of analysis, management, and continuous improvement of a manufacturing system. Kumar et al. [7] states that the main objectives of these methods consist of a reduction of wastes, stock, human effort, duration of product manufacturing, and production surfaces to respond to client demand to make the needed products at the requested quality as economically and as efficiently as possible. In other words, companies managed according to Lean Manufacturing principles are characterized by simplified processes, fewer stocks of raw material, and finished products, as well as by a better quality of manufactured goods [8].
Over time, numerous studies have been made that have analyzed the publication of specific literature, as well as the way to implement and the effects of the Lean Manufacturing method in a company. Tortorella et al. [9] analyzed 19 representative papers for Lean Manufacturing literature that are cited frequently, and concluded that the most investigated problems are standardized work (87% articles) and workplace organization (73% articles). In the same study, the authors highlighted the most important aspects that must be considered by a successful company. Among them are the search for the health and safety of workers, ergonomics criteria for workstation design, workstations appropriate for workers, and anticipating and reducing the risk of incidents.
Ping-Kuo Chen et al. [10] made a study by interviewing 360 enterprises from China on the effects of Lean Manufacturing implementation. This study led to the following main conclusions: the implementation of Lean Manufacturing has a positive effect on green practices, an effect caused by the intended reduction of the impact of the method on the environment, and Lean Manufacturing encourages the employee’s involvement and contributes to the shaping of their behavior and attitudes.
Some elements discussed by research and company managers were then implemented in the production process to increase the manufacturing system productivity and the quality of products, and to decrease the duration of client order-making and the cost of production. Azemi et al. [11] made a study referring to Lean Manufacturing to prepare a company from Kosovo in its passage to the Industry 4.0 concept. After this study, the conclusion was that the most used method and tools of Lean Manufacturing are Value Stream Mapping, Kaizen, Kanban system, 5S, Six Sigma, and Standardized Work.
According to a study carried out by 20 manufacturing companies that implemented Lean Manufacturing [12], it was concluded that more than half the companies implemented 5S (15), Kaizen (10), Standardized work (7), Value Stream Mapping (VSM) (6), Poka-Yoke (3), and Kanban (2).
Lean Manufacturing is associated with automotive manufacturers, but it has spread rapidly in most industrial companies around the world [13], the electronics industry [14], wiring production [15], cosmetics, aluminum, the thermoplastics industry [16], construction [17], furniture [18,19], and plastics industry [20,21]. The implementation of the Lean Manufacturing method depends on the size of the enterprise, the nature of the industry and the degree of technological development of the country. Most industries tend to implement 5S and other visual management tools, Value Steam Mapping for waste identification, and designing process for better flow [22], while Australian companies do not use Kaizen and Kanban. According to Roslin [23], it is easy to say that Lean Manufacturing can be easily implemented anywhere and anytime, regardless of the industry. In reality, the transformation into a Lean Manufacturing company is a radical process and not an easy task. Lean Manufacturing requires a holistic approach to change.
To begin the process of transformation into a lean enterprise, a significant organizational change must take place within the organization [24]. The main transitions that an enterprise must go through in its transformation process are:
-
change in the process, by applying all lean methods and tools;
-
changes in operation, coordination and control, through teamwork-building, cross-functional movement, network relationship with suppliers and customers, information transparency, participative management, and teamwork-rewarding;
-
changes in human values and behavior, through teamwork, open communication and information sharing, continuous improvement culture, knowledge learning, and sharing;
-
changes of power in the organization, through decentralized responsibilities and autonomous leadership [25].
The challenges of transforming into a Lean Manufacturing enterprise are because Lean Manufacturing requires changes in the structure, system, process, and behavior of employees. The main barriers that may appear in the implementation of Lean Manufacturing within manufacturing SMEs(Small and Medium-sized Enterprises) are [26,27]: lack of top management support, financial and resource constraints, organizational culture, and lack of employee skill and expertise. To these barriers, Kleszcz [28] adds lack of standardization of the lean implementation process, implementing lean tools without implementing changes in the area of employee relations, lack of understanding, and unintelligible meters.
Although people involved in the improvement process are at the heart of Lean Manufacturing [29], Brito [30] highlighted that many failed attempts to implement Lean Manufacturing are due to the emphasis on lean techniques and methods, without considering the importance of human resources [31].
The main problems facing current companies, especially those in the plastics industry, are inefficient use of human resources, low flexibility, increased duration to manufacture products, and high level of waste. The implementation of the Lean Manufacturing method with the consideration of human resources can solve these problems, reducing the duration of products manufacturing by eliminating losses and optimization of manual handling activities and increasing worker effectiveness and safety [32].
Based on the above survey, in this article we propose an algorithm for applying specific Lean Manufacturing methods, to present in a logical way:
-
the choice of the method of evaluating the performance of the production system recommended to be used, depending on the characteristics of the production system,
-
the choice of the improvement method to be implemented according to the results of the system evaluation, to allow efficient analysis and continuous increase of the performance of a production system.
Subsequently, this algorithm is validated by its application to improve the performance of a production system in the plastics industry.

2. Materials and Methods

2.1. Algorithm for Applying Lean Manufacturing Methods

The algorithm proposed in this article is part of the authors’ research project, which aims to develop a methodology to improve production flows by integrating Lean Manufacturing methods, techniques, and tools. The specific feature of the algorithm consists of the fact that it proposes a logical sequence of application of specific Lean Manufacturing methods, in a pragmatic manner, facilitating their choice by the user.
For the evaluation of the production system, as an alternative to the VSM method (which is focused on the analysis of material and informational flow), it is proposed to use the JobObservation method (the method usually used in the study of work or to compare the condition of an SP (Production System) with a standard). For this purpose, the JobObservation method was readapted to evaluate the performance of the system—the “JobObservation method” stage and forms were developed/readapted, which would allow its pragmatic application.
On the other hand, depending on the results of the evaluation of the production system, specific Lean Manufacturing methods are proposed to be applied depending on the wastes identified for their elimination—in the “Improvement methods application” stage.
The specific steps of the algorithm for applying specific Lean Manufacturing methods are presented in Figure 1 and are summarized below.
“Identifying the characteristics of the production system” requires a familiarization with the operation of the production system. Within this stage the following data are identified:
-
data specific to the industrial system: layout, availability of energy sources (compressed air, electricity, etc.), and characteristics of the production environment;
-
data specific to the production process: technological process, production flow, and organizational elements of the process;
-
specific data of the products made: range of products made, packaging method, necessary raw materials, product specific requirements such as weight, quality, dimensions, fragility, etc.
“Choosing the method of evaluating the production system” involves choosing a method of analyzing the performance of the production system based on its characteristics and initial observations on the production system. The Lean Manufacturing literature recommends the Value Stream Mapping (VSM) method for the analysis of a production system [33]. The VSM method is an analytical method of analyzing the flow of materials and information, as well as the interactions between different components of the production process. Although it is a method of analysis of production systems that aims to identify and eliminate activities without added value, it is very difficult to visualize the production process, especially manual processes, in terms of process layout, unnecessary movement, security, safety and ergonomics of the workstation, and quantity and quality of work.
For this reason, for production systems with predominantly manual activities, we propose as an alternative the use of a method of analysis of the production system that is based on the visualization (observation) of production processes. This method is JobObservation, being especially suitable for the analysis of manual activities and less suitable for analytical and technical activities, where it is recommended to use the VSM method.
“Production system assessment” is the application of the method of analysis chosen in at the previous stage, VSM or JobObservation, to define, measure, and analyze the flow of “things that are transformed”, be it stocks, products or documents. The evaluation focuses on processes, people, identifying the problems and causes that led to these problems, and solving these problems.
At the stage of “Analysis of evaluation results”, the following are analyzed:
-
Stability and standards: the stability and standardization of the processes within the production system are analyzed;
-
Operator efficiency: the aim is to evaluate the efficiency of the use of operators within the production system;
-
Flow: it is checked if the production system works in a pull flow, continuously and in small production batches, preferably piece by piece (one piece flow), desideratum specific to just-in-time production (JIT);
-
Quality system: evaluates the ability of the production system to prevent, detect, and reduce errors that may lead to defects;
-
The team: the degree of involvement in problem-solving of the team members and of capitalization of their knowledge by the management team is evaluated.
If it is found that the indicators resulting from the analysis of the evaluation results are appropriate, respectively, if there are no activities without added value, work is carried out in a pull flow, teamwork is encouraged and employees are involved in the process of continuous improvement, then it can be said that the “production system is improved”.
If the indicators resulting from the evaluation are not appropriate, the “Improvement methods application” stage is completed. Thus, for the efficient application of specific Lean Manufacturing improvement methods, it is recommended to use the following methods:
-
if the production system is not organized, there is wasted time (with movement and multi-handling), wasted space and inventory, and the safety and ergonomics norms for people are not met, 5S and TPM(Total Productive Maintenance) methods will be implemented;
-
if in the production system the wastes and the causes of these wastes are difficult to identify, teamwork is not encouraged and employees are not involved in the process of identifying and improving losses, 5S and Kaizen methods will be implemented;
-
if the production system is not operating in a pull flow, the Kanban method will be implemented;
-
if the production system does not have the capacity to prevent, detect, and reduce errors that may lead to defects, the Jidoka and Poka-Yoke methods will be implemented;
-
if the involvement of team members in solving problems is low and the knowledge of team members is not properly used, the Hoshin methods and Kaizen Circles will be implemented.
To facilitate the understanding of the efficient application of the VSM evaluation method and of the TPM improvement methods, Kanban, Jidoka, Poka-Yoke, Hoshin, and Kaizen Circles in a production system, within the mentioned project, were developed and tested on platforms, which are detailed in [34,35,36].

2.2. JobObservation Method

The JobObservation method is the most reliable method for finding first-hand information about activities performed at a workstation or a production system. The method consists of observing the work process carried out by the operator/operators at the analyzed workstation and collecting information regarding how the work is performed, what equipment is used, what the work environment is like and any other relevant factor about the job. The JobObservation method uses techniques of direct observation of operators or of filming and analyzing the activities carried out by operators at the workplace. The analyst observes, collects, and analyzes information on activities performed and working conditions, while employees perform their daily tasks.
The proposed steps to use the JobObservation method for evaluating the performance of a production system are presented in Figure 2 and are summarized below.
“Observation preparation” is the first step in applying the JobObservation method. During this stage, the operators in the analysis area are informed about the initiated steps and the necessary documents for the work observation are prepared, respectively:
-
A form with general data of the system—Figure 3—contains general data about the production system, such as number of days worked per month, number of days worked per week, number of shifts worked per day, length of breaks, number of minutes per shift;
-
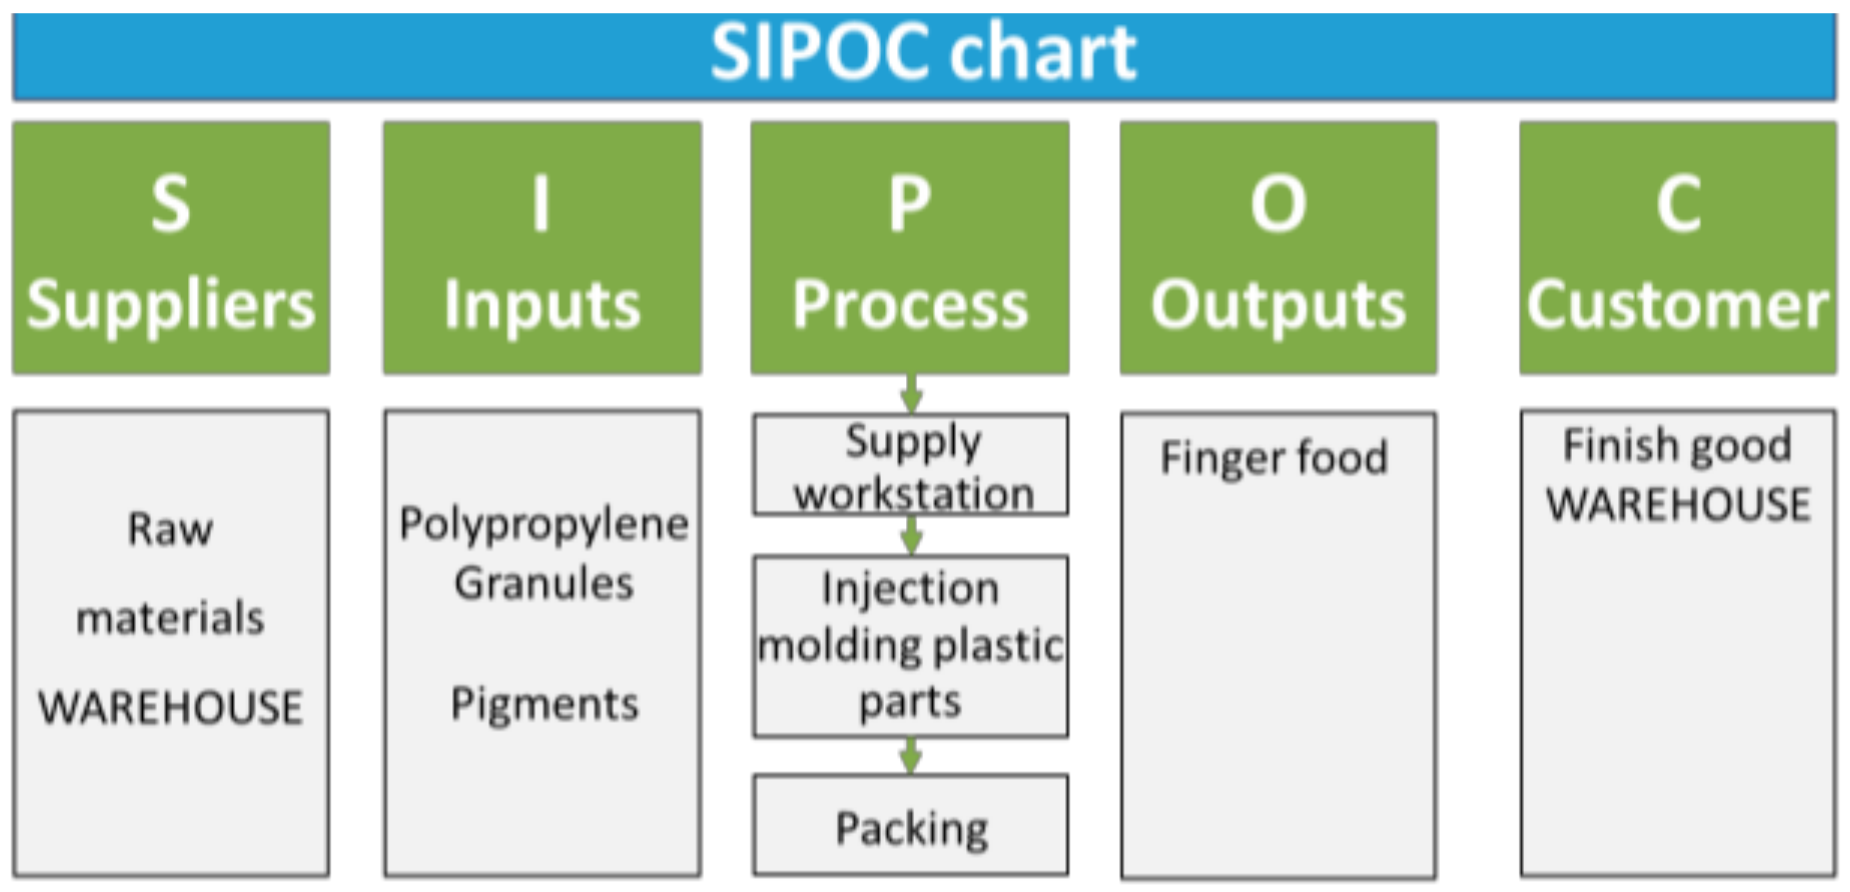
The SIPOC chart—Figure 4—the name SIPOC comes from every fundamental part of a process. Completing this questionnaire helps the analyst to better understand the entire operation of the production system;
-
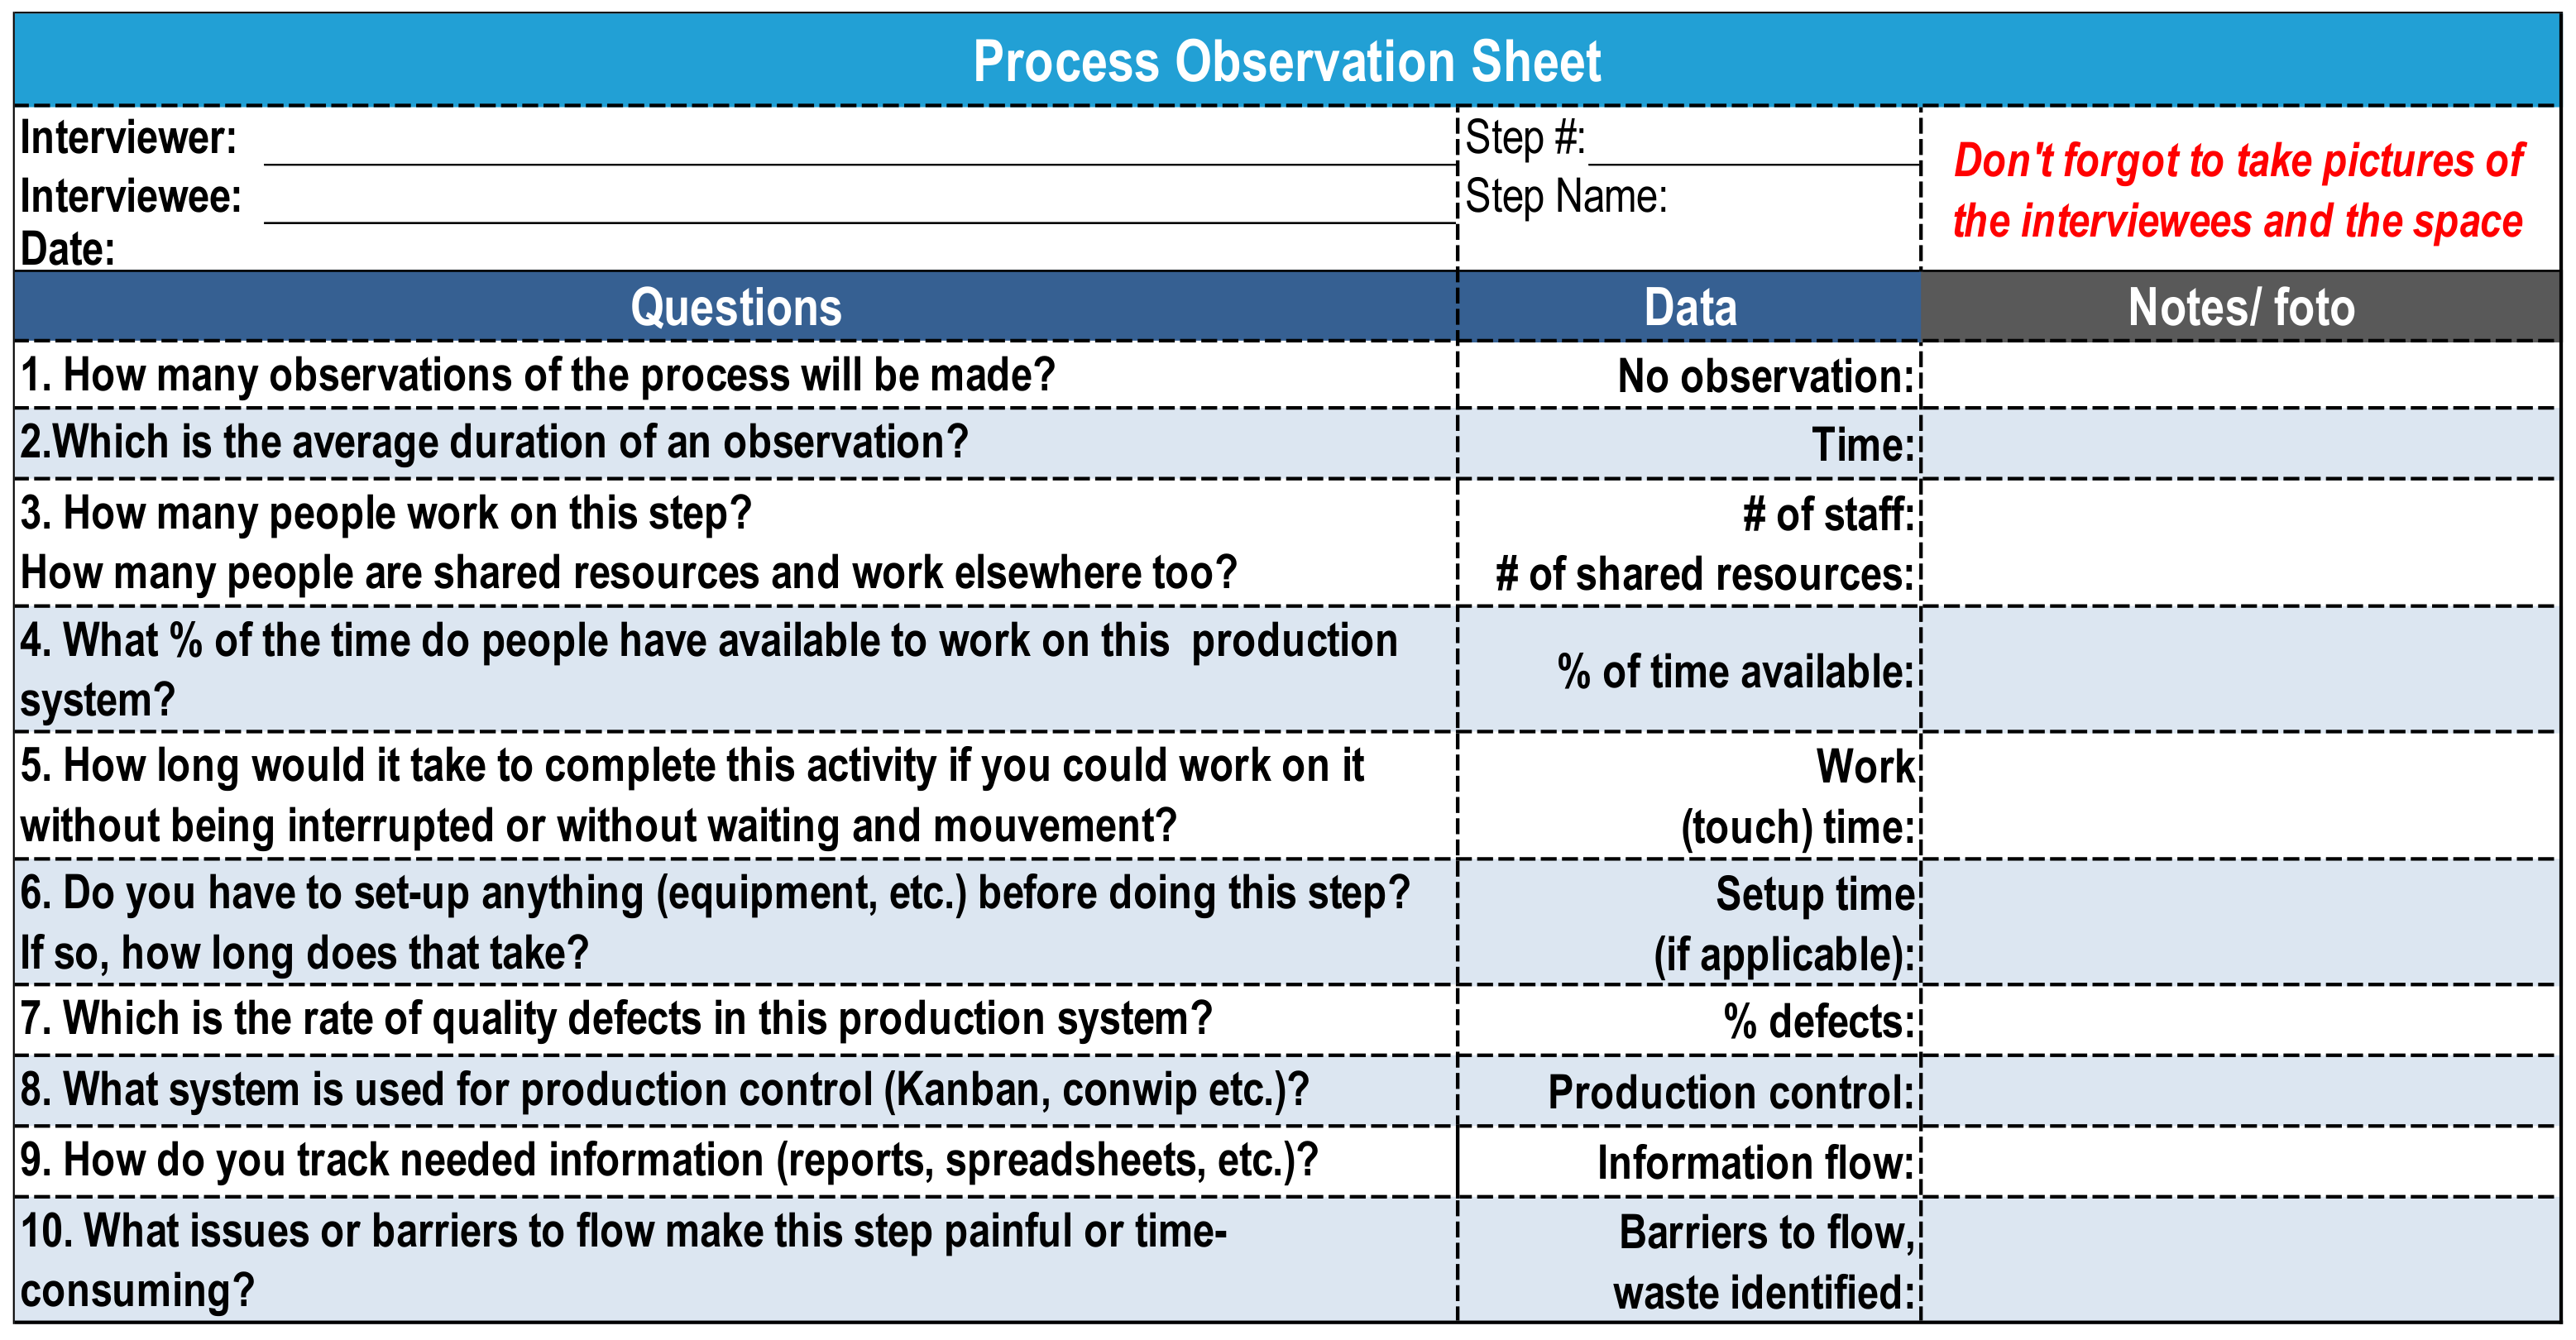
A questionnaire for process observation—Figure 5—contains the names of the people who make the questionnaire, the name and number of the process, an image (photo) or graphic representation with of the analyzed process and a series of questions about the process, such as: how many people work at this stage, how much time is available to work at this stage etc.
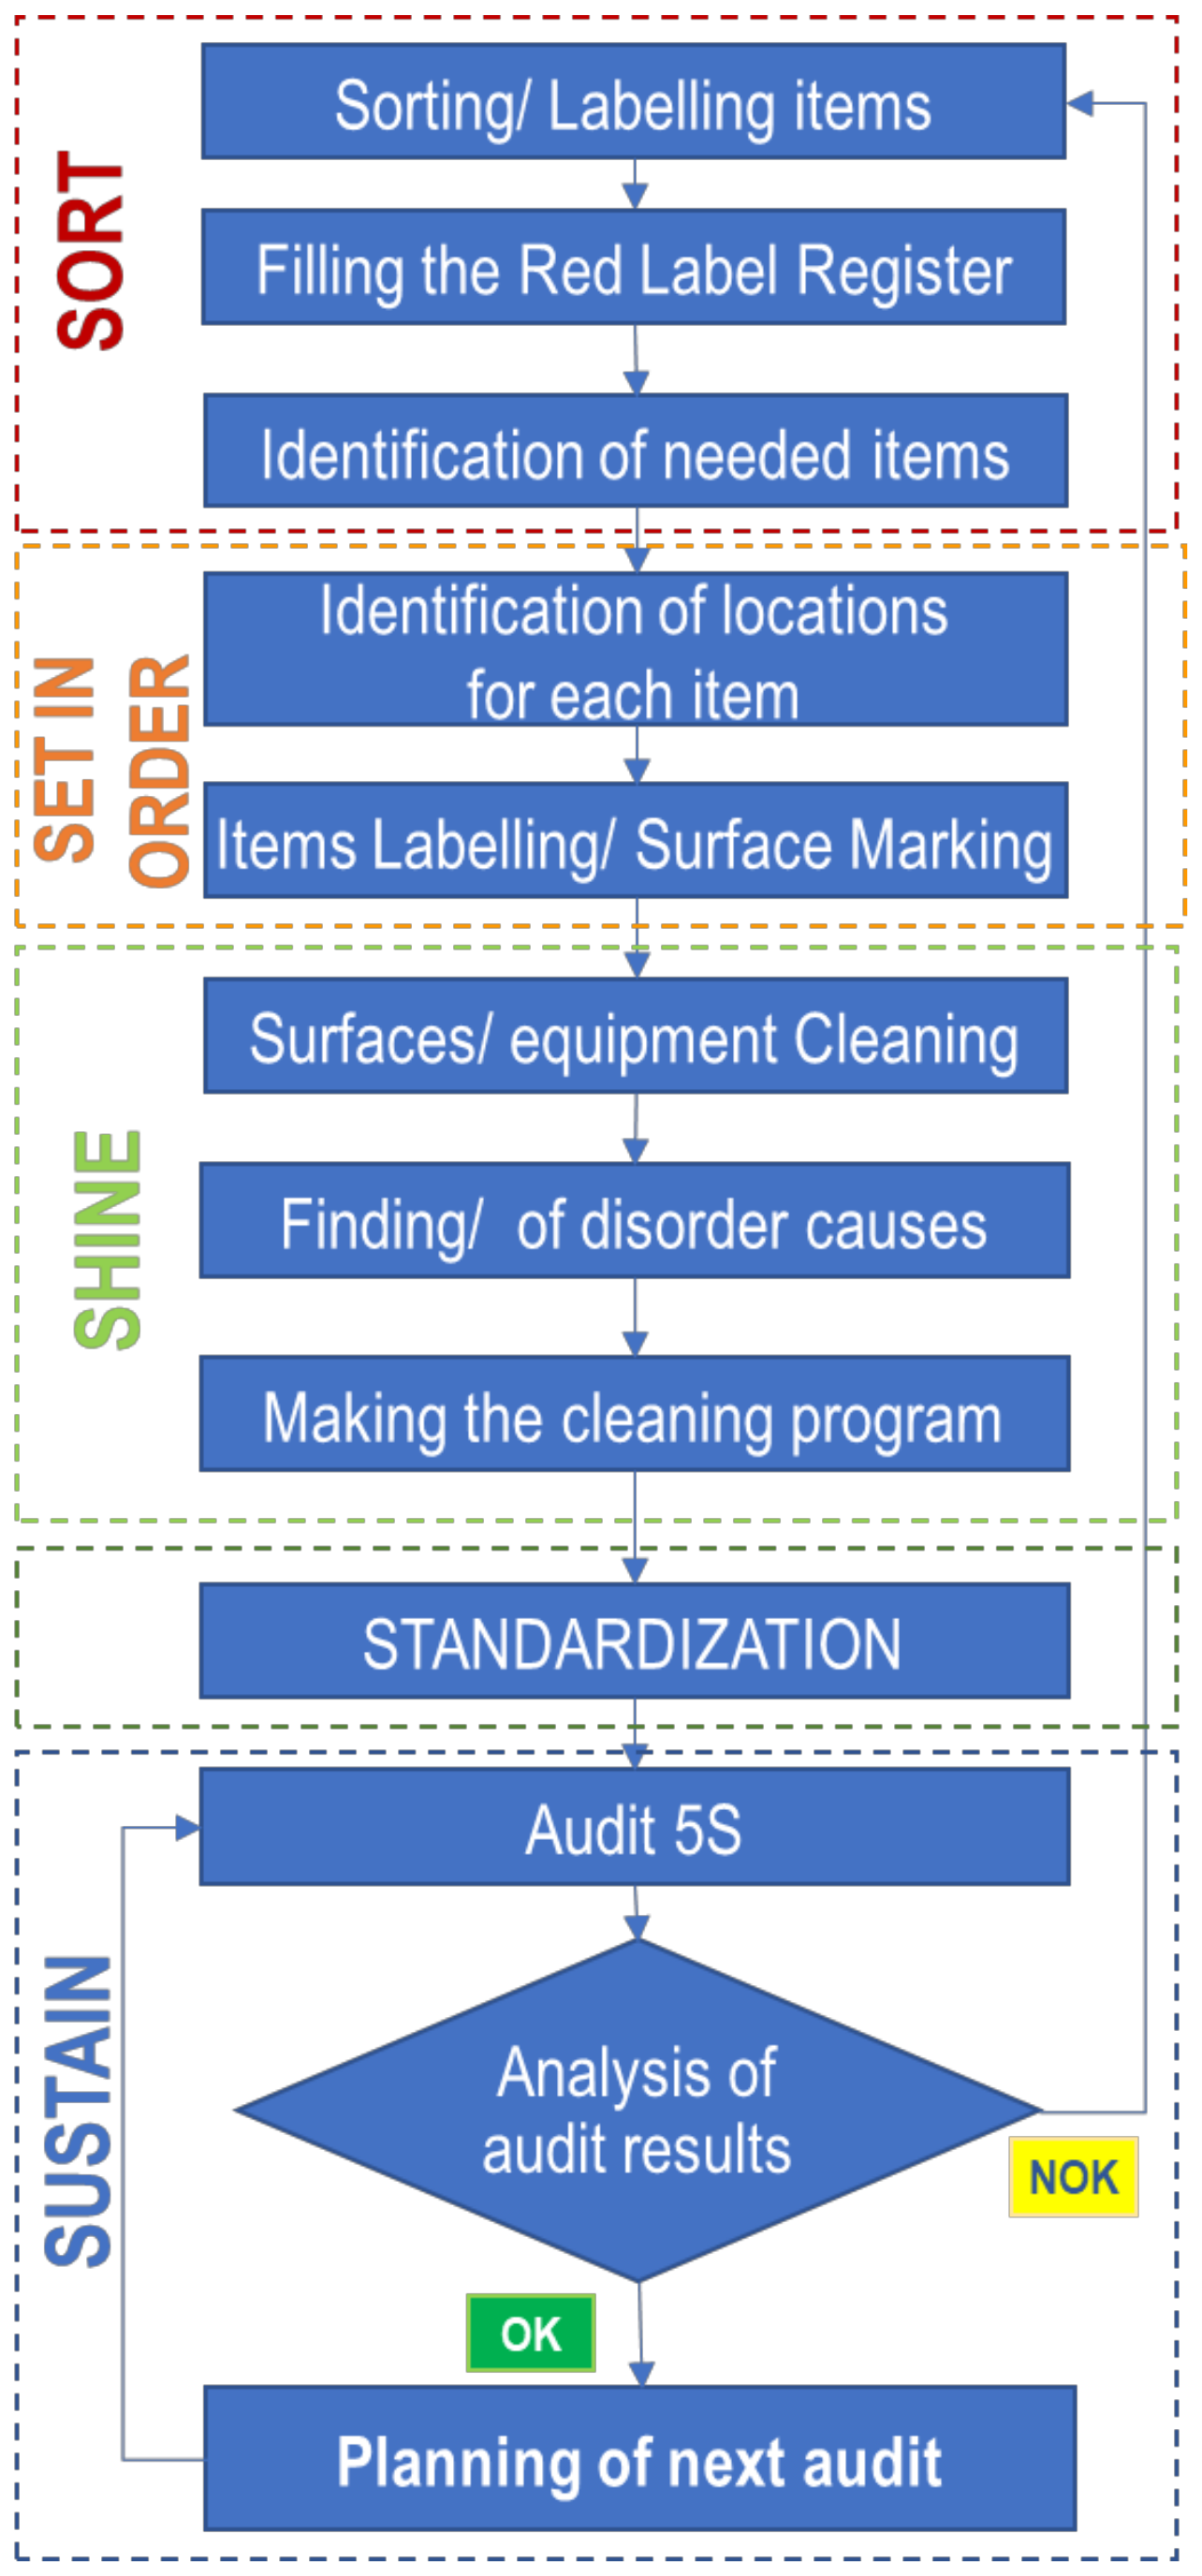
Figure 3. General data of the production system.
Processes 09 00641 g003
Figure 4. SIPOC chart.
Processes 09 00641 g004
Figure 5. Questionnaire for processes observation.
Processes 09 00641 g005
“Workplace observation/Filming workplace photography” is the second stage performed in the workplace, by direct observation, recording the activities performed at the workstation or in the analyzed production system. The information gathered during this step will be used to complete the JobOservation questionnaire. It is recommended to repeat the observations on the production system (minimum 10 observations) in all work shifts, on different working days of the week, and on different operators.
At the stage of “Filling the JobObservation questionnaire”, the questions in the JobObservation questionnaire are answered and are brought as arguments through the photos or clips taken during the observation of the activities performed in the production system; see Figure 6.
At the stage of “Duration’s analysis” the cycle time is measured and the non-added value (number of steps, double handling, waiting, and any other appropriate measure) is identified. If, following the analysis of the durations, it is found that the system is efficient, then the process within it can be standardized. Otherwise, we move on to the next stage, in which the solutions for improving the system are identified; see Figure 7.
“Identification of improvement solutions”—fill in the form for identification of improvement ideas (Figure 8). This contains ideas for improvement related to the production process.
“Synthesis of JobObservation”—fill in the synthesis form (Figure 9) through which the results of the observation and ideas for improvement are shared with the staff of the company, and during these discussions they are encouraged to present their own opinions and ideas for improvement.

2.3. 5S Method

The 5S method is a method of workspace organization, which aims to achieve a clean, stable, and efficient work environment. The use and practice of 5S method to improve the workspace consists of the following the steps shown in Figure 10 [34] and are synthetically explained below.
Sorting/Labeling items involves the analysis of all objects that are in the production area to determine what needs to be kept and what can be removed. Two categories of objects will be formed: absolutely/possibly necessary. and to be removed, to which green and red labels will be attached, respectively. These labels will be managed in the next steps.
Filling the red label register—attaching the red labels, they will be left for a while on the targeted objects, so that the operator/user can decide if they are useful or not. All attached labels must be noted in the red label register to keep track of them.
Identification of needed items—this requires the realization of the two specific lists, namely the green and the yellow list. The green list will contain only the objects in the analyzed area that are absolutely needed and without which the system cannot function. Once the necessary objects have been established, the possibly necessary objects will be marked in the yellow list, which can be used along the way.
Identification of locations for each item—involves placing and identifying the necessary objects. All items that are used temporarily must have a known place, where they can be taken from and placed after each use.
Items Labeling/Surface Marking—consists of the use of visual systems to indicate the positioning of objects. A visual system is a group of visual tools designed to provide information at a glance.
Thus, the positions of the equipment and of all the elements of detail are fixed, by delimiting their position on the floor with the help of markings. To determine the position of the parts and materials, a grid system is used, and each is assigned a simple address. Large and visible panels are made, identifying each piece of equipment, material, or process. The number of units is indicated by using a visual system, such as a colored strip to show the minimum and maximum level or a footprint. At the same time, it is recommended to delimit and indicate the lanes for moving, the routes of the mobile equipment and the perimeter for opening the doors.
There are four types of visual instruments, their presentation in the order of intensifying the signaling power being:
1. Visual indicator: only indicates. For example, traffic signs.
2. Visual signs: grab attention. For example, traffic lights.
3. Visual control: limits the area of action. For example, the lines of parking areas.
4. Warranty: allows only correct actions. For example, product recognition sensors.
Surfaces/equipment cleaning—it is determined: What to clean/How to clean/Who should do the cleaning/How clean should it be. The objectives of the cleaning process must include storage areas, equipment and machinery, nearby areas (windows, offices, stairs, conference rooms, etc.). Checklists should be created that include all these objectives. Also, the cleaning methods must be determined, and for this, in an area as central as possible, the appropriate tools are provided.
Finding/eliminating the disorder causes—equipment checklists are created to support these activities to identify and eliminate the causes of the disorder. Production team members should check the condition of the equipment regularly. They are trained to be able to detect minor changes in sound, smell, vibration, temperature, or other alarm signals. Equipment checklists are created to support these activities.
Making the cleaning program involves the creation and display of the cleaning program and the responsibilities of each member of team. Team members must sign the checklist after the cleaning plan is completed. It is recommended to enter the “cleaning meeting minutes—5S”, as part of the responsibilities of each employee.
Standardization—consists of the creation of a system of tasks and procedures to ensure that the 5S principles are met daily. At this stage, the standards, communication rules, and reference documents are defined, to ensure the maintenance of what was done in the first 3S.
Audit 5S—consists of the periodic examination of the 5S implementation stage, using audit checklists. The purpose of the 5S audit is to confirm the effectiveness of the application of the 5S method. Regular audits will lead to the creation of a cycle of continuous improvement, which will keep the elements well organized and in order and which will eliminate waste and losses.
Analysis of audit results—the results obtained of the 5S audit are analyzed and if they are not satisfactory, the implementation process of the 5S method is resumed.
If the results obtained of the audit are satisfactory, the process of regular examination of the system is continued and a new audit is planned, we move on to the next stage—Planning the next audit.

3. Application in an Industrial Process: Case Study

The proposed algorithm was applied for the analysis and improvement of the production system within a company producing disposable plastic articles, used as tableware.

3.1. Identification of the Characteristics of the Production System

The study was carried out within the production system “plastic injection”, a wide range of finger food products, available in three colors—white, black, and transparent—being made to order; see Figure 11.
The resources of the production system consist of 10 BOY injection presses, 1 packaging oven and 5 tables for packaging, and their layout in the factory is presented in Figure 12. In this production system there are 5 operators/shift. The activity is carried out continuously, on 3 shifts/day, 7 days/week.
The production flow includes four stages: (1) supply of raw materials, (2) injection process, (3) product packaging, and (4) storage; see Figure 13.
The raw material for all injection machines consists of polypropylene granules and dyes. It is brought to the injection machines in bags, with the help of hand-pallet trucks. The operator unloads the bag of raw material into the machine’s supply boxes and then stores the remaining bags next to the machine.
The injection process is automated as follows:
-
the raw material in the form of granules is aspirated into the feed funnel.
-
the molten material is injected under pressure into the mold.
-
after the solidification of the material in the mold, the mold opens and a throwing system removes the product obtained from the mold, and the cycle can be resumed.
-
the products made in the injection machine fall through the collection pipe in a cardboard package.
The packaging flow of the products requires two stages:
-
Creation of the product kit. The kit is a set of products, configured according to customer requirements. To make the kit, the operator performs manual activities consisting of transfer of individual products from injection machines, visual control of each product, product counting, movement to the oven, vacuuming the kit in the oven and labeling the kit.
-
Final packaging, consisting of bringing kits to the packing table, counting kits, positioning kits in the box, closing and gluing the box, labeling the box, storing the box in the finished products area.
The study was started as a result of the need to improve the efficiency, ergonomics, order and cleanliness of the production flow in the “plastics injection” section. The main indicators of the functioning of the production system (KPI), which were considered in this study, are:
-
KPI system: movements, cycle time, No. operators, production capacity;
-
KPI qualitatively: Environment Management System, Efficiency Energy Consumption [kWh/prod.], No. item audit safety, No. item audit ergonomic, Quality defects.

3.2. Evaluation of the Production System

After a primary observation of the production system, the following aspects were highlighted:
-
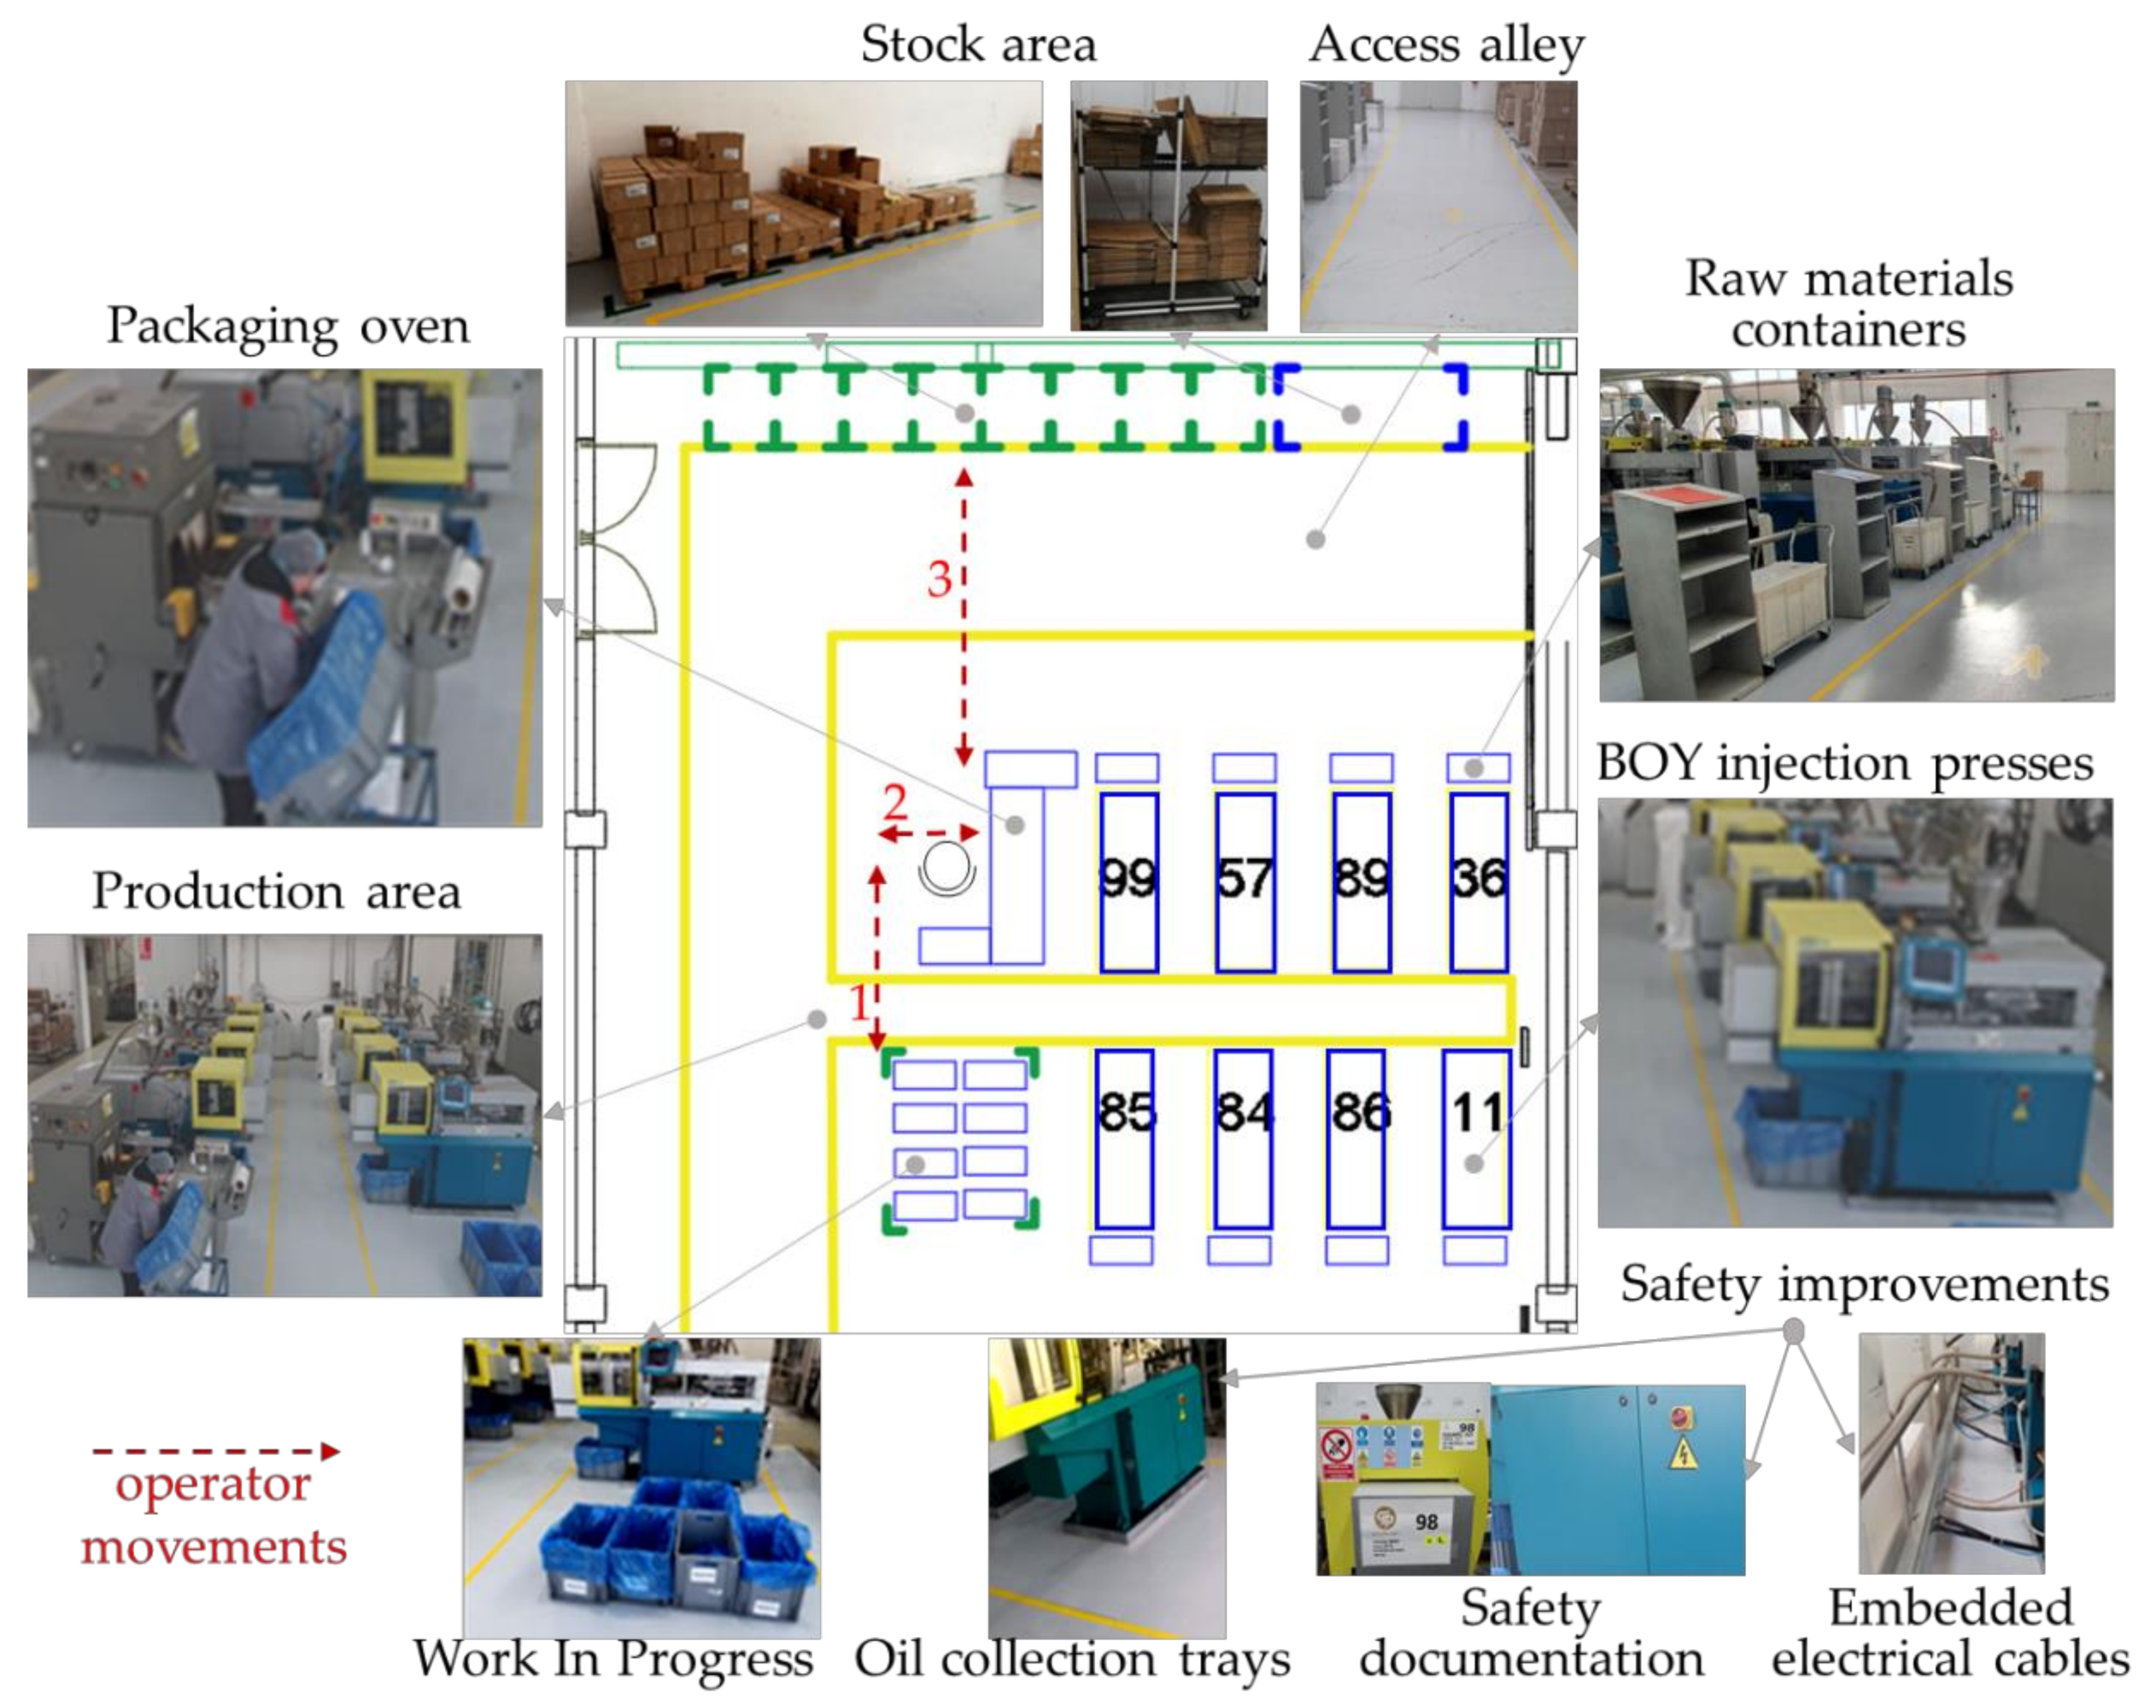
the production flow was not organized: there was a loss of time due to multiple movements and manipulations performed by operators and loss of space due to the storage of unnecessary or defective objects in the production area (Figure 12);
-
the workstations were not ergonomically organized: the operator lifted the boxes, bent down, moved, stretched to grab a product;
-
the workstations were not standardized: the operators did not have explicit working procedures;
-
there were many quality incidents due to incorrect labeling of products, wrong packaging, destruction of products due to oil leaks, etc.;
-
the working environment was not safe for the operator: there was a risk of slipping, electric shock, fall.
The general conclusion was the activities performed in the production system “plastic injection” are mostly manual and the material and information flows are simple, specific for plastics industry. Therefore, the Value Stream Map, as a tool for identifying losses along the flow of materials and information, is not effective for the analysis of this production system. Thus, for the evaluation of the production system, the JobObservation method was chosen and the steps of JobObservation (see Section 2.2) were implemented. They are presented in the following.

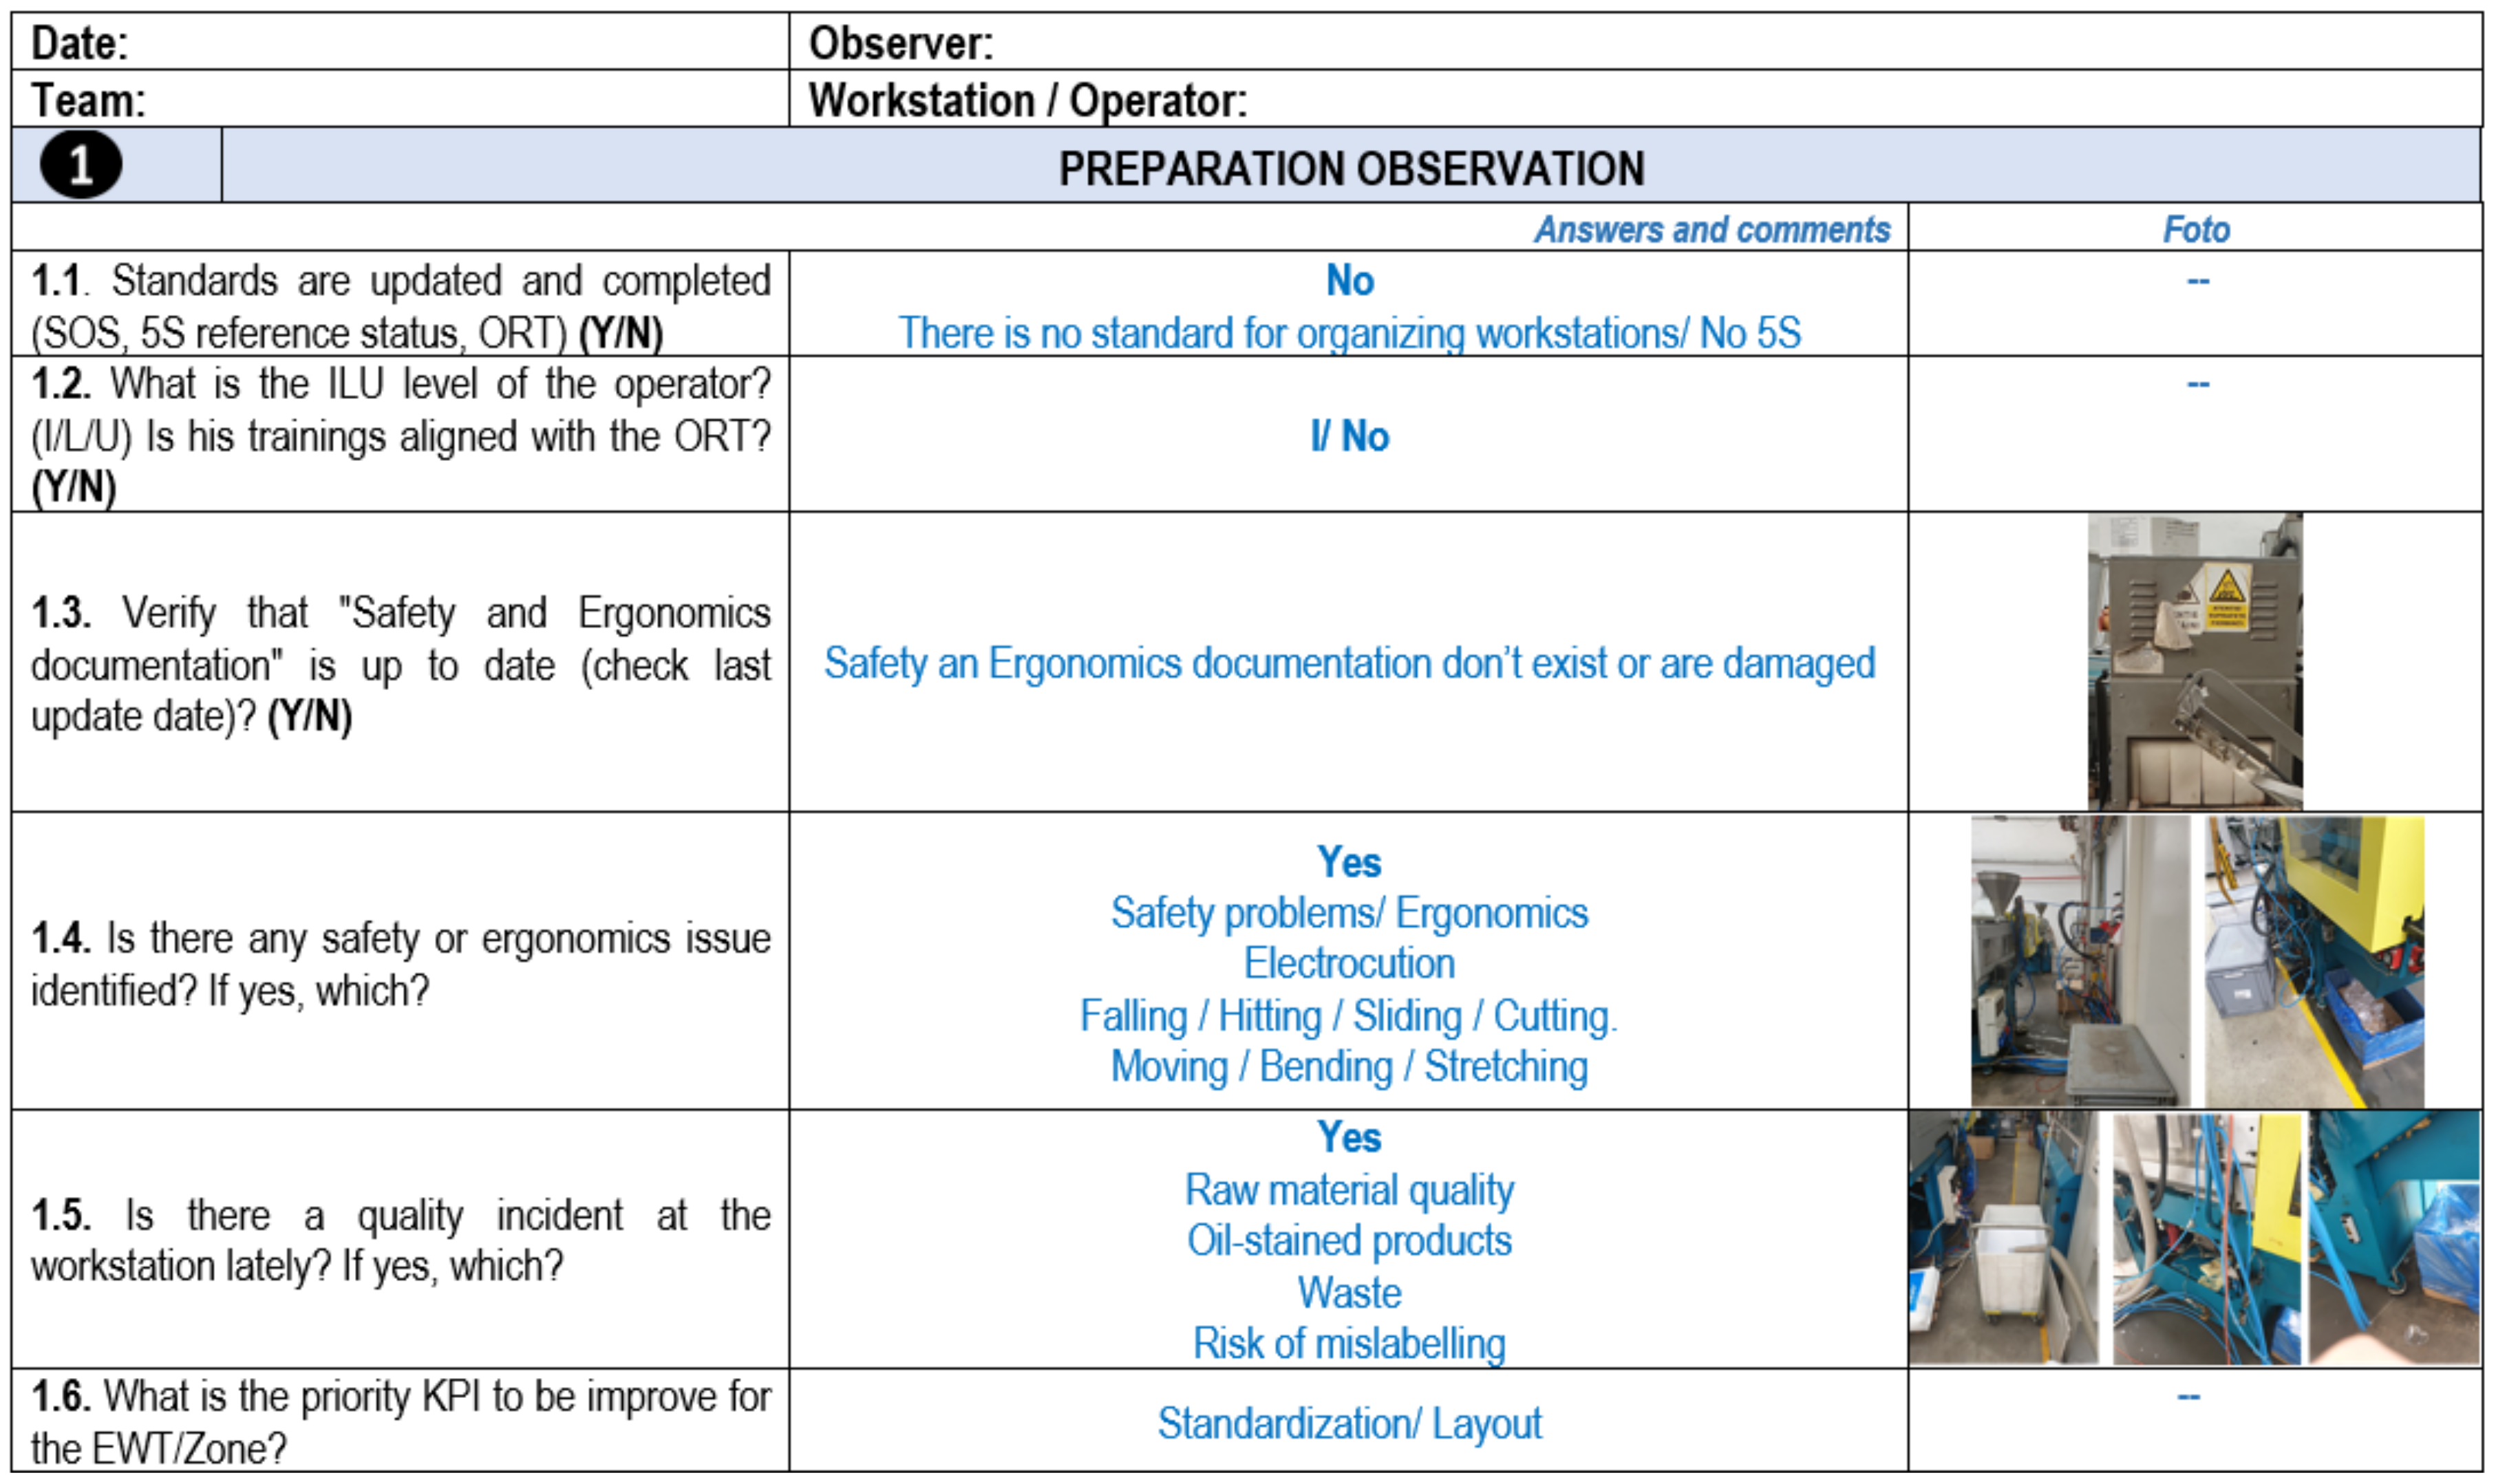
3.2.1. Preparation for Observation

The three forms needed for work observation, shown in Figure 14, Figure 15 and Figure 16, were filled in.

3.2.2. Workstation Observation/Filming/Photographing the Workstation

The functioning of the production system was observed over a period of 2 weeks. The observation was made directly in the workshop. It was observed directly, recorded by video and photography. Observations were made on different days of the week, different shifts and at different times.

3.2.3. Filling JobObservation Questionnaire

Based on the information collected during the observation period of the workstations of the production system, the JobObservation form was filled in, Figure 17.

3.2.4. Duration Analysis

Based on the observations made, the duration of the cycle time was determined and the activities without added value were identified; see Figure 18. Thus, it was found that the main waste time in the system is due to the multiple movements and handling performed by the operator in the product packaging area, which increase the time of making a kit from 13 s to 3 min/kit.
It was also found that from two types of raw material (granules and dyes), 22 types of products through the injection process, and following the packaging process the diversity of products increases to 140 products (the same product is packaged differently depending on the customer), Figure 19.

3.2.5. Identifying Improvement Solutions

The analysis of the durations showed that the bottleneck workstation of the production flow is the packaging station, whose performance and flexibility must be increased by standardizing it. Also, the packaging flow must be separated from the technological flow, and the entire production system must be organized so that the processes are standardized and easy to follow. The ideas for improving the operation of the production system are presented in the form with ideas for improvement, Figure 20.
At the end of the evaluation stage of the production system, the JobObservation Synthesis Form was filled in and it was presented and discussed with the staff of the company, Figure 21.

3.3. Analysis of Production System Evaluation Results

Based on the results of the evaluation and the improvement ideas obtained from the application of the JobObservation method, it was found that the production system needs stability and standardization to be able to identify and eliminate activities without added value. Therefore, the 5S method will be applied to improve the operation of the production system.

3.4. 5S Implementation

The 5S method was implemented in the production system by going through the steps presented in Section 2.3 (see Figure 10).
Sorting/Labeling of objects: the useless products within the production system were identified and red labels were applied on them. The labeled objects were left for a week in the production area for the operator/user to decide whether they were useful to him/her, Figure 22.
Filling the Red Labels Register: at the same time as the labeling of unnecessary objects, the register for red labels, Figure 22, was filled to keep track of them. By filling up the red register, 33 objects were identified in the workplace which were useless, or which hindered the work of the operator or even prevented it. Also 2 defective machines were identified. They were removed from the production area and relocated to the maintenance department. In this area, machinery elements that were not used properly and equipment that was needed but not used for the good functioning of the injection presses were identified.
Identifying the necessary objects: green labels were applied and the green register with the necessary objects was filled, Figure 22, with the articles necessary for the good development of the production process.
Identifying the location for objects: after removing unnecessary items, each item kept in the production area has been assigned a position in the production system. Thus, the area occupied by the injection machines, the area occupied by the packaging station, the storage area of containers with raw materials, the storage area for packaging products, the storage area for finished products and the necessary packaging were delimited.
Labeling objects/Marking surfaces: the entire surface of the production system was painted gray, to more easily highlight the possible oil leaks of the machines. Also, at this stage, the delimitation of the areas that make up the production system was made, by marking the floor with yellow paint: the production area with the injection machines and the oven, area of products for packaging, pedestrian area, and with green paint the location area of the pallets with finished products; see Figure 23.
Also, the safety documentation in the work area was replaced and revised, and protection bumpers were made, to prevent the operator from entering the machinery. The electrical cables of the machines were also embedded in them, and for each machine trays were made for collecting possible oil leaks.
Cleaning the equipment surface: all the surfaces that make up the production system were cleaned, namely the area of the production machines, the packing area and the packing oven, the pallets area and the pedestrian area.
Identifying/eliminating the causes of the disorder: operators were trained to detect minor changes in sound, odor, vibration, temperature, or other alarm signals. Equipment that was leaking oil was also repaired and an equipment inspection program was created to support activities in the area.
Carrying out the cleaning program: a cleaning program of the production area was carried out and the responsibilities of the operators were established. Team members must sign the checklist after the cleaning plan has been completed at the end of each shift.
Standardization: using 3D design software, all workstations and the layout of the production system were designed and standardized, which facilitated the training of operators to better work in the production system:
-
the workstations and the production flow in the injection machines by organizing the workstation so that the place of each element within the workstation is visible and well delimited and a working mode has been created in the production area (Figure 24);
-
the packing station and the packing flow, by designing some elements of the packing station to significantly improve the ergonomics of the station and to eliminate the losses due to the multiple movements and handling by the operators (Figure 25);
-
the operation of the entire production system, by creating a standard of the way of organizing the flows within the system (Figure 26).
Analysis of audit results: in this stage the audit questionnaire was implemented. This will be filled in daily until the system is stabilized.
Figure 24. Standardized workstation.
Processes 09 00641 g024
Figure 25. Standardized packaging workstation.
Processes 09 00641 g025
Figure 26. Standardized production system.
Processes 09 00641 g026

4. Discussion

The proposed algorithm for applying Lean Manufacturing methods (Section 2) was tested and validated by its application to improve the performance of a production system in the plastics industry. Thus, the correct chaining of its steps and the usefulness of the tools developed for the pragmatic application of different methods were proven.
The case study was conducted over 9 months, as follows: 1 month familiarization with the operation of the initial production system, 1 month observation of jobs and development of improvement hypothesis, 1 month implementation of the established solutions, and 6 months support in production, tracking the results of the implemented solutions.
The gains obtained in this study, after applying the developed algorithm, are grouped into the two categories of KPI, system and qualitative indicators, as follows.
The wastes of movements type in the initial situation are 30 steps/kit, as shown in Figure 19 and the “Duration questionnaire analysis” form, Figure 18, shows a 19.35 sec/kit impact (duration determined using the MODAPTS method) [37]. By standardizing all workstations and the operating mode of the production system, Figure 23, Figure 24, Figure 25 and Figure 26, the wastes of the “movements” type were reduced to 2 steps/kit, representing 1.29 sec/kit, so a gain of 18.06 sec/kit.
From the analysis of the “Duration questionnaire analysis” form, Figure 18, it appears that the cycle time is determined by the bottleneck of the production system—the packaging station, with a value of 180 sec/kit of packaging. After reorganizing the packing area and eliminating no value-added activities, the cycle time per packing kit decreased to 13 sec/kit (minimum possible value on this manual activity), Figure 19. This decrease in cycle time has the effect of increasing the theoretical packing capacity to the maximum capacity, 1928 kits/shift, Figure 27.
Since injection machines work in an automatic cycle, allowing a high autonomy, including for the supply of raw materials, as well as the evacuation of products, and by standardizing all workstations and the operating mode of the production system (Figure 23, Figure 24, Figure 25 and Figure 26) the activities of the operators were reorganized, which allowed reduction of their number from 5 to 1. Thus, a single operator can manage the entire system of production, carrying out the following activities: it brings the products from the injection machines in the WIP area (frequency activity: 1 time/shift and on each machine), supplies the packing station with WIP boxes (frequency activity: 2 times/shift), forms the kit with parts and puts it in the oven (current activity: 1 time/kit), configures the final product shipping box (frequency activity: 1 time/final product), takes the final product in finished products stock, and forms the delivery pallet (frequency activity: 1 time/final product).
This evolution of the KPIs of the system is presented in Table 1. All these quantifiable gains are very important. The decrease of the number of operators, correlated with the increase of the theoretical production capacity leads to an increase of approximately 64 times the labor force efficiency: from 30 kits/shift for an operator to 1928 kits/shift for an operator Figure 28.
Considering the main improvement actions and their impact in the production capacity we can note:
-
impact of automaton autonomy use had a significant impact by reducing the number of operators needed from 5 to 1 (that surveys the injection machines and dose the packaging activity) with minimal impact of the cycle time of packaging area;
-
by changing the layout and using reducing the frequency of movement (only when the raw material packaging was empty or the finished products box was full), the packaging operator could concentrate his activity in the packaging area and was possible a decrease of cycle time (from 180 to 30 s);
-
by optimization and standardization of the packaging cycle a further cycle time reduction was possible (from 30 to 13 s).
All these, translated into a work efficiency indicator, kits/operator, are presented in Table 2 and Figure 29.
Another quantifiable gain consists of the efficient occupation of the production system surface. By reorganizing the activities, eliminating unnecessary storage areas and eliminating unnecessary or defective objects from the production space (including two injection presses), the surface occupied efficient by the production system was reduced by 22%, from 100 m2 to 78 m2. This allowed the use of the freed surface to reorganize the flows in the production space.
The KPI qualitative indicators are as follows and their evolution is presented in Table 3.
The Environment Management System indicator assesses the existence of an environmental management system in the process. Thus, EMS can be 0% or 100%. The gains related to the environment were the reduction of oil losses (through the proper management of maintenance interventions) and the reduction of the quantities of waste generated (by eliminating the chaotic storage areas of boxes and packaging foils, the losses caused by their deterioration before packaging were reduced).
The Efficiency Energy Consumption performance indicator was determined by relating the electricity consumption to the production capacity of the system. Initially, the indicator had a value of 3.2 [kWh/prod] (480 kWh/150 products). By standardizing the packaging station and the operation of the production system (Figure 23 and Figure 26) the energy efficiency of the production system increased to 0.25 [kWh/prod] (480 kWh/1928 prods).
The No. item safety audit performance indicator represents the number of types of operator safety problems, identified during the observation of the production system, presented in Figure 17. The number of safety problems identified in work processes were 6 and consisted of the risks of tripping, slipping, hitting, electric shock, and obstruction. All observed safety problems were eliminated by marking and freeing access roads, eliminating oil stains, and by protecting cables and hoses.
The No. item ergonomic audit performance indicator is given by the number of types of ergonomic problems identified during the observation of the production system, shown in Figure 17. There were 4 ergonomic problems identified in work processes: the manipulations at ground level, weightlifting, manual weight transport-operators’ effort to perform packaging activities, and bending and body rotation. These ergonomic problems were eliminated: the manipulations at ground level by implementing transport trolleys for raw materials and products, and operators’ effort to perform packaging activities by implementing inclined supports, which allow activities in the ergonomic window.
The quality defects rate was determined by the rate of quality incidents recorded by the quality department. Initially, the production system had a quality defect rate of 27%. By standardizing all workstations and operating modes of the production system (Figure 23, Figure 24, Figure 25 and Figure 26) the risks of dust pollution of the products was reduced by separating the flows of raw materials and finished products, by using specific packaging and making them in different colors and by implementing a cleaning management production system, the risk of mixing products was reduced by marking the areas of finished products and implementing the “box by box” mode of operation, and the risk of scratching or matting the surfaces of products was reduced by reducing the number of manipulations. Following the improvement actions, the rate of quality defects decreased to 11%.
On the other hand, it is estimated that investments in the reorganization of the production system were minimal, consisting of cleaning, labeling objects, painting the floor and making transport carts, so that the payback was around 1 month, proving the efficiency of the application of Lean Manufacturing methods.

5. Conclusions

Lean Manufacturing comprises a set of methods for the analysis and continuous improvement of the operation of production systems. The research presented in the literature has shown that these methods are, in turn, in continuous improvement as a way of use, being able to be applied in different ways, for different production systems.
In this paper, an algorithm for the application of specific Lean Manufacturing methods was proposed, which allows the efficient analysis and continuous increase of the performance of a production system. Thanks to this algorithm, it was possible to choose the method of evaluating the performance of the production system and to implement the method of improvement depending on the wastes identified.
Also, for the JobObservation and 5S methods, included in this algorithm, chartflows and specific tools (questionnaires, forms, etc.) were proposed and were developed to facilitate their application and to orient (guide) the user in the direction of improving the analyzed process.
These techniques and tools developed in the paper were conceptually validated by their successful use in a case study conducted over a period of 9 months in an industrial company. The objective of the case study was to improve the functioning of the “plastic injection” production system, in which a diverse range of plastic tableware products are made.
It turned out that by using the algorithm for applying the specific Lean Manufacturing methods and the techniques and tools presented in the paper, the operation of the analyzed production system was significantly improved, estimating a payback of the investment of about 1 month.
The main conclusions regarding the improvements in the operation of the “plastic injection” production system are summarized as follows:
-
all unnecessary means of production have been eliminated and the workstations have been standardized;
-
the activities within the production system were reorganized and its operation mode was standardized.
Thus, they produced the following gains:
-
significant reduction of movement waste, from 30 steps/kit, to 2 steps/kit,
-
significant decrease in cycle time, from 180 sec/kit to 13 sec/kit,
-
reducing the number of operators working in the production system from 5 to 1, all these with as general effect the increase of the production capacity, from 150 kits/shift to 1928 kits/shift and the reduction with 22% of the surface of the production system, the surplus being available for carrying out other activities.
The analysis highlighted the fact that the largest increase in production capacity was due to workstation standardization (54.16%) and the reduction of operator movements (39.52%).
Also, a stable working environment was obtained, with standardized and easy-to-follow processes, in which the operator activities are carried out safely and in ergonomic conditions, with the increase of the product quality and the protection of the environment.
The study can be continued by stock analysis, analysis of production scheduling, or analysis of raw material consumption, and, subsequently, by automation of repetitive activities.
Future research directions aim to extend the algorithm presented in this study so that it can be used for a wider range of specific LM (Lean Manufacturing) methods. The development of specific Industry 4.0 techniques and tools is also being considered, which, by integrating them into LM methods, will facilitate their application.

Author Contributions

A.C.G. conceptualization, A.C.G. and E.L.N. methodology, C.A.G. software 3D models, A.C.G., E.L.N. and C.A.G. data analysis and writing the paper. E.L.N. review and editing. All authors have read and agreed to the published version of the manuscript.

Funding

This work was supported by a grant of the Romanian Ministry of Research and Innovation, CCCDI—UEFISCDI, project number PN-III-P1-1.2-PCCDI-2017-0446/82-PCCDI-2018, within PNCDI III and GLODPLAST contract no. 3416/13.03.2019.

Institutional Review Board Statement

Not applicable.

Informed Consent Statement

Not applicable.

Conflicts of Interest

The authors declare no conflict of interest.

References

  1. Rosa, C.; Silva, F.J.G.; Ferreira, L.P.; Pereira, T.; Gouveia, R. Establishing Standard Methodologies To Improve The Production Rate Of Assembly Lines Used For Low Added-Value Products. In 28th International Conference on Flexible Automation and Intelligent Manufacturing; Sormaz, D., Suer, G., Chen, F.F., Eds.; Elsevier Science BV: Amsterdam, The Netherlands, 2018; Volume 17, pp. 555–562. [Google Scholar]
  2. Qun, Z.I.M.; Khattak, M.A.O.; Abbas, J.; Xiaoning, Z.; Shah, M.S. Critical Success Factors for Successful Lean Six Sigma Implementation in Pakistan. Interdiscip. J. Contemp. Res. Bus. 2012, 4, 117–124. [Google Scholar]
  3. Womack, J.P.; Jones, D.T. Lean thinking—banish waste and create wealth in your corporation. J. Oper. Res. Soc. 1997, 48, 1148. [Google Scholar] [CrossRef]
  4. Grycuk, A. Bariery w stosowaniu koncepcji Lean Management. Kwart. Nauk O Przedsiębiorstwie 2016, 40, 72–79. [Google Scholar]
  5. Näslund, D. Lean, six sigma and lean sigma: Fads or real process improvement methods? Bus. Process Manag. J. 2008, 14, 269–287. [Google Scholar] [CrossRef] [Green Version]
  6. Jon, C.Y.; Detty, R.B.; Sottile, J., Jr. Lean manufacturing principles and their applicability to the mining industry. Miner. Resour. Eng. 2000, 9, 215–238. [Google Scholar] [CrossRef]
  7. Kumar, R.; Kumar, P. Strategy development for lean manufacturing implementation in a selected Manufacturing company. Int. J. Eng. Sci. 2014, 3, 51–57. [Google Scholar]
  8. Mazur, M.; Momeni, H. LEAN Production issues in the organization of the company-results. Prod. Eng. Arch. 2019, 22, 50–53. [Google Scholar] [CrossRef] [Green Version]
  9. Tortorella, G.L.; Vergara, L.G.L.; Ferreira, E.P. Lean manufacturing implementation: An assessment method with regards to socio-technical and ergonomics practices adoption. Int. J. Adv. Manuf. Technol. 2017, 89, 3407–3418. [Google Scholar] [CrossRef]
  10. Chen, P.-K.; Lujan-Blanco, I.; Fortuny-Santos, J.; Ruiz-de-Arbulo-López, P. Lean Manufacturing and Environmental Sustainability: The Effects of Employee Involvement, Stakeholder Pressure and ISO 14001. Sustainability 2020, 12, 7258. [Google Scholar] [CrossRef]
  11. Azemi, F.; Lujić, R.; Šimunović, G.; Tokody, D. Selection the Basic Lean Manufacturing Techniques in Developing the Model for Industry 4.0 in Kosovo Manufacturing Industry. Proceedings 2020, 63, 62. [Google Scholar] [CrossRef]
  12. Frankowska, M. Implementation Barriers of Lean Manufacturing in the Production Sector. Eur. J. Serv. Manag. 2018, 28, 125–133. [Google Scholar] [CrossRef]
  13. Botti, L.; Mora, C.; Regattieri, A. Integrating ergonomics and lean manufacturing principles in a hybrid assembly line. Comput. Ind. Eng. 2017, 111, 481–491. [Google Scholar] [CrossRef]
  14. Venkat Jayanth, B.; Prathap, P.; Sivaraman, P.; Yogesh, S.; Madhu, S. Implementation of lean manufacturing in electronics industry. Mater. Today Proc. 2020, 33, 23–28. [Google Scholar] [CrossRef]
  15. Pena, R.; Ferreira, L.P.; Silva, F.J.G.; Sá, J.C.; Fernandes, N.O.; Pereira, T. Lean manufacturing applied to a wiring production process. Procedia Manuf. 2020, 51, 1387–1394. [Google Scholar] [CrossRef]
  16. Helleno, A.L.; de Moraes, A.J.I.; Simon, A.T. Integrating sustainability indicators and Lean Manufacturing to assess manufacturing processes: Application case studies in Brazilian industry. J. Clean. Prod. 2017, 153, 405–416. [Google Scholar] [CrossRef]
  17. Aziz, R.F.; Hafez, S.M. Applying lean thinking in construction and performance improvement. Alex. Eng. J. 2013, 52, 679–695. [Google Scholar] [CrossRef] [Green Version]
  18. Abu, F.; Gholami, H.; Mat Saman, M.Z.; Zakuan, N.; Streimikiene, D. The implementation of lean manufacturing in the furniture industry: A review and analysis on the motives, barriers, challenges, and the applications. J. Clean. Prod. 2019, 234, 660–680. [Google Scholar] [CrossRef]
  19. Alzubi, E.; Atieh, A.M.; Abu Shgair, K.; Damiani, J.; Sunna, S.; Madi, A. Hybrid Integrations of Value Stream Mapping, Theory of Constraints and Simulation: Application to Wooden Furniture Industry. Processes 2019, 7, 816. [Google Scholar] [CrossRef] [Green Version]
  20. Nassereddine, A.; Wehbe, A. Competition and resilience: Lean manufacturing in the plastic industry in Lebanon. Arab Econ. Bus. J. 2018, 13, 179–189. [Google Scholar] [CrossRef]
  21. Romero, V.J.; Sanchez, A. Methodology for multi-criteria design optimization of plastic products with a focus on highly competitive markets. Procedia Manuf. 2019, 41, 1087–1094. [Google Scholar] [CrossRef]
  22. Byrne, B.; McDermott, O.; Noonan, J. Applying Lean Six Sigma Methodology to a Pharmaceutical Manufacturing Facility: A Case Study. Processes 2021, 9, 550. [Google Scholar] [CrossRef]
  23. Roslin, E.N.; Shahadat, S.A.M.; Dawal, S.Z.M. Discovering Barriers of Lean Manufacturing System Implementation in Malaysian Automotive Industry. In Materials, Industrial, and Manufacturing Engineering Research Advances 1.1; Kurniawan, D., Ed.; Trans Tech Publications Ltd.: Johor Bahru, Malaysia, 2014; Volume 845, pp. 687–691. [Google Scholar]
  24. Narang, R.V. In Some issues to consider in lean production. In Proceedings of the 2008 First International Conference on Emerging Trends in Engineering and Technology, Nagpur, India, 16–18 July 2008; pp. 749–753. [Google Scholar]
  25. Nordin, N.; Deros, B.M.; Wahab, D.A.; Ab Rahman, M.N. Managing change in lean manufacturing implementation. In Advanced Manufacturing Technology; Gao, J., Ed.; Trans Tech Publications Ltd.: Guangzhou, China, 2011; Volume 314–316, pp. 2105–2111. [Google Scholar]
  26. Moradlou, H.; Perera, T. Identification of the barriers in implementation of lean principles in Iranian SMEs: Case study approach. Glob. J. Manag. Bus. Res. 2017. Available online: https://journalofbusiness.org/index.php/GJMBR/article/view/2252 (accessed on 5 April 2021).
  27. Elkhairi, A.; Fedouaki, F.; Alami, S.E. Barriers and Critical Success Factors for Implementing Lean Manufacturing in SMEs. IFAC Pap. 2019, 52, 565–570. [Google Scholar] [CrossRef]
  28. Kleszcz, D.; Zasadzień, M.; Ulewicz, R. Lean Manufacturing in the ceramic industry. Multidiscip. Asp. Prod. Eng. 2019, 2, 457–466. [Google Scholar] [CrossRef] [Green Version]
  29. Pampanelli, A.B.; Found, P.; Bernardes, A.M. A Lean & Green Model for a production cell. J. Clean. Prod. 2014, 85, 19–30. [Google Scholar]
  30. Brito, M.; Vale, M.; Leão, J.; Ferreira, L.P.; Silva, F.J.G.; Gonçalves, M.A. Lean and Ergonomics decision support tool assessment in a plastic packaging company. Procedia Manuf. 2020, 51, 613–619. [Google Scholar] [CrossRef]
  31. Benkarim, A.; Imbeau, D. Organizational Commitment and Lean Sustainability: Literature Review and Directions for Future Research. Sustainability 2021, 13, 3357. [Google Scholar] [CrossRef]
  32. Vinoth Kumar, H.; Annamalai, S.; Bagathsingh, N. Impact of lean implementation from the ergonomics view: A research article. Mater. Proc. 2020. [Google Scholar] [CrossRef]
  33. Dighe, S.B.; Kakirde, A. Lean manufacturing implementation using value stream mapping: A case study of pumps manufacturing company. Int. J. Sci. Res. 2014, 3, 2492–2498. [Google Scholar]
  34. Gavriluţă, A.; Niţu, E.; Belu, N.; Anghel, D.; Neacşu, C.; Pascu, I. In Lean manufacturing methodology for improving production flows on an assembly line. In Proceedings of the RMEE International Management Conference, Cluj Napoca, Romania, 17–19 September 2020; pp. 52–65. [Google Scholar]
  35. Nitu, E.; Gavriluta, A.; Belu, N.; Gavriluta, C. Methodology for improving production flows on an assembly line. In Proceedings of the 6th International Conference on Advanced Manufacturing Engineering and Technologies, Galati, Romania, 9–11 September 2020; IOP Conference Series: Materials Science and Engineering. Volume 968. [Google Scholar] [CrossRef]
  36. Nitu, E.L.; Gavriluta, A.C. Lean Learning Factory at the University of Pitesti. In Proceedings of the Modern Technologies in Industrial Engineering VII (ModTech2019), Iasi, Romania, 19–22 June 2019; IOP Conference Series: Materials Science and Engineering. Volume 591. [Google Scholar] [CrossRef]
  37. Carey, P.; Farrel, J.; Hui, M.; Sullivan, B. Heyde’s MODAPTS: A Language of Work; Heyde Dynamics Pty. Ltd.: Brighton, VIC, Australia, 2001. [Google Scholar]
Figure 1. Proposed algorithm for applying Lean Manufacturing methods.
Processes 09 00641 g001
Figure 2. Proposed steps to use the JobObservation method.
Processes 09 00641 g002
Figure 6. JobObservation questionnaire.
Processes 09 00641 g006
Figure 7. Questionnaire for duration analysis.
Processes 09 00641 g007
Figure 8. Improvement ideas.
Processes 09 00641 g008
Figure 9. Form for JobObservation synthesis.
Processes 09 00641 g009
Figure 10. 5S application steps.
Processes 09 00641 g010
Figure 11. Finger food products.
Processes 09 00641 g011
Figure 12. Initial layout and resources of the production system.
Processes 09 00641 g012
Figure 13. Production flow.
Processes 09 00641 g013
Figure 14. General data of the production system “plastic injection”.
Processes 09 00641 g014
Figure 15. SIPOC chart of the production system “plastic injection”.
Processes 09 00641 g015
Figure 16. Questionnaire for processes observation of the production system “plastic injection”.
Processes 09 00641 g016
Figure 17. JobObservation questionnaire of the production system “plastic injection”.
Processes 09 00641 g017aProcesses 09 00641 g017b
Figure 18. Duration analysis questionnaire of the production system “plastic injection”.
Processes 09 00641 g018
Figure 19. Products diversity evolution.
Processes 09 00641 g019
Figure 20. Improvement ideas of the production system “plastic injection”.
Processes 09 00641 g020
Figure 21. JobObservation synthesis of the production system “plastic injection”.
Processes 09 00641 g021
Figure 22. The use of first stage of 5S method.
Processes 09 00641 g022
Figure 23. Final layout and resources of the production system.
Processes 09 00641 g023
Figure 27. Evolution of production capacity.
Processes 09 00641 g027
Figure 28. Operator numbers vs. production capacity.
Processes 09 00641 g028
Figure 29. Evolution of production capacity depending on the improvement actions.
Processes 09 00641 g029
Table 1. KPI system evolution.
KPIBeforeAfter
Operator/shift51
Movement [steps/kit]302
Cycle time [sec/kit]18013
Capacity production [kits/shift]1501928
Table 2. Capacity production evolution.
BeforeThe Contribution of Improvement Actions After
Automation
Autonomy
Movement
Reduction
Workstation
Standardization
30 [kits/operator](120) 6.32%(870) 39.52%(1028) 54.16%1928 [kits/operator]
TOTAL GAIN: 1898 [kits/shift]
Table 3. Qualitative indicators evolution.
KPI Qualitative IndicatorsBeforeAfter
Environment Management System 0100%
Efficiency energy consumption [kWh/prod]3.20.25
No. item audit safety—observed in the system50
No item audit ergonomic—observed in the system40
Quality defects rate27%11%
Publisher’s Note: MDPI stays neutral with regard to jurisdictional claims in published maps and institutional affiliations.

