Article

Development of a Mathematical Model and Validation for Methane Production Using Cow Dung as Substrate in the Underground Biogas Digester

1
Department of Physics, University of Fort Hare, Alice 5700, South Africa
2
Fort Hare Institute of Technology, University of Fort Hare, Alice 5700, South Africa
3
Department of Process Engineering, Stellenbosch University, Cape Town 7602, South Africa
*
Author to whom correspondence should be addressed.
Processes 2021, 9(4), 643; https://doi.org/10.3390/pr9040643
Submission received: 8 February 2021 / Revised: 29 March 2021 / Accepted: 30 March 2021 / Published: 7 April 2021

Abstract

:
South Africa is highly dependent on conventional fuels from non-renewable energy sources such as coal and fossil fuels. The methane from biogas is a renewable energy source for generating electricity using a combined heat and power plant. Therefore, the aim of the study is to develop and validate a mathematical model for predicting methane production in an underground biogas digester. The developed model was able to predict the production of methane gas as separate entity differing from other models. A total of 286 datasets were used as a trained dataset for the model development, and 144 datasets served as test data for the validation of the model, making a total of 430 measured datasets of all the predictors. The determination coefficient (R2) and the p-value of the predicted and calculated methane yield were 0.962 and 0.920, respectively. The high R2 in the present study confirms a good correlation between the model and experimental value. Hence, the model is of significance because it is applicable in predicting the performance of methane production of systems of the same design used in different locations, thereby arriving at the same constant values. From the study, the ambient weather factors (ambient temperature, relative humidity, and global horizontal irradiance) affected the methane production. Additionally, the indoor parameters (pH, gas temperature, slurry bottom and slurry top temperature) impacted on the yield of the methane production because the scaling factors associated with these quantities are non-zero real numbers. Hence, the scope of the study did not consider the volume of the biogas digester as an input parameter to the response.

1. Introduction

Globally, the use of conventional energy sources for electricity generation is faced with hazardous emissions that endangers human and environmental health. To overcome this challenge, there is need for an alternative source of energy. Methane, which is a product of anaerobic digestion technology, proves to be an efficient energy source to supplement the conventional sources. Anaerobic digestion technology has the capability of transforming different types of organic waste material into useful forms [1]. By definition, anaerobic digestion (AD) is the biological process of breaking down organic material in the absence of oxygen. It involves the treatment of agricultural, municipal, and industrial waste for methane production [2,3]. The growing interest in anaerobic digestion technology has brought the need for optimization as well as cost reduction in the design of biogas digesters. A viable option to consider is the use of mathematical models that offer the opportunity for adjustments prior to actual implementation [1]. A mathematical model is a mathematical equation or a computational programme that can be used to predict the dynamic behaviour of a system or process. This has a wide benefit in the field of control systems, optimization, and forecasting of system performance in the “if scenarios”, where the actual situation cannot be replicated [4,5]. Most models that deal with biogas production are based on mechanistic and empirical models [6,7]. The mechanistic models focus more on the biological, chemical, and physical laws that relate to biogas production, while the empirical models are based on mathematical equations to describe the stochastic relationships of various factors or parameters as well as using real measured process data [8]. For the mechanistic model, anaerobic digestion model no. 1 (ADM1) is mostly used. However, the present study focuses on the empirical type of model involving mathematical equations. Anaerobic digestion model no. 1 (ADM1) is regarded as a dynamic model involving the four stages of the anaerobic digestion process. This is a biochemical process that entails the conversion of organic matter into carbohydrates, lipids, proteins, and inert compounds [7]. According to Kundu et al. [9] and Lauwer et al. [7], ADM1 does not involves microbial diversity as its real taxonomic, functional, and ecological complexity. The model neglects the biodegradation of different compounds, but rather concentrates on the optimal reaction conditions and kinetics.
In the case of an empirical model, a number of studies have used this model as a tool for predicting the rate of biogas production. Yang et al. [10] employed a mathematical model in their study for methane production in an anaerobic digestion of swine wastewater. The study aimed to investigate the influence of organic loading rate (OLR) on methane production. The obtained result showed that the developed model satisfied the influence of OLR on the rate of methane production. The determination coefficient (R2) was in the range of 0.97–0.99 for the experimental and predicted data. The model developed by Yang et al. [10] was a modification from the Deng model for methane production. Equations (1) and (2) show the Deng model and the modified Deng model, respectively.
Deng model [11]:
R p = R p max 1 + e ( K L R L r )
Modified Deng model [10]:
R p = R p max 1 + e K D ( K L R L r )
The development of a fuzzy logic model to predict the effect of zinc oxide nanoparticles on methane production from stimulated landfill was conducted by Addario et al. [12]. In their study, the pH, redox potential, chemical oxygen demand, volatile fatty acid, alkalinity, zinc concentration, zinc background, and leachate recirculation were identified as the input variables, while the output variables were biogas production and methane fraction. However, in the present study, relative humidity, ambient temperature, pH, and digester temperature measured at different positions within the digester were used as the input variables. The three performance indicators used to quantify the correlation of fit between the experimental data and the model output included the coefficient of determination (R2), root mean square error (RMSE), and also the index of agreement (IA), as shown in Equations (3)–(5):
R 2 = ( i = 1 n ( O i O m ) ( P i P m ) ) 2 i = 1 n ( O i P i ) 2 i = 1 n ( P i P m ) 2
R M S E = ( 1 n i = 1 n ( O i P i ) 2 ) 0.5
I A = 1 i = 1 n ( O i P i ) 2 i = 1 n ( | O i O m | + | P i P m | 2 )
where O and P are the observed and predicted values, respectively, m is the mean value, i represent the ith observation, R2 and IA are known as the dimensionless constants in the theoretical range value of O (worse model) to 1 (optimal model), and RMSE preserves its original unit. The result of the study showed that the developed fuzzy model is a good performance tool for the prediction of methane. Rieke et al. [13] developed a new model for digester systems that was more accurate compared to the standard ADM1 model. The widely accepted ADM1 model focuses on 28 parameters, while the new model in the latter study was reduced to four parameters and two ordinary differential equations. The limitation of the ADM1 is that it is time consuming and not economical because of its numerous parameters. The findings of the study showed that the process of biogas production is linear and the coefficient of the equation is time-dependent. In another study, ADM1 was used to explain how pH and volatile fatty acid affect the rate of biogas production. The model was said to be implemented using the differential equation available in MATLAB [1].
It is important to state that mathematical modelling is advantageous in studying the performance of a biogas digester, and how parameters such as pH, temperature, mixing ratio, carbon/nitrogen ratio (C/N), hydraulic retention time (HRT), and the nature of the substrate influence it. Hence, there is need to develop an advanced model with high accuracy that investigates the performance of a biogas digester. However, numerous types of mathematical model have been employed to predict methane production using animal waste digestion. The popular model is known as anaerobic digestion model 1 (ADM1) as mentioned earlier, which is the most advanced because of its precise predictability and strong generalisability [14]. Anaerobic digestion model 1 (ADM1) focuses on the processes that are involved in the conversion of complex organic substrates into methane [15]. In addition, ADM1 requires a large number of parameters or variables, as well as coefficients which should be calibrated based on the characteristic of the substrate. Some studies have successfully developed a mathematical model to predict biogas production [10,16,17,18], but none of them used cow dung as a single substrate for methane production in an underground biogas digester. A model proposed by Delgadilo and Hernandez [16] predicted the methane production from organic waste using few input variables (organic matter and volatile fatty acid). These are present in acidogenesis bacteria and methanogenic micro-organisms, compared to the present study involving more inputs which are known as the factors affecting biogas production. Moreover, Biswas et al. [18] conducted a study on the mathematical model for the prediction of biogas production based on food and vegetable residues. The model used slurry concentration, carbohydrate concentration, and protein concentration as input parameters to the response. Despite these studies and many more in the literature, a mathematical model for the prediction for methane using cow dung as a single substrate has not been developed. Hence, the main objective of this study was to create a non-linear custom model equation to predict the yield of methane in cubic meter using a set of predictors, as well as to conduct a validation on the model in an underground biogas digester. To achieve this objective, the study employed indoor and outdoor parameters affecting methane yield. Some of these parameters affect the input material, known as the complex organic substrate. The non-linear equation model was preferred in the study, because it provides a multi-purpose benefit used in the in-depth performance prediction of the system as a universal model equation and to correlate the prediction to the response. In addition, biogas production from the anaerobic digestion of organic waste such as cow dung is a non-linear complex process, which depends on the substrate characteristics and operational conditions [19]. Hence, this motivated the idea of developing a non-linear mathematical model. The essence of these systems is to understand and identify the expected output for a given input in a process, and also to provide predictive measures of information to the research community base on the model. The mathematical model would be of benefit in rural areas of South Africa, where there are numerous cows. The novelty in the study which differs from previous studies is as follows:
  • It involves the mathematical model for methane production on an hourly basis as opposed to the majority of mathematical models that predict methane production in daily intervals;
  • It expands on the impact of additional meteorological factors (ambient temperature, relative humidity, and global solar irradiance) on methane production, as opposed to other popular methane production models that focus only on the impact of ambient temperature as a meteorological factor;
  • It demonstrates the simultaneous variability of the inputs to the desired output by the employment of the 3D mesh plots and the potential outcomes of the desired output in the “if scenario” (which is what would have been the output, if other possible inputs were obtained which were not determined by the trained data used in the development of the mathematical models).

Biogas Production Potential in South Africa

Focusing on South Africa as a case study, there is a need to briefly discuss the biogas production potential in the country because it relates to the state-of-the-art technology and current level of explorations, as well as biogas reactor types and volumes. The production potential of biogas in South Africa, as reported by the South Africa Biogas Industry Association, is said to have a market potential of ZAR 10 billion, which is estimated to be around USD 1.1 billion, capable of generating 2.5 gigawatts (GW) of electricity and thousands of jobs for an average of 300,000 households in rural areas [20]. Table 1 presents the different categories of biomass contributions to the renewable energy sector in the year 2020.
In South Africa, Agama Energy installed some household biogas reactors located mainly in the Western Cape and Kwa Zulu Natal provinces. These biogas reactors are mostly of a floating dome design (Indian type). For the purpose of research, fixed dome and balloon reactor types of digesters are used more often. Table 2 summarises the volumes of biogas digesters installed in selected parts of South Africa, and their types and purposes.

2. Experimental Section

2.1. Substrate Preparation

The fresh cow dung used in the study was collected from the dairy farm of the University of Fort Hare. Before introducing the dung into the biogas digester, impurities such as stones, waste feeds, sticks, and unwanted materials in the cow dung were carefully removed to avoid clogging within the biogas digester. A sample of the fresh cow dung weighing about 50 g was dried at 105 °C for 24 h. The properties of the substrate determined were total solids (TS), volatile solids (VS), pH, chemical oxygen demand (COD), and calorific value (CV). These parameters were determined as reported in a study entitled “the comparative study on the performance of aboveground and underground fixed dome biogas digesters” [28]. Table 3 presents a summary of the substrate properties determined.

2.2. Experimental/Methane Production Setup

First, the experiment for methane production was carried out at the Fort Hare Institute of Technology (FHIT), Research Centre, University of Fort Hare, South Africa. During the performance monitoring, the pH value was, on average, at a neutral level, while the temperature of the slurry was maintained at 35 °C, which is the mesophilic temperature suitable for optimum methane production. The biogas digester was charged by introducing 200 L of cow dung on the first day. Thereafter, inoculum (cow dung slurry) from an existing biogas digester was introduced to help in increasing the rate of degradation or fermentation. After the first day of feeding, the gas valve was left open for 48 h (2 days) to allow the expulsion of any air. However, in the subsequent feeding, 50 L of the cow dung were introduced every 3 days between the hours of 9:00 a.m. and 10:00 a.m. The inlet and outlet chambers of the biogas digester were constructed using clinker bricks, and the digestion chamber was fabricated using high-density polyethylene (HDPE) material. The dimensions of the digester chambers were 895 mm by 985 mm for the inlet chamber, and 1290 mm by 1430 mm for the outlet chamber, representing their height by width, respectively. The fabricated biogas digester was set up as shown in Figure 1. However, the scope of the study focused on the underground biogas digester system of volume 2.15 m3, as seen in Figure 1.
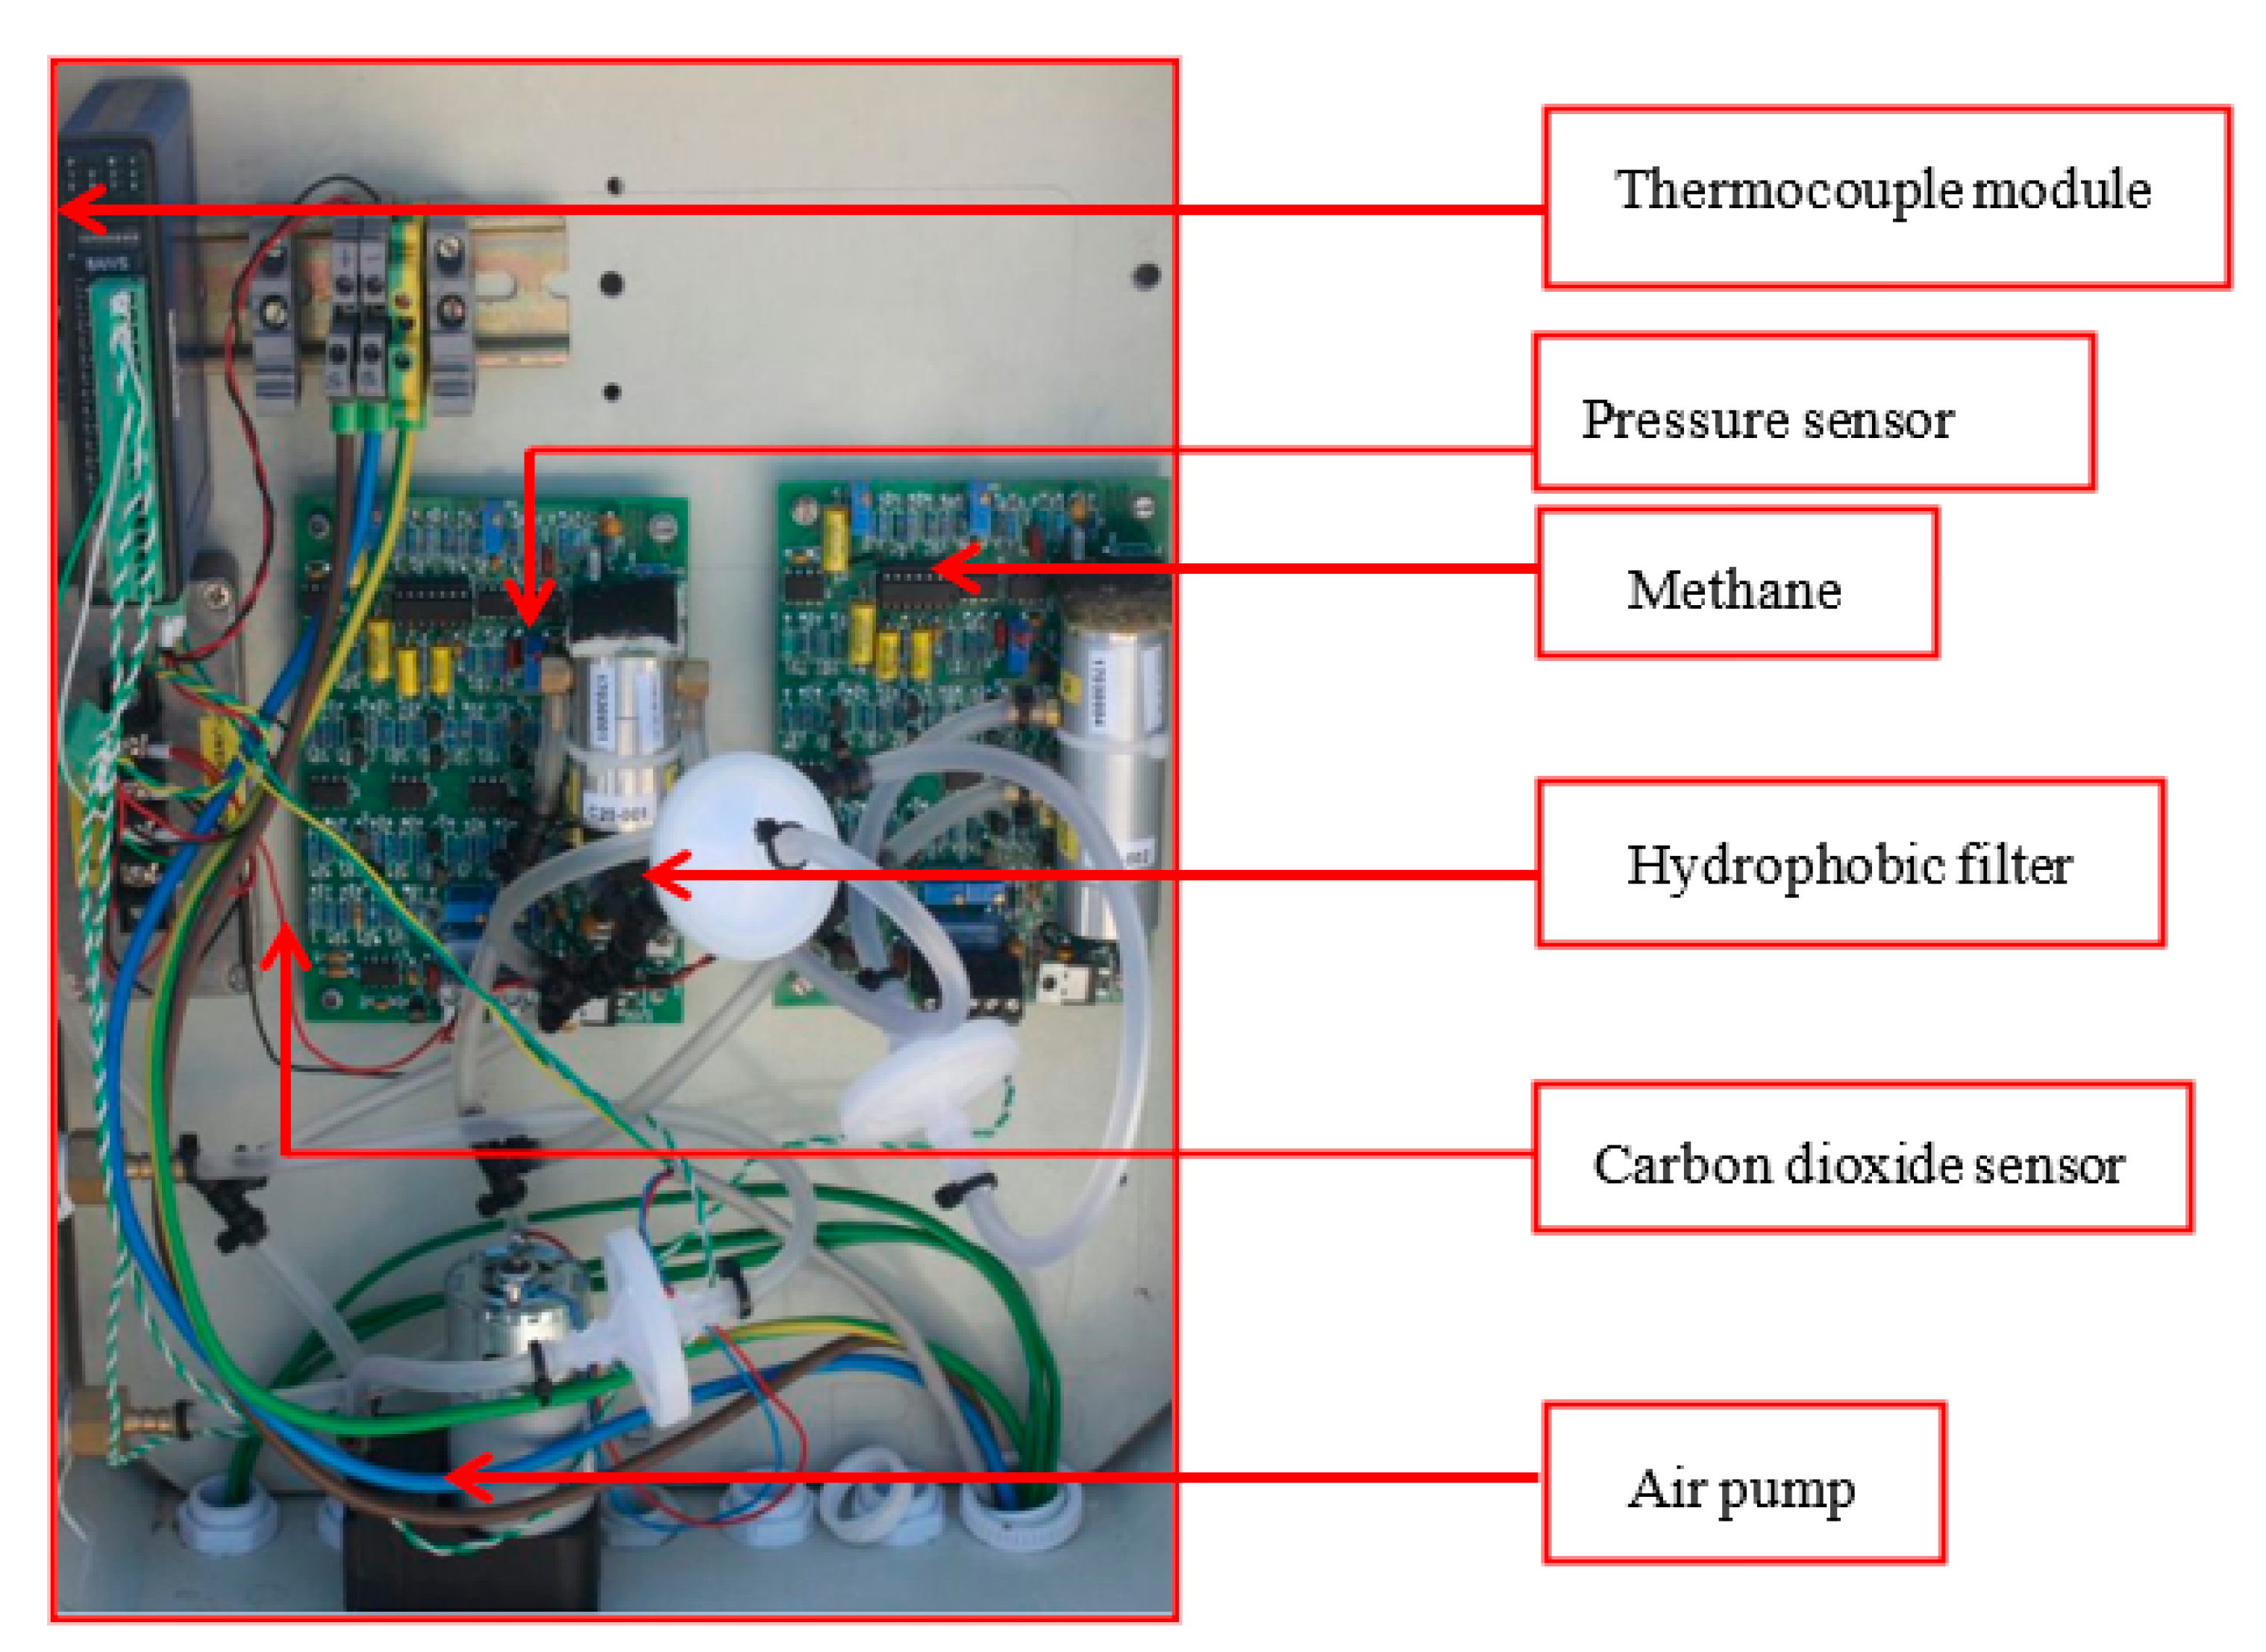
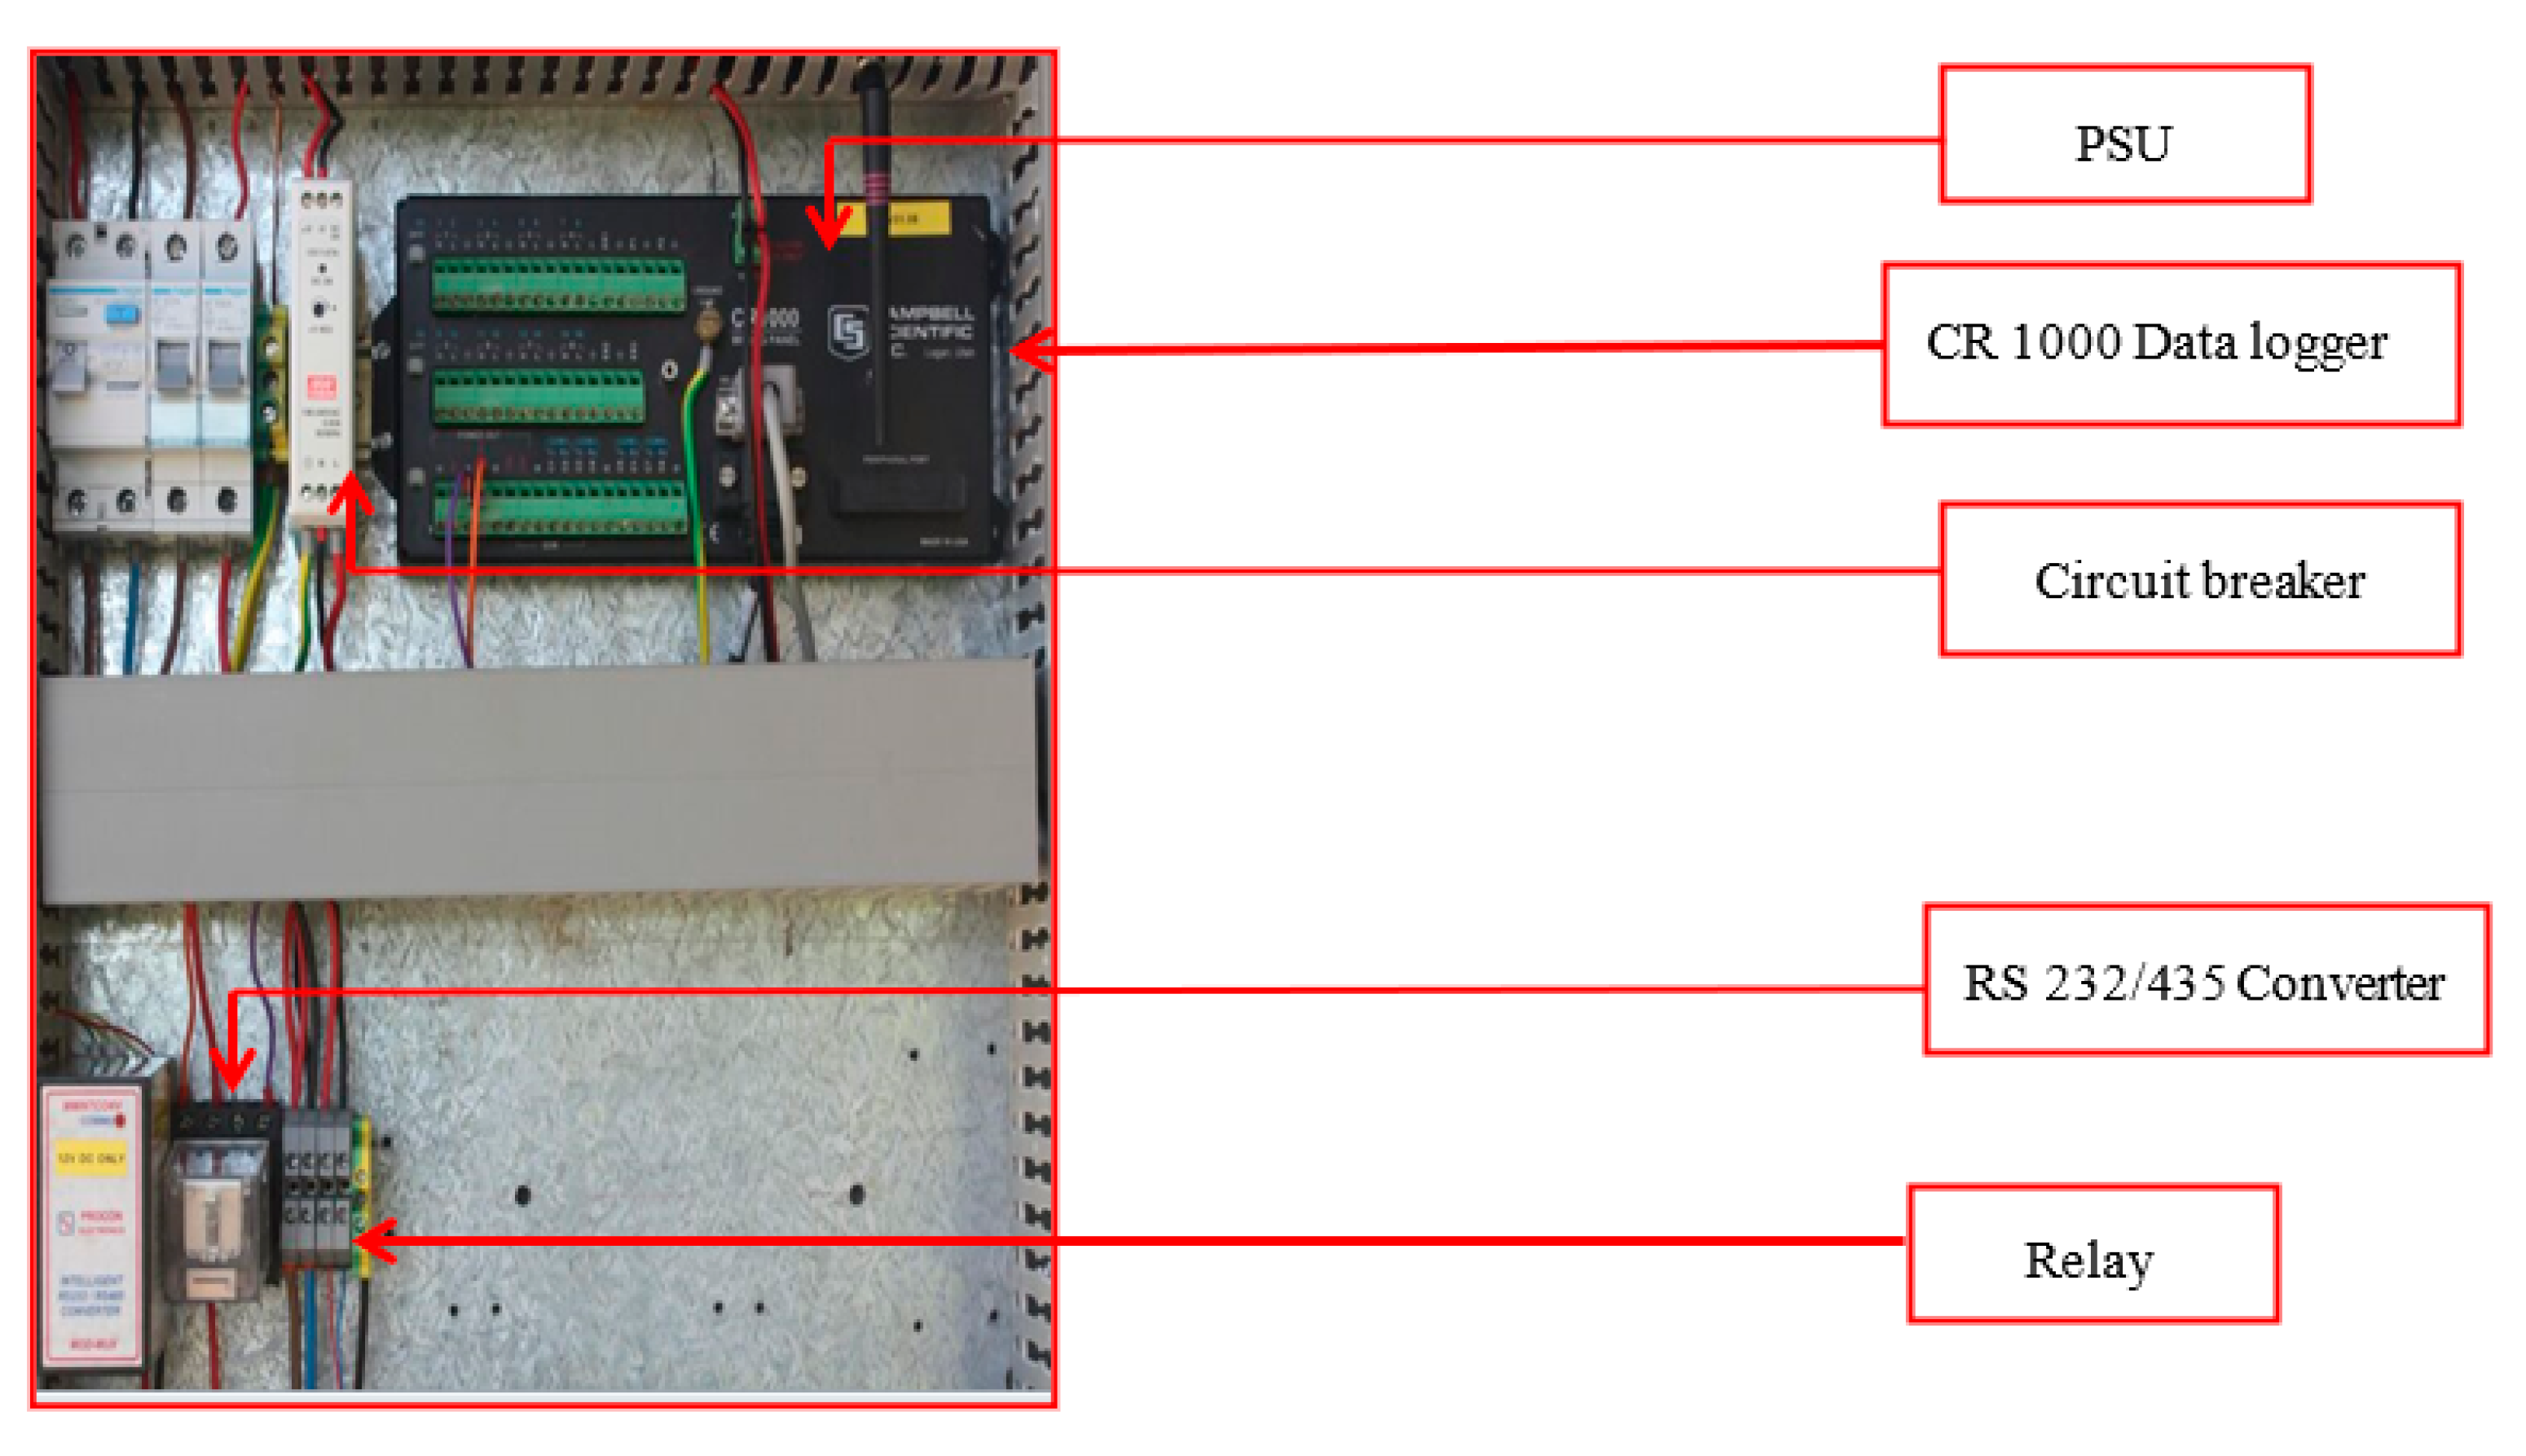
Secondly, the gas–temperature–pressure monitoring system (GTPMS) and the data acquisition system (DAS) were designed and built for the purpose of monitoring the performance and collection of data for the biogas digester system. The GTPMS consisted of gas sensors, a pressure sensor, air pump, hydrophobic filter, and thermocouple modules, as shown in Figure 2. The GTPMS was a low-cost system capable of monitoring gases (CO2 and CH4) and temperature at various locations within the biogas digester. Two non-dispersive infrared (NDIR) sensors were used in measuring the methane and carbon dioxide volumes. A type K thermocouple was used for the measurement of temperature, and a pH digital meter was used for measurements of the pH throughout the days of the monitoring. The DAS had a 5-channel capacity and consisted of a data logger, power supply unit, circuit breaker, and converter, as shown in Figure 3. The data acquisition system was powered from the control unit. The system was used to store and collect data from the gas–temperature–pressure monitoring system (GTPMS) for methane, carbon dioxide, temperature, and pH.

2.3. Development, Consideration and Techniques of the Mathematical Model and Its Validation

The input parameters (ambient temperature, relative humidity, global irradiance, pH, biogas temperature, and bottom and top slurry temperature) were used in the development of the model. These parameters were considered because they affect methane yield directly or indirectly. The 430 datasets were unbiased and randomly partitioned, into two-thirds, or 286 (67%), as the trained dataset, and one-third, or 144 (33%), as the test dataset. The trained dataset of 286 (67%) values was used for the development of the mathematical model, while the test dataset of 144 (33%) values was used to validate the derived mathematical model. Table 4 presents the ranges of measured raw data of the model parameter used in the development and validation of the model.

2.4. Parameters Used for Establishing a Customized General Model for Methane Production

One of the main factors that influences methane production is the input material. Therefore, the selection of parameters for the development of the model was based on this factor affecting the input materials. The study concentrates on the indoor and outdoor parameters that can influence the output. Hence, the pH, Tg, Tt, and Tb are the indoor parameters (measured inside the digester), whereas the RH, Ir, and Tam are the outdoor parameters (measured outside the digester). Therefore, this set of effective input parameters was used in the development of the customized general methane production model from cow dung in a fixed dome digester. These include:
  • Relative pH (pHr): This is the ratio of the absolute pH to the neutral pH (pHn) of 7.00. pH of 7 promises to be the desired pH for optimum biogas production;
  • Relative I (Ir): This is the ratio of the absolute global solar irradiance to the maximum global irradiance to the maximum global irradiance (Imax) of 1360 W/m2. This variable is necessary because of the black nature of the material used for the fabrication, which contributes to retaining the heat inside the digester which enhances methane production;
  • Relative RH (RHr): This is the ratio of the absolute, relative humidity to the maximum relative humidity (RHmax) of 100%;
  • Ambient temperature: This is the surrounding temperature in the vicinity of the digesters (Tam);
  • Gas temperature: This is the temperature in the vicinity of methane produced inside the digesters (Tg);
  • Slurry bottom temperature: This is the temperature of the slurry at a lower level within the digesters (Tb);
  • Slurry top temperature: This is the temperature of the slurry at an upper level within the digesters (Tt).

2.5. Derivation of the Mathematical Model

All mathematical models (either non-linear or linear as well as empirical or stochastic model) comprised input parameters known as the predictors, the output parameter(s) known as the desired response(s), and the model equation which correlates the predictors to the response. The study sought to develop a non-linear model because of its robustness, especially outside the range of observed data. In addition, the non-linear mathematical model correlated predictors of the response. Therefore, the developed mathematical model for the prediction of methane volume is given in Equation (6). The model was derived and developed from a linear combination of the product term of the affected input and the exponential combination of the desired input using MATLAB, as shown in Equation (10) (background of the model).
G a s   V o l u m e = A + B [ ( p H r + I r + R H r ) ( T g T a m ) T b + T t 2 ] + C e ( p H r + I r + R H r )
Equation (6) can be reduced into a more simplified form, as presented in Equation (7).
V = A + B x + C Y
where V is the volume of desired response(s) of CH4 yield in m3, and A is the forcing constant (m3).
The forcing constant (A) is referred to as the lump arbitrary constant that caters for the possible input parameters which could impact the output but are not considered in the derived mathematical equation. It is a vital part of the mathematical model because it ensures that the predicted modelled responses forcefully mimic the calculated output. However, it takes a non-zero real number, provided there are some other predictors contributing to the output. This was not included in the derived mathematical model. In addition, x from Equation (7) is given as:
x = ( P H r + I r + R H r ) ( T g T a m ) ( T b + T t 2 )
Equation (8) represents the linear combination term for the product of the relative input quantities (PHr, Ir, RHr), air temperature input quantities (Tg, Tam), and the slurry temperature input quantities (Tb, Tt). Its unit is (°C).
B is the scaling constant for x, and the unit is m3/°C. B is equated to a positive or negative real number known as the scaling value, upon which derivation of the mathematical model equation:
Y = e ( P H r + I r + R H r ) is an exponential term for the summation of the relative input quantities PHr, Ir, and RHr and has no unit.
C is a scaling constant for Y, and the unit is m3. C is equated to a positive or negative real number called the scaling value, upon which derivation of the mathematical model is developed.
The mathematical models employed in the study exhibited precise workflows that included: the import of data, fit of a model mesh surface plot, testing its quality, and modifying it to improve the quality and predictability [30].
The systematic procedures were implemented in agreement with the workflows:
(i)
Step 1: Import the processed data into a data array;
(ii)
Step 2: Create a fitted model;
(iii)
Step 3: Locate and remove outliers;
(iv)
Step 4: Simplify the model;
(v)
Step 5: Predict the response (output).
The main concept of the developed mathematical model (see Equation (6)) is the fact that it includes more than one independent variable. Therefore, the principles of least squares and maximum likelihood were used for the estimation of the parameter used to develop the model as presented in Equation (6), because they are the two statistical procedures. The principle of least squares was used to determine the coefficient in a linear regression model by minimising the sum of squares of the differences between fitted values and observed values, regardless of the form of the distribution of the errors, which thereby produces the best linear unbiased estimators of those coefficients. The maximum likelihood was used to choose those which maximised the likelihood function.
Setting the number of observations to be T, the input and output datasets for the experiment were expressed as follows in matrix formats using MATLAB, as shown in Equation (9):
A = A . [ 1 1 . . . 1 T 1 1 T ] B x = B . [ x ( 1 ) x ( 2 ) . . . x ( n 1 ) T 1 x ( n ) T ] C Y = C . [ Y ( 1 ) Y ( 2 ) . . . Y ( n 1 ) T 1 Y ( n ) T ] V = [ V ( 1 ) V ( 2 ) . . . V ( n 1 ) T 1 V ( n 1 ) T ]
[ V ( 1 ) V ( 2 ) . . . V ( n 1 ) T 1 V ( n ) T ] = [ A A . . . A A ] + [ B x ( 1 ) B x ( 2 ) . . . B x ( n 1 ) T 1 B x ( n ) T ] + [ C Y ( 1 ) C Y ( 2 ) . . . C Y ( n 1 ) T 1 C Y ( n ) T ]
Equation (10) can be expanded to give Equation (11):
[ V ( 1 ) V ( 2 ) . . . V ( n 1 ) T 1 V ( n ) T ] = [ A + B x ( 1 ) + C Y ( 1 ) A + B x ( 2 ) + C Y ( 2 ) . . . A + B x ( n 1 ) T 1 + C Y ( n 1 ) T 1 A + B x ( n ) T + C Y ( n ) T ]
Furthermore, Equation (11) can be expressed by MATLAB code, as shown in Equation (12).
[ V ( 1 ) V ( 2 ) . . . V ( n 1 ) T 1 V ( n ) T ] = [ 1 x ( 1 ) Y ( 1 ) 1 x ( 2 ) Y ( 2 ) . . . . . . . . . 1 x ( n 1 ) T 1 Y ( n 1 ) T 1 1 x ( n ) T Y ( n 1 ) T ] [ A B C ]
Dividing both sides of Equation (12) by the constants (A, B and C) on the right-hand side gives the resultant Equation (13) in MATLAB code. This was performed with the regress function.
[ A B C ] = r e g r e s s ( [ V ( 1 ) V ( 2 ) . . . V ( n 1 ) T 1 V ( n ) T ] , [ 1 x ( 1 ) Y ( 1 ) 1 x ( 2 ) Y ( 2 ) . . . . . . . . . 1 x ( n 1 ) T 1 Y ( n 1 ) T 1 1 x ( n ) T Y ( n ) T ] )

3. Results and Discussion

3.1. Mathematical Model for the Methane Volume in the Biogas Digester

A total of 286 datasets serving as predictors and responses were used in the training data to build and derived the forcing and scaling constants in the developed model. The new model equation for the volume of methane gas is given in Equation (6).
G a s   V o l u m e = A + B [ ( p H r + I r + R H r ) ( T g T a m ) T b + T t 2 ] + C e ( p H r + I r + R H r )
Refer to Section 2.4 and Section 2.5 for the definition of terms.
Table 5 shows the model equation determination coefficient, and forcing and scaling constants for the volume of methane produced in one cubic meter.
From Table 5, the constants A, B and C are positive real numbers. An increase in the lump input parameters (x or Y) would result in a corresponding increase in the volume of methane provided the other parameter remained unchanged. Additionally, any decrease in the lump input predictors would result in a rise in the volume of methane produced. This is similar to the study conducted by Delgadilo and Hernandez [16], where an increase in the input parameters (organic matter and volatile fatty acid) corresponded to an increase in the volume of methane production. However, it is contrary to the study conducted by Bisway et al. [18] on the mathematical modelling for the prediction of biogas generation based on food and vegetable residues in an anaerobic digester. Their findings revealed that the input parameters used in the model (slurry concentration and carbohydrate concentration) decreased as methane production increased, while the protein concentration increased as the methane production decreased. In summary, Table 6 presents a comparative study of the present model with previous models from selected authors.
The non-linear model used in the development of the model was always robust, and the methane production prediction was of high accuracy in the underground digester. This shows that the outdoor parameters (ambient temperature, relative humidity, and global irradiance) affected the methane yield as well as the system indoor parameters (pH, gas temperature, slurry bottom and top temperature). This is because the scaling factors associated with these quantities are non-zero real number (see Table 5). In addition, over 90% of the prediction could be guaranteed with a 95% confidence level, which confirms the accuracy of the custom general model.
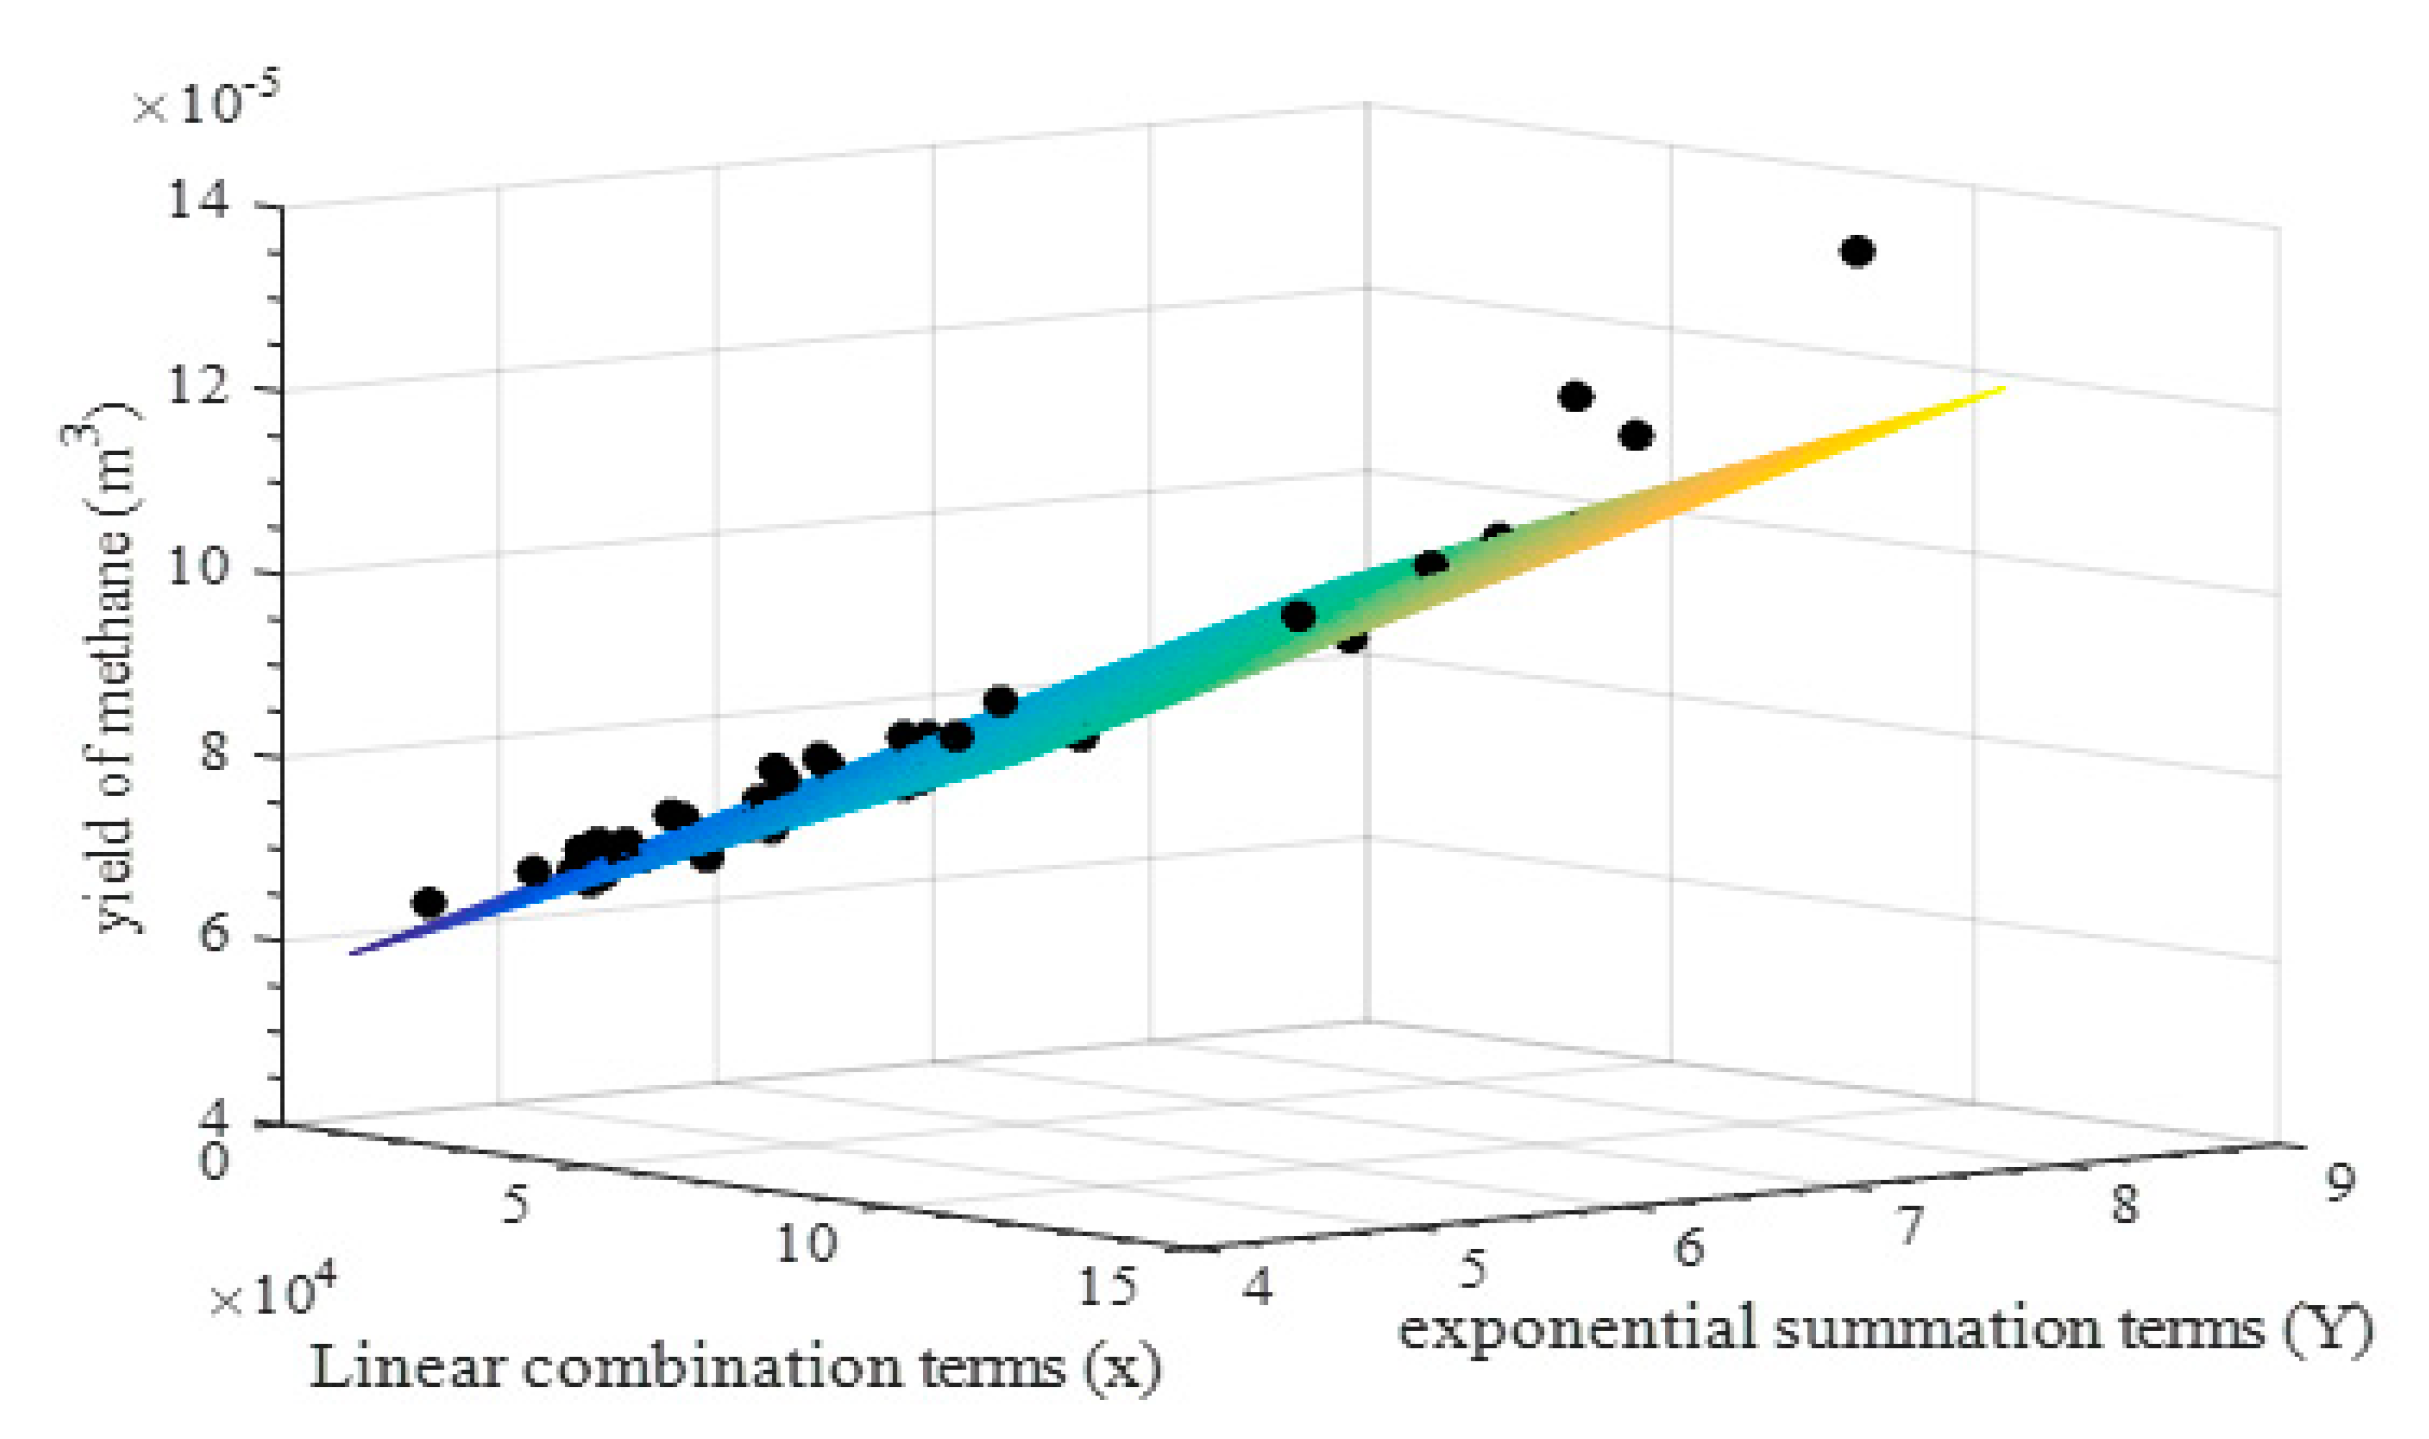
Figure 4 shows the model 3D mesh surface plot, and 40 calculated methane yields with inputs (represented by black solid circles) for the biogas digester. The 3D mesh surface plot represents all possible model outputs for the potential combination of the set of input parameter values over the full range of the trained data.
From Figure 4, the plotted dataset points exhibited a very good fit with the mesh surface model plot and with negligible outliers. The determination coefficient between the modelled volume of methane and the calculated volume of methane was 0.955, and the p-value was 0.852. The result of the R2 is similar to the study conducted by Deng et al. [11], where the R2 was in the range of 0.971–0.990 for the modelling of anaerobic digestion of swine for methane production. Hence, the high values of the determination coefficient and the p-value confirmed that the model accurately predicted the calculated output. Interestingly, the determination coefficient for the methane production was over 0.900, with excellent fitting between the dataset and the model surface mesh plot, as seen in Figure 4. Additionally, the p-value of the calculated and modelled biogas yield for the biogas digester was above 80%, and hence demonstrated no significant difference.
The mathematical model developed in Equation (6) is of interest for using the model in predicting performance based on different volumes. Hence, the model was developed and validated to make predictions of the same digester volume but in different locations. Therefore, without any loss of generality, a different design of the system requires generating its forcing and scaling constants, provided other parameters used in the model remain constant.
From Table 6, it can be observed that most models developed for the prediction of methane production are data collected from pilot scale digesters (small scale). However, the data collected for the present model are from established large-scale working biogas digesters. Moreover, the present proposed model is capable of predicting methane production from a few predictors which are known as the key factors affecting methane production on an hourly basis, as compared to previous studies [1,10,16,18] that predicted methane production in daily intervals. Furthermore, in Table 6, pH and temperature (key factors affecting methane production) was used in studies by Manjusha and Sajeena [1] and Yang et al. [10]. However, the present study incorporated the addition of relative humidity and global irradiance, which tends to affect methane production directly or indirectly to the usual parameters used (pH and temperature). From the literature search and review, there is little or no information on 3D mesh plots which the present model has developed. The advantage of the 3D model mesh has been discussed above. In conclusion, one disadvantage of the proposed present model is that it is not applicable to a different volume of biogas digesters apart from the volume used in the study. Therefore, the empirical model used in the present study was advantageous because it is more applicable for predicting methane production than mechanistic models, as a result of the fewer input variables used in the development of the model. Hence, the study suggests future explorations of varying volumes.

3.2. Effect of the Variables on the Model

Having indicated that the parameters used in the development and building of the model influenced the output (methane yield), the effect of individual variables on the model for methane production as well as the justification of their selection are briefly discussed.
Temperature: Temperature is an important parameter of consideration due to its contribution during the anaerobic digestion process. The fluctuation in ambient temperature is attributed to changes in weather conditions, which result in the fluctuation of slurry temperature and other temperature used in the model. This is in agreement with a comparative study of biogas production for different animal slurries conducted by Ukpai et al. [31]. According to Mukumba et al. [32], instability in temperature impacts on the methanogenic activities, thereby reducing the methane yield. These microorganisms thrive at different temperature ranges, which include psychrophilic temperature range (0.0 °C to 20.0 °C), mesophilic temperature range (20.0 °C to 35.0 °C), and thermophilic temperature range (45.0 °C to 60.0 °C) [33,34,35,36]. The ambient temperature affects the rate of digestion as a result of the digester chamber wall which makes direct contact with the atmosphere. This situation causes the digester chamber to absorb or lose heat depending on the temperature difference between the digester chamber and the environment. The rate of heat loss or heat gain from the digester chamber is dependent on the insulation provided to the digester. At low temperature, the methanogens responsible for biogas production are not sufficiently activated in enhancing biogas production. This therefore results in low degradation of organic waste and low gas production [33,37].
pH: This is a very important parameter in the production of methane, and it depends on the quantity of free hydroxonium ions per unit volume. pH influences the activity of microorganisms in destroying organic matter into methane. Microorganisms of different groups involved in anaerobic digestion require different pH values. Variation in pH of a substrate results in instability and acid accumulation, which, in turn, causes a decrease in methane production and, in some cases, biogas digester failure. This was confirmed in the study conducted by Obileke et al. [28], who provided a relationship between biogas yield and pH of the digester. The study evidently showed that a neutral pH results in higher biogas production. Budiyono et al. [38] found that a neutral pH value of 7 gave the highest biogas percentage of 60.8%, followed pH values of 8, 9, 6 and 5 that yielded 60.1, 59.4, 58.6 and 56.7%, respectively. Another study equally stated that a greater cumulative biogas yield of 3617 mL was produced at a pH of 7 compared to 2948 and 3294 mL produced at pH values of 6 and 8, respectively [39]. It is also important to highlight that the pH of the substrate is influenced by temperature. Dobre et al. [39] suggested that the pH of the reaction medium can be controlled by a bicarbonate buffer system.
Relative humidity: Biogas is produced by anaerobic digestion (AD), and the water content of raw gas leaving the digester depends on the temperature of the bacterial process, with relative humidity inside the digester typically at 100%. This is because of condensation that occurs inside the digester chamber. The fluctuation in the RH, which corresponds to the fluctuation in the methane yield, might be attributed to the change in weather conditions of the study site. Relative humidity is a function of the ambient temperature, as reported by Obileke et al. [28]; therefore, the quantity of water and the content of total solids in the substrate influences biogas yield.
Global irradiance: The solar radiation has a significant impact on the production of methane. This parameter was involved in the model because of the black nature of material used in the fabrication, which was able to retain heat inside the digester, although the digester was underground. For the development of the model using the global irradiance data, sunny and cloudy days were defined. The sunny days were referred to as days with an absence of visible clouds, while the cloudy days were days with a presence of visible clouds. Hence, the global irradiance of the study area had a maximum value of 1360 W/m2, as indicated in Section 2.3.

3.3. Validation of the Mathematical Model for Methane Production

This section presents the validation of the developed mathematical models for the volume of methane yield produced from the biogas digester. The essence of the validation of the mathematical model developed was to determine the degree to which the modelled methane produced corresponded to the calculated methane. The model presented in Equation (6) was used to produce the modelled predicted response(s) of methane using the test dataset in the input predictors, as well as the test dataset for the calculated methane yield from the experiment. Validation of the model for the methane production in the underground biogas digester was conducted between the calculated data and the modelled data of the test dataset, which constituted 144 (one-third) of the datasets from the biogas digester system. The modelled output/response was obtained by substituting the values of the predictors into the model equation, with the respective derived scaling constants obtained from the developed and built mathematical models using the trained dataset. The test dataset (exclusive data of 144 datasets) of the predictors and the response from the biogas digester during the monitoring period were employed to test the validity of the developed model.
Figure 5 shows the samples (40 observations) of test calculated methane yield and the predicted methane yield from the derived mathematical model.
From Figure 5, it can be deduced that the calculated and predicted methane yields varied between 0.6 × 10⁻⁴ and 1.2 × 10⁻⁴ m3, which is equivalent to 0.06–0.12 mL/gVS. The predicted methane yield and the calculated methane yield from Figure 5 showed a strong correlation. The root mean square bias errors of the calculated and modelled methane were much smaller than the minimum calculated methane yield obtained from the test dataset. Hence, the very small root mean square bias error further confirmed the accuracy of the derived mathematical models.
Table 7 shows some critical calculated inputs and modelled methane yield for the biogas digester from the sample test dataset in Figure 5.
It can be deduced from Table 7 that the calculated and predicted methane yields are almost equal, which therefore confirmed the validity of the model. In addition, the determination coefficient and the p-value of the predicted and calculated methane yield based on the degree of variable selected for the model were 0.962 and 0.920, respectively. This showed a good match, accuracy, and robustness of the model in predicting methane production. This is similar compared with the studies by Yan et al. [40] and Ellis et al. [41], who reported R2 values of 0.92 and 0.97, respectively, using cow dung as a substrate for methane production. The difference between the determination coefficients (R2) of the present study and the studies conducted by Yan et al. [40] and Ellis et al. [41] was approximately 0.05. This is attributed to the different dataset used for the development of the model [42]. However, the validations proved that the derived mathematical model of the methane yield and the calculated methane in the biogas digester was reliable and accurate, because both the determination coefficient (0.955) and p-value (0.852) are within the accepted ranges. Hence, the high values of the determination coefficient and the p-value confirmed that the model accurately predicted the calculated output.

3.4. Model Sensitivity

The developed built custom general mathematical model equation provides multipurpose benefits because it could be used for in-depth performance prediction of a system as a universal model equation. The custom general model is robust, and the prediction of methane production was highly accurate. The determination coefficient of methane production of the biogas digester was of a very acceptable range and demonstrated that over 90% of the prediction could be guaranteed with a 95% confidence level. Hence, the developed mathematical model is said to be accurate. It is interesting to state that the developed mathematical model considered the input parameters (pH, RH, I and temperature), with the digester volume omitted.

4. Suggestion for Future Studies

Irrespective of the accuracy of the mathematical model developed, the authors recommend long-term monitoring of the biogas digester for over a year. In addition, there is a need to use different volumes of biogas digesters to run the experiment in order to predict the performance. Additionally, there are still some uncertainties on whether the model will be applicable to other animals’ waste besides cow dung. This is suggested as a future study for verification.

5. Conclusions

In the present study, a non-linear mathematical model was developed to predict the methane yield of an underground biogas digester. The input parameters considered in the development of the model include ambient temperature, relative humidity, global irradiance, pH, biogas temperature, and bottom and top slurry temperature. The experimentally obtained dataset was divided into two; namely, approximately 67% was the trained dataset and was used in model development, and 33% was the test dataset which was used for validation purposes. The findings of the study showed that among the modelled input parameters, temperature had the greatest effect on methane yield, and the ambient temperature had a directly proportional relationship with slurry and biogas temperature. Similarly, pH as one of the input parameters had a significant effect on methane yield. It influences the activity of microorganisms in destroying organic matter into methane. Variation in pH of a substrate results in instability and acid accumulation, which in turn causes a decrease in methane production and, in some cases, biogas digester failure. The model’s simplified form made it easy for the simulation of methane yield.

Author Contributions

Conceptualisation, writing—original draft preparation, and methodology, K.O.; supervision, funding, and resources, S.M., E.L.M., and G.M.; writing—review and editing and methodology, N.N. All authors have read and agreed to the published version of the manuscript.

Funding

The project was supported by the Provincial Department of Rural Development and Agrarian Reform South Africa.

Institutional Review Board Statement

Not applicable.

Informed Consent Statement

Not applicable.

Data Availability Statement

Comprehensive detail regarding the raw data used in the study can be obtained from the corresponding author on request.

Acknowledgments

The authors would like to acknowledge the Goven Mbeki Research Development Commission for the support received and also grateful to the staff, students and technician of Fort Hare Institute of Technology (FHIT), University of Fort Hare for their contributions and ideas during the study.

Conflicts of Interest

The authors declare no conflict of interest.

Statement of Novelty

The study expanded on the impact of additional meteorological factors (ambient temperature, relative humidity, and global solar irradiance) on methane production, as opposed to other studies that have focused only on the impact of ambient temperature as a meteorological factor. Additionally, it demonstrated the simultaneous variability of the inputs to the desired output by the employment of the 3D mesh plots and the potential outcomes of the desired output in the “if scenario” (which is what would have been the output, if other possible inputs were obtained which were not determined by the trained data used in the development of the mathematical models). The study will be of benefit to researchers and energy engineers that are involved in biogas technology, as well as some communities in South Africa with abundant cow dung for biogas production.

Nomenclature

FHITFort Hare Institute of Technology
R2Determination of coefficient
pHrRelative pH
Ir (W/m2)Relative global horizontal irradiance
RHr (%)Relative humidity
I (W/m2)Global horizontal irradiance
Tg (°C)Gas temperature
C/NCarbon/nitrogen
Tt (°C)Slurry top temperature
ADM1Anaerobic digestion model no. 1
ADAnaerobic digestion
Tam (°C)Ambient temperature
RMSERoot means square error
Tb (°C)Slurry bottom temperature
ANNArtificial neural network
IAIndex of agreement
CH4 (mL/gVS)Methane
HDPE High-density polyethylene plastic

References

  1. Manjusha, C.; Sajeena, B. Mathematical modelling and stimulation of anaerobic digestion of solid waste. Procedia Technol. 2016, 24, 654–660. [Google Scholar] [CrossRef] [Green Version]
  2. Ahring, B.K. Biomethanation; Springer: Berlin/Heidelberg, Germany, 2003. [Google Scholar] [CrossRef]
  3. Deublein, D.; Steinhauser, A. Biogas from Waste and Renewable Resources—An Introduction; WileyVCH Verlag GmbH & Co, KGaA: Weinheim, Germany, 2003. [Google Scholar]
  4. Wu, C.F.J.; Hamada, M. Experiment: Planning, Analysis and Parameter Design Optimization, 2nd ed.; John Wiley & Sons: Hoboken, NJ, USA, 2011. [Google Scholar]
  5. Bush, R.R.; Mosteller, F. A mathematical model for simple learning. In Selected Papers of Frederick Mosteller; Springer: New York, NY, USA, 2006; pp. 221–234. [Google Scholar]
  6. Enitan, A.M.; Adeyemo, J.; Swalaha, F.M.; Kumari, S.; Bux, F. Optimization of biogas generation using anaerobic digestion models and computational intelligence approaches. Rev. Chem. Eng. 2017, 33, 309–335. [Google Scholar] [CrossRef]
  7. Lauwers, J.; Appels, L.; Thompson, I.P.; Degreve, J.; van Impe, J.F.; Dewil, R. Mathematical modelling of anaerobic digestion of biomass and waste: Power and limitations. Progress. Energy Combust. Sci. 2013, 39, 383–402. [Google Scholar] [CrossRef] [Green Version]
  8. Theuerl, S.; Herrmann, C.; Heiermann, M.; Grundmann, P.; Landwehr, N.; Kreidenweis, U.; Prochnow, A. The future agricultural biogas plant in Germany: A vision. Energy Rev. 2019, 12, 396. [Google Scholar] [CrossRef] [Green Version]
  9. Kundu, K.; Sharma, S.; Sreekrishnan, T.R. Influence of process parameters on anaerobic digestion microbiome in bioenergy production: Towards an improved understanding. Bioenergy Resour. 2017, 102, 5045–5063. [Google Scholar] [CrossRef]
  10. Yang, H.; Deng, L.; Liu, G.; Yang, D.; Liu, Y.; Chen, Z. A model for methane production in anaerobic digestion of swine waste water. Water Resour. 2016, 102, 464–474. [Google Scholar]
  11. Deng, L.; Yang, H.; Liu, G.; Lei, Y. Kinetic of temperature effect and its significance to the heating strategy for anaerobic digestion of swine wastewater. Appl. Energy 2014, 134, 349–355. [Google Scholar] [CrossRef]
  12. Addario, M.D.; Temizel, I.; Edes, N.; Onay, T.T.; Demirel, B.; Copty, N.K.; Ruggeri, B. Development of Fuzzy logic model to predict the effects of ZnO nanoparticles on methane production from stimulated landfill. J. Environ. Chem. Eng. 2017, 5, 5944–5953. [Google Scholar] [CrossRef]
  13. Rieke, C.; Stollenwerk, D.; Dahmen, M.; Pieper, M. Modelling and optimization of a biogas plant for a demand driven energy supply. Energy 2018, 145, 657–664. [Google Scholar] [CrossRef]
  14. Girault, R.; Rousseau, P.; Steyer, J.P.; Bernet, N.; Beline, F. Combination of batch experiments with continuous reactor data for ADM1 calibration: Application to anaerobic digestion of pig slurry. Water Sci. Technol. 2011, 63, 2575–2582. [Google Scholar] [CrossRef]
  15. Batstone, D.; Keller, J.; Angelidaki, I.; Kalyuzhnyi, S.; Pavlostathis, S.; Rozzi, A.; Sanders, W.; Siegrist, H.; Vavilin, V. The anaerobic digestion model no 1 (ADM1). Water Sci. Technol. 2002, 45, 65–73. [Google Scholar]
  16. Delgadilo-Mirquez, L.; Machado-Higuera, M. Mathematical modelling and simulation of biogas production from organic waste. Int. J. Eng. Model. Simul. 2018, 10, 97–102. [Google Scholar] [CrossRef]
  17. Edwiges, T.; Frare, L.; Alino, J.; Lins, L.; Flotats, X.; Sarolli, M. Use of mathematical models to fast predict biochemical methane potential of fruit and vegetable waste. In Proceedings of the AD15—15th World Congress on Anaerobic Digestion, Beijing, China, 17–20 October 2017. [Google Scholar]
  18. Biswas, J.; Chowdhury, R.; Bhattacharya, P. Mathematical modelling for the prediction of biogas generation characteristics of an anaerobic digester based on food/vegetable residues. Biomass Bioenergy 2007, 31, 80–86. [Google Scholar] [CrossRef]
  19. Zareei, S.; Khodaei, J. Modelling and optimisation of biogas production from cow manure and maize straw using an adaptive neuro-fuzzy inference system. Renew. Energy 2017, 114, 423–427. [Google Scholar] [CrossRef]
  20. da Silva, I.S. South Africa’s biogas market potential worth R10-bn. Moon of the South News from Africa. 2013. Available online: http://moonofthesouth.com/South-Africa-biogas-market/ (accessed on 14 March 2021).
  21. Okudoh, V.; Trois, C.; Workneh, T.; Schmidt, S. The potential of cassava biomass and applicable technologies for sustainable biogas production in South Africa: A review. Renew. Sustain. Energy Rev. 2014, 39, 1035–1052. [Google Scholar] [CrossRef]
  22. Marrison, C.I.; Larson, E.D. A preliminary analysis of the biomass energy production potential in Africa in 2025 considering projected land needs for food production. Biomass Bioenergy 1996, 10, 337–351. [Google Scholar] [CrossRef]
  23. Lynd, L.R.; Weimer, P.J.; van Zyl, W.H.; Pretorius, I.S. Microbial cellulose utilization: Fundamentals and biotechnology. Microbiol. Mol. Biol. Rev. 2002, 66, 506–577. [Google Scholar] [CrossRef] [Green Version]
  24. von-Blottniz, H.; Melamu, R.; Aboyade, A.; Abraham, D.; Niyobuhungiro, R.; Paetz, C. Biogas Potential in South Africa: And What a Small Team at UCT Is Researching in That Regard; von Blottnitz, H., Ed.; University of Cape Town Publisher: Cape Town, South Africa, 2013. [Google Scholar]
  25. AGAMA Biogas. Integrated Biogas Solutions: Green Energy Solutions for Africa Energy; Legal Framework; AGAMA Energy: Cape Town, South Africa, 2008. [Google Scholar]
  26. Mukumba, P.; Makaka, G.; Mamphweli, S.; Simon, M.; Meyer, E. An insight into the status of biogas digesters technologies in South Africa with reference to the Eastern Cape Province. Fort Hare Pap. 2012, 19, 5–29. [Google Scholar]
  27. Nape, K.M.; Magama, P.; Moeletsi, M.E.; Tongwane, P.; Nakana, P.M.; Mliswa, V.K.; Motsepa, M.; Madikiza, S. Introduction of household bio digester in rural farming household of Maluti-a-Phofung Municipality South Africa. J. Energy South. Afr. 2019. [Google Scholar] [CrossRef] [Green Version]
  28. Obileke, K.; Mamphweli, S.; Meyer, E.; Makaka, G.; Nwokolo, N.; Onyeaka, H. Comparative study on the performance of aboveground and underground fixed dome biogas digesters. Chem. Eng. Technol. 2020, 43, 68–74. [Google Scholar] [CrossRef]
  29. Mukumba, P. Modelling of the Performance of a Batch Biogas Digester Fed with Selected Types of Substrates. Ph.D. Thesis, University of Fort Hare, Alice, South Africa, 2013. [Google Scholar]
  30. Tangwe, S. Demonstration of Residential Air Source Heat Pump Water Heater in South Africa: System Monitoring and Modelling. Ph.D. Thesis, University of Sunderland, Sunderland, UK, 2018. [Google Scholar]
  31. Ukpai, P.A.; Nnabuchi, M.N. Comparative study of biogas production from cow dung, cow pea and cassava peeling using 45 litres biogas digester. Adv. Appl. Sci. Res. 2012, 3, 1864–1869. [Google Scholar]
  32. Mukumba, P.; Makaka, G.; Mamphweli, S.; Misi, S. A possible design and justification for a biogas plant at Nyazura Adventist High School, Rusape, Zimbabwe. J. Energy South. Afr. 2013, 24, 12–20. [Google Scholar] [CrossRef]
  33. Wang, S.; Ma, F.; Ma, W.; Wang, P.; Zhao, G.; Lu, X. Influence of temperature on biogas production efficiency and microbial community in a two-phase anaerobic digestion system. Water 2019, 11, 133. [Google Scholar] [CrossRef] [Green Version]
  34. Rameshprabu, R.; Unpaprom, Y. Effect of temperature on the performance of biogas production from Duckweed. Chem. Res. J. 2016, 1, 58–66. [Google Scholar]
  35. İnce, E.İ.; Önkal, M.; Engin, G. Comparison of thermophilic and mesophilic anaerobic treatment for potato processing wastewater using a contact reactor. Glob. NEST J. 2017, 9, 318–326. [Google Scholar]
  36. Ukpai, P.A.; Agbo, P.E.; Nnabuchi, M.N. The effect of temperature on the rate of digestion and biogas production using cow dung, cow pea and cassava peeling. Int. J. Sci. Eng. Res. 2015, 6, 1255–1260. [Google Scholar]
  37. Uzodinma, E.O.U.; Onwuka, N.D. Optimum mesophilic temperature of biogas production from blends of agro-based waste. Trends Appl. Sci. 2007, 2, 39–44. [Google Scholar]
  38. Budiyano, I.; Syaichurrozi, S.; Sumardiono, S. Biogas production from bioethanol waste: The effect of pH and urea addition to biogas production rate. Waste Technol. 2013, 1. [Google Scholar] [CrossRef]
  39. Dobre, P.; Nicolae, F.; Matei, F. Main factors affecting biogas production—An overview. Rom. Biotechnol. Lett. 2014, 19, 9283–9296. [Google Scholar]
  40. Yan, T.; Mayne, C.S.; Gordon, F.G.; Porter, M.G.; Agnew, R.E.; Patterson, D.C.; Ferris, C.P.; Kilpatrick, D.J. Mitigation of enteric methane emissions through improving efficiency of energy utilization and productivity in lactating dairy cows. J. Dairy Sci. 2010, 93, 2630–2638. [Google Scholar] [CrossRef]
  41. Ellis, J.L.; Kebreab, E.; Odongo, N.E.; McBride, B.W.; Okine, E.K.; France, J. Prediction of methane production from daily and beef cattle. J. Dairy Sci. 2007, 90, 3456–3467. [Google Scholar] [CrossRef] [PubMed]
  42. Ramin, M. Predicting Methane Production in Daily Cows. Ph.D. Thesis, Swedish University of Agricultural Science, Uppsala, Sweden, 2013. [Google Scholar]
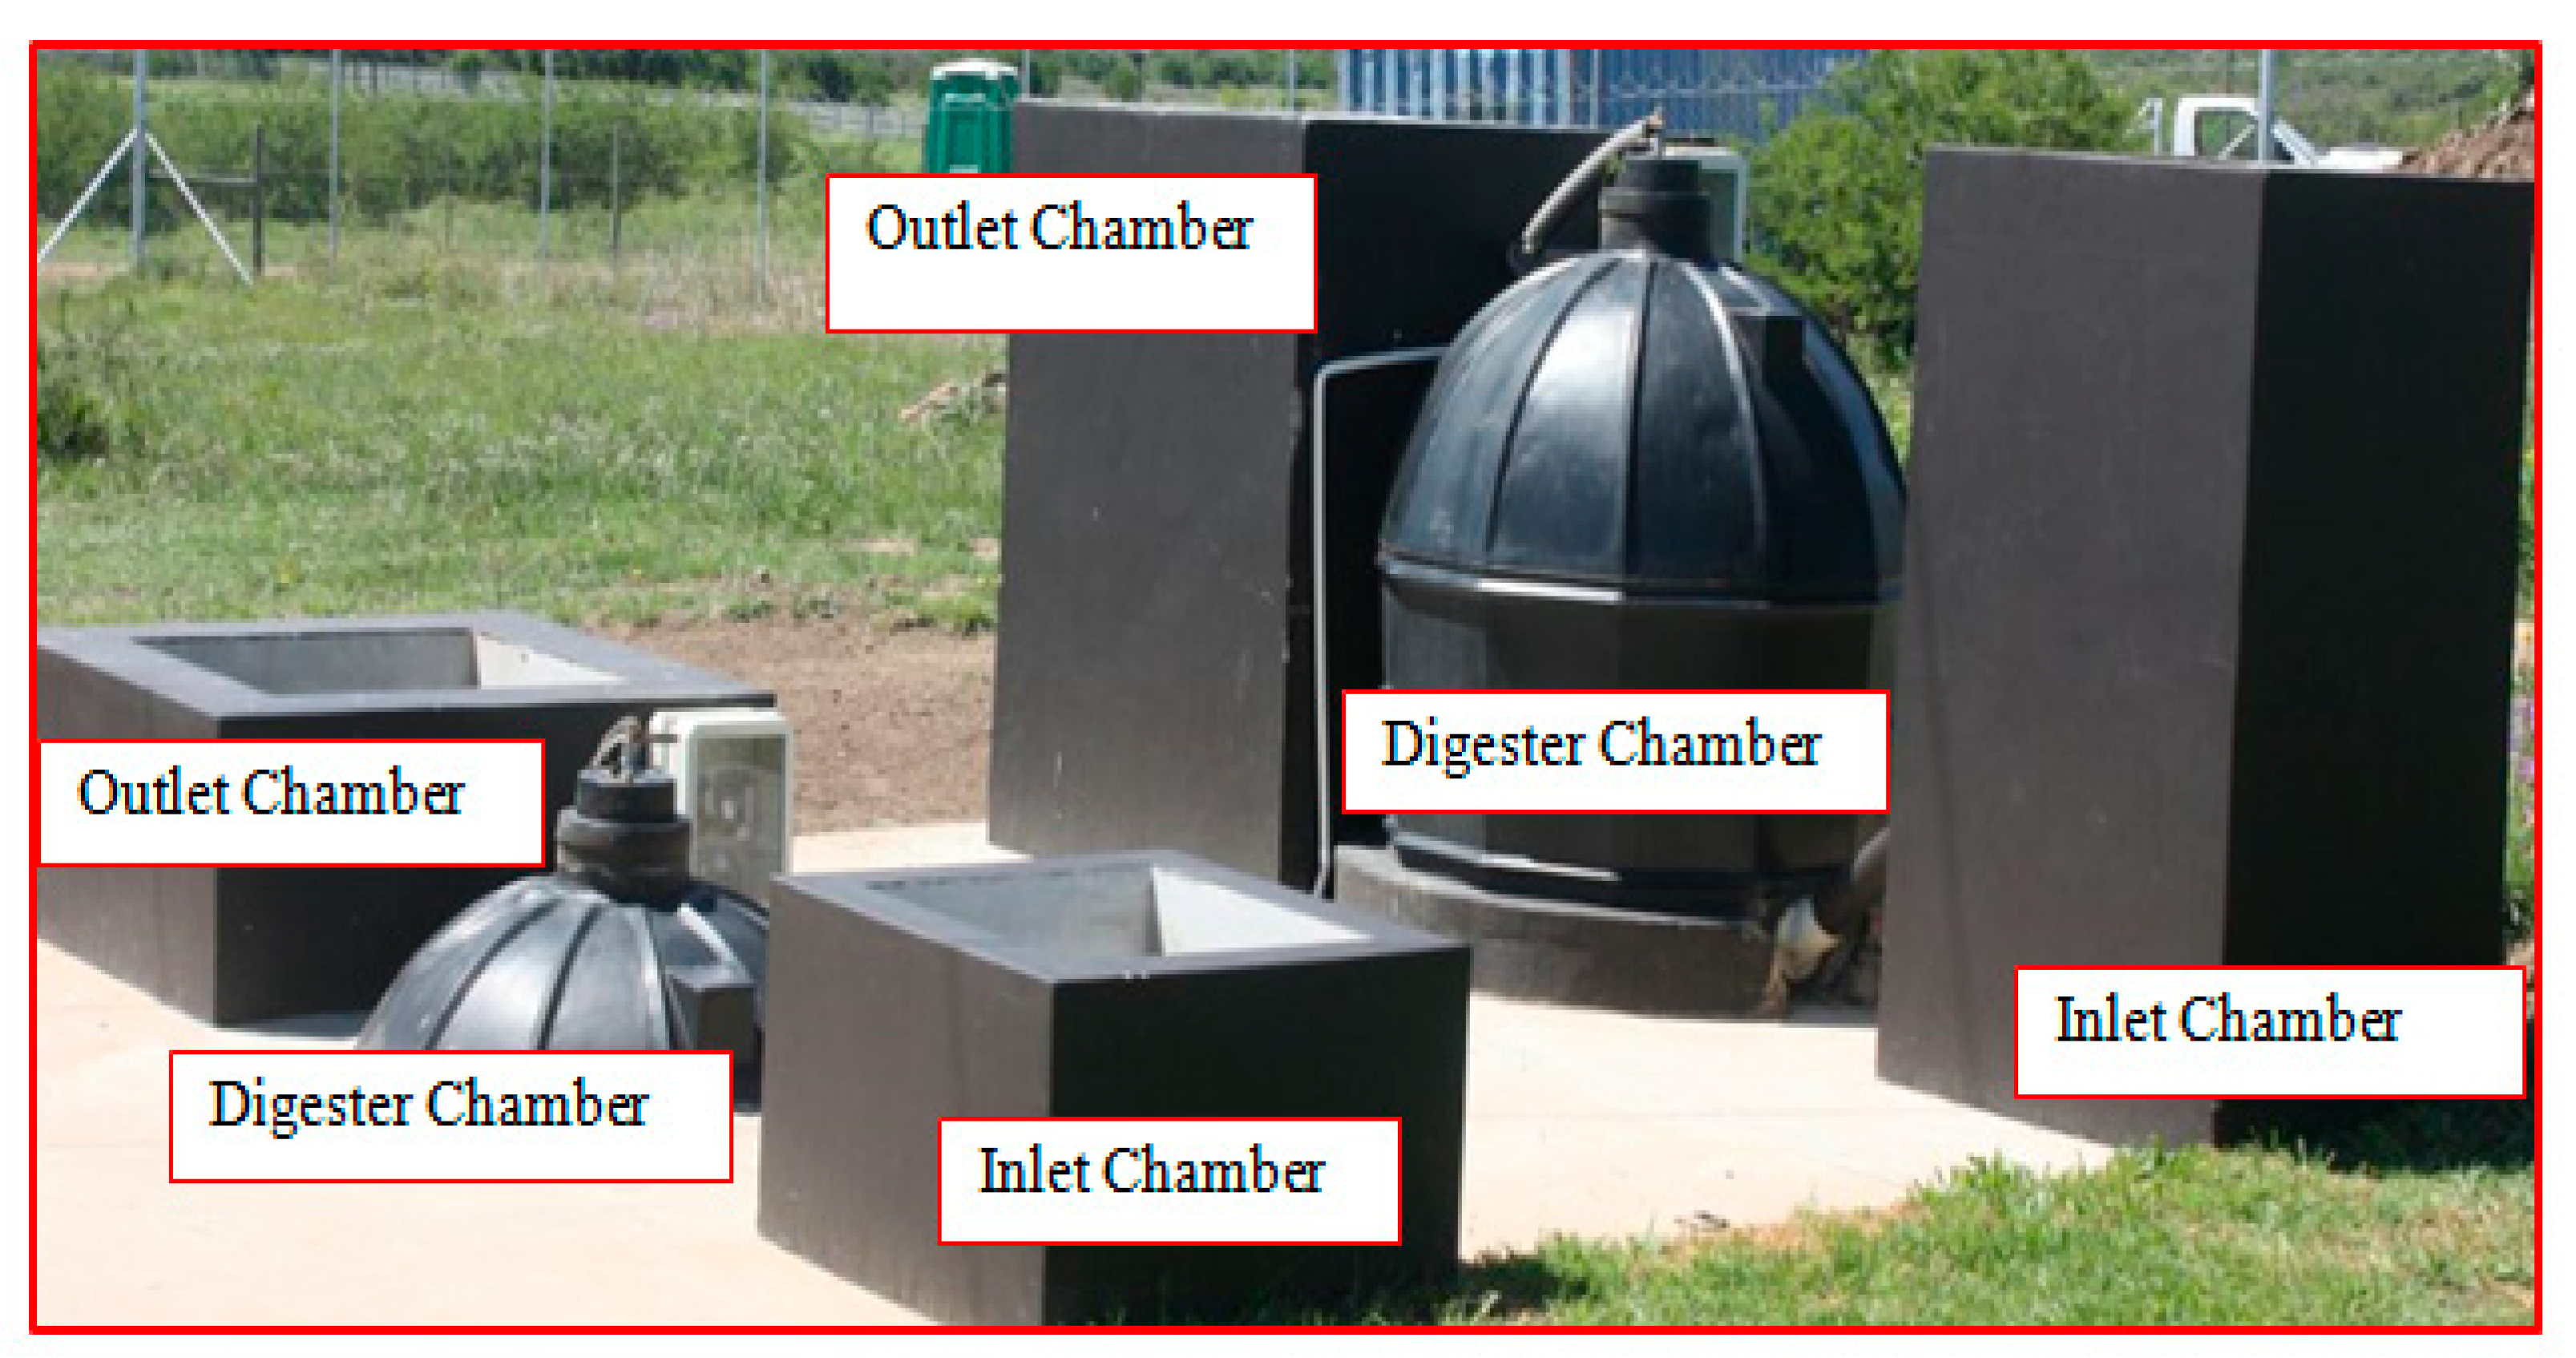
Figure 1. The biogas digester setup (The study focused on the underground digester system).
Processes 09 00643 g001
Figure 2. The gas–temperature–pressure monitoring system (GTPMS).
Processes 09 00643 g002
Figure 3. The data acquisition system (DAS); PSU—power supply unit.
Processes 09 00643 g003
Figure 4. Model 3D mesh and calculated sample methane yield with inputs.
Processes 09 00643 g004
Figure 5. Validation of derived model using test calculated dataset.
Processes 09 00643 g005
Table 1. Biogas production potential in South Africa in the year 2020 [21].
BiomassEstimated Energy ValueReferences
Cropped biomass1350 PJ[22]
Solid waste (Landfill areas)5000 GW/h[23]
Wastewater in municipal water plant9000 GW/h[24]
Farm/homesteads5–10 kW thermal energy[24]
Breweries50 kW to 5 MWth on industrial scale[24]
Silage wastes5–10 MWth[24]
Cow dung--
Table 2. Selected biogas reactor types and their respective volumes in South Africa.
ProvinceBiogas Reactor TypeVolume of Biogas Reactor (m3)Purpose of the EnergyReferences
Free StateFloating drum10Cooking[25,26]
Free StateBall-balloon6–12-[27]
Western CapeFloating drum11Cooking[25,26]
Western CapeFloating drum1Cooking[25,26]
Western CapeFloating drum6Cooking[25,26]
Eastern CapeFixed dome2.15Research[28]
Eastern CapeFixed dome1Research[29]
Table 3. Properties of fresh cow dung used in the study [28].
Properties of Cow DungMeasurement of Cow Dung UsedUncertainty ReportedActual ValuesTest Method Used
pH50 g±0.027.83 at 30 °CHydrogen-Electrode method
Total solids (TS)50 g±5.0 g/L130,800 g/LAPHA 2005 method
Volatile solids (VS)50 g±5.0 g/L110,476 g/LAPHA 2005 method
Chemical oxygen demand (COD)0.2 mL±2.0 g/L42,583 g/LCalorimetric method
Calorific value-±0.02 MJ/g27.00 MJ/gDirect method
(For the TS, VS and COD, actual values > 10,000 g/L).
Table 4. Data and equipment used for measurements.
Model ParameterRanges of Measured Data UsedEquipment Used
Methane0.03–0.24 m3NDIR methane sensor
Carbon dioxide0.1–0.15 m3NDIR carbon dioxide sensor
pH6.83–7.20pH digital meter
Slurry top temperature11–22 °CK-type thermocouple
Slurry bottom temperature10–35 °CK-type thermocouple
Gas temperature11–22 °CK-type thermocouple
Ambient temperature10–22 °CK-type thermocouple
Relative humidity53.5–90.4%Hygrometer
Global horizontal irradiance52–341 W/m2CMP pyrometer
NDIR—Non-dispersive infra-red.
Table 5. Methane model equation constants and determination coefficient of the biogas digester.
Lump Input ParameterConstant NameConstant SymbolConstant ValueDesired Output (mL/gVS)Determination Coefficient (r2)
Forcing constantA2.90 × 10−5CH4 volumer2 = 0.955
x = ( P H r + I r + R H r ) ( T g T a m ) ( T b + T t 2 ) Scaling constantB2.81 × 10−10
Y = e ( P H r + I r + R H r ) Scaling constantC6.70 × 10−6
Table 6. Comparative studies on the present model with previous models.
Type of Model Substrate Used Input Predictor Used Effect on Methane Production Determination of Coefficient (R2) Design Orientation References
Empirical model Cow dung pH, RH, I, and temperature (Tg, Ts and Tamb ) Increase in the input predictor corresponds to an increase in the volume of methane and decrease in the input predictor, resulting in a rise in the volume of methane produced 0.962 Large scale digester Present study
Non-linear
model
Organic waste Organic loading rate and volatile fatty acid Increase in the input parameters (organic matter and volatile fatty acid) corresponds to an increase in the volume of methane production - Pilot scale digester [16]
Mechanistic model Food/vegetable residues Slurry, carbohydrate, and protein concentration Methane production is significantly dependent on the input predictor - Pilot scale digester [18]
Empirical method Swine water Organic loading rate and temperature - 0.97–099 Pilot scale [10]
Mechanistic model Solid waste pH and volatile fatty acid Increase in the input parameters (organic matter and volatile fatty acid) corresponds to an increase in the volume of methane production - Pilot scale digester [1]
Table 7. Samples of inputs of calculated and predicted methane yield from test dataset.
ObservationsInput (x)Input (Y)Calculated CH4
(mL/gVS)
Predicted CH4
(mL/gVS)
121,8004.366.42 × 1056.43 × 105
651007.038.34 × 1057.75 × 105
1133306.968.13 × 1057.66 × 105
164296.697.70 × 1057.39 × 105
216256.347.76 × 1057.16 × 105
264515.837.91 × 1056.82 × 105
3189.726.577.87 × 1057.31 × 105
36560.996.928.35 × 1057.55 × 105
4059106.278.66 × 1057.27 × 105
Publisher’s Note: MDPI stays neutral with regard to jurisdictional claims in published maps and institutional affiliations.