Results and Discussion
Various configurations of the liquid flow fields for transporting the fuel and electrolyte and the gas flow fields for air distribution shown in
Table 5 were numerically investigated here.
Table 6 shows the channel width, channel depth and rib width of each flow field design. Note that the rib width between two adjacent channels, and the depth of both channel and rib are 0.8 mm and 1.0 mm, respectively, for each flow field.
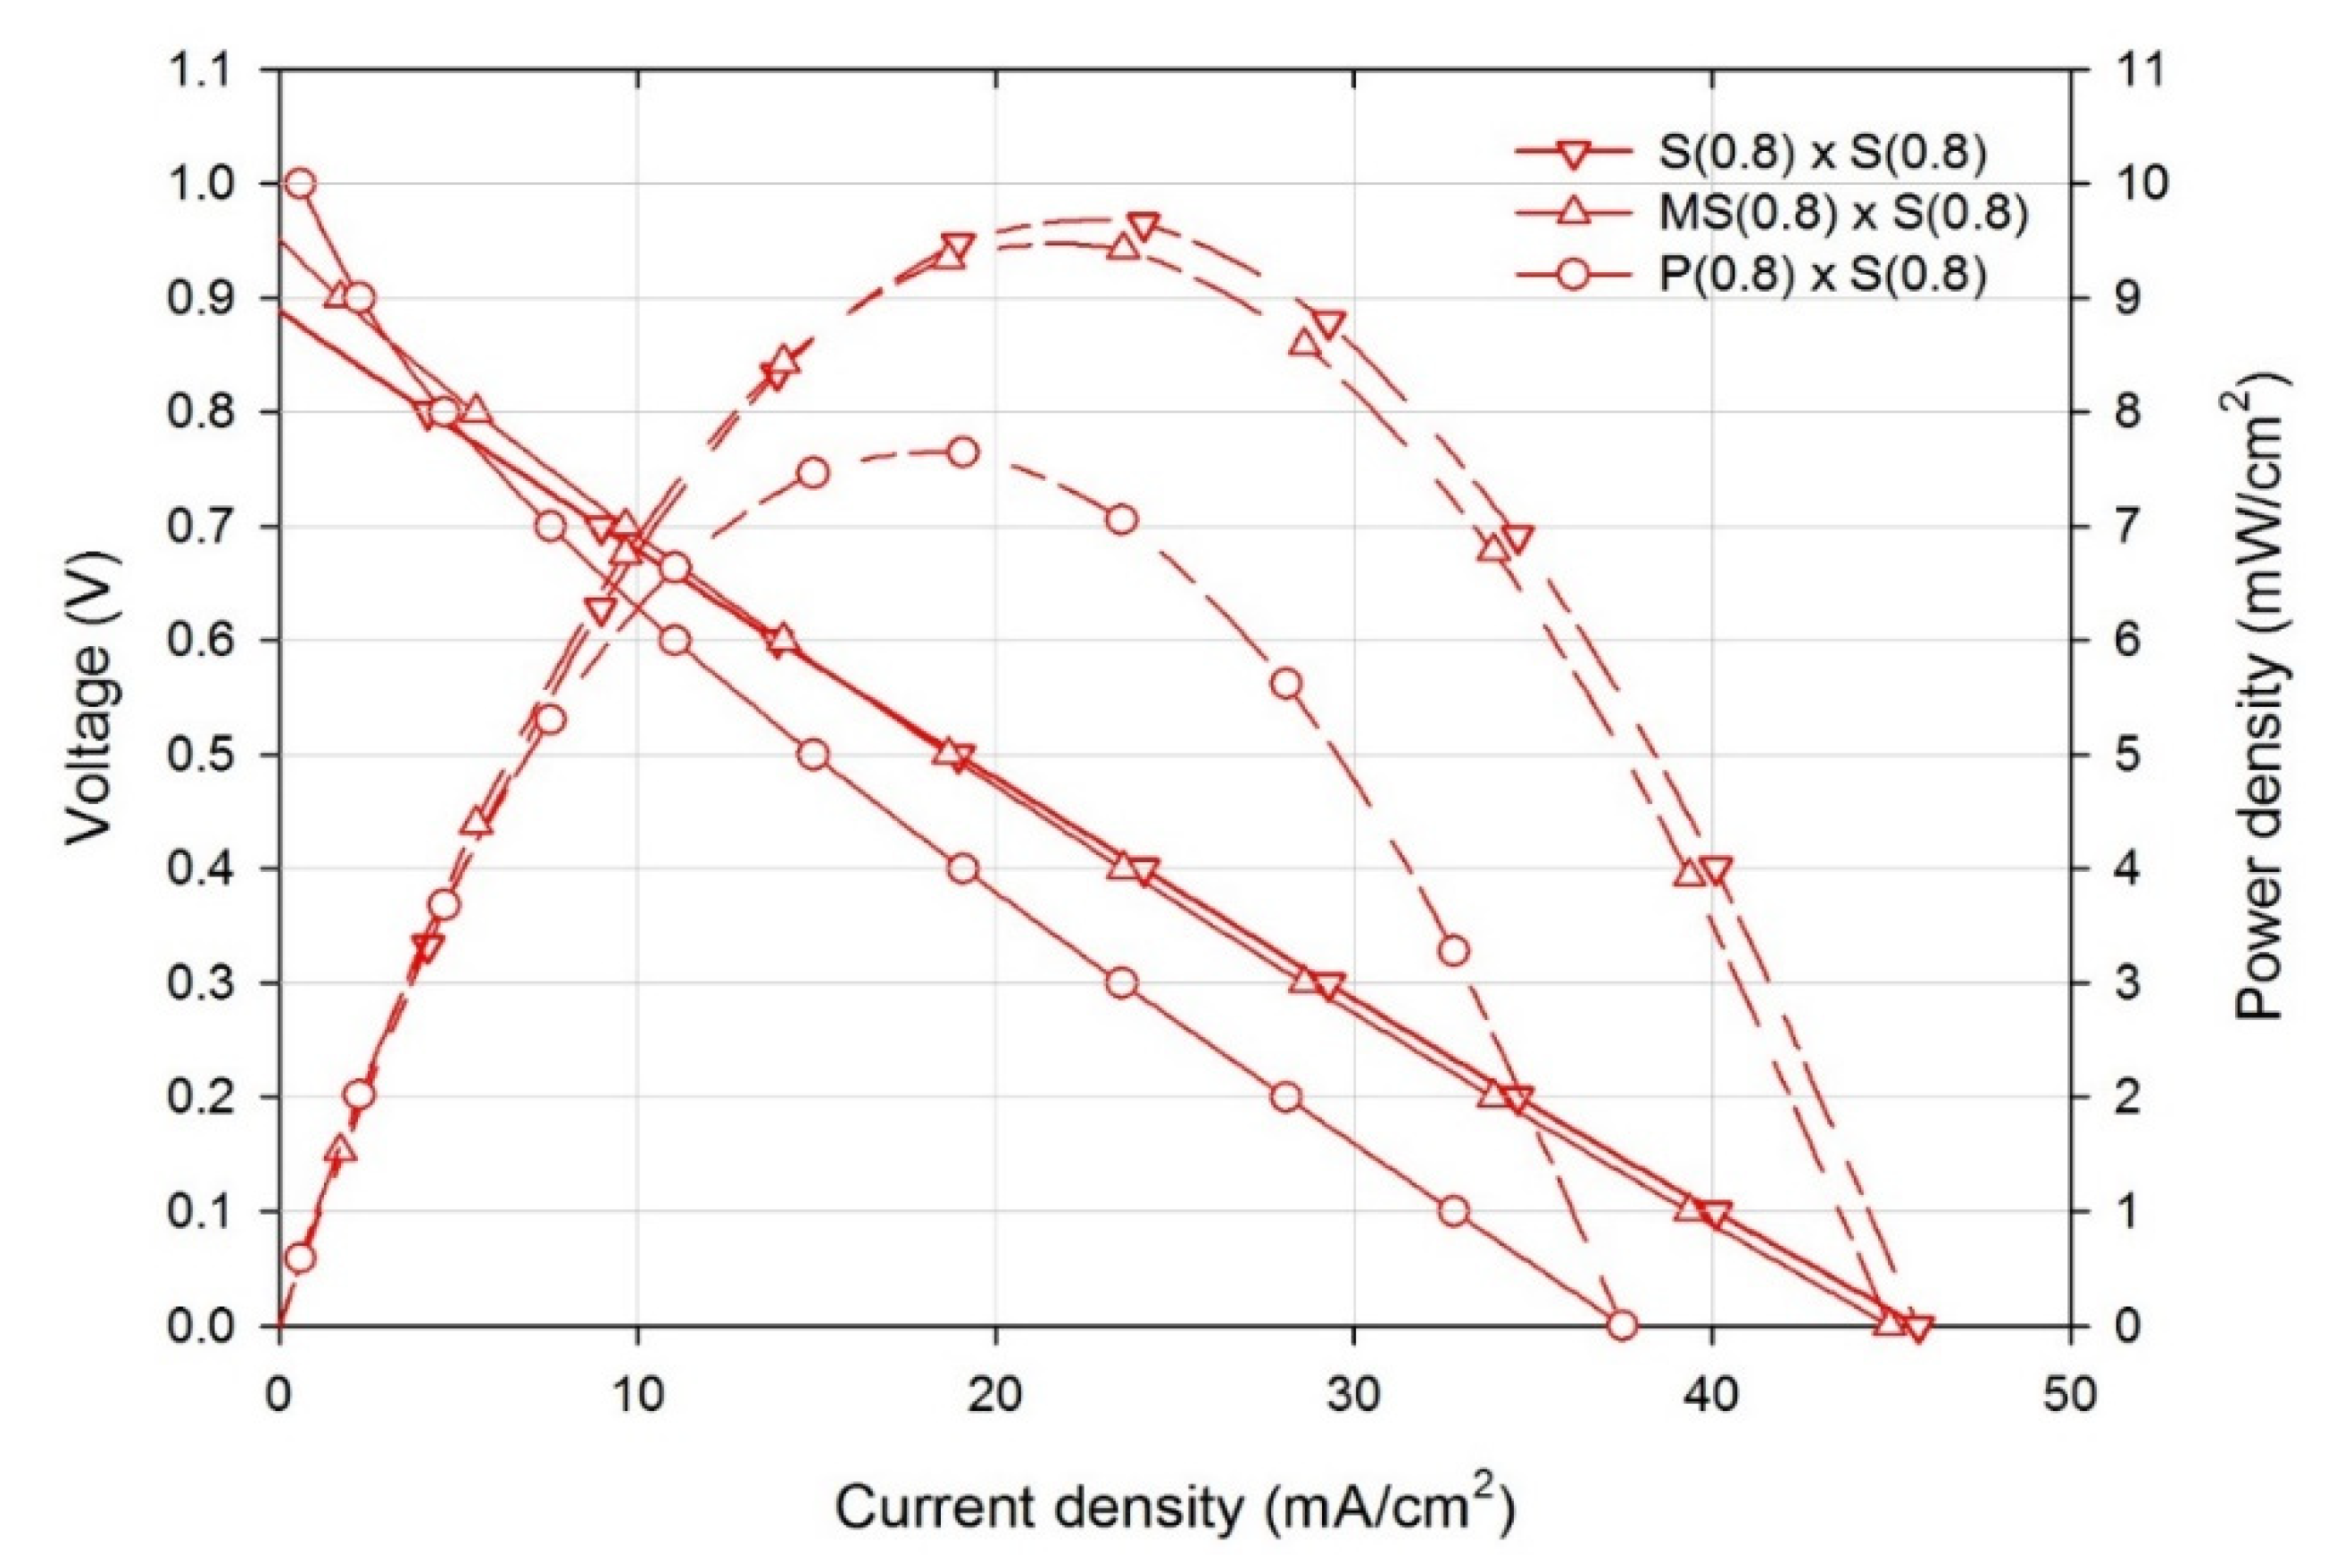
Figure 3 shows the
V-
I curves (solid ones) and
P-
I curves (dashed ones) of the air-breathing membraneless fuel cells having three different flow field configurations, including the 0.8-mm-wide serpentine flow field for both fuel and electrolyte, denoted as S(0.8) × S(0.8), the 0.8-mm-wide multiple serpentine fuel flow field and 0.8-mm-wide serpentine electrolyte flow field, denoted as MS(0.8) × S(0.8), and the 0.8-mm-wide parallel fuel flow field and 0.8-mm-wide serpentine electrolyte flow field, denoted as P(0.8) × S(0.8). It can be found in
Figure 3 that the air-breathing DFAMFC having P(0.8) fuel flow field reveals the highest open circuit voltage, while the fuel cell having S(0.8) fuel flow field shows the lowest open circuit voltage. However, in spite of the highest open circuit voltage of the fuel cell having P(0.8) fuel flow field, its maximum power density was the lowest among all because of the significant ohmic loss as shown in
Figure 3. In addition, it is observed in
Figure 3 that the DFAMFC having identical flow field for both fuel and electrolyte has highest maximum power density.
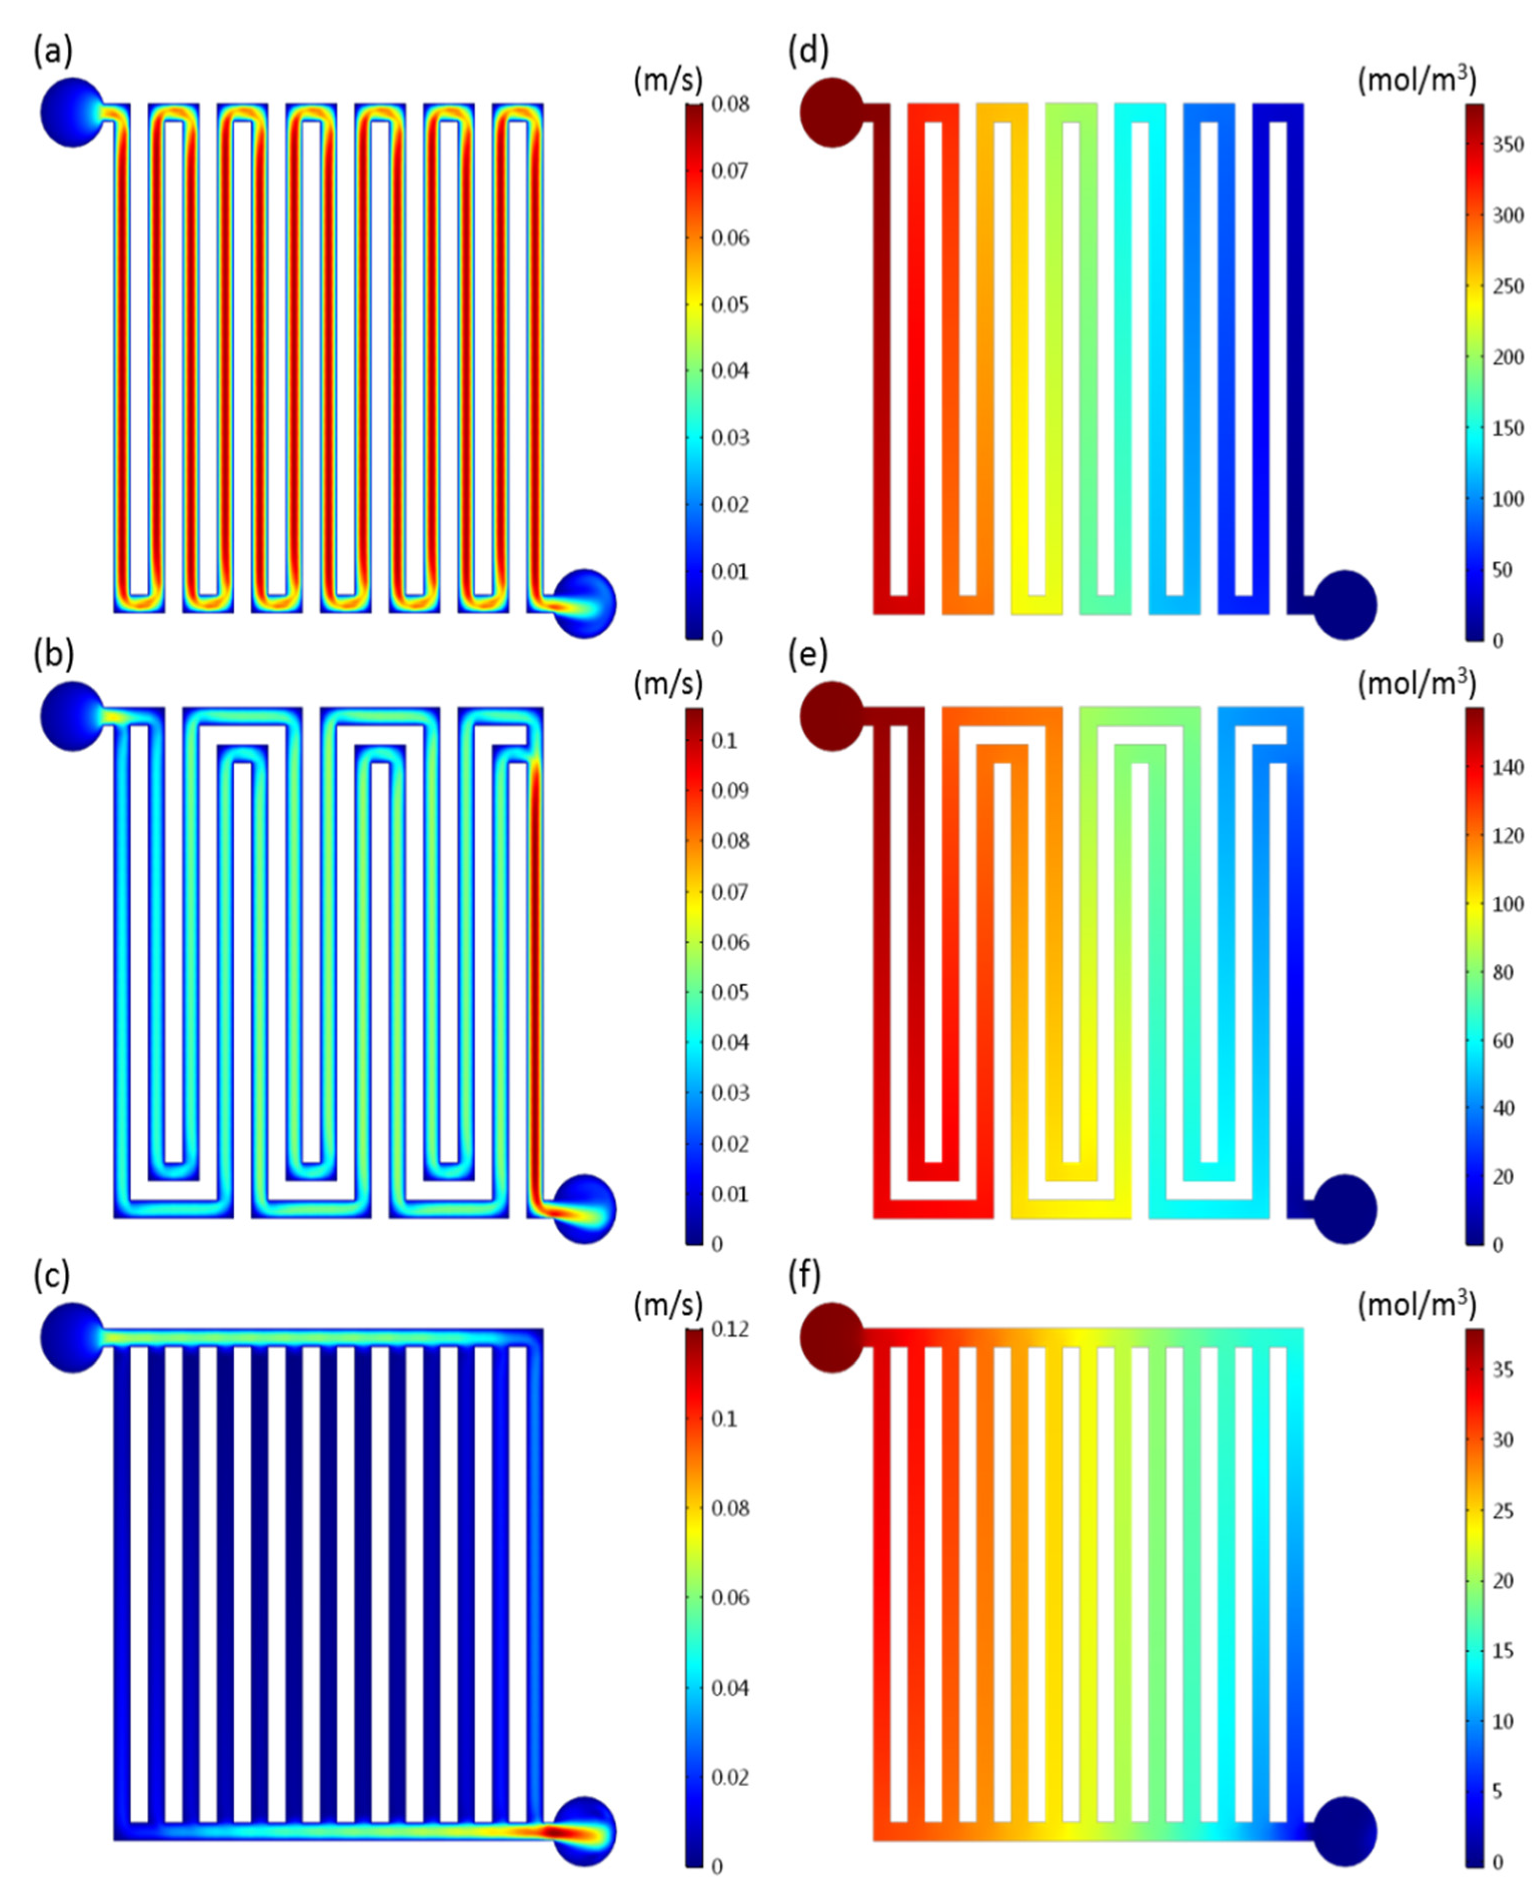
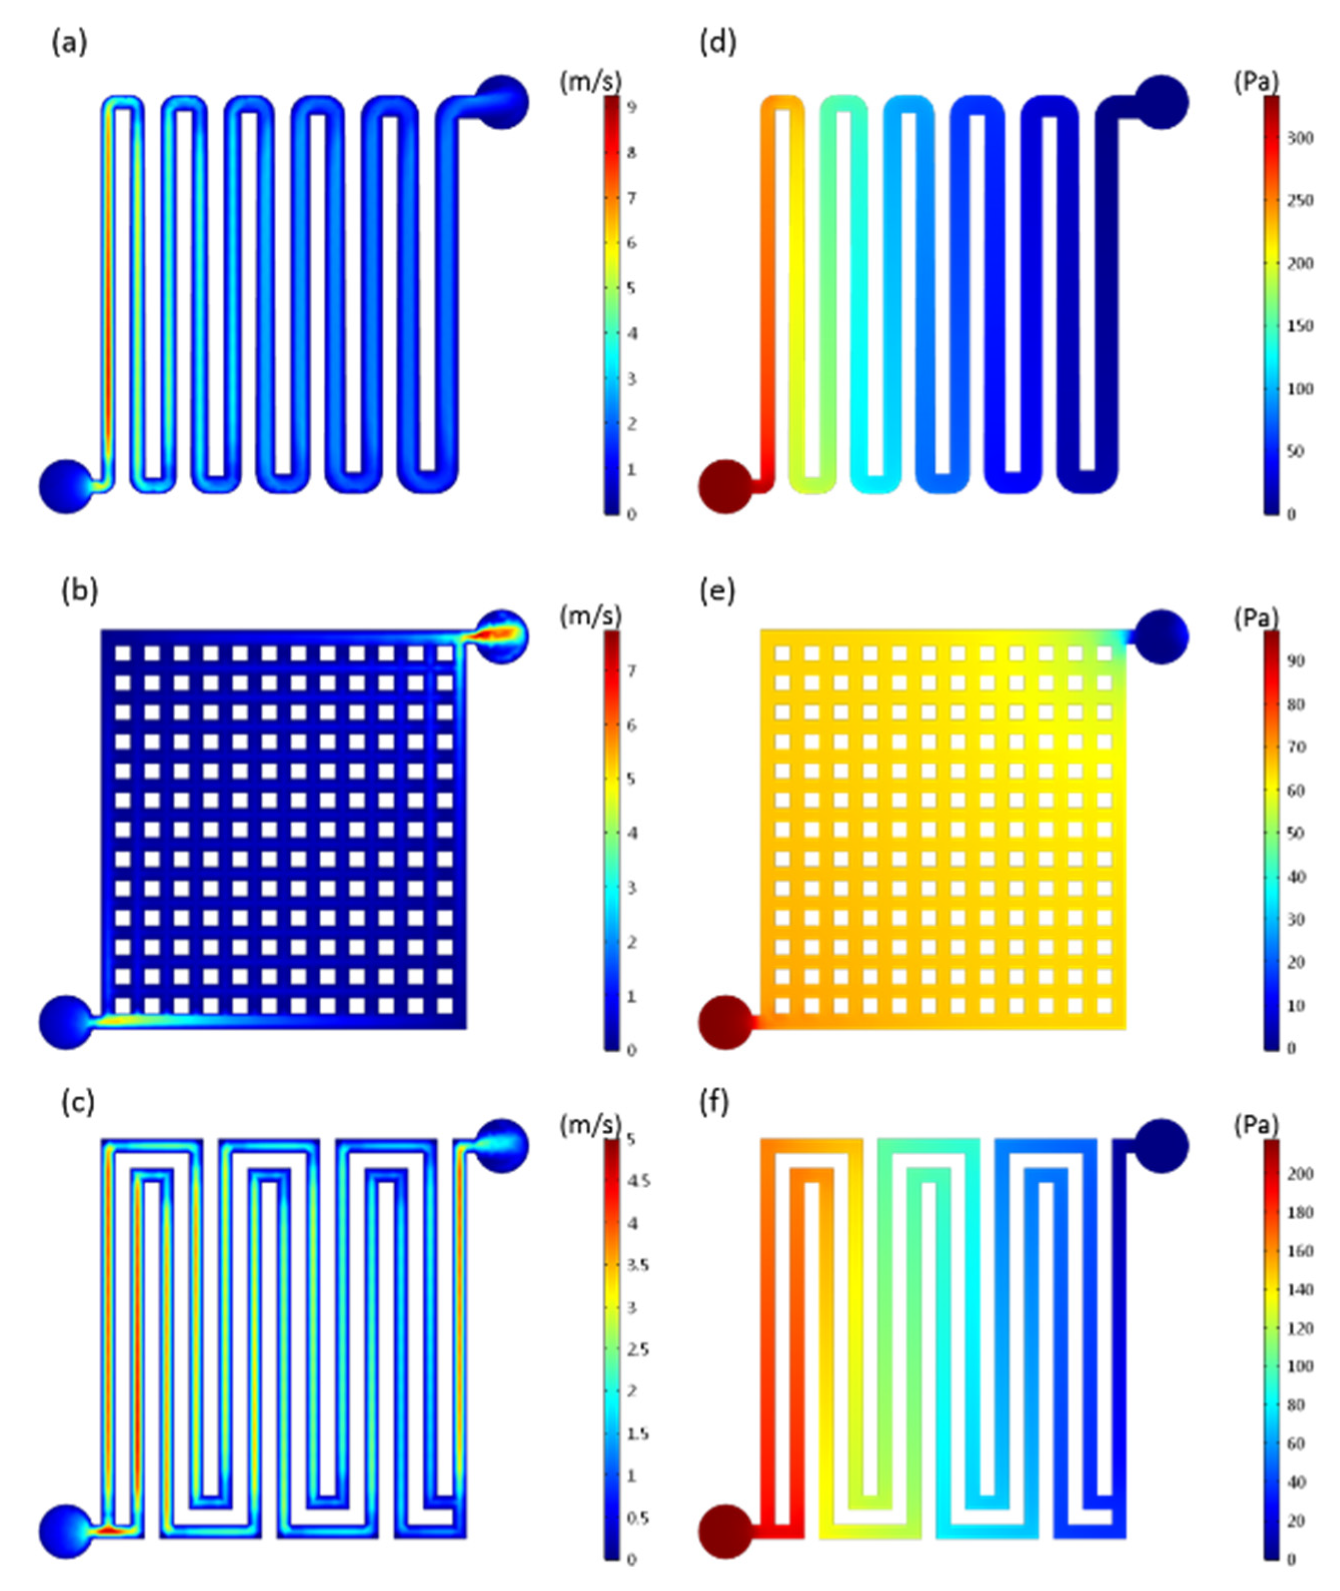
Figure 4a–c show the velocity distribution along S(0.8), MS(0.8) and P(0.8) fuel channels, respectively, while
Figure 4d–f show the pressure distribution along S(0.8), MS(0.8) and P(0.8) fuel channels, respectively, in the air-breathing membraneless fuel cells. It can be found that the fuel velocity in S(0.8) flow field in
Figure 4a is not only significantly higher than that in both MS(0.8) and P(0.8) flow fields, but also more uniform along the entire channel, resulting in a highest pressure drop between the inlet and the outlet of fuel as shown in
Figure 4d. Besides, the fuel stream of extremely low velocity is observed in the parallel channel of P(0.8) flow field in
Figure 4c.
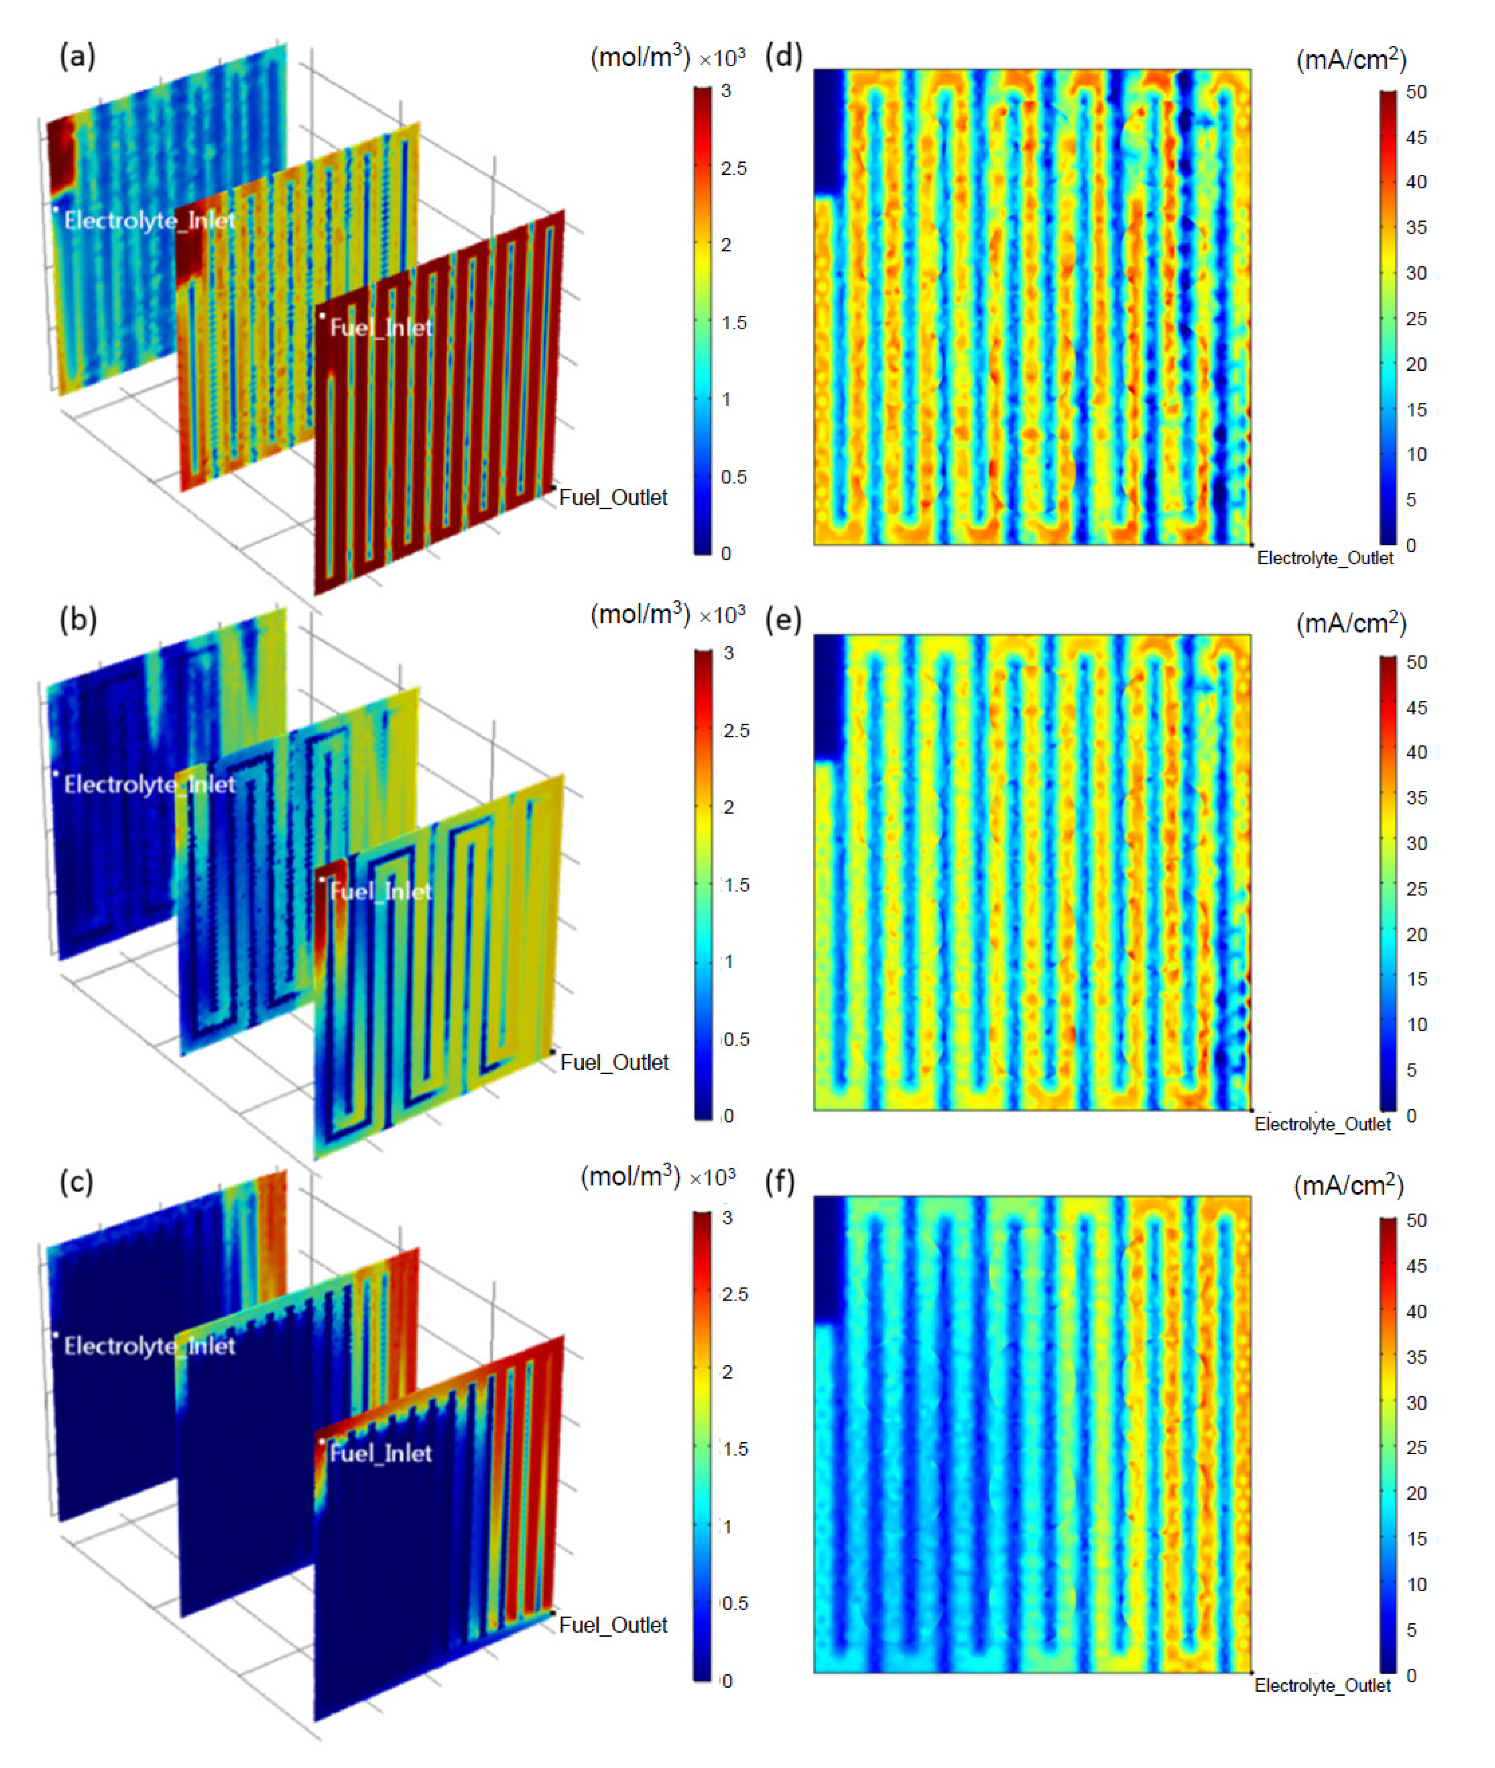
Figure 5a–c show the formic acid concentration distribution on three different sections within the anode catalyst layer, while
Figure 5d–f show the local current distribution on the top surface of cathode gas diffusion layer, of the membraneless fuel cells possessing different types of fuel flow field and S(0.8) electrolyte flow field at 0.4 V. The front-most section in
Figure 5 is the top surface of the anode catalyst layer which contacts the fuel flow field, while the backmost section is the bottom surface of the anode catalyst layer which attaches to the gas diffusion layer. It can be seen in
Figure 5a that the uniformity of the formic acid concentration distribution on the top surface of the anode catalyst layer is the best in S(0.8) fuel flow field in
Figure 5a, followed by MS(0.8) fuel flow field in
Figure 5b, and is the worst in P(0.8) fuel flow field in
Figure 5c.
Figure 6 shows the
V-
I and
P-
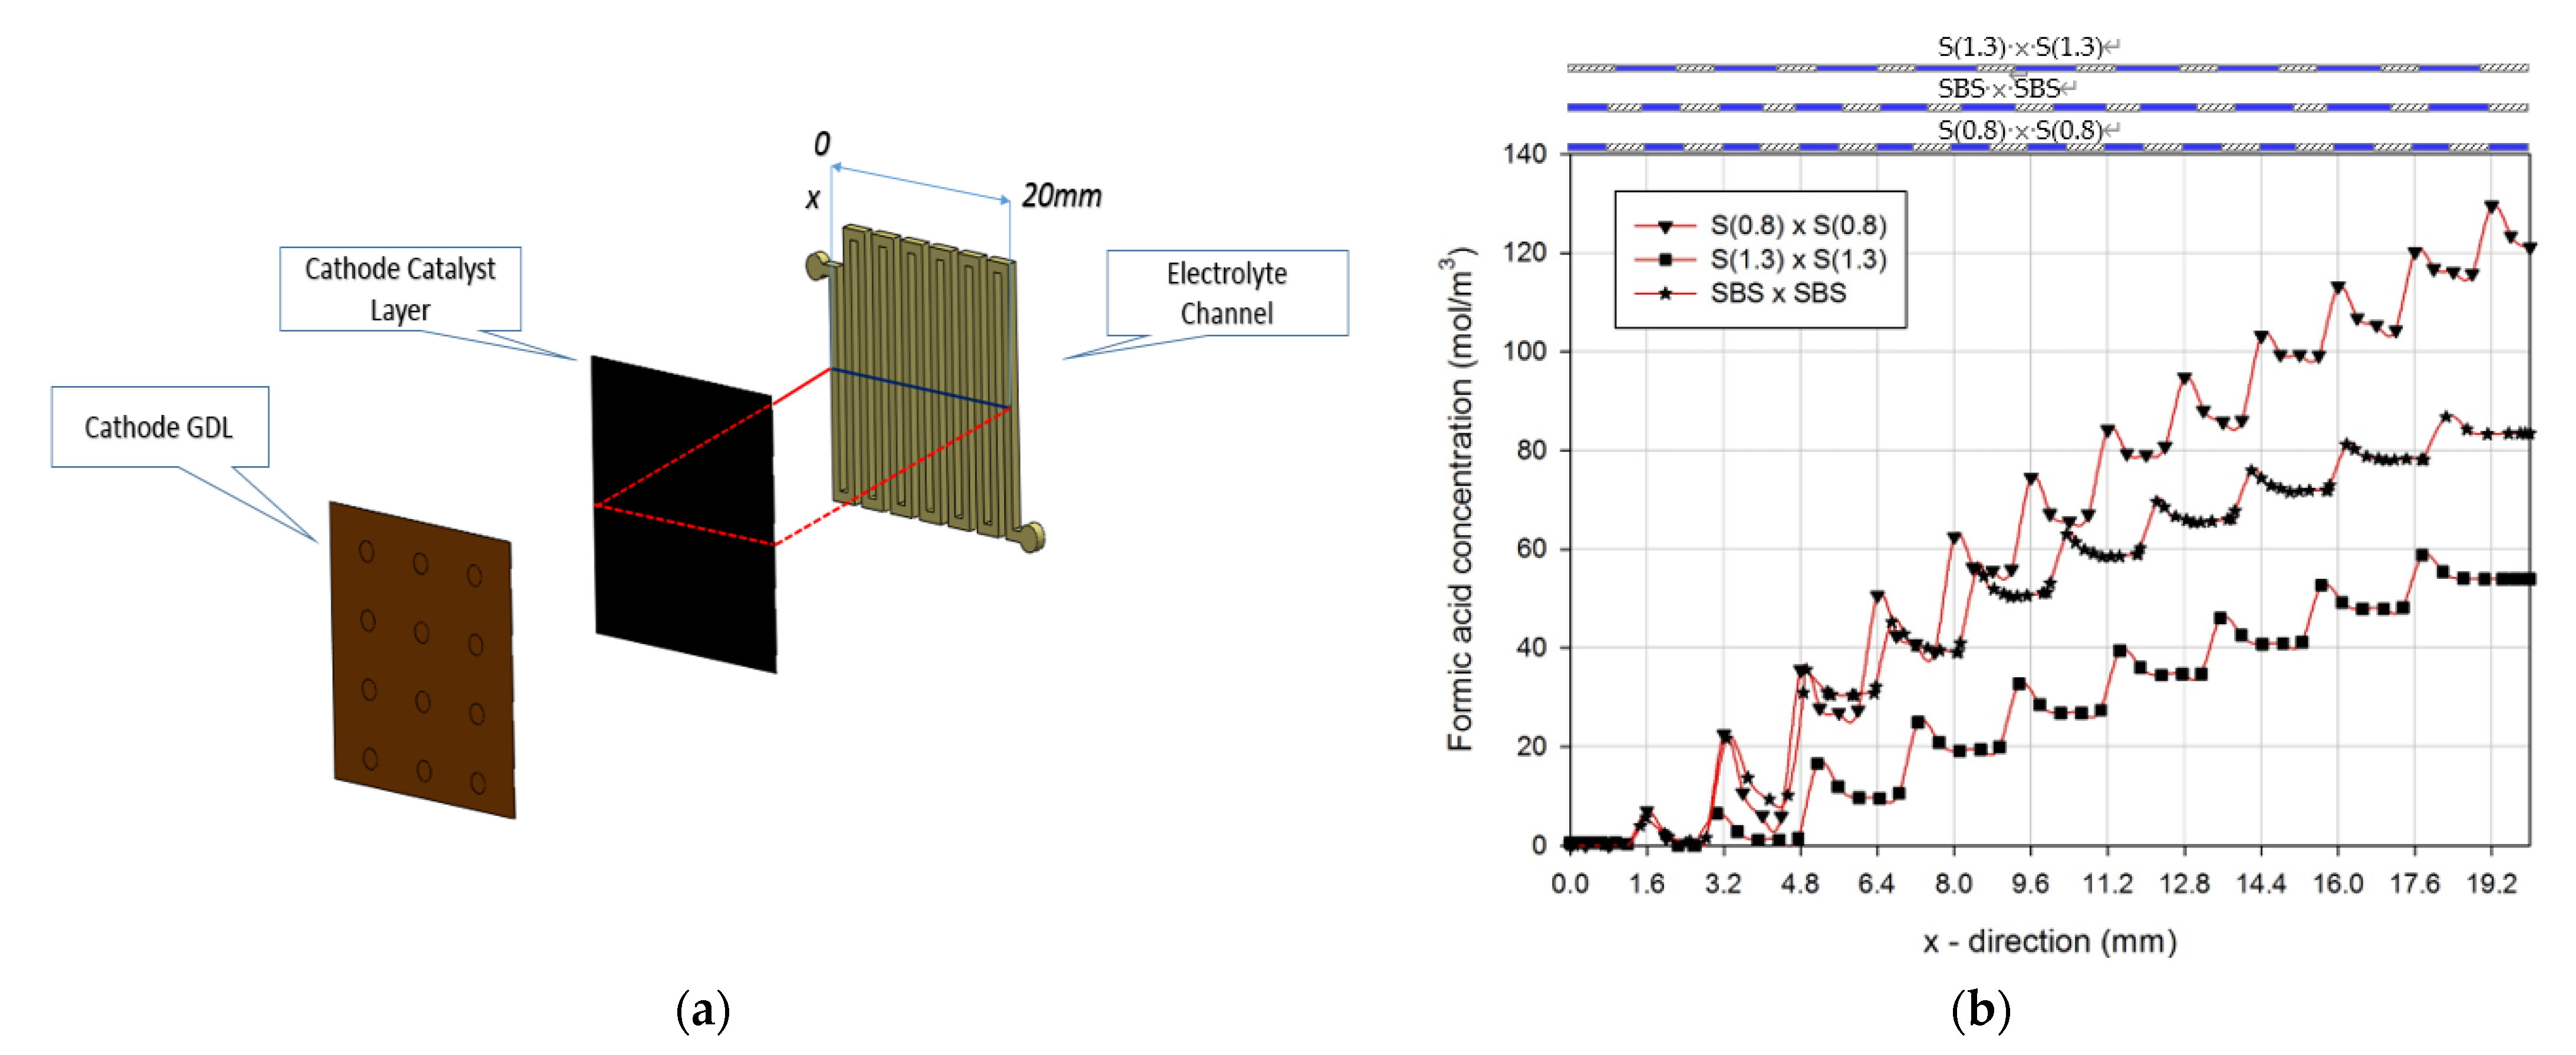
I curves of the air-breathing membraneless fuel cells (DFAMFC) possessing various fuel and electrolyte flow field combinations. It shows that air-breathing DFMFC possessing S(1.3) fluid flow field yields the highest open circuit voltage among all, 1.0 V, which is approximately 0.1 V higher than that of the DFMFC possessing S(0.8) fluid flow field. In order to quantitatively indicate the measure of the fuel crossover, the formic acid concentration distribution along the centerline of the contact plane as schematically shown in
Figure 7a between the cathode catalyst layer and the electrolyte flow field is plotted in
Figure 7b. Due to the lack of the polymer membrane between two GDEs, the formic acid indeed invades the cathode catalyst layer, and the formic acid concentration becomes increased from the first channel to the lower reach for each fluid flow field combination as revealed in
Figure 7b. Each peak of those curves in
Figure 7b corresponds to the boundary of the fluid channel. Note that the illustrations above
Figure 7b denote the position of the fluid channel depicted as blue region and the rib marked with slashes for the three fuel and electrolyte flow field combinations along the centerline in
Figure 7a. As observed in
Figure 5, as the channel width of the flow field is increased, the pressure established in the flow field reduces at a given flow rate, resulting in less driving force of the fuel crossover to the cathode catalyst layer and higher open circuit voltage. Therefore, as SBS flow field was employed, whose channel width is stepwise broadened from 0.8 mm to 1.3 mm, the formic acid concentration in
Figure 7b is second highest, corresponding to second highest open circuit voltage in
Figure 6.
As the upstream channel width of SBS fluid flow field is narrower than that of S(1.3) flow field, the pressure of the fuel flow in SBS is higher than that in S(1.3), causing a favorable condition for formic acid to penetrate into the anode catalyst layer. In addition to the slight fuel crossover of the DFAMFC possessing SBS fluid flow field, the air-breathing DFAMFC possessing SBS fluid flow field generates highest peak power density in
Figure 6.
Following the optimal fluid flow field configuration presented in
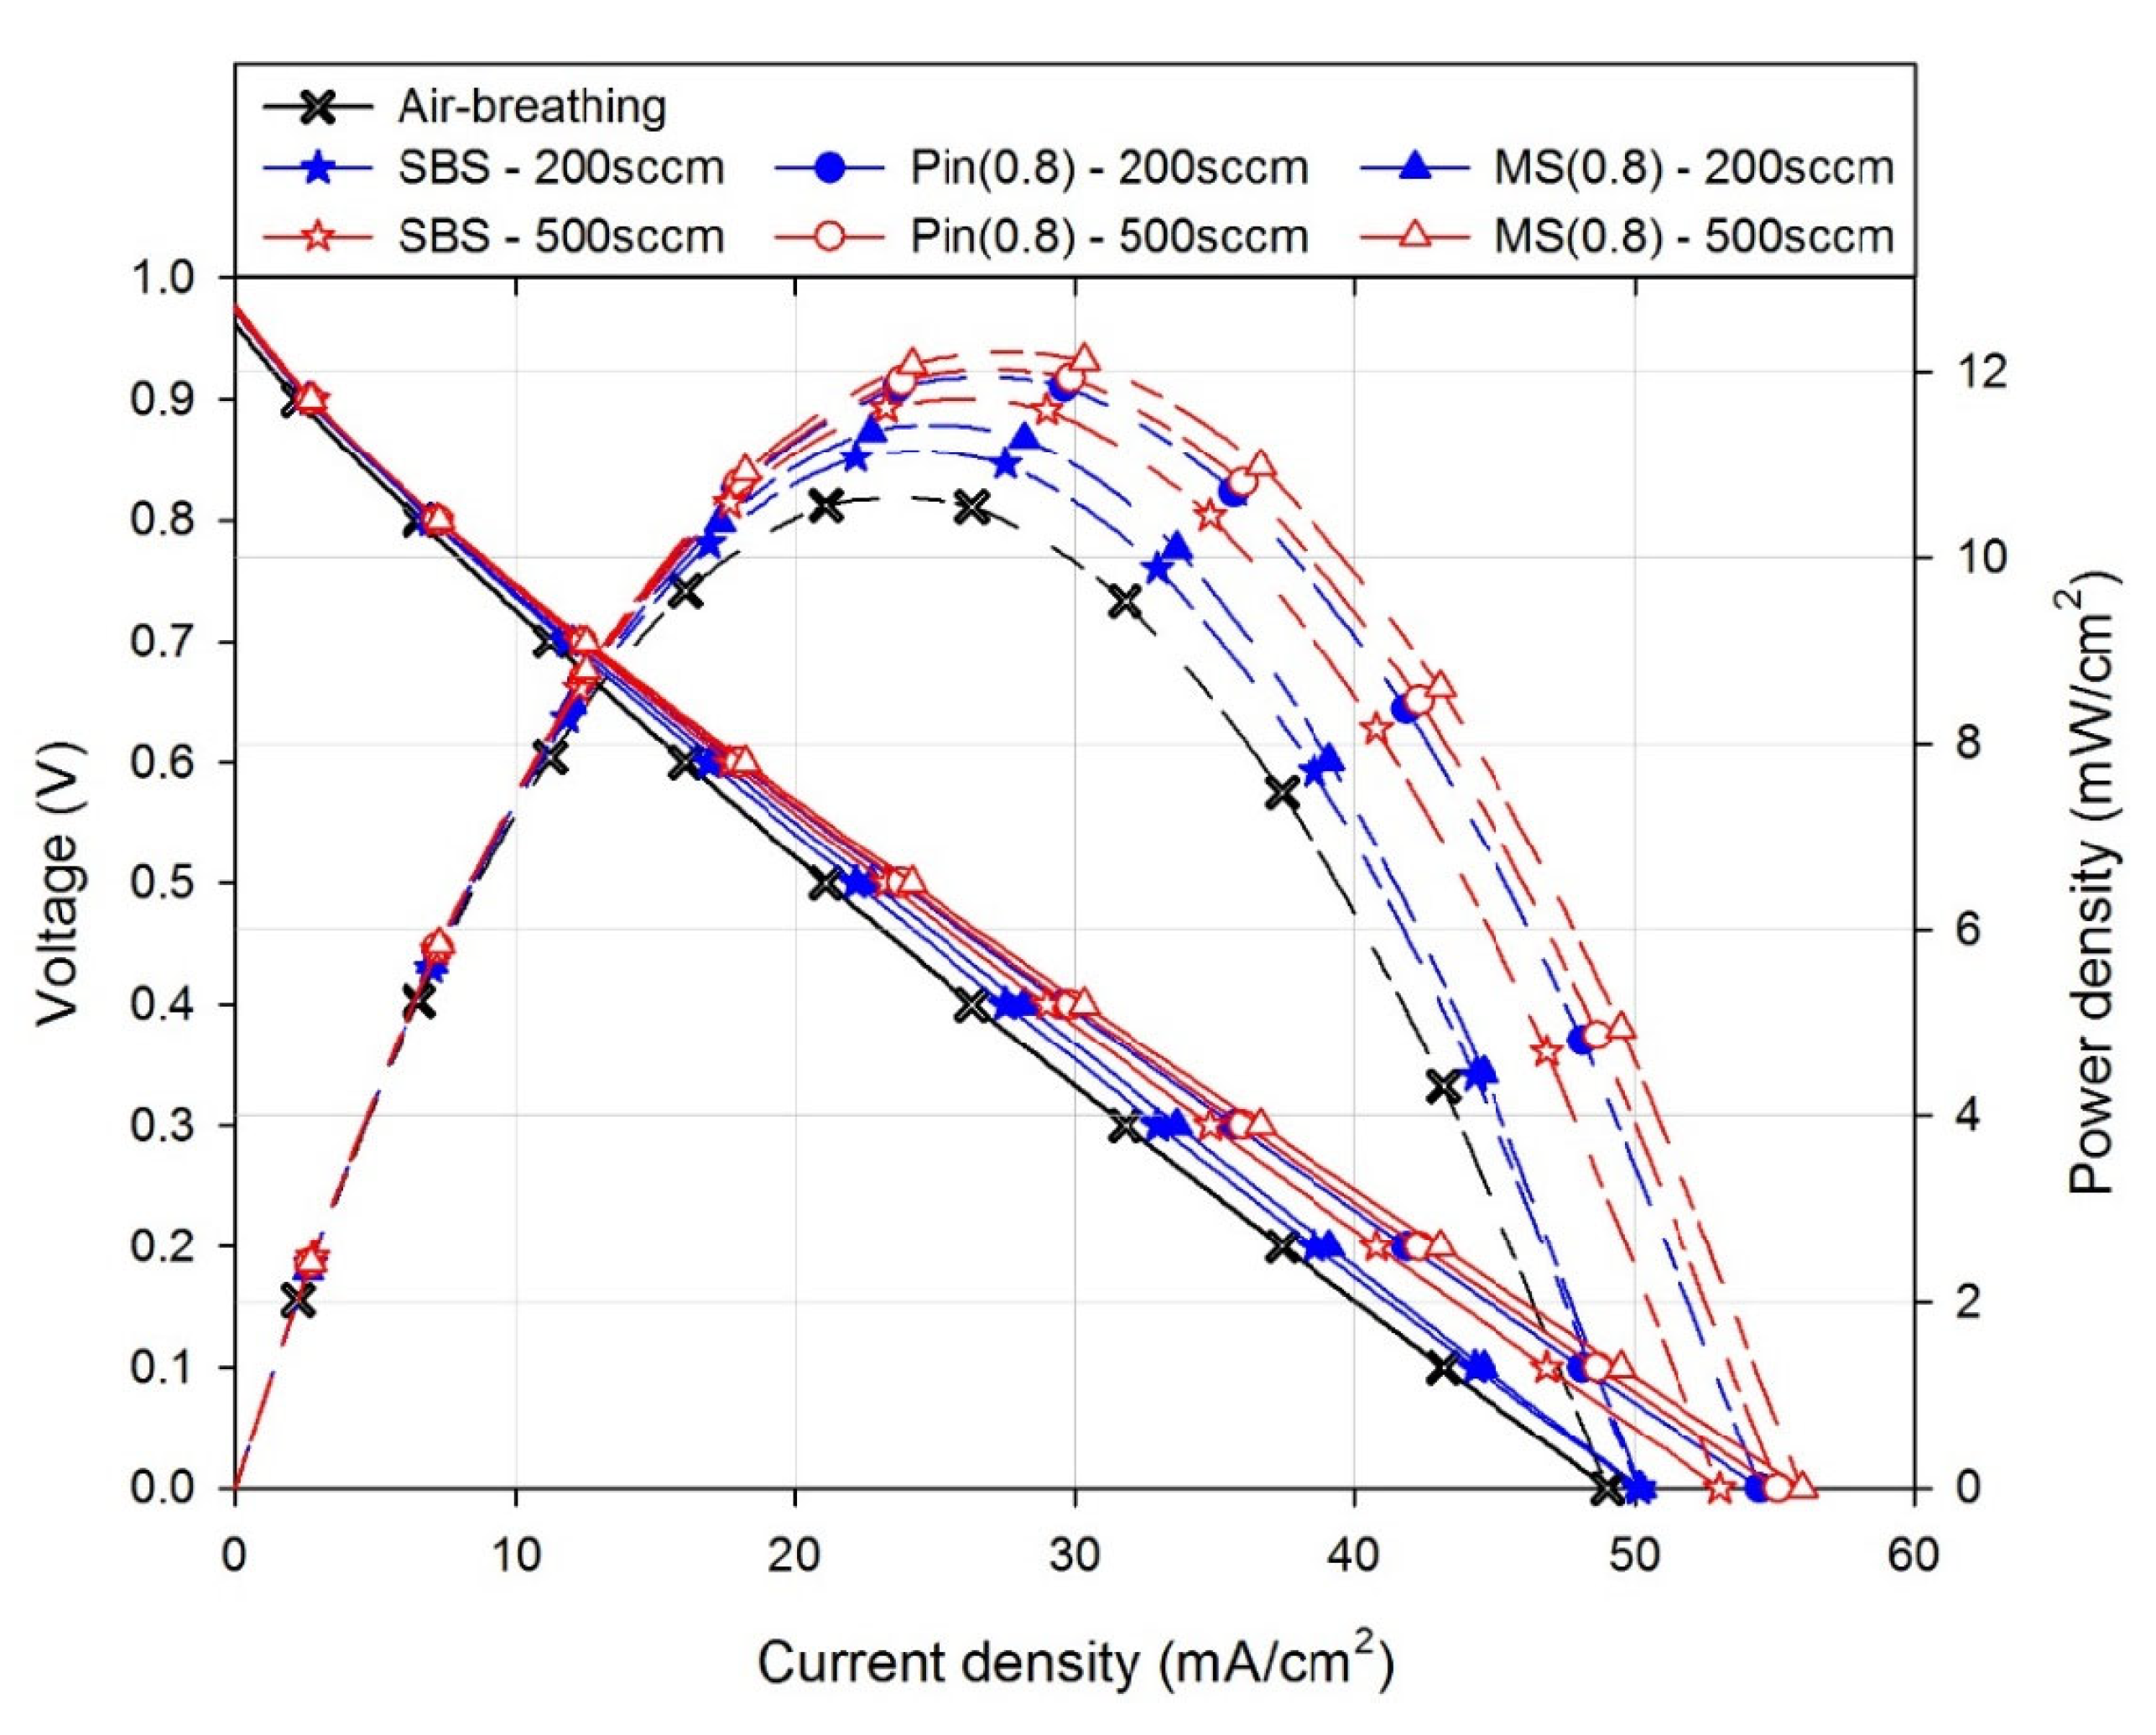
Figure 6, the numerical simulation was further performed for air-feeding DFAMFCs with SBS flow field for both fuel and electrolyte incorporating various air flow fields at airflow rates of 200 sccm and 500 sccm to investigate the fuel cell performance. Firstly, both
V-
I and
P-
I curves of the air-feeding DFAMFCs with various air flow fields were plotted in
Figure 8 along with the
V-
I and
P-
I curves of the air-breathing DFAMFC for comparison. It can be observed in
Figure 8 that, compared with the performance of the air-breathing DFAMFC, the maximum power density was enhanced whatever air flow field was employed. The fairly high pressure established in the air flow field as shown in
Figure 9d–f might possibly not only resist the fuel invasion to the cathode catalyst layer, but also cause the liquid electrolyte to diffuse in a more uniform way within the GDEs because of the counterpart in pressure distribution on both sides of the electrolyte flow field. Therefore, the air-feeding DFAMFCs yielded higher open circuit voltage and lower ohmic overpotential than the air-breathing one. In addition, the effective supply of oxygen to the cathode of the DFAMFCs is responsible for the higher maximum current density. Besides, the slight effect of the airflow rate on the performance of the DFAMFCs having pin type air flow field can be observed in
Figure 8. The DFAMFC having MS(0.8) air flow field fed at an airflow rate of 500 sccm yielded the highest peak power density than other cells in
Figure 8, 12 mW/cm
2, while the air-breathing one produced the peak power density of 10.5 mW/cm
2.
In order to exhibit the air flow field effect on the performance of the air-feeding DFAMFCs, the oxygen concentration distribution within the cathode catalyst layer with air various flow fields, including SBS, Pin(0.8), and MS(0.8), at 0.4 V with airflow rates of 200 sccm and 500 sccm is plotted in
Figure 10. It can be seen in
Figure 10 that as the airflow rate was increased, the oxygen concentration within the catalyst layer of each DFAMFC become high. This phenomenon is especially obvious on the plane of the catalyst layer in contact with the electrolyte flow field of the DFAMFCs. However, even though the airflow rate is increased, both oxygen and electrolyte seems to maintain uniform distribution within the entire cathode catalyst layer of the DFAMFC having Pin(0.8) air flow field, which could be one of the possible reasons causing the slight increase in the peak power density of the DFAMFC having Pin(0.8) air flow field as observed in
Figure 8.
Since an air pump has to be used to deliver the specific airflow rate in the air flow field for an air-feeding DFAMFC, the air pump consumes additional power. The power consumption of the air pump,
Wp,air, can be estimated using the following equation,
where
(Pa) is the air pressure drop between the inlet and outlet of the air flow field,
Qa (m
3/s) is the volumetric flow rate of the air, and
AR (cm
2) is the electrode surface area. In order to evaluate the performance of the DFAMFCs having different air flow field designs in terms of the net power output, the net power density output of the air-feeding DFAMFCs is shown in
Figure 11. The net power density output is defined as the difference between the power density produced by the air-feeding DFAMFCs and the power consumption of the air pump as follows,
Note that the maximum net power density produced by the air-breathing DFAMFC was 10.5 mW/cm
2 as shown in
Figure 8. It can be seen in
Figure 11 that the DFAMFC having Pin(0.8) air flow field produced highest net power density at both airflow rates because of its lowest pressure drop between inlet and outlet of the air flow field than the other two DFAMFCs having SBS and MS(0.8) air flow fields.


