Article

Simulation of Shear-Thickening Liquid Transfer between U-Shaped Cell and Flat Plate

Co-Innovation Center of Efficient Processing and Utilization of Forest Resources, Nanjing Forestry University, Nanjing 210037, China
*
Author to whom correspondence should be addressed.
Ling Dong and Jiefang Xing contributed equally to this work and should be considered first authors.
Processes 2021, 9(5), 838; https://doi.org/10.3390/pr9050838
Submission received: 13 April 2021 / Revised: 26 April 2021 / Accepted: 28 April 2021 / Published: 11 May 2021
(This article belongs to the Section AI-Enabled Process Engineering)

Abstract

:
Based on the actual measurement of the shear-thickening properties of water-based inks, in order to improve the ink transfer rate, the PLIC (Piecewise Linear Interface Construction) interface tracking method and the VOF (Volume of Fluid) method are used to simulate the transfer process of the shear-thickening liquid between the U-shaped cell and the upwardly moving plate. The effects of substrate surface wettability, cell contact angle, and cell depth on liquid transfer were studied. The results showed that all can increase the liquid transfer rate, and the change of the cell contact angle also led to the difference in the breaking time of the liquid filament. In addition, the shallow plate effect was discovered in the study of cell depth. The shallow plate effect is a phenomenon by which the amount of liquid transferred and the liquid transfer rate are greatly improved when the depth of the cell decreases to a certain limit value. In addition, for the U-shaped cell, the optimization method combining the shallow printing plate effect and fillet can greatly improve the liquid transfer rate and solve the undesirable problems such as plate blocking. After optimization, a liquid transfer rate of about 85% can be achieved.

1. Introduction

In recent years, water-based ink has been used in gravure printing as an environmentally friendly material [1]. Water-based ink uses water as a solvent, which greatly reduces the emission of VOC (volatile organic compounds) [2,3,4]. Especially in the field of food and drug packaging, water-based ink gravure printing has broad application prospects [5,6]. Gravure printing is a direct printing method, in which the ink is in direct contact with the substrate [7,8]. The principle of the gravure printing process is shown in Figure 1. The engraved roller with cells is partially immersed in the ink tank. With the rotation of the engraved roller, the blade scrapes off the ink in the blank part. Then, under the combined action of the engraved roller and the impression roller, the ink in the cell is transferred to the substrate [9,10,11].
The inks used in printing are usually non-Newtonian fluids [12], which mainly include shear-thickening liquids and shear-thinning liquids [13]. By simulating the transfer of Newtonian fluid between plates, we found inertia driving fluid toward the surface with the higher contact angle and wettability driving fluid toward the surface with the lower contact angle. Additionally, when the capillary number is fixed, the amount of liquid transferred increases as the contact angle of the upper plate increases [14]. For the transfer of shear-thinning fluid between plates, the capillary number is the main influencing factor [15]. The effect of the velocity on the ink transfer ratio to the upper plate is more significant when the capillary number is greater than 1. When the capillary number is less than 1, the surface tension effect has a significant influence on the ink transfer. For shear-thickening liquids, Sunilkumar Khandavalli et al. investigated the impact of shear-thickening on the liquid transfer from an idealized gravure cell by a combination of experiments and numerical computations [16]. It mainly measured the effect of speed change on the ink transfer rate to avoid certain states in the viscosity function that are not conducive to ink transfer. Liquids with different rheological properties have a significant impact on the transfer process and transfer results. In the research of gravure printing liquid process, an accurate description of liquid properties is an important condition to ensure the accuracy of simulation.
In gravure printing, many factors such as cell shape, material parameters, printing process, and printing environment will affect the liquid transported in the printing system [17]. In the experimental research of ink transfer, the proportionally enlarged cell model was often used. The research found that the movement of the contact line between the cell and the moving roller mainly affected the liquid transfer process and determined the transfer accuracy of the gravure [18,19]. Experimental research can intuitively describe the process of liquid transfer, but it is difficult to extract data during the transfer process. With the development of computer technology, simulation has gradually become an effective means of experimental research [20,21]. At present, simulation has been applied in many fields and achieved good results [22,23]. In the ink transfer research work, many scholars also used a simulation method to carry out related research work [24,25,26]. Powell et al. described a Lagrangian finite element method for solving free surface flow and calculated the transfer process of Newtonian fluid from a trapezoidal cell to a horizontal substrate moving vertically downwards [27]. The influence of the change of the horizontal substrate and the separation speed on the liquid transfer was briefly discussed, and the approximate transfer rate was predicted. The limitation of the Lagrangian finite element algorithm is that it cannot simulate the fracture of the liquid filament and the change after the fracture. The VOF method has been proven to be able to simulate the changes of complex interfaces more accurately [28,29,30,31]. Huang et al. used the VOF method to simulate the liquid transfer process between two parallel plates, trapezoidal cells, and a moving plate [32]. It was observed that the liquid transfer process between the trapezoidal cell and the moving plate was divided into three stages: (1) a whole stretching stage; (2) a central stretching, breakup, and recoil stage; and (3) an equilibrium stage. However, their simulation was based on Newtonian fluids and did not involve a specific description of the ink transfer results. Fatemeh Ghadiri et al. studied the transfer process of non-Newtonian fluid between the plate and the trapezoidal cell [33] and optimized the parameters of the trapezoidal cell, which may make the ink transfer rate reach about 92%.
From the above research, it was found that there are two vacancies in the related research work of ink transfer. First of all, most of the liquids in the simulation are Newtonian liquids and shear-thinning liquids. There is no report on the transfer of shear-thickening liquids between the cell and the plate. This paper measured and introduces a power law model to describe the shear-thickening properties of water-based inks, making the research results more comprehensive. Second, in the current research on liquid transfer between cells and plates, most of the model structures are trapezoidal cells. However, with the continuous development of laser direct engraving technology, which has the advantage of high speed, high resolution, and arbitrary cell design [34,35,36], there are more and more applications of U-shaped cells formed by laser engraving.
In order to fill the abovementioned gaps, this paper used the PLIC interface tracking method and the VOF method to simulate the process of liquid with shear-thickening properties from the U-shaped cell to the upwardly moving plate, and the transfer process is described in detail. The effects of substrate surface wettability, cell contact angle, and cell depth on the liquid transfer process and results were studied, and the shallow effect in U-shaped cells was discovered and studied. In addition, the U-shaped cell was optimized for the purpose of improving the liquid transfer rate.

2. Ink Properties and Model Parameters

Water-based ink is a uniform, paste-like substance composed of binders, pigments, auxiliaries, and other substances. It has low viscosity and good fluidity and is generally a non-Newtonian fluid. In this paper, a Brookfield RST rheometer was used to measure the rheological properties of water-based inks. The results showed that the viscosity of water-based inks increases with the increase of shear rate. The relationship between shear rate ( ε ) and shear stress ( τ ) is shown in Figure 2. It can be seen that the relationship between the two is non-linear and the curve conforms to the characteristics of the shear-thickening liquid, which indicates that the water-based ink used in this study was a shear-thickening liquid [37].
For shear-thickening fluids, the most widely used rheological model is the power law model [38,39,40]. The power law model can describe the viscosity change under the intermediate shear rate measured in this paper. Its basic formula is:
η ( ε ) = k ε n 1
where η is the shear viscosity, k is the consistency index, n is the power law exponent, and ε is the magnitude of the rate of strain tensor or the shear rate of the fluid. Fitting the experimental data with the power law model, the viscosity coefficient k = 0.04 Pa S n and the power law exponent n = 1.4. Table 1 is the fluid property parameters. Generally speaking, when the liquid exhibits shear-thickening properties, the viscosity cannot be described solely by the deformation rate [41]. Therefore, the above formula just simply provides a qualitative prediction of liquid shear-thickening.
The laser direct engraving technology modulates the energy and pulse intensity of laser pulses by digital image data to instantly melt and vaporize the processed materials to achieve the purpose of engraving cells [35,36]. Compared with traditional plate-making methods, laser engraving gravure technology can arbitrarily define the shape of the cell opening. The longitudinal section of the cell is U-shaped and has the advantages of high precision, simple process, and fast speed. It has quickly become a research hotspot in the field of gravure plate making. Therefore, this work focused on the research of the new U-shaped cell, the model structure, and the grid system, which are shown in Figure 3. The wall part was simplified as a U-shaped cell and an upwardly moving upper plate. The fluid part includes air and ink. The α and β are the contact angles of the liquid with the upper plate and the cell wall, respectively. St is the thickness of the thinnest part of the liquid filament. Wt is the width of the contact line on the upper plate. Ht is the depth of the contact line on the cell wall. R is the corner radius of the cell. Bt is the width of the contact line at the bottom of the cell. The cell geometric parameters in the simulation are shown in Table 2.
During the simulation, in order to better observe the changes in the position of the contact line, the contact angle in each simulation was a fixed value, and the contact line was allowed to move freely on the wall. At the beginning of the simulation, after a certain time step of iteration, the contact angle reached the set contact angle and the free liquid surface was stable. Then, the cell was partially fixed and the upper plate moved upward at a constant speed, uw. Because the liquid filament had symmetry in the state of the lowest energy, the model was simplified to a two-dimensional axisymmetric model without affecting the calculation [15,42]. The upper plate and the walls of the cell adopted no-slip boundary conditions, and the ports on the left and right were set as constant pressure outlet to connect with the outside air. Due to the existence of the outlet at both ports of the cell, there must be a certain distance c0 between the cell and the upper plate in the initial state, which led to the upper plate and could not directly contact with the cell and could not simulate the effect of imprint force.

3. Numerical Methods

The VOF model is based on a variety of incompatible fluids (two or more). The fluid flow was simulated by solving the momentum conservation equation and calculating the volume fraction of each fluid passing through the calculation area. Assuming that the fluid is incompressible, gas-liquid is incompatible, and the free liquid surface is allowed to move freely on the wall, the mass conservation equation and momentum conservation equation are as follows:
( ρ υ ) t + ( ρ υ × υ ) = p + ( μ ( υ × ( υ ) t ) ) + f g + f st
ρ υ = 0
Among them, ρ is the density, p is the pressure, v is the velocity vector, t is the time, μ is the dynamic viscosity, fg is the gravity, and fst is the surface tension. In this model, gravity can be ignored, that is, fg = 0.
The VOF method can record the volume fraction of each grid calculation unit, and the fluid volume fraction function is the ratio of the fluid volume to the grid volume in the grid. The VOF method evolves around the volume fraction Q, and the parameter Q has the following properties:
Q = { 0 inside   the   gas   phase > 0 , < 1 at   the   free   suface 1 inside   the   water   phase
The position of the free surface is determined by the gradient transport equation:
Q t + ( ρ Q ) = 0
The shape of the free surface is reconstructed using a second-order piecewise linear interface construction (PLIC) scheme. It uses straight line segments to represent the fluid interface in a single computational grid approximately. For the calculation grid with 0 < Q < 1, the density ρ and dynamic viscosity μ of each item can be determined by the volume fraction Q:
ρ = Q ρ 1 + ( 1 Q ) ρ 2
μ = Q μ 1 + ( 1 Q ) μ 2
Among them, ρ 1 and μ 1 are the density and viscosity of the first term, respectively, and ρ 2 and μ 2 are the density and viscosity of the second term, respectively.
The liquid surface tension fst is:
f st = σ st κ n
In the above formula, σst is the surface tension coefficient and κ = ( n ) is the free surface curvature, which represents the gradient operator perpendicular to the free surface. The n is the unit normal vector of the free surface, which can be expressed as:
n = Q | Q |
The SIMPLEC (Semi-Implicit-Method for Pressure Linked Equations-Consistent) algorithm and the second-order upwind form are used to calculate the pressure-velocity coupling problem and the fluxes at the grid cell interfaces, respectively. The explicit Euler scheme for time advancement is employed for the transport equation and the momentum equation. The resulting system of algebraic equations is solved iteratively at each time step. In this study, the ICEM module in ANSYS was used for modeling and meshing, the numerical calculation was carried out in the FLUENT software, and the post-processing was carried out in the CFD-post module.

4. Results and Discussion

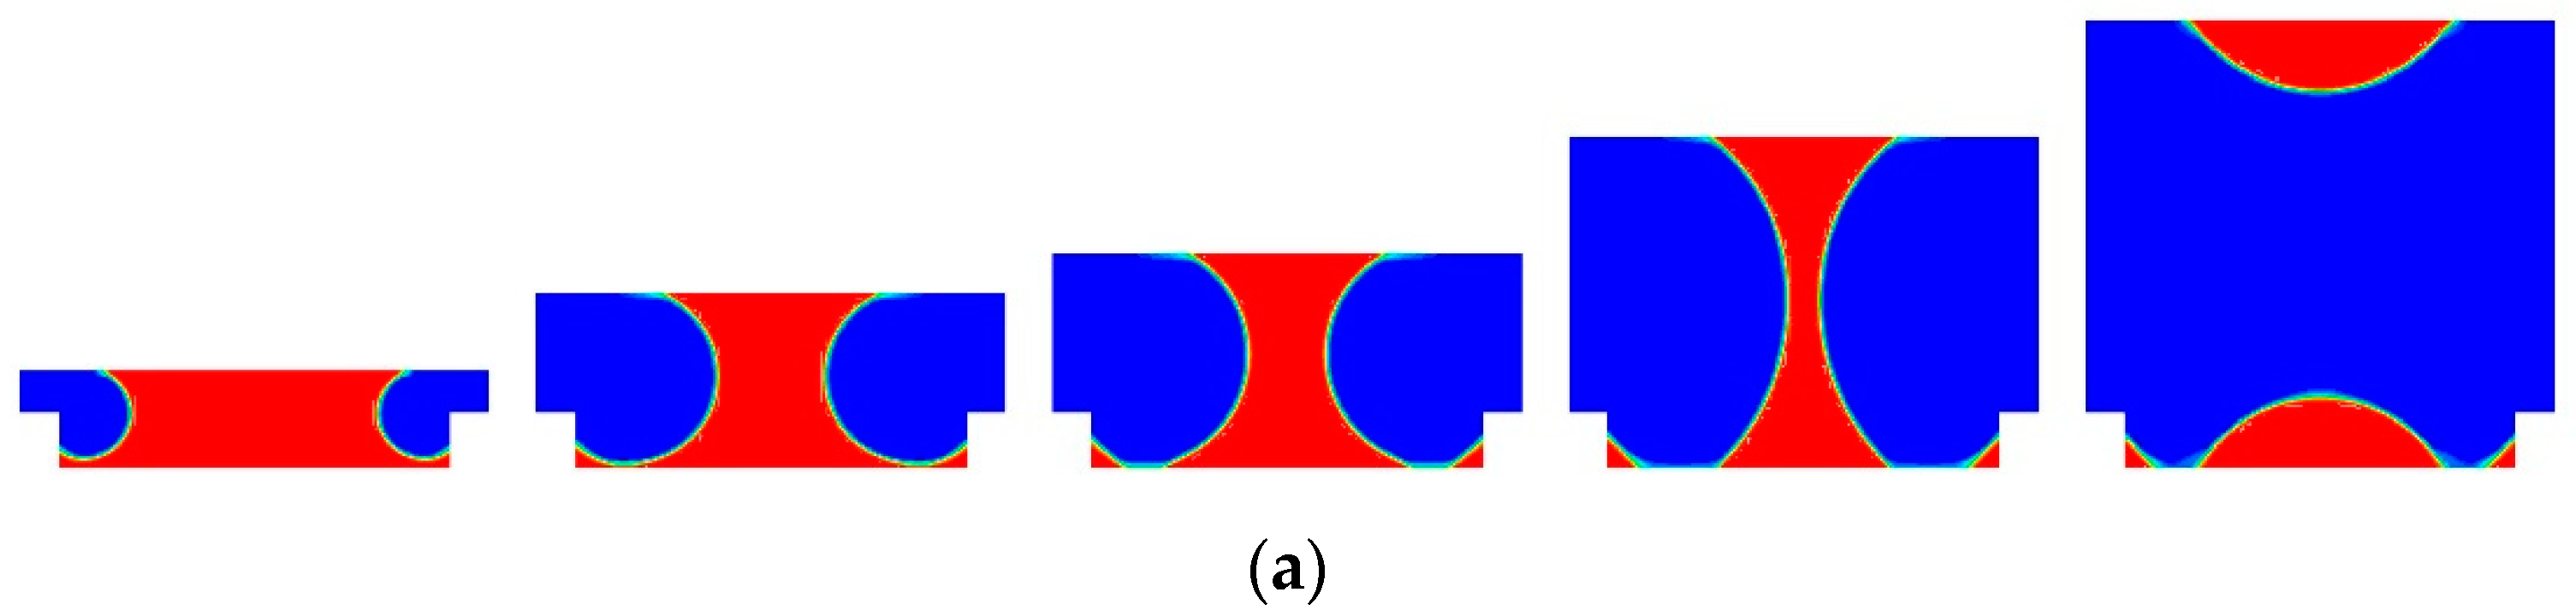
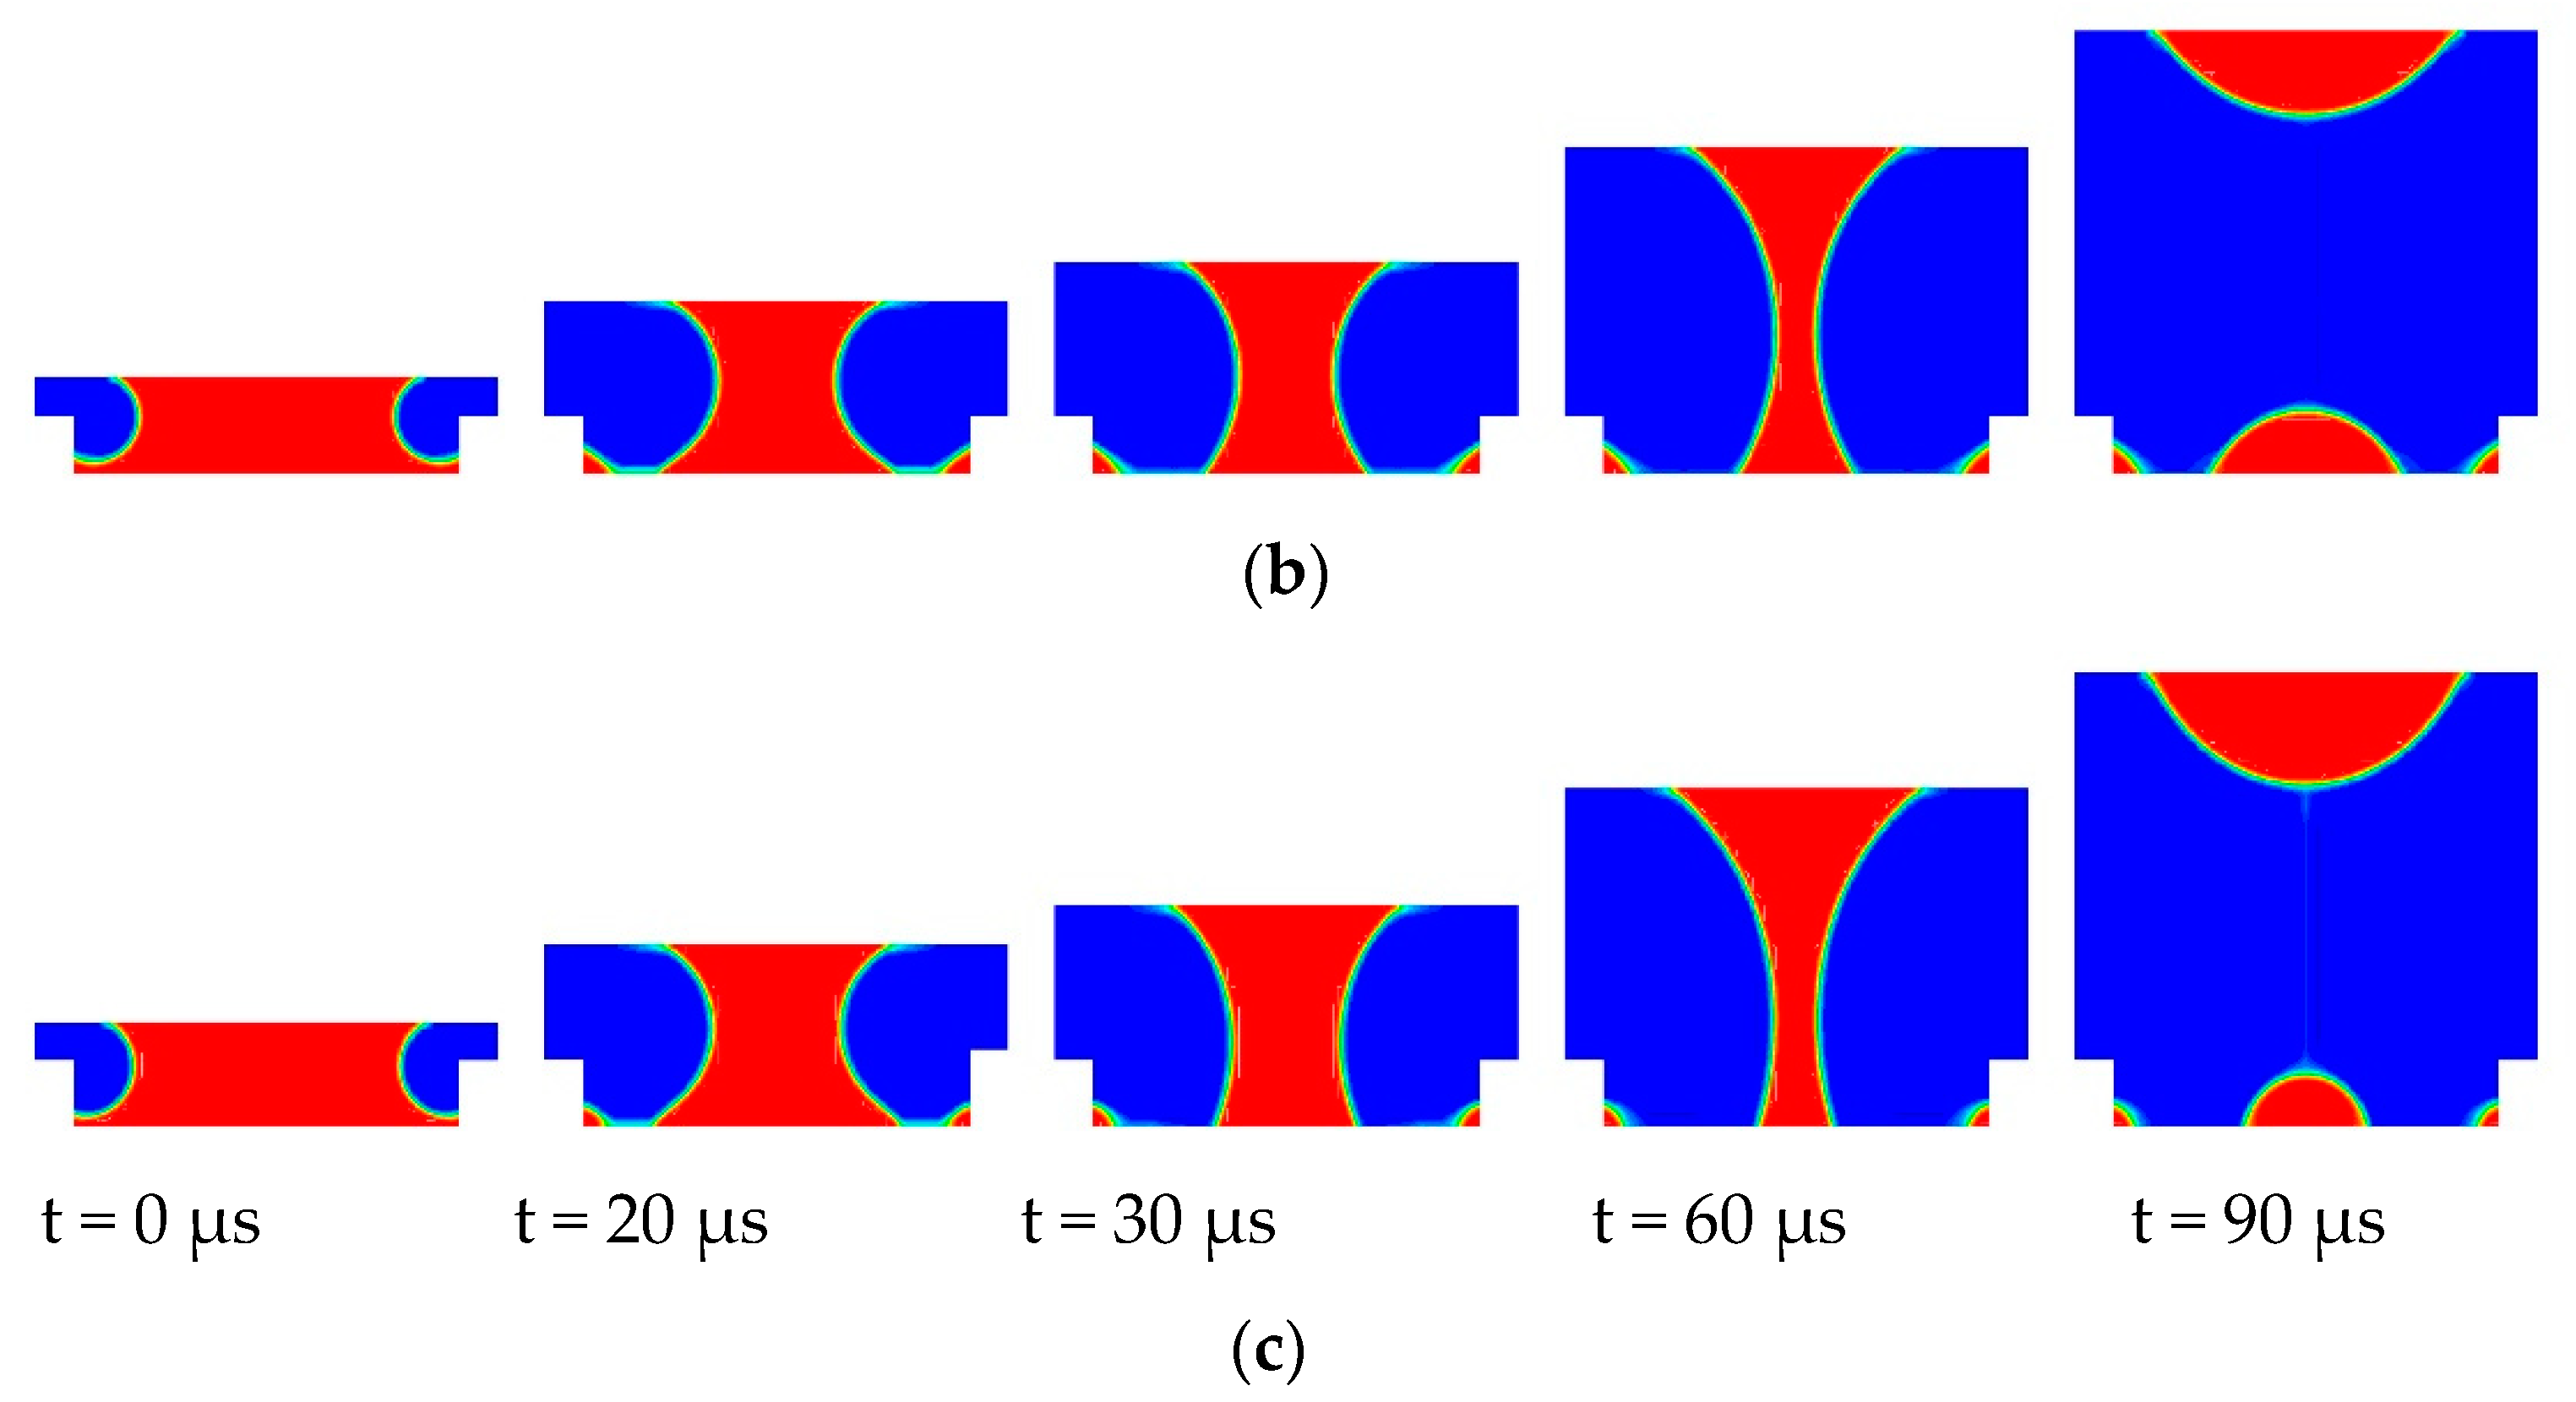
4.1. The Effect of Substrate Wettability

The better the wettability of the substrate, the smaller the angle formed by the liquid and the substrate [43]. In order to observe the influence of substrate wettability on liquid transfer, the cell contact angle β was fixed at 90° and the upper plate contact angle α was set to 30°, 45°, and 60°, respectively. The time evolution of strain rate and contact line under different α conditions (Figure 4) was used to study the liquid transfer process. Take α = 30° as an example to study the transfer process. At t = 0 μs, there was the highest strain rate near the contact line, which was due to the deformation of the free liquid surface in order to reach the set contact angle. In the stretching stage, the position of the contact angle and the thinnest part of the liquid had obvious changes. Additionally, as the liquid filament continued to stretch, the strain rate of the thinnest part of the liquid filament gradually increased until it broke. After the liquid filament broke, the liquid rebounded in the upper plate and the cell under the action of surface tension. At t = 100 μs, the liquid reached a steady state and the transfer process ended.
The change trend of the thickness of the thinnest part of the liquid filament (St) and the width of the contact line on the upper plate (Wt) are shown in Figure 5. It was found that the St curve showed a downward trend as a whole and the rate of change of the curve decreased with time during the stretching phase. The breaking time of the liquid filament decreased with the increase of α, but this difference was not very obvious. The change trend of Wt (Figure 5b) was consistent with the instantaneous contour of strain rate in Figure 4. Wt decreased significantly in the early stage of stretching and tended to be flat in the later stage of stretching. After the liquid filament broke, the action of surface tension made the liquid rebound to the upper plate, which made Wt increase rapidly. Finally, the liquid reached an equilibrium state in both the upper plate and the cell, and Wt no longer changed. The difference in Wt caused by different α may be an important factor leading to the difference in ink transfer rate.
Figure 6 characterizes the effect of α on ink transfer rate. It can be seen that the ink transfer rate decreased linearly with increasing α. Combining the changes of Wt (Figure 5b) and liquid transfer rate under different α, it was found that the movement of the contact line greatly affected the ink transfer. Since the surface with good wettability was more conducive to the adhesion of liquid, the reduction of the contact angle of the upper plate could increase the contact length of the liquid and the upper plate and further increase the amount of liquid being stretched. Therefore, the final liquid transfer rate increased as the wettability of the substrate surface became better.
In actual production, in order to increase the ink transfer rate, pretreatments such as corona are carried out before the printing of weakly adsorbing substrates such as metals and films [44,45]. The conclusion that corona treatment can reduce the contact angle and improve the ink transfer rate is consistent with the simulation results of this paper. However, the contact angle is not as small as possible. If the contact angle is too small, the spreading diameter of the liquid on the surface of the substrate will increase, causing problems such as enlarged dots and poor printing quality [46].

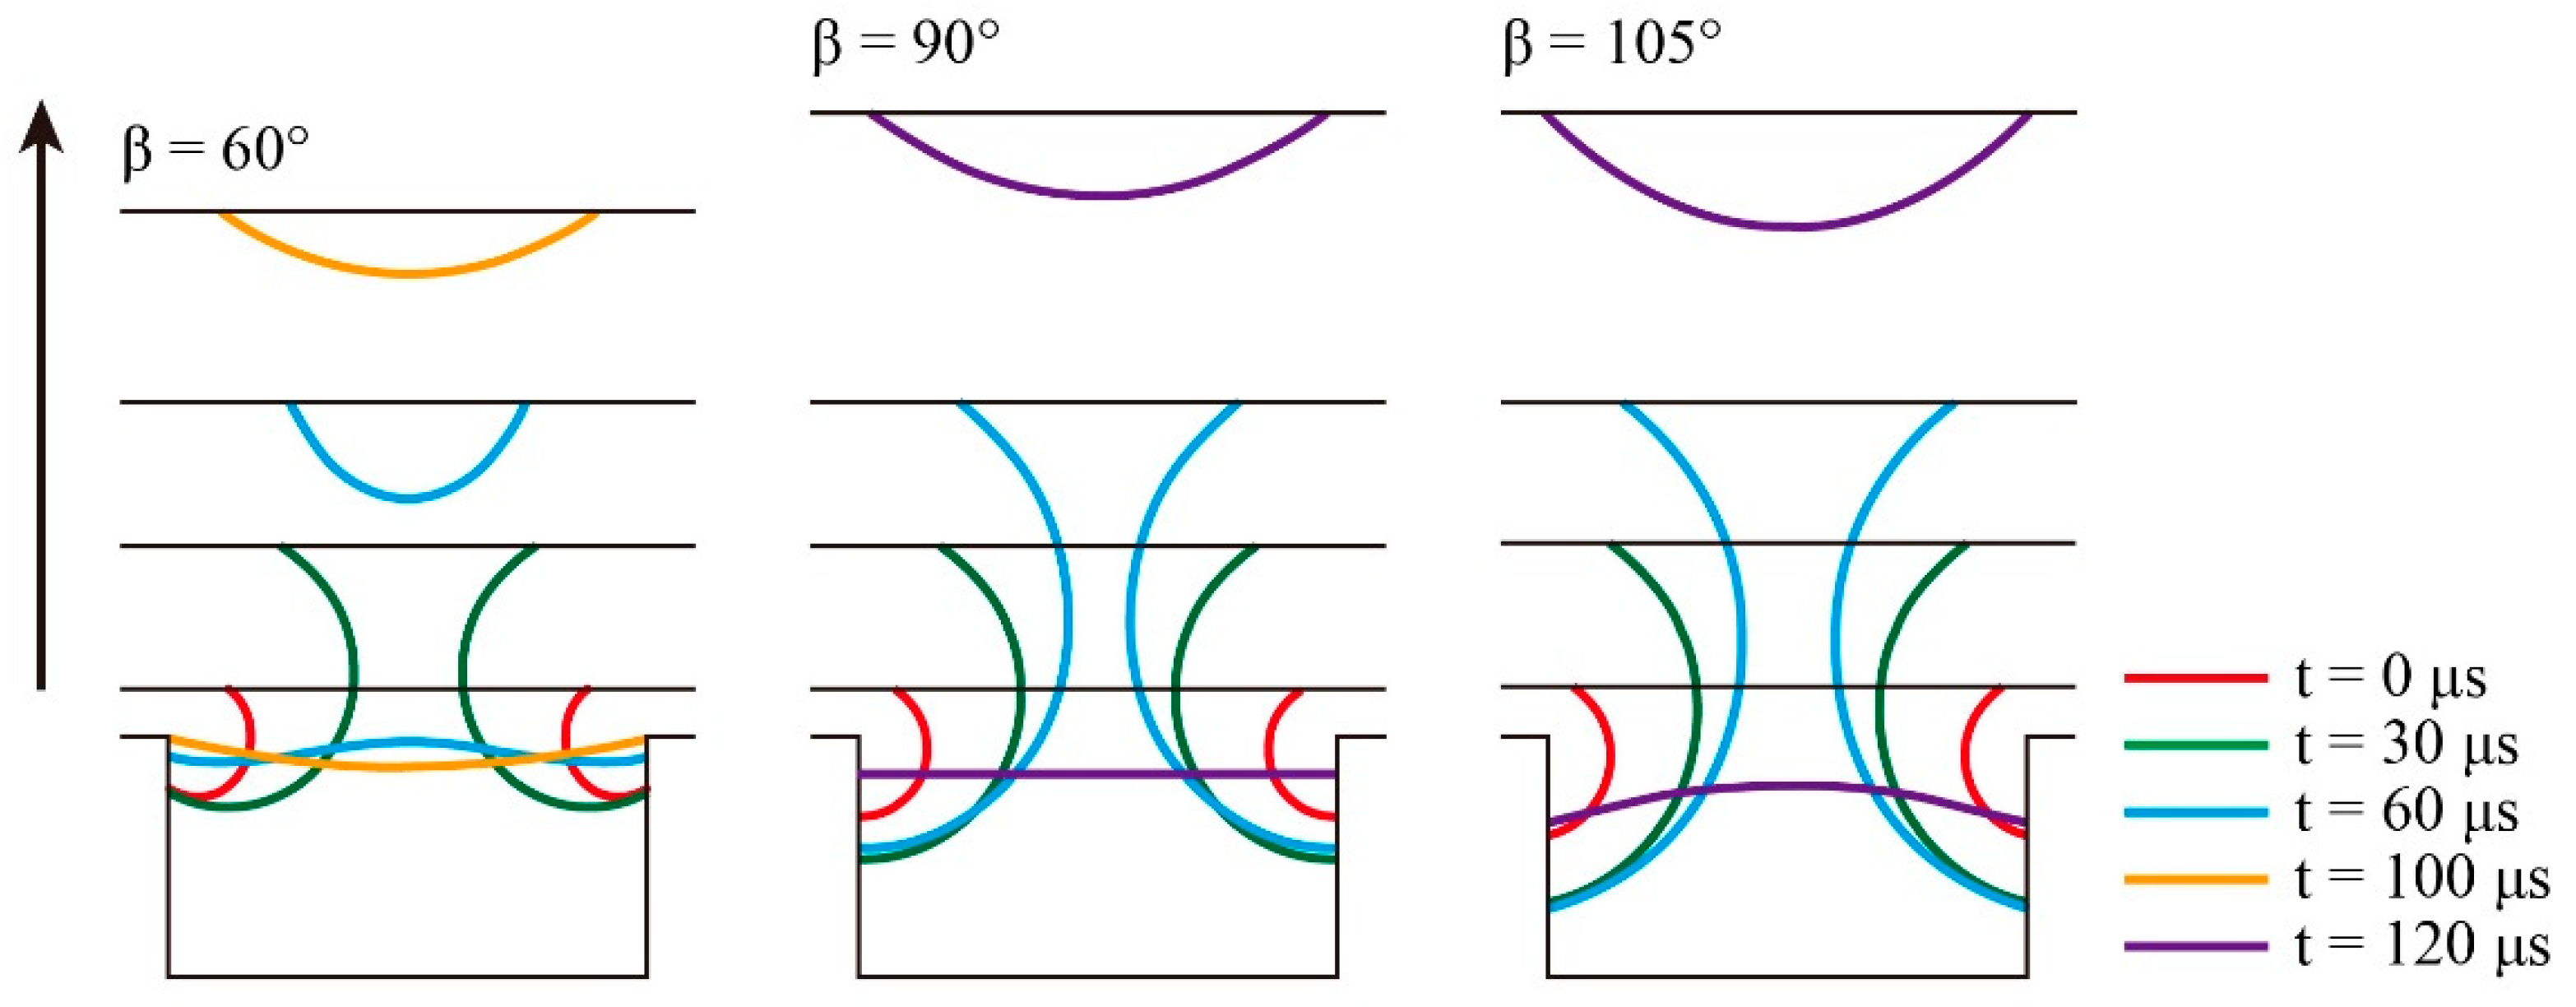
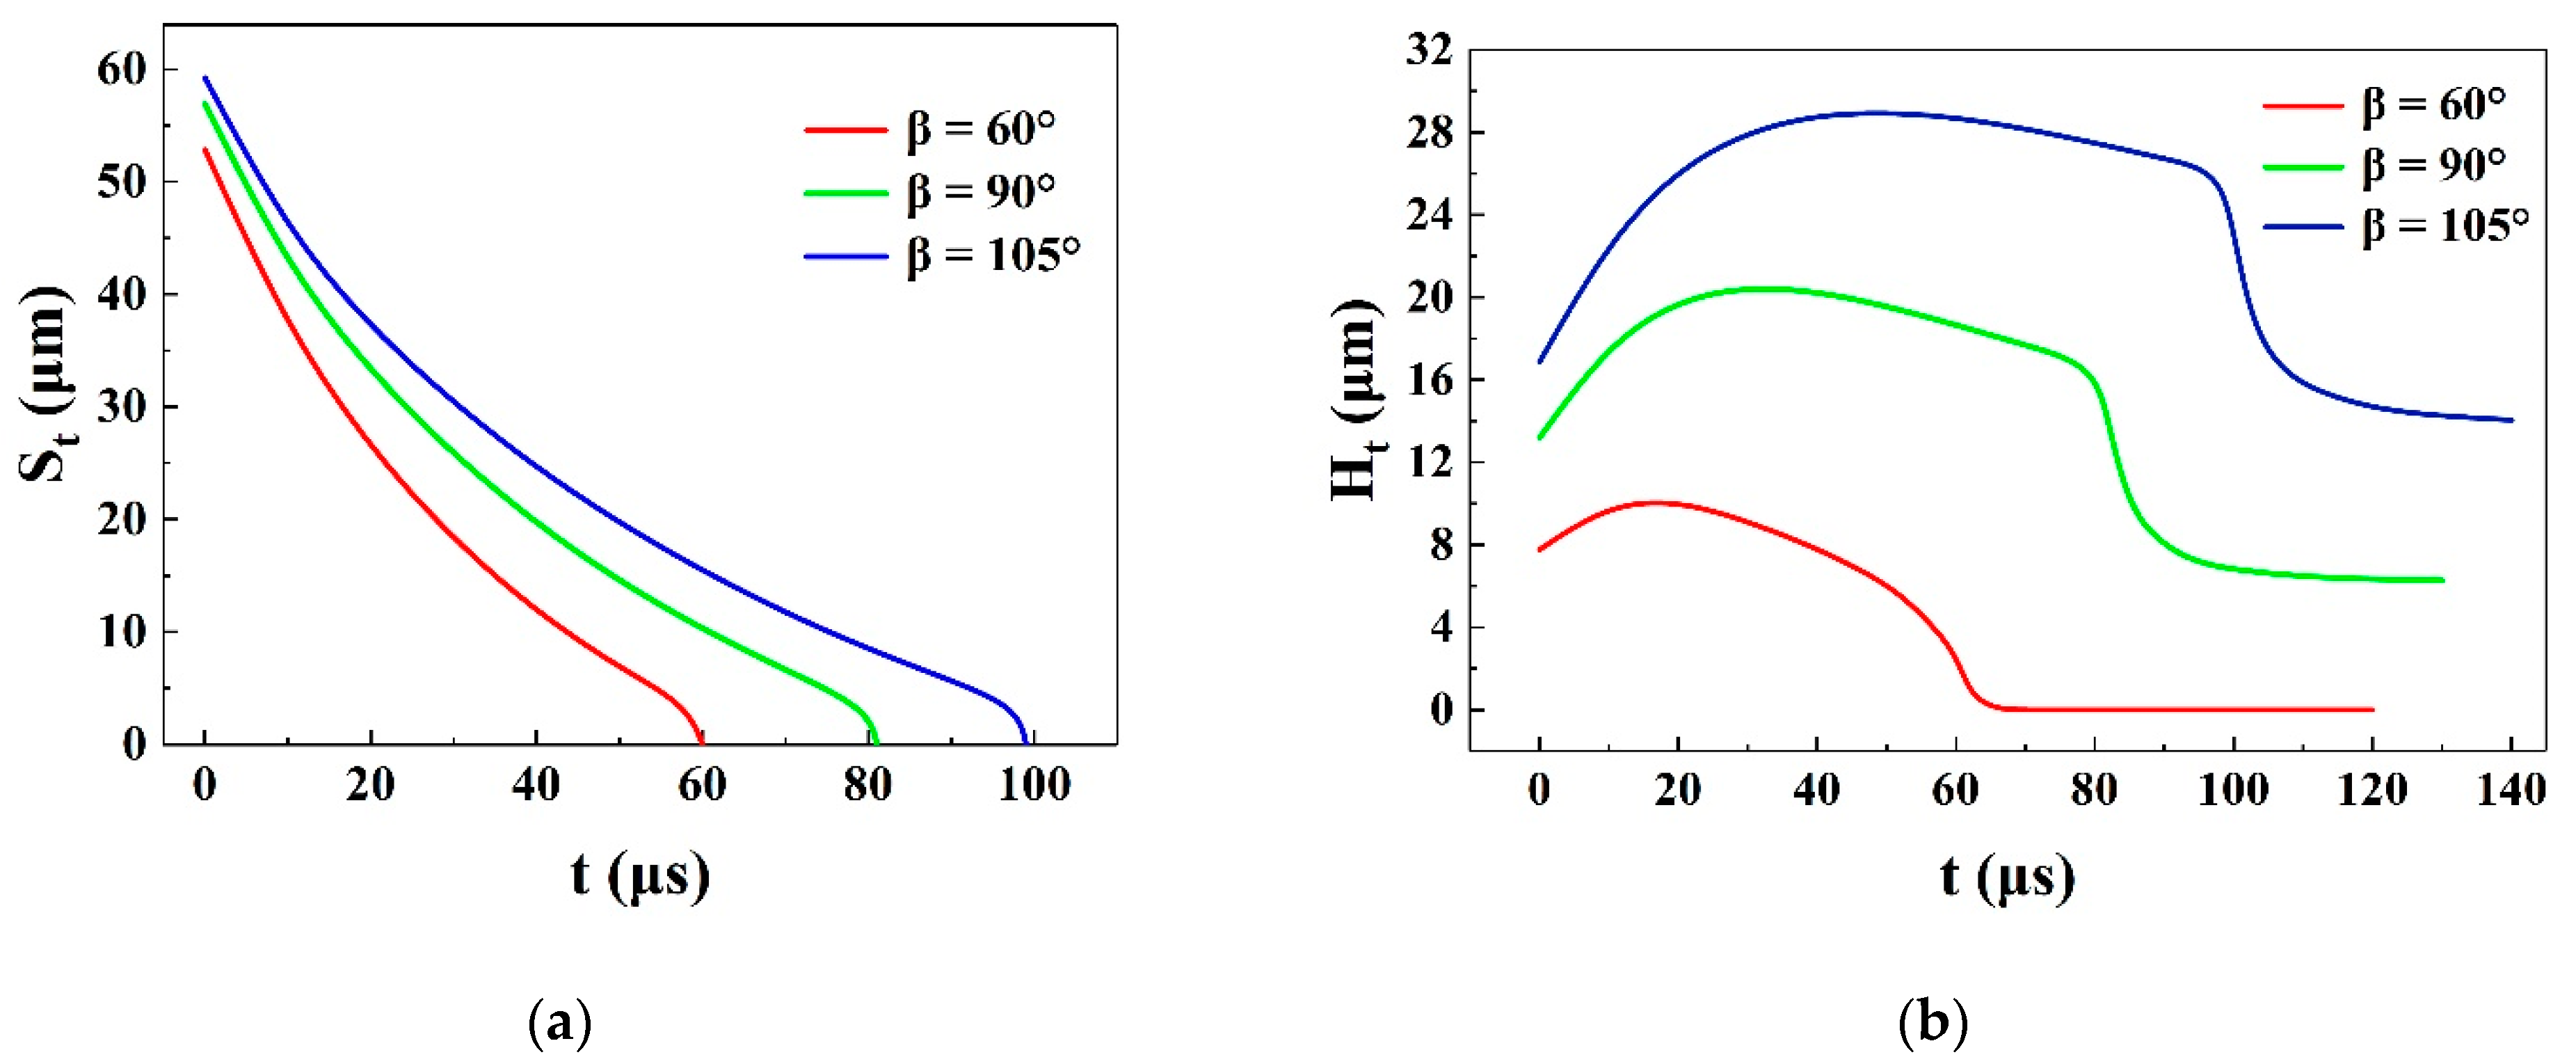
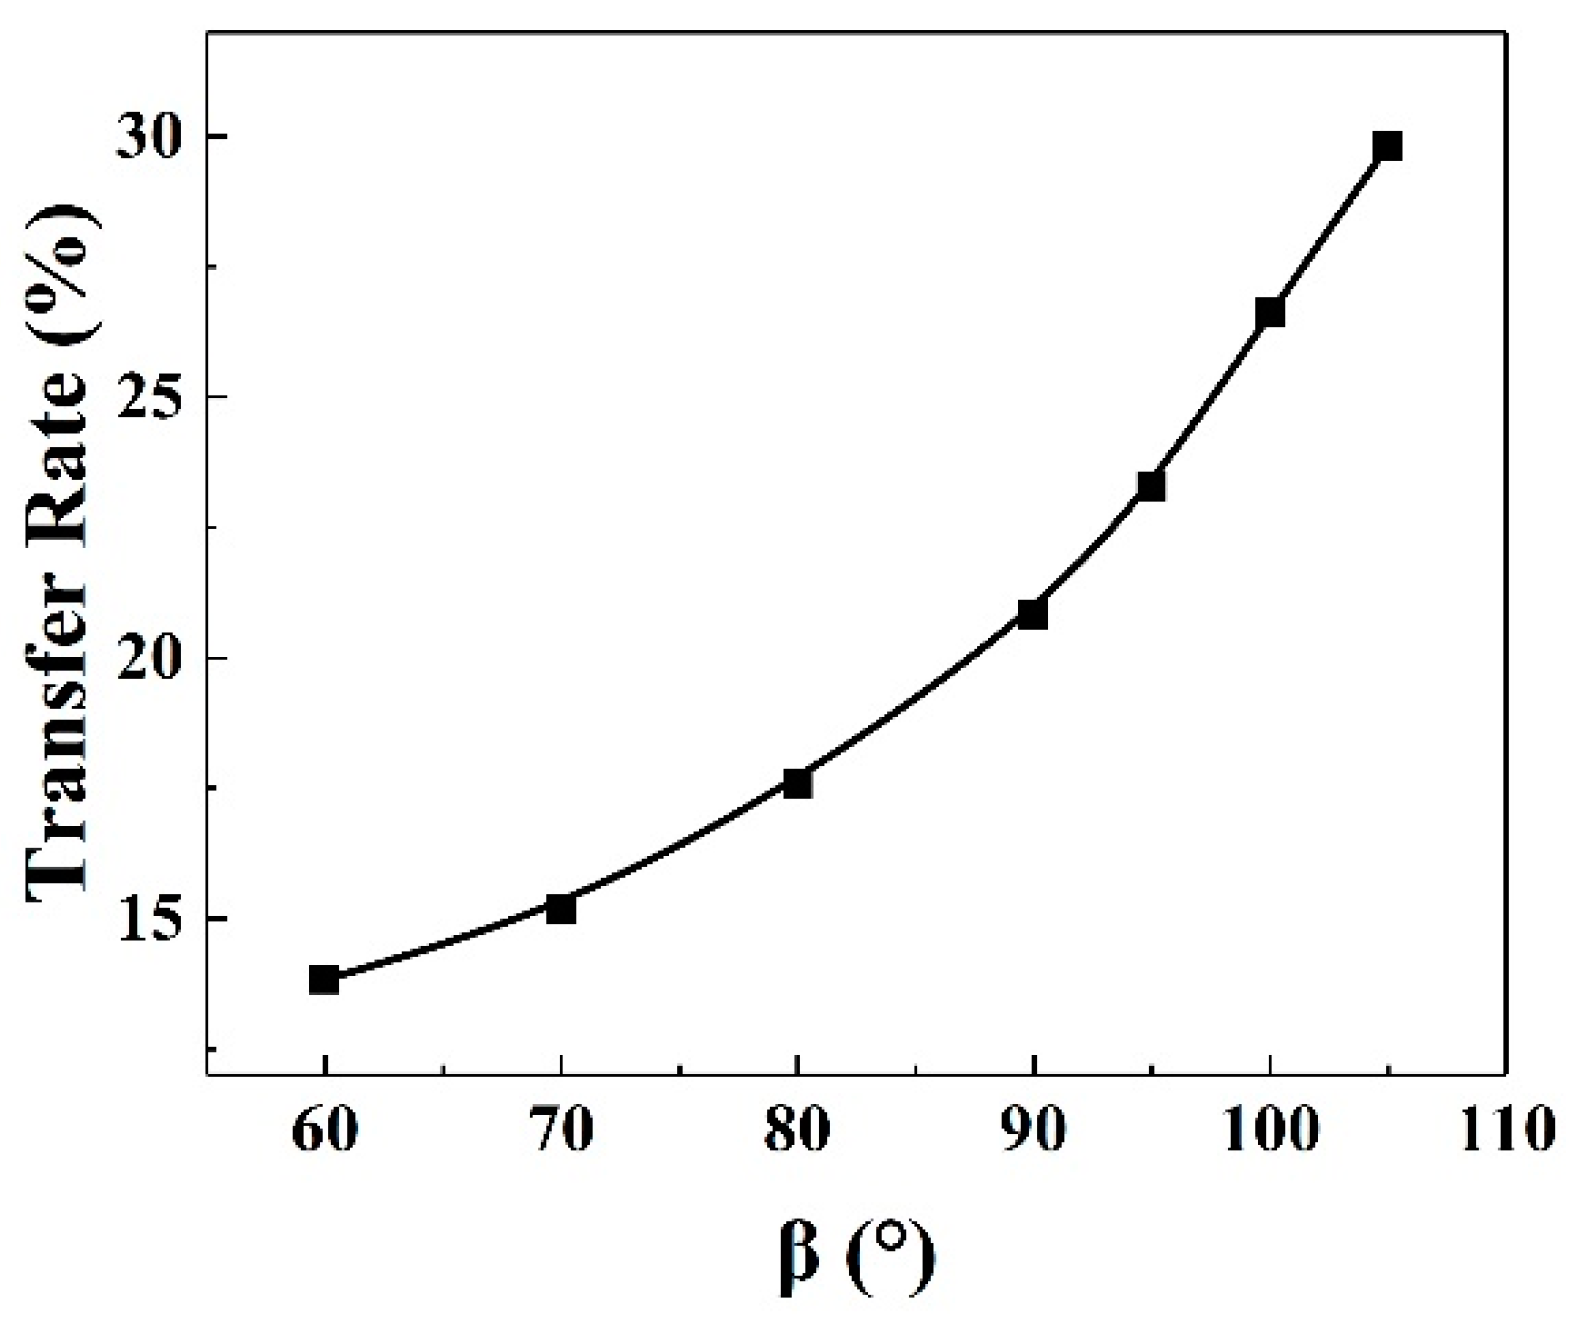
4.2. The Effect of Cell Contact Angle

The upper plate contact angle α was fixed at 30°, and β was set to 60°, 90°, and 105° to study the influence of cell contact angle β on ink transfer. According to the time evolution of the contact line in the process of liquid transfer (Figure 7), it was found that the liquid filament breakage time and the position of the contact line on the side wall of the cell were obviously different due to the difference of β. Figure 8a shows the change trend of the thinnest liquid filament width (St) over time. With the increase of β, the breaking time of the liquid filament was about 58 μs, 81 μs, and 99 μs, respectively. This phenomenon that the breakage time of the liquid filament increases with the increase of β may be related to the change of the position of the contact line on the side wall of the cell.
Figure 8b is the change trend of the depth of the contact line in the cell (Ht) over time. At t = 0 μs, the smaller β caused more liquid to be adsorbed on the cell wall, resulting in smaller Ht. In the stretching stage, it was obvious that the Ht curve rose first and then fell. This downward trend was most obvious when β = 60°. This shows that the smaller the contact angle of the cell, the more liquid will fall back into the cell in the middle and late stages of stretching, which may be the reason for the earlier breakage time of the liquid filament. Then, the liquid filament broke and the Ht curve further dropped and finally reached a plateau.
It can also be observed from Figure 8b that the depth of the contact line in the cell increased as β increased, which means that the amount of liquid fixed in the cell was reduced, resulting in an increase in the final liquid transfer rate. This is consistent with the conclusion described in Figure 9, that the liquid transfer rate increased as β increased. It is worth noting that the relationship between ink transfer rate and β was not linear. With the increase of β, the change of ink transfer rate became more obvious. However, considering the effect of the printing plate material and the squeegee, a too-high cell contact angle has no reference meaning in actual printing. For the case of emptying Newtonian liquid, Huang et al. observed that the liquid transfer rate is only weakly correlated with β [32], but the change in β in this simulation greatly affected the liquid transfer rate. Therefore, the liquid transfer rate increases with the increase of the cell contact angle, and the shear-thickening property of the liquid can promote the influence of the cell contact angle on the ink transfer rate.

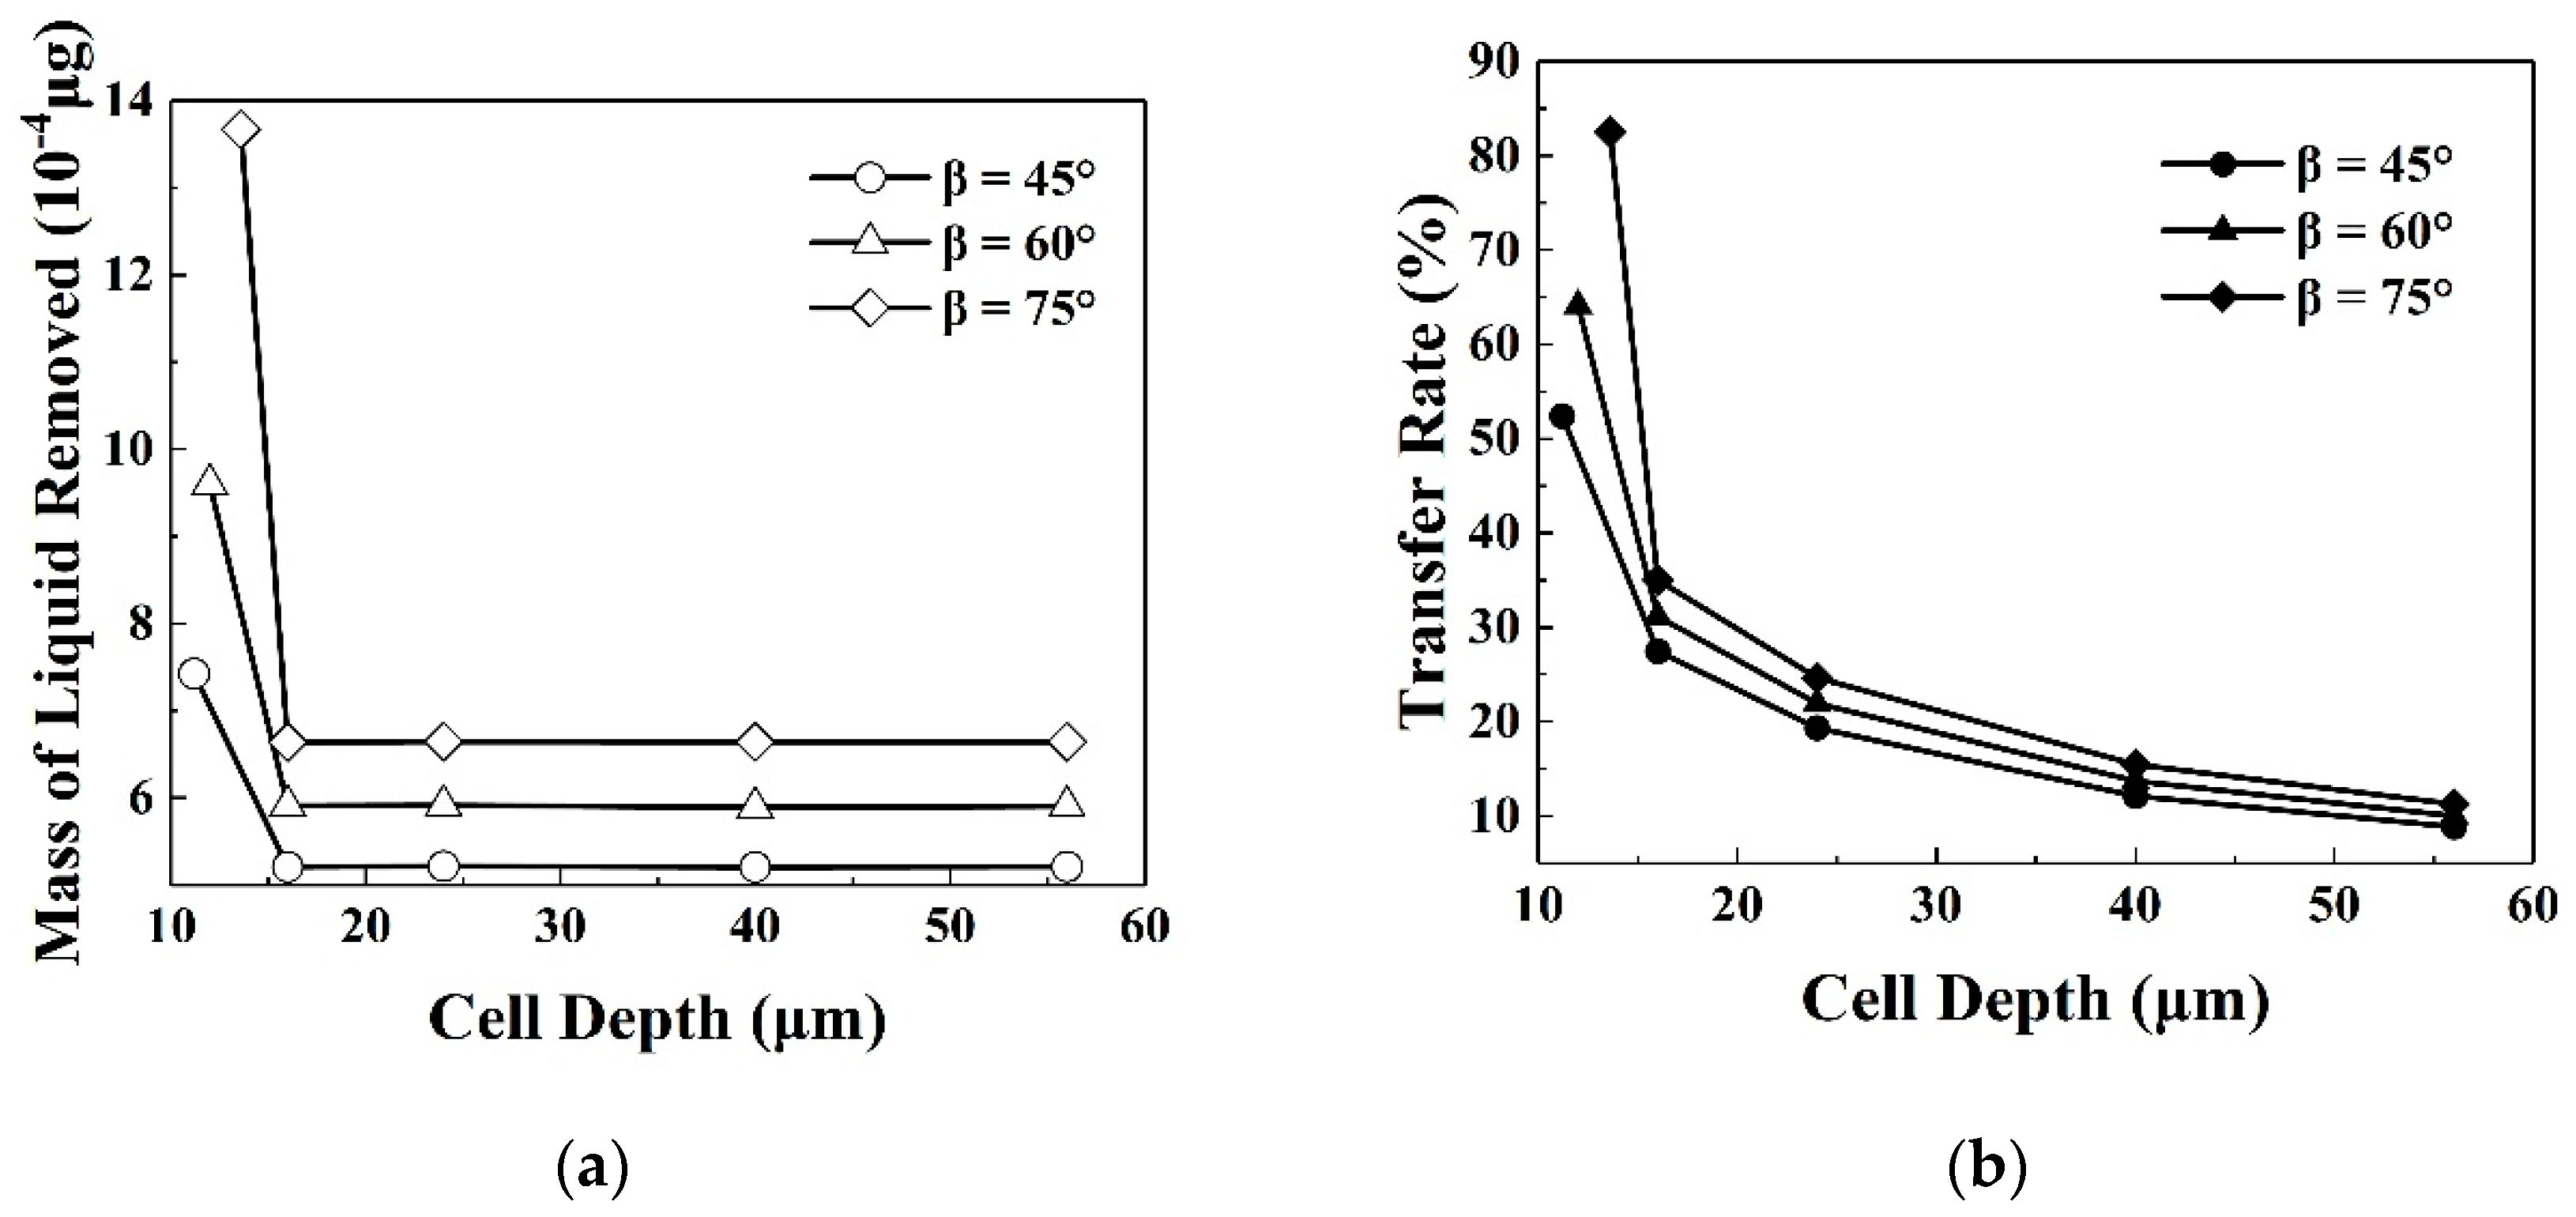
4.3. Shallow Printing Plate Effect

Under different contact angle combinations, the effect of cell depth on liquid transfer was studied. The changes in the mass of liquid removed and transfer rate with cell depth are shown in Figure 10. It was found that there was no obvious change in the mass of liquid removed from the cell when the cell depth changed from 16 μm to 42 μm, and the liquid transfer rate gradually decreased with the increase of the total liquid volume. In addition, we made important discoveries in the study of cell depth. When the cell depth was reduced to a certain limit, the mass of liquid transferred and liquid transfer rate were greatly improved. We call this discovery the shallow printing plate effect.
In order to further explore the reason why the shallow printing plate effect increases the liquid transfer rate, the liquid transfer process under three different parameters was selected for analysis (Figure 11). It was found that the movement of the contact line was the main reason for the increase in liquid transfer rate. In the shallow printing plate effect, the depth of the cell was shallow enough so that the contact line gradually broke away from the restraint of the side wall of the cell during the stretching process and the liquid transfer process evolved into a stretching process between two flat plates (the upper plate and the bottom of the cell). However, it can be found from Figure 11 that due to the limitation of the contact angle, a small part of the liquid was left in the cell corners during the transfer process. Table 3 shows the critical cell depth that can achieve the shallow effect under different cell contact angles and the mass of liquid removed under the combination of the two. With the increase of the cell contact angle, the critical value of cell depth that can reach the shallow effect shows an increasing trend and the residual liquid volume corresponding to the two shows a decreasing trend. Although the volume of residual liquid was slightly different under different combinations, this residual was not conducive to liquid transfer.
In the shallow printing plate effect, the liquid transfer process evolves into a stretching process between two plates, and the increase of the cell contact angle can increase the liquid transfer rate. Hyun Wook Kang et al. conducted an experimental study on the liquid transfer process between two separate plates [47]. Among them, the influence of contact angle on liquid transfer was studied, and the conclusion that the liquid transfer rate increases with the increase of the contact angle of the lower plate was obtained, which is consistent with the simulation results of this paper. In this paper, the liquid transfer rate obtained under the parameters α = 30°, β = 75°, and h = 13.6 μm was 82.53%, which is close to the liquid transfer rate of about 84% when α = 30° and β = 78° in the Hyun Wook Kang experiment [47]. These data prove the accuracy of the shallow printing plate effect.

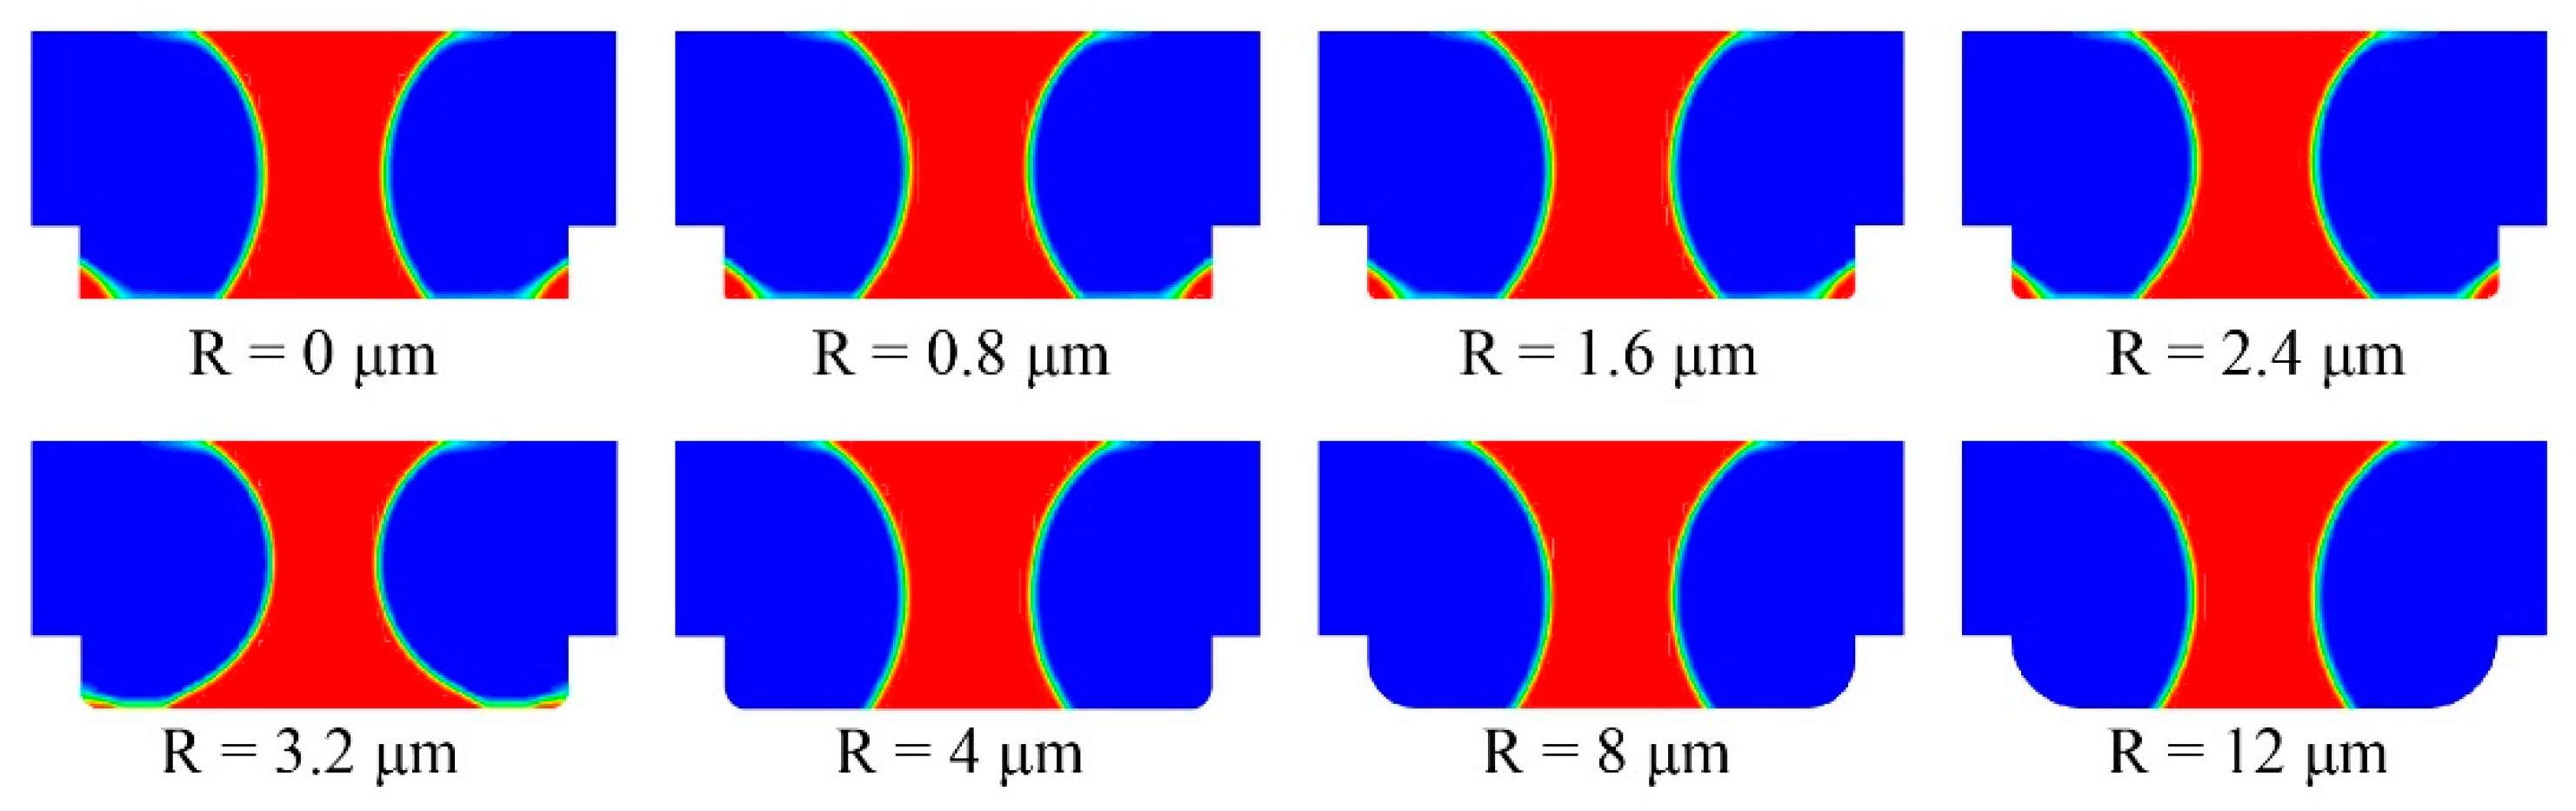
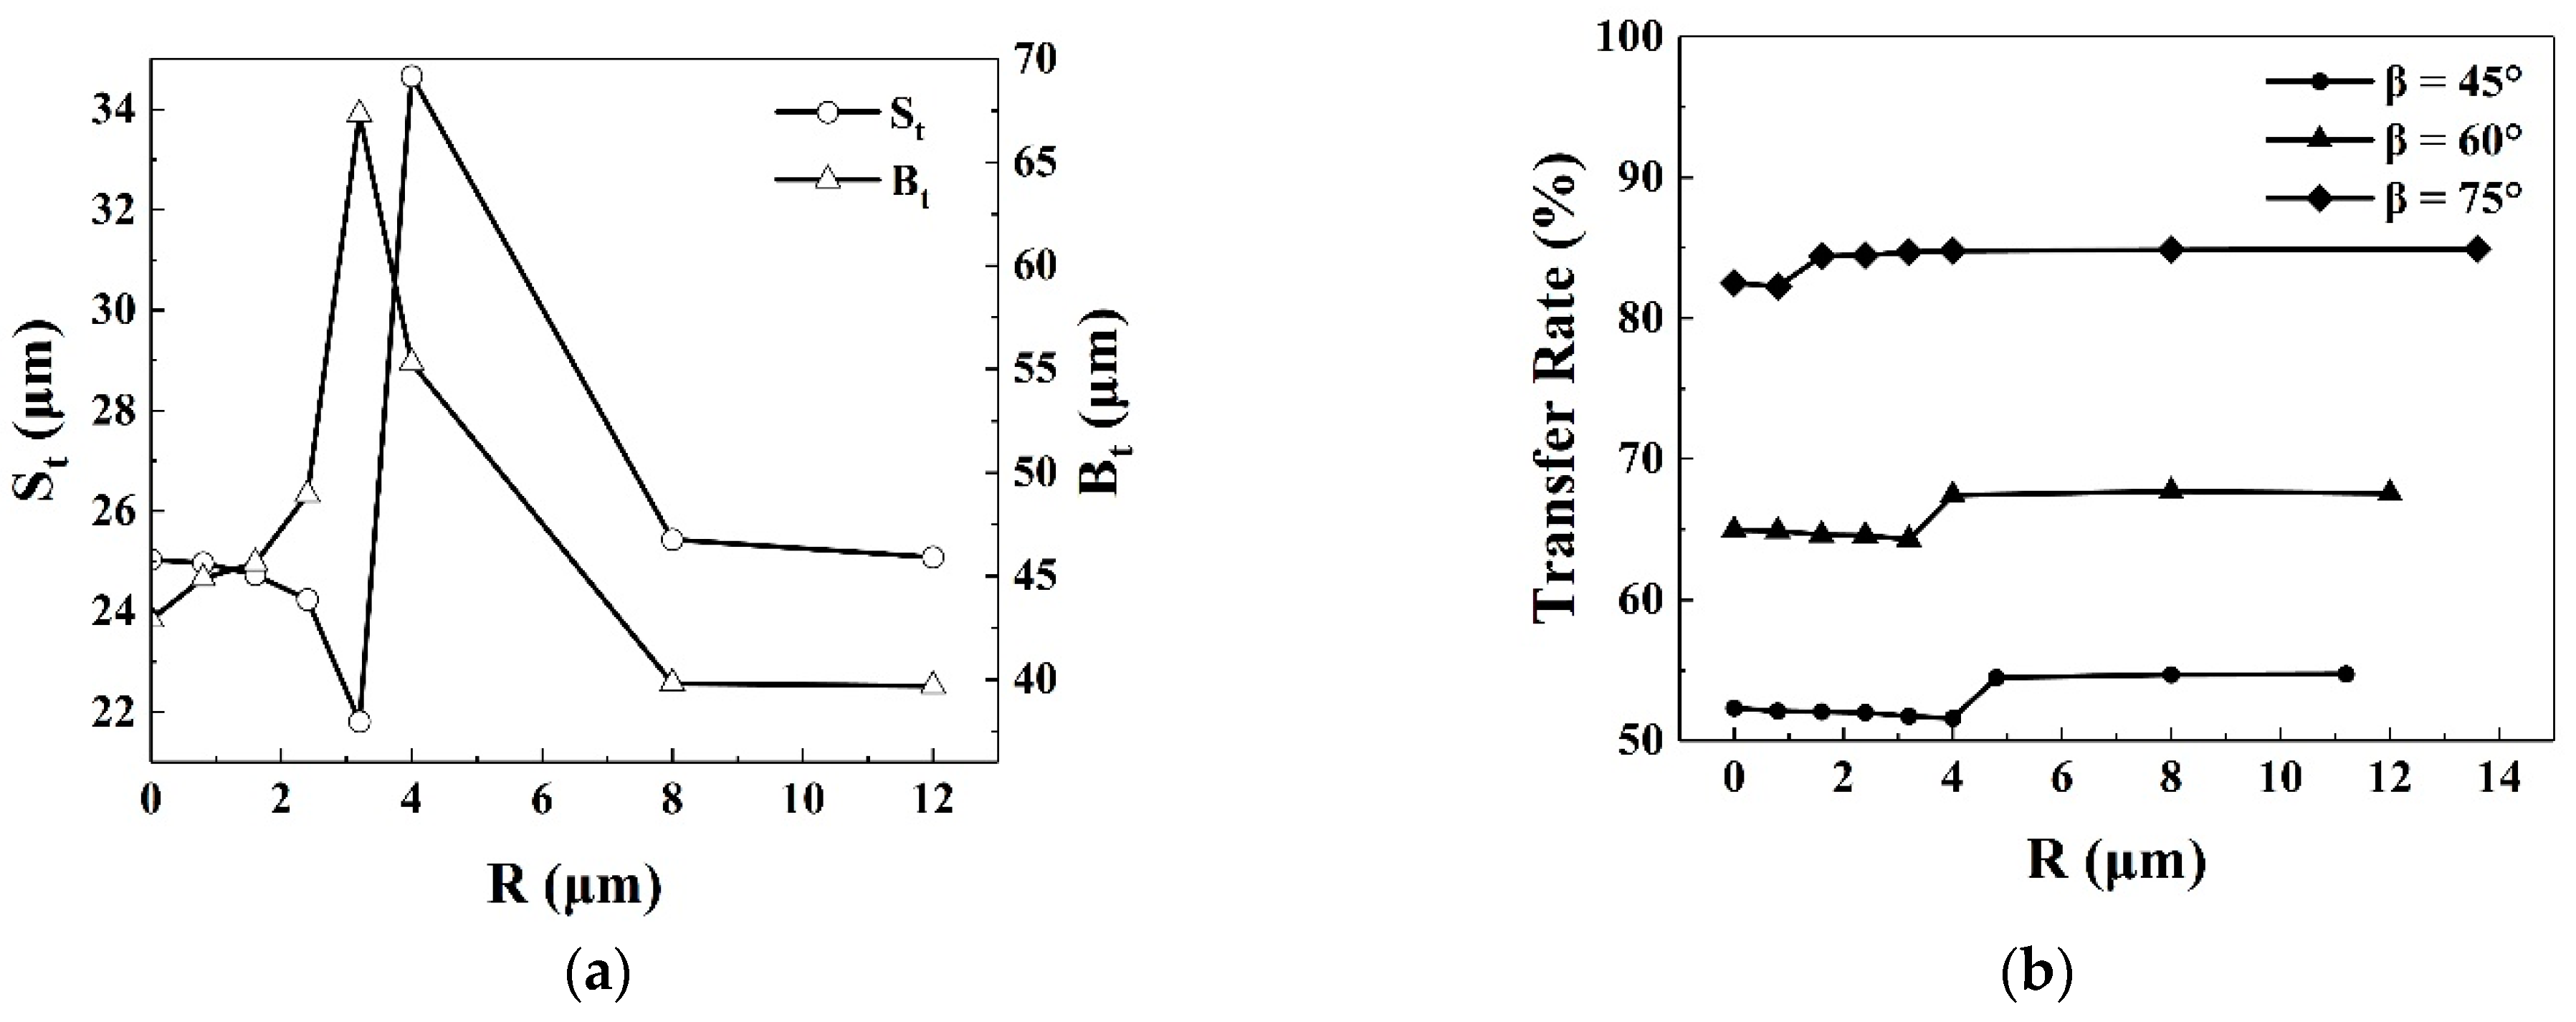
4.4. Cell Shape Optimization

During the liquid transfer process in the shallow printing plate effect, it was found that from the lowest point of the contact line touching the bottom of the cell to the end of the liquid transfer process there will be liquid residue at the corners of the cell. Because the residual liquid volume was small and the residual liquid existed for close to the entire transfer process, the residual liquid was more likely to dry and solidify at the corners of the cell. With the increase of the number of transfers, the bad phenomenon of blockage will eventually be caused.
It may be an effective method to set corresponding fillets at the cell corners. Figure 12 shows the relationship between the fillet radius and the mass of liquid removed under different parameters. It was seen that the mass of residual liquid gradually decreased with the increases of fillet radius. Moreover, corresponding to the mass of residual liquid (Table 3) at the critical cell depth of the shallow printing plate effect, the fillet radius that could completely remove the residual liquid decreased with the increase of β.
The fillet radius was further studied under the parameters of α = 30°, β = 60°, and h = 12 μm. From the transfer process of liquid in the cells with different fillet radius at t = 30 μs (Figure 13), it was found that the fillet corners could effectively eliminate the liquid residue in the cell corners. In addition, the size of the fillet radius significantly affected the position of the contact line. The change of the width of the contact line at the bottom of the cell (Bt) and thickness of the thinnest part of the liquid (St) with the fillet radius is shown in Figure 14a. When the fillet radius was in the range of 0 μm to 3.2 μm, the residual liquid was not completely removed. As the fillet radius increased, St decreased significantly, which means that the liquid filament broke earlier. However, Bt showed an upward trend and more liquid was not transferred, which is not conducive to the improvement of the liquid transfer rate. The description of the ink transfer rate in Figure 14b also confirms this point. On the basis of eliminating the residual liquid, increasing the fillet radius can change this problem. When the fillet radius increased from 3.2 μm to 12 μm, it was obvious that both St and Bt showed a downward trend and the final liquid transfer rate increased slightly with the increase of the fillet radius (Figure 14b). For U-shaped cells, the optimization method combining the shallow printing plate effect and the fillet radius can greatly improve the liquid transfer rate and solve the undesirable problems such as plate blocking.
In all the combinations simulated in this paper, the ink transfer rate was up to about 85%. The optimal parameters were α = 30°, β = 75°, cell depth h = 13.6 μm, and fillet radius R = 13.6 μm. Even when the fillet radius was 6 μm, the liquid transfer rate reached about 84.7%. However, in order to consider the break time of the liquid filament, it is more recommended to use a large fillet radius.

5. Conclusions

This work took the U-shaped cell formed by laser direct engraving technology as the research object. Based on the measured rheological properties of water-based ink, the PLIC interface tracking method and the VOF method were used to simulate the transfer process of the shear-thickening liquid between the U-shaped cell and the upwardly moving plate. Additionally, in order to improve the liquid transfer rate, the U-shaped cell was optimized.
The measurement and analysis of the rheological properties of the water-based ink found that the water-based ink is a non-Newtonian liquid with shear-thickening properties. The surface wettability, cell contact angle, and cell depth of the substrate can have a significant impact on the shear-thickening liquid transfer process. The wettability of the substrate surface is represented by the size of the contact angle formed by the liquid and the upper plate. The better the wettability means the smaller the angle formed. As the contact angle of the upper plate decreased, the contact width between the liquid and the upper plate increased and the final liquid transfer rate showed an upward trend. The increase of the contact angle of the cell increased the depth of the contact line on the cell wall, prolonged the breaking time of the liquid filament, and improved the liquid transfer rate. We also considered the impact of cell depth on liquid transfer. The study found that there was a limit value in the cell depth that increased with the increase of cell contact angle. When the cell depth was greater than the limit value, there was almost no change in the amount of transferred liquid and the ink transfer rate decreased as the depth increased. When the cell depth was less than or equal to the limit value, the amount of liquid transferred and the liquid transfer rate were greatly improved, which is called the shallow printing plate effect. In addition, in view of the problem of residual liquid in the shallow printing plate effect, the U-shaped cell was improved by introducing fillets. The study found that the optimization method combining the shallow printing plate effect and the fillet radius can greatly increase the ink transfer rate and solve the problem of plate blocking. Finally, in the parameter combinations studied in this paper, the optimal parameters were α = 30°, β = 75°, cell depth h = 13.6 µm, fillet radius R = 13.6 µm, and ink transfer rate of up to about 85%.
The research in this article can not only promote the application of water-based inks and the improvement of printing process, but also provide a basis for optimizing the shape of U-shaped cell and increasing the ink transfer rate. In addition, the research results of this article provide a very useful reference value for the development of gravure printing in electronic printing, film printing, and other fields. However, in the research of this article, there are still many problems. For example, in gravure printing, high-pressure printing force plays an important role in improving the liquid transfer rate, but it was not realized in the current simulation. In future work, fluid-structure coupling can be used to simulate the effect of imprinting force, so that the simulation results are more suitable for actual printing.

Author Contributions

Methodology, L.D. and J.X.; software, L.D. and J.X.; validation, L.D., J.X. and S.W.; formal analysis, L.D.; investigation, L.D. and J.X.; resources, J.X.; data curation, L.D.; writing—original draft preparation, L.D.; writing—review and editing, L.D., J.X., X.G. and H.Z.; visualization, L.D.; supervision, J.X., L.D. and J.X. contributed equally to this work and should be considered first authors. All authors have read and agreed to the published version of the manuscript.

Funding

This research received no external funding.

Institutional Review Board Statement

Not applicable.

Informed Consent Statement

Not applicable.

Data Availability Statement

Not applicable.

Conflicts of Interest

The authors declare no conflict of interest.

Nomenclature

ParameterDefine
PLICPiecewise Linear Interface Construction
VOFVolume of Fluid
VOCVolatile organic compounds
ε shear rate
τ shear stress
αThe contact angles of the liquid with the upper plate
βThe contact angles of the liquid with the cell wall
hcell depth
StThe thickness of the thinnest part of the liquid filament
HtThe depth of the contact line on the cell wall
BtThe width of the contact line at the bottom of the cell
RThe corner radius of the cell

References

  1. Hansuebsai, A.; Nawakitwong, S. Printability Analysis of Compostable Films by Flexographic Water Based Ink. Key Eng. Mater. 2020, 5925. [Google Scholar] [CrossRef]
  2. Xiaofang, W.; Zhao, L.; Jianming, S. Analysis of the current status and application of environmentally friendly water-based inks. Sci. Technol. Eng. 2017, 17, 167–175. [Google Scholar] [CrossRef]
  3. Gong, Y.; Huang, B.Q.; Wei, X.F. Comprehensive Research into the Influence of Resin on Properties of Environmentally Friendly Water-Based Ink. Appl. Mech. Mater. 2014, 525, 15–22. [Google Scholar] [CrossRef]
  4. Li, W.W.; Li, L.H.; Mo, L.X.; Hu, X.W.; Leng, X.; Fang, H.; Li, W.B.; Li, S.K. Progress of Printing RFID Antenna Using Water-Based Conductive Ink. Adv. Mater. Res. 2012, 380, 137–140. [Google Scholar] [CrossRef]
  5. Xiulan, X.; Yana, W. Research Progress in Water-based Inks. China Print. Packag. Res. 2011, 3, 1–8. [Google Scholar]
  6. Zhou, X.; Li, Y.; Fang, C.; Li, S.; Cheng, Y.; Lei, W.; Meng, X. Recent Advances in Synthesis of Waterborne Polyurethane and Their Application in Water-based Ink: A Review. J. Mater. Sci. Technol. 2015, 31, 708–722. [Google Scholar] [CrossRef]
  7. Sico, G.; Montanino, M.; Prontera, C.T.; Mauro, A.D.G.D.; Minarini, C. Gravure printing for thin film ceramics manufacturing from nanoparticles. Ceram. Int. 2018, 44. [Google Scholar] [CrossRef]
  8. Schfer, J.; Roisman, I.V.; Sauer, H.M.; Drsam, E. Millisecond fluid pattern formation in the nip of a gravure printing machine. Colloids Surf. A Physicochem. Eng. Asp. 2019, 575, 222–229. [Google Scholar] [CrossRef]
  9. Campana, D.M.; Ubal, S.; Giavedoni, M.D.; Saita, F.A.; Carvalho, M.S. Three dimensional flow of liquid transfer between a cavity and a moving roll. Chem. Eng. Sci. 2016, 149, 169–180. [Google Scholar] [CrossRef]
  10. Kim, K.; Nam, T.; Na, Y. A numerical study of the ink transfer process for roll-to-roll printing applications. Proc. Inst. Mech. Eng. Part C J. Mech. Eng. Sci. 2012, 226, 2496–2509. [Google Scholar] [CrossRef]
  11. Kim, Y.Y.; Yang, T.Y.; Suhonen, R.; Välimäki, M.; Maaninen, T.; Kemppainen, A.; Jeon, N.J.; Seo, J. Gravure-Printed Flexible Perovskite Solar Cells: Toward Roll-to-Roll Manufacturing. Adv. Sci. 2019, 6, 1802094. [Google Scholar] [CrossRef] [Green Version]
  12. Pudas, M.; Hagberg, J.; Leppävuori, S. Printing parameters and ink components affecting ultra-fine-line gravure-offset printing for electronics applications. J. Eur. Ceram. Soc. 2004, 24, 2943–2950. [Google Scholar] [CrossRef]
  13. Wu, J.T.; Carvalho, M.S.; Kumar, S. Emptying of Gravure Cavities containing Shear-thinning and Shear-thickening Liquids. J. Non-Newton. Fluid Mech. 2019, 268, 46–55. [Google Scholar] [CrossRef]
  14. Dodds, S.; Carvalho, M.D.S.; Kumar, S. Stretching and slipping of liquid bridges near plates and cavities. Phys. Fluids 2009, 21, 4–366. [Google Scholar] [CrossRef]
  15. Ahmed, D.H.; Sung, H.J.; Kim, D.S. Simulation of non-Newtonian ink transfer between two separating plates for gravure-offset printing. Int. J. Heat Fluid Flow 2011, 32, 298–307. [Google Scholar] [CrossRef]
  16. Khandavalli, S.; Lee, J.A.; Pasquali, M.; Rothstein, J.P. The effect of shear-thickening on liquid transfer from an idealized gravure cell. J. Non-Newton. Fluid Mech. 2015, 221. [Google Scholar] [CrossRef]
  17. Kapur, N.; Hewson, R.; Sleigh, P.A. A review of gravure coating systems (Fundamental coating research). Convert. e-Print 2011, 1, 56–60. [Google Scholar]
  18. Yin, X.; Kumar, S. Flow visualization studies in scaled-up gravure grooves and cells. In Proceedings of the APS Division of Fluid Dynamics Meeting Abstracts, East Rutherford, NJ, USA, 23–25 November 2003. [Google Scholar]
  19. Chuang, H.K.; Lee, C.C.; Liu, T.J. An Experimental Study on the Pickout of Scaled-up Gravure Cells. Int. Polym. Process. J. Polym. Process. Soc. 2013, 23, 216–222. [Google Scholar] [CrossRef]
  20. Davarpanah, A.; Zarei, M.; Valizadeh, K.; Mirshekari, B. CFD design and simulation of ethylene dichloride (EDC) thermal cracking reactor. Energy Sour. Part A Recovery Util. Environ. Effects 2019, 41, 1573–1587. [Google Scholar] [CrossRef]
  21. Daryayehsalameh, B.; Nabavi, M.; Vaferi, B. Modeling of CO2 capture ability of [Bmim][BF4] ionic liquid using connectionist smart paradigms. Environ. Technol. Innov. 2021, 22, 101484. [Google Scholar] [CrossRef]
  22. Hsu, T.W.; Hsieh, C.M.; Tsai, C.Y.; Ou, S.H. Coupling VOF/PLIC and Embedding Method for Simulating Wave Breaking on a Sloping Beach. J. Mar. Sci. Technol. 2015, 23, 498–507. [Google Scholar] [CrossRef]
  23. Valizadeh, K.; Farahbakhsh, S.; Bateni, A.; Zargarian, A.; Zarei, M. A parametric study to simulate the non-Newtonian turbulent flow in spiral tubes. Energy Sci. Eng. 2019, 8, 134–149. [Google Scholar] [CrossRef] [Green Version]
  24. Wu, J.T.; Francis, L.F.; Carvalho, M.S.; Kumar, S. Cavity filling with shear-thinning liquids. Phys. Rev. Fluids 2020, 5, 054003. [Google Scholar] [CrossRef]
  25. Lee, J.A.; Rothstein, J.P.; Pasquali, M. Computational study of viscoelastic effects on liquid transfer during gravure printing. J. Non-Newton. Fluid Mech. 2013, 199, 1–11. [Google Scholar] [CrossRef]
  26. Zhang, X. Dynamics of drop formation in viscous flows. Chem. Eng. Sci. 1999, 26, 1759–1774. [Google Scholar] [CrossRef]
  27. Powell, C.A.; Guthrie, J.T. Computational simulation of the printing of Newtonian liquid from a trapezoidal cavity. Int. J. Numer. Methods Heat Fluid Flow 2002, 12, 338–355. [Google Scholar] [CrossRef]
  28. Hirt, C.W.; Nichols, B.D. Volume of fluid (VOF) method for the dynamics of free boundaries. J. Comput. Phys. 1981, 39, 201–225. [Google Scholar] [CrossRef]
  29. Dezhi, D.; Tong, A.Y. An analytical interface reconstruction algorithm in PLIC-VOF method for 2D polygonal unstructured meshes. Int. J. Numer. Methods Fluids 2018. [Google Scholar] [CrossRef]
  30. Özkan, F.; Wenka, A.; Hansjosten, E.; Pfeifer, P.; Kraushaar-Czarnetzki, B. Numerical investigation of interfacial mass transfer in two phase flows using the VOF method. Eng. Appl. Comput. Fluid Mech. 2015, 10, 100–110. [Google Scholar] [CrossRef]
  31. Phan, H.N.; Lee, J.H. Flood Impact Pressure Analysis of Vertical Wall Structures using PLIC-VOF Method with Lagrangian Advection Algorithm. J. Comput. Struct. Eng. Inst. Korea 2010, 23, 675–682. [Google Scholar]
  32. Huang, W.X.; Lee, S.H.; Sung, H.J.; Lee, T.M.; Kim, D.S. Simulation of liquid transfer between separating walls for modeling micro-gravure-offset printing. China Print. Packag. Study 2008, 29, 1436–1446. [Google Scholar] [CrossRef]
  33. Ghadiri, F.; Ahmed, D.H.; Sung, H.J.; Shirani, E. Non-Newtonian ink transfer in gravure–offset printing. Int. J. Heat Fluid Flow 2011, 32, 308–317. [Google Scholar] [CrossRef]
  34. Chen, W.; Lai, W.; Wang, Y.; Wang, K.; Lin, S.; Yen, Y.; Hocheng, H.; Chou, T. Ultrafast Laser Engraving Method to Fabricate Gravure Plate for Printed Metal-Mesh Touch Panel. Micromachines 2015, 6, 1483–1489. [Google Scholar] [CrossRef] [Green Version]
  35. Hennig, G.; Selbmann, K.H.; Brockelt, A. Laser Engraving in Gravure Industry. In Workshop on Laser Applications in Europe; Gries, W., Pearsall, T.P., Eds.; SPIE: Bellingham, WA, USA, 2006; Volume 6157. [Google Scholar]
  36. Wu, S.; Xing, J.; Dong, L.; Zhu, H. Multi-Objective Optimization of Microstructure of Gravure Cell Based on Response Surface Method. Processes 2021, 9, 403. [Google Scholar] [CrossRef]
  37. Galindo-Rosales, F.J.; Rubio-Hernández, F.; Velázquez-Navarro, J. Shear-thickening behavior of Aerosil® R816 nanoparticles suspensions in polar organic liquids. Rheol. Acta 2009, 48, 699–708. [Google Scholar] [CrossRef]
  38. Wagner, N.J.; Russel, W.B. Nonequilibrium statistical mechanics of concentrated colloidal dispersions: Hard spheres in weak flows with many-body thermodynamic interactions. Phys. A Stat. Mech. Appl. 1989, 155, 475–518. [Google Scholar] [CrossRef]
  39. Manica, R.; Bortoli, A. Simulation of sudden expansion flows for power-law fluids. J. Non-Newton. Fluid Mech. 2004, 121, 35–40. [Google Scholar] [CrossRef]
  40. Hajmohammadi, M.R.; Nourazar, S.S.; Campo, A. Analytical solution for two-phase flow between two rotating cylinders filled with power law liquid and a micro layer of gas. J. Mech. Sci. Technol. 2014, 28, 1849–1854. [Google Scholar] [CrossRef]
  41. Galindo-Rosales, F.J.; Rubio-Hernández, F.J.; Sevilla, A. An apparent viscosity function for shear thickening fluids. J. Non-Newton. Fluid Mech. 2011, 166, 321–325. [Google Scholar] [CrossRef]
  42. Hizir, F.E.; Hardt, D.E. Phase-field modeling of liquids splitting between separating surfaces and its application to high-resolution roll-based printing technologies. Phys. Fluids 2017, 29, 052007. [Google Scholar] [CrossRef] [Green Version]
  43. Grüßer, M.; Waugh, D.G.; Lawrence, J.; Langer, N.; Scholz, D. On the Droplet Size and Application of Wettability Analysis for the Development of Ink and Printing Substrates. Langmuir 2019, 35, 12356–12365. [Google Scholar] [CrossRef] [PubMed]
  44. Popelka, A.; Khanam, P.N.; AlMaadeed, M.A. Surface modification of polyethylene/graphene composite using corona discharge. J. Phys. D Appl. Phys. 2018, 51, 105302. [Google Scholar] [CrossRef]
  45. Rocca-Smith, J.R.; Karbowiak, T.; Marcuzzo, E.; Sensidoni, A.; Piasente, F.; Champion, D.; Heinz, O.; Vitry, P.; Bourillot, E.; Lesniewska, E.; et al. Impact of corona treatment on PLA film properties. Polym. Degrad. Stab. 2016, 132, 109–116. [Google Scholar] [CrossRef]
  46. Chun, J.; Wang, J.-X.; Xu, C.; Wen, R.-F.; Lan, Z.; Ma, X.-H. Theoretical model of maximum spreading diameter on superhydrophilic surfaces. Acta Phys. Sin. 2021. [Google Scholar] [CrossRef]
  47. Kang, H.W.; Sung, H.J.; Lee, T.-M.; Kim, D.-S.; Kim, C.-J. Liquid transfer between two separating plates for micro-gravure-offset printing. J. Micromech. Microeng. 2008, 19, 015025. [Google Scholar] [CrossRef] [Green Version]
Figure 1. Schematic diagram of gravure printing process.
Processes 09 00838 g001
Figure 2. Change of shear stress with shear rate.
Processes 09 00838 g002
Figure 3. Schematic diagram of simulation model. (a) Normal U-shaped cell structure. (b) Optimized U-shaped cell structure. (c) Computational grid before cell optimization. (d) Computational grid after cell optimization.
Processes 09 00838 g003
Figure 4. Instantaneous contour of strain rate and contact line under (a) α = 30°; (b) α = 45°; (c) α = 60° (The red line in figure represents the contact line).
Processes 09 00838 g004aProcesses 09 00838 g004b
Figure 5. The change trend of (a) the thickness of the thinnest part of the liquid filament and (b) the width of the contact line on the upper plate with time.
Processes 09 00838 g005
Figure 6. Change of liquid transfer rate with contact angle of upper plate.
Processes 09 00838 g006
Figure 7. Evolution of contact line under different cell contact angles (α = 30°).
Processes 09 00838 g007
Figure 8. The change trend of (a) the thickness of the thinnest part of the liquid filament and (b) the depth of the contact line on the side wall of the cell with time.
Processes 09 00838 g008
Figure 9. Change of liquid transfer rate with contact angle of cell.
Processes 09 00838 g009
Figure 10. The change trend of (a) the mass of liquid removed and (b) the transfer rate with cell depth (α = 30°).
Processes 09 00838 g010
Figure 11. Volume fraction diagram of fluid transfer process. (a) α = 30°, β = 45°, and h = 11.2 μm; (b) α = 30°, β = 60°, and h = 12 μm; (c) α = 30°, β = 75°, and h = 13.6 μm.
Processes 09 00838 g011aProcesses 09 00838 g011b
Figure 12. The relationship between the fillet radius and mass of residual liquid.
Processes 09 00838 g012
Figure 13. Volume fraction diagram of fluid transfer process when α = 30°, β = 60°, h = 12 μm, and t = 30 μs.
Processes 09 00838 g013
Figure 14. (a) The thickness of the thinnest part of the liquid filament and the width of the contact line on the bottom of the cell (α = 30°, β = 60°, h = 12 μm); (b) the transfer rate with the fillet radius under different β.
Processes 09 00838 g014
Table 1. Fluid properties’ parameters.
ParametersDate
Liquid density1000 kg m−3
Liquid surface tension1 N m−1
Initial liquid viscosity0.08 Pa·s
Air density1.22 kg m−3
Air viscosity1.8 × 10−5 Pa·s
Table 2. Cell geometry parameters.
ParametersDate
Cell open width, a80 μm
Cell depth, h40 μm
Initial distance between cell and upper plate, c08 μm
Upper plate move speed, uw1 m/s
Calculation time step2 × 10−8 s
Table 3. The critical value of cell depth under different cell contact angles and the remaining cell volume under the combination of the two.
The Cell Contact Angle, β (°)The Cell Depth, h (μm)Mass of Residual Liquid, (10−6 μg)
4511.271.4482
601261.6148
7513.646.6314
Publisher’s Note: MDPI stays neutral with regard to jurisdictional claims in published maps and institutional affiliations.

